Ronnie Semo Tom Karmel - National Centre for … · Social capital and youth transitions: do young...
40
Social capital and youth transitions: do young people’s networks improve their participation in education and training? Ronnie Semo Tom Karmel NATIONAL CENTRE FOR VOCATIONAL EDUCATION RESEARCH NATIONAL CENTRE FOR VOCATIONAL EDUCATION RESEARCH OCCASIONAL PAPER
Transcript of Ronnie Semo Tom Karmel - National Centre for … · Social capital and youth transitions: do young...

Social capital and youth transitions: do young people’s networks improve
their participation in education and training?
Ronnie SemoTom Karmel
NATIONAL CENTRE FOR VOCATIONAL EDUCATION RESEARCH
NATIONAL CENTRE FOR VOCATIONAL EDUCATION RESEARCH OCCASIONAL PAPER


Social capital and youth transitions: do young people’s networks improve their participation in education and training?
Ronnie Semo Tom Karmel National Centre for Vocational Education Research
The views and opinions expressed in this document are those of the author/
project team and do not necessarily reflect the views of the Australian Government
or state and territory governments.
NATIONAL CENTRE FOR VOCATIONAL EDUCATION RESEARCH OCCASIONAL PAPER

Publisher’s note
To find other material of interest, search VOCEDplus (the UNESCO/NCVER international
database <http://www.voced.edu.au>) using the following keywords: disadvantaged;
equity; gender; outcomes of education and training; participation; social capital;
socioeconomic background; student teacher relationship; youth.
With the exception of cover design, artwork, photographs, all logos, and any other material where
copyright is owned by a third party, all material presented in this document is provided under a
Creative Commons Attribution 3.0 Australia <http://creativecommons.org/licenses/by/3.0/au>.
However, you must attribute the National Centre for Vocational Education Research (NCVER) as the
copyright holder of the work.
This document should be attributed as Semo, R & Karmel, T 2011, Social capital and youth transitions:
do young people’s networks improve their participation in education and training?, NCVER.
NCVER is an independent body responsible for collecting, managing and analysing, evaluating and
communicating research and statistics about vocational education and training (VET).
NCVER’s inhouse research and evaluation program undertakes projects which are strategic to the VET
sector. These projects are developed and conducted by NCVER’s research staff and are funded by
NCVER. This research aims to improve policy and practice in the VET sector.
ISBN 978 1 921955 21 1 web edition
978 1 921955 22 8 print edition
TD/TNC 104.22
Published by NCVER, ABN 87 007 967 311
Level 11, 33 King William Street, Adelaide SA 5000
PO Box 8288 Station Arcade, Adelaide SA 5000, Australia
P +61 8 8230 8400 F +61 8 8212 3436 E [email protected] W http://www.ncver.edu.au

About the research Social capital and young people: do young people’s networks improve their participation in education and training?
Ronnie Semo and Tom Karmel, NCVER
Key messages
In recent times social capital has received considerable attention because it is seen as having the
potential to address many of the problems facing modern society, including the poor educational
outcomes of considerable numbers of young people.
This paper uses data from the Longitudinal Surveys of Australian Youth (LSAY) to explore the
relationship between social capital at age 15 and participation in education and training at age
17. The issue is whether social capital is yet another factor which advantages the already
advantaged, or whether social capital operates separately from family background.
Social capital influences educational participation over and above the effects of background
characteristics such as parents’ education levels, parental occupation, geographic location,
cultural background, school sector and academic achievement.
For both males and females, participation in a diverse range of activities has the greatest
influence on participation in education and training, followed by the strength of the
relationship students have with their teachers. Increasing rates of participation in sport also
increase educational participation for females.
The authors note that, if anything, the findings underestimate the net effects of social capital
because the results cannot fully account for the accumulation of social capital prior to the
age of 15.
The finding that social capital matters for school education is a very positive one. It implies that
activities that promote and encourage engagement at school can go some way to redressing
economic and social disadvantage.
Tom Karmel
Managing Director, NCVER


NCVER 5
Contents Tables and figures 6
Introduction 7
Social capital constructs 9 A short review of the literature 9 Measuring social capital 10 Measuring social capital using LSAY 12
Analysis 15 The LSAY 2003 cohort at age 17 15 Survey attrition 17 Modelling educational participation using social capital 18 Multivariate logistic regression modelling 19 Social capital and academic orientation 22
Conclusion 24
References 25
Appendices
A: Factor analysis 27 B: Distribution of social capital 29 C: Logistic regression (1) 32 D: Logistic regression (2) 33 E: Distribution of social capital by academic orientation 35

6 Social capital and youth transitions
Tables and figures Tables 1 Social capital-related questions, LSAY 2003 cohort, wave 1 (2003) 13
2 Characteristics of the LSAY 2003 cohort at age 17, 2005 16
3 Summary statistics for student achievement scores1, LSAY 2003 cohort
at age 17, 2005 16
4 LSAY 2003 respondents by social capital factor score quartile
(unweighted), 2003 and 2005 18
5 Logistic regression results for males and females, LSAY 2003 cohort 20
6 Probability of participating in education and training at 17 years by
level of social capital at 15 years, LSAY 2003 cohort 21
7 Pearson correlation coefficients of academic orientation scores with
social capital factor scores 23
A1 Rotated factor pattern 27
A2 Eigenvalues of the correlation matrix 28
D1 Logistic regression results for modelling academic orientation for males
and females, LSAY 2003 cohort 34
Figures 1 ABS framework for measuring social capital 11
2 Australian Institute for Family Studies conceptual framework for
measuring social capital 12
B1 Distribution of school connectedness (factor 1 scores) 29
B2 Distribution of student-teacher relations (factor 2 scores) 29
B3 Distribution of peer influences (factor 3 scores) 30
B4 Distribution of participation in activities (factor 4 scores) 30
B5 Distribution of participation in sport (factor 1 scores) 31
E1 Student—teacher relations (factor 2 scores) by low and high academic
orientation, males 35
E2 Participation in activities (factor 4 scores) by low and high academic
orientation, males 35
E3 Student—teacher relations (factor 2 scores) by low and high academic
orientation, females 36
E4 Participation in activities (factor 4 scores) by low and high academic
orientation, females 36
E5 Participation in sport (factor 5 scores) by low and high academic
orientation, females 37

NCVER 7
Introduction Social capital refers to the attributes and qualities of the family, social and community networks that
facilitate cooperation between individuals and communities. The quality of and extent to which
individuals are engaged with these networks are likely to impact on the educational and social
development of children and youth. It can be argued that network associations and influences can
increase educational engagement, achievement and participation over and above the influences of
family background, school type and geographical location.
In terms of participation in education and training, certain themes emerge with a clear connection to
social capital constructs. The literature to date emphasises the importance of school networks in
increasing levels of student engagement. Studies show that students with positive attitudes towards
their school have higher educational aspirations and a corresponding increase in educational
participation (Fullarton 2002; Khoo & Ainley 2005; Thomson & Hillman 2010). Teachers are also found
to influence student engagement by acting as role models and raising aspirations (Banks 2010). There
is also a positive relationship between participation in extracurricular activities and educational
outcomes (OECD 2001; Fullarton 2002; Edwards 2004; Halpern 2005; Khoo & Ainley 2005). Studies show
that informal networks, such as friends and relatives, play an important part in influencing young
people (Dockery & Strathdee 2003). In addition to social capital sourced from the home and family,
friendships and community participation help to build an individual’s social capital (Halpern 2005).
This paper explores the links between participation in education and training and social capital. It
uses data from the Longitudinal Surveys of Australian Youth (LSAY), which are particularly useful for a
number of reasons. The first is that the longitudinal nature of the data allows us to examine the
effects of particular characteristics on future outcomes. Second, LSAY provides a broad range of
variables with clear linkages to social capital constructs. And, finally, the dataset contains a useful
range of background characteristics, enabling us to control for background effects. Thus we can make
use of the LSAY data to establish whether higher levels of social capital increase the likelihood of
participation in education and training, over and above the effects of background characteristics such
as Indigenous status, parental education and school sector. We investigate the relationship between
the social capital measured at the first survey wave (when respondents were on average 15 years old)
and participation in study or training on a full-time basis (either at school or in a post-school
qualification) in the year following compulsory education, that is, when respondents were, on
average, 17 years old. The period between measurement of social capital (at age 15) and outcomes
(at age 17) strengthens our ability to infer a causal relationship.
The paper is divided into four sections. The first section, ‘Social capital constructs’, begins with a
brief discussion of the existing literature, which is followed by an overview of the two social capital
frameworks most prominent in the literature. Using these frameworks, the following section, ‘The
LSAY data and social capital’, identifies items from LSAY which can be used to measure the social
capital constructs discussed. A factor analysis is then conducted to group together LSAY data items
that reflect these social capital constructs, thus obtaining a discrete series of social capital factors for
use in the following section, ‘Modelling educational participation using social capital’. Here
multivariate models are used to explore the relationships that exist between the social capital factors
and educational participation. The final section provides some discussion of the results.
We find that social capital does increase rates of participation in education and training, over and
above the influences of family background, school type and geographical location. We were able to

8 Social capital and youth transitions
obtain five discrete social capital factors: student connectedness with school; student—teacher
relations; the influence of networks when thinking about the future; participation in school-based
activities; and participation in sport. With the exception of network influences, we found that the
remaining four factors all play some role in increasing participation in education and training.
The most important of these were participation in school-based activities and the relationship
students have with their teachers. For females, higher rates of participation in sport were also found
to result in higher rates of educational participation. And for males, school connectedness also helped
to raise participation in education and training.
The main point of this analysis is that the effects are additional to background characteristics such as
socioeconomic status. The implication is that one way of addressing disadvantage is by promoting
elements of social capital — by ensuring that students relate to their teachers and participate in
school activities and sport. In relation to this point, we note that our findings necessarily
underestimate the net effects of social capital, given that earlier levels of social capital are not
accounted for but are likely to feed into a young person’s stock of social capital.

NCVER 9
Social capital constructs A short review of the literature
The first authors to systematically develop social capital theory were Pierre Bourdieu, James Coleman
and Robert Putnam (Biddle et al. 2009). Bourdieu’s (1986) work focused on social class and the
opportunities that social connections provided as a means of obtaining access to economic and
cultural resources. Coleman (1988), using data from the United States, viewed communities and
families as repositories of social capital and established the importance of these networks in fostering
academic success. Putnam's (1993) study of social capital and democratic institutions in Italy viewed
social capital as the trust, norms and networks that operate within communities and which promote
cooperation among its members, thereby leading to effective democracy.
The concept of social capital is far-ranging and, as a result, so is the literature. In terms of
educational participation and training, however, there are certain themes that emerge with a clear
connection to these social capital constructs.
Coleman’s work on social capital emphasised the role of strong communities and ties among
parents, educators and pupils in fostering learning (OECD 2001). Coleman suggests that parents play
a primary role in promoting the status attainment of their children (cited in Perna & Titus 2005).
Numerous subsequent studies show that higher levels of parental involvement in a child’s education
at home support better educational outcomes, promote positive attitudes and elevate aspirations
(Halpern 2005).
The strength of the community networks that link parents, students and schools is found to increase
retention rates and attainment levels, even when controlling for other background factors such as
parental education and income (Winter 2000; Productivity Commission 2003; Halpern 2005; Bexley
2007). Community networks are important determinants of learning outcomes and can be used to help
overcome disadvantage (OECD 2001; Fullarton 2002). Positive community networks can play a role in
explaining why some people from disadvantaged groups can achieve educational success, while others
who lack these support networks are more likely to fail (Holland 2009).
The importance of school networks in raising educational outcomes is well documented. Fullarton
(2002) found that the school environment (as measured by a positive school climate, high-quality
teachers and effective discipline) increases levels of student engagement. Khoo and Ainley (2005)
show that students with positive attitudes towards their school (measured by students’ general
satisfaction with school, and their motivation, attitudes to their teachers, views on school provision of
opportunities, and sense of achievement) have higher educational intentions and aspirations and a
corresponding increase in education and training participation. Teachers influence student engagement
by acting as role models, raising aspirations, influencing career goals and choices (Banks 2010).
Building networks through community participation, including social and leisure activities, is also
important in achieving wellbeing and educational outcomes (Edwards 2004). Participation in
extracurricular activities has also been found to have a positive effect on educational and social
outcomes (OECD 2001; Fullarton 2002; Edwards 2004; Halpern 2005; Khoo & Ainley 2005). Fullarton
(2002) shows that students who participate in extracurricular activities have higher levels of school
engagement, with subsequent effects on academic achievement, while Khoo and Ainley (2005) show

10 Social capital and youth transitions
that participation in extracurricular activities is likely to raise educational aspirations and
participation in education.
Friendships and participation in community activities have been found to overcome the reliance on
parental social capital and encourage the accumulation of social capital specific to the individual
(Halpern 2005). The influence of informal networks, such as friends and relatives, is shown to play a
part in the outcomes of young people, particularly males. Other studies that look at how young
people use their informal networks to obtain employment have argued that informal networks play an
important part in the job-finding methods of young males (Dockery & Strathdee 2003).
But social capital can also have negative effects. High levels of certain types of social capital can be a
constraint, particularly among disadvantaged communities. Citizens can often be tied to family and
community, making it difficult to move ahead of their current situation (Holland 2009). Some social
networks can also create obstacles for young people. For example, youth can be connected to deviant
social networks, or ‘gangs’, where they share knowledge and skills about street crime (Halpern 2005).
In such socially debilitating networks, criminal behaviour might be considered acceptable, or even
expected.
The effects of mobility on educational outcomes and its relationship to social capital are also
discussed in the literature. High levels of mobility can sever network ties and disrupt family
connections and thereby reduce a family’s stock of social capital (Halpern 2005), with subsequent
effects on educational retention. By contrast, mobility has the capacity to facilitate the formation of
new ties and relationships (Edwards 2004), thus expanding and increasing those opportunities with the
potential to influence student choices.
Measuring social capital
Social capital is a multi-dimensional concept, since different types of relationships and norms operate
across different network types (Stone & Hughes 2002). So a range of measures are required to capture
different elements of social capital. To identify data items that reflect social capital constructs, we
draw on two prominent frameworks for measuring social capital: the Australian Bureau of Statistics
(ABS) framework (Edwards 2004) and the Australian Institute for Family Studies (AIFS) conceptual
framework (Stone & Hughes 2002).
The ABS framework for measuring social capital (figure 1) is centred around networks composed of
family, friends and acquaintances, neighbours, colleagues, organisations and groups, and people in
general (for example, strangers) or acquaintances. It distinguishes between four network attributes:
qualities, structure, transactions and broad network types. Network qualities identifies behavioural
norms and values that improve how networks function, such as trust and reciprocity. Network
structure includes information about the size of the network, frequency of communication within the
network and how dense or open the network is. Network transactions are the interactions that occur
within networks and between organisations, including the provision of financial or emotional support
and sharing knowledge. Network types overlaps with other framework attributes and differentiates
between bonding, bridging and linking social capital. Bonding social capital refers to relationships
between similar groups of people, while those with less in common are identified as having bridging
social capital. Linking social capital is described as the ‘vertical’ relationships with those in authority
needed to access financial resources or power.

NCVER 11
Figure 1 ABS framework for measuring social capital
Source: Edwards (2004).
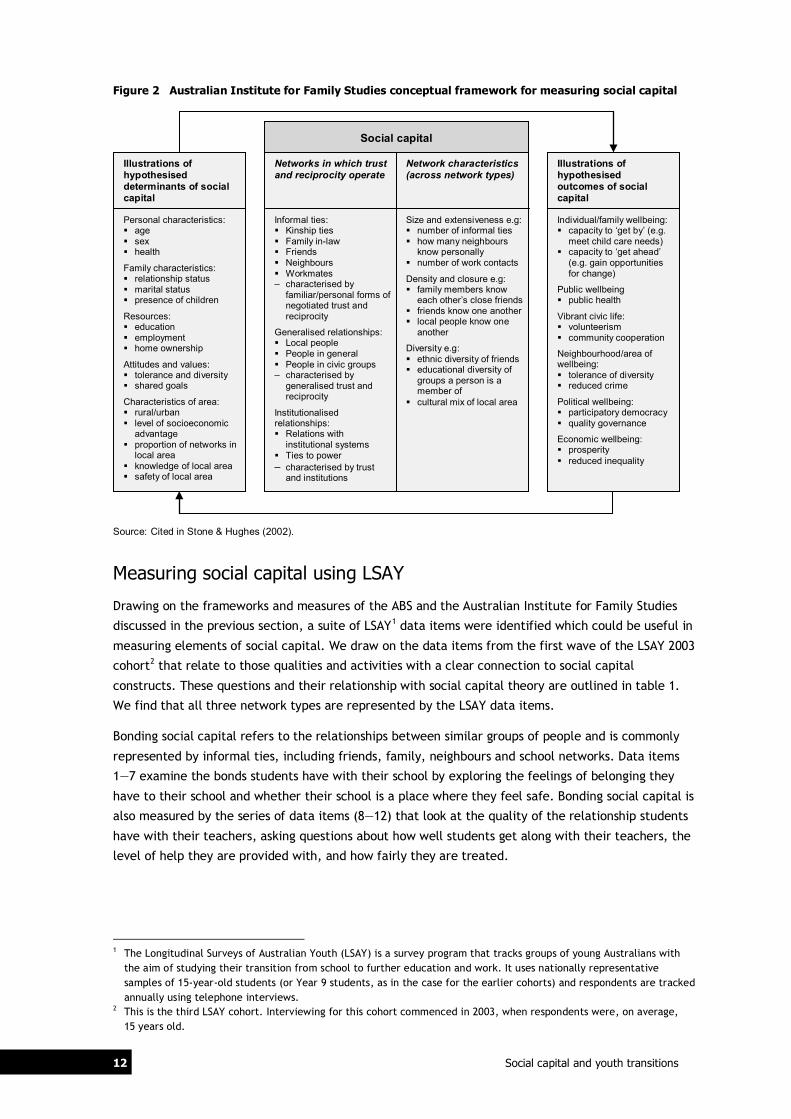
The Australian Institute for Family Studies’ conceptual framework for measuring social capital
(figure 2) identifies three discrete network types: informal (friends, family, neighbours); general
(strangers, civic groups); and institutional (legal system, the church, police, media, government).
Informal, general and institutional networks are broadly characterised as ‘bonding’, ‘bridging’, and
‘linking’ ties, respectively. Each network type has a series of structural network characteristics which
include network size, network density (that is, how network(s) may overlap) and network diversity.
12 Social capital and youth transitions
Figure 2 Australian Institute for Family Studies conceptual framework for measuring social capital
Source: Cited in Stone & Hughes (2002).
Measuring social capital using LSAY
Drawing on the frameworks and measures of the ABS and the Australian Institute for Family Studies
discussed in the previous section, a suite of LSAY1 data items were identified which could be useful in
measuring elements of social capital. We draw on the data items from the first wave of the LSAY 2003
cohort2
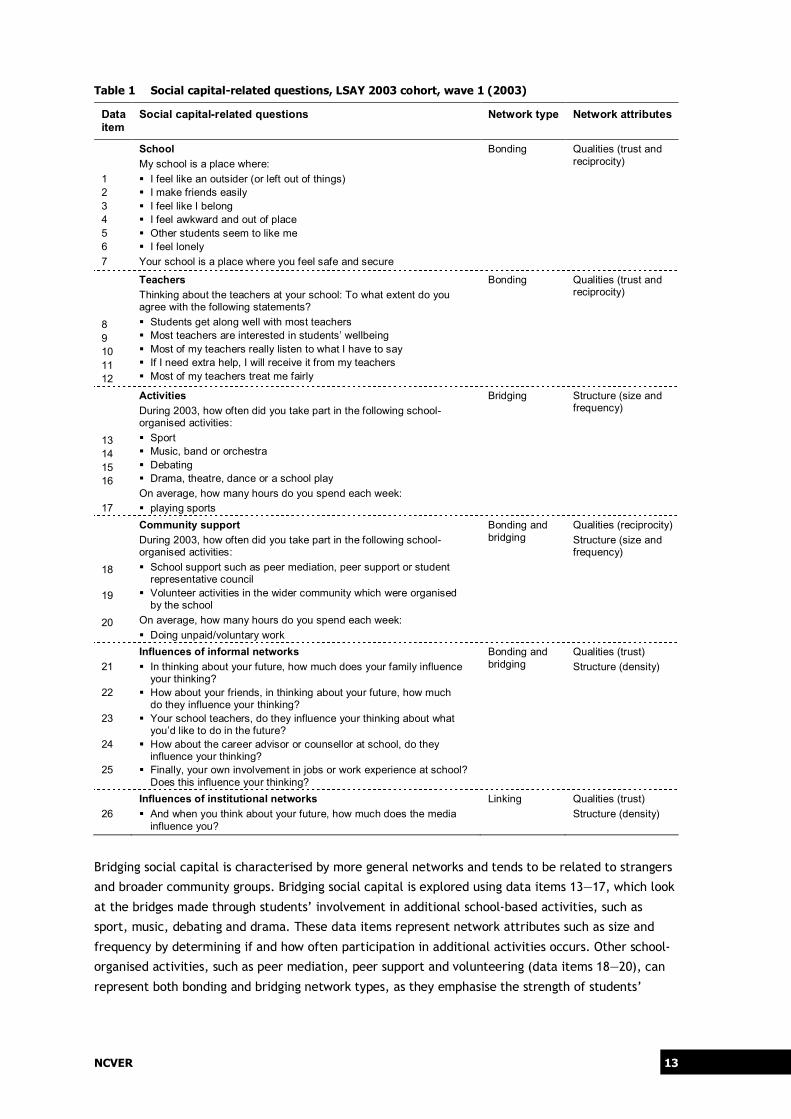
Bonding social capital refers to the relationships between similar groups of people and is commonly
represented by informal ties, including friends, family, neighbours and school networks. Data items
1—7 examine the bonds students have with their school by exploring the feelings of belonging they
have to their school and whether their school is a place where they feel safe. Bonding social capital is
also measured by the series of data items (8—12) that look at the quality of the relationship students
have with their teachers, asking questions about how well students get along with their teachers, the
level of help they are provided with, and how fairly they are treated.
that relate to those qualities and activities with a clear connection to social capital
constructs. These questions and their relationship with social capital theory are outlined in table 1.
We find that all three network types are represented by the LSAY data items.
1 The Longitudinal Surveys of Australian Youth (LSAY) is a survey program that tracks groups of young Australians with
the aim of studying their transition from school to further education and work. It uses nationally representative samples of 15-year-old students (or Year 9 students, as in the case for the earlier cohorts) and respondents are tracked annually using telephone interviews.
2 This is the third LSAY cohort. Interviewing for this cohort commenced in 2003, when respondents were, on average, 15 years old.
Social capital
Illustrations of hypothesised determinants of social capital
Personal characteristics: age sex health
Family characteristics: relationship status marital status presence of children
Resources: education employment home ownership
Attitudes and values: tolerance and diversity shared goals
Characteristics of area: rural/urban level of socioeconomic
advantage proportion of networks in
local area knowledge of local area safety of local area
Networks in which trust and reciprocity operate
Informal ties: Kinship ties Family in-law Friends Neighbours Workmates – characterised by
familiar/personal forms of negotiated trust and reciprocity
Generalised relationships: Local people People in general People in civic groups – characterised by
generalised trust and reciprocity
Institutionalised relationships: Relations with
institutional systems Ties to power – characterised by trust
and institutions
Network characteristics (across network types)
Size and extensiveness e.g: number of informal ties how many neighbours
know personally number of work contacts
Density and closure e.g: family members know
each other’s close friends friends know one another local people know one
another
Diversity e.g: ethnic diversity of friends educational diversity of
groups a person is a member of
cultural mix of local area
Illustrations of hypothesised outcomes of social capital
Individual/family wellbeing: capacity to ‘get by’ (e.g.
meet child care needs) capacity to ‘get ahead’
(e.g. gain opportunities for change)
Public wellbeing public health
Vibrant civic life: volunteerism community cooperation
Neighbourhood/area of wellbeing: tolerance of diversity reduced crime
Political wellbeing: participatory democracy quality governance
Economic wellbeing: prosperity reduced inequality
NCVER 13
Table 1 Social capital-related questions, LSAY 2003 cohort, wave 1 (2003)
Data item
Social capital-related questions Network type Network attributes
1 2 3 4 5 6 7
School My school is a place where: I feel like an outsider (or left out of things) I make friends easily I feel like I belong I feel awkward and out of place Other students seem to like me I feel lonely Your school is a place where you feel safe and secure
Bonding Qualities (trust and reciprocity)
8 9 10 11 12
Teachers Thinking about the teachers at your school: To what extent do you agree with the following statements? Students get along well with most teachers Most teachers are interested in students’ wellbeing Most of my teachers really listen to what I have to say If I need extra help, I will receive it from my teachers Most of my teachers treat me fairly
Bonding Qualities (trust and reciprocity)
13 14 15 16 17
Activities During 2003, how often did you take part in the following school-organised activities: Sport Music, band or orchestra Debating Drama, theatre, dance or a school play On average, how many hours do you spend each week: playing sports
Bridging Structure (size and frequency)
18 19 20
Community support During 2003, how often did you take part in the following school-organised activities: School support such as peer mediation, peer support or student
representative council Volunteer activities in the wider community which were organised
by the school On average, how many hours do you spend each week: Doing unpaid/voluntary work
Bonding and bridging
Qualities (reciprocity) Structure (size and frequency)
21 22 23 24 25
Influences of informal networks In thinking about your future, how much does your family influence
your thinking? How about your friends, in thinking about your future, how much
do they influence your thinking? Your school teachers, do they influence your thinking about what
you’d like to do in the future? How about the career advisor or counsellor at school, do they
influence your thinking? Finally, your own involvement in jobs or work experience at school?
Does this influence your thinking?
Bonding and bridging
Qualities (trust) Structure (density)
26
Influences of institutional networks And when you think about your future, how much does the media
influence you?
Linking Qualities (trust) Structure (density)
Bridging social capital is characterised by more general networks and tends to be related to strangers
and broader community groups. Bridging social capital is explored using data items 13—17, which look
at the bridges made through students’ involvement in additional school-based activities, such as
sport, music, debating and drama. These data items represent network attributes such as size and
frequency by determining if and how often participation in additional activities occurs. Other school-
organised activities, such as peer mediation, peer support and volunteering (data items 18—20), can
represent both bonding and bridging network types, as they emphasise the strength of students’

14 Social capital and youth transitions
bonds to their peers, although these can also help to establish broader, more general networks. Peer
support and volunteering activities clearly represent network qualities of trust and reciprocity.
Bonding and bridging social capital are further represented by data items 21—5, which look at
whether students are influenced by their networks when thinking about their future. Bonding social
capital is represented by informal networks such as friends and family, while bridging social capital is
represented by broader networks, such as careers advisors and work experience. The influence of the
media when thinking about the future (data item 26) reflects ‘linking’ social capital, as it examines
aspects of the relationship with an institutional network. This suite of data items illustrates the level
of trust students have with their networks and also indicate the density of their networks — students
influenced by their networks are likely to represent a dense network structure by having strong
linkages and showing high levels of cooperation with those within the network.
Rather than attempting to analyse each of the 26 social capital items and their relationship with
participation at age 17 separately, we group together the items that measure the same underlying
social capital construct. We do this by conducting a factor analysis. A variety of response options and
formats were available for each series of questions, so responses were recoded from the original
categories into a seven-point scale, where one indicated a low incidence of social capital and seven
indicated a high incidence of social capital.
The factor analysis in appendix A shows the correlations between the variables and the resulting
factors. Five discrete factors were obtained from the analysis: student connectedness with school;
student—teacher relations; influence of networks when thinking about the future; participation in
school-based activities; and participation in sport.
The selection of the factors was based on two criteria: the ‘latent root criterion’ and the ‘percentage
of variance criterion’. The latent root criterion is the most commonly used technique in determining
the number of factors to retain. This criterion suggests that only factors having latent roots
(eigenvalues) greater than one are considered significant, and all factors with latent roots less than
one are considered insignificant and disregarded (Hair, Anderson & Tatham 1984). The ‘percentage of
variance criterion’ suggests that factors should continue to be retained until the extracted factors
account for at least 95 per cent of the variance, or the last factor accounts for only a small portion,
that is, less than five per cent (Hair, Anderson & Tatham 1984).
Examining the eigenvalues of the correlation matrix and using the latent root criterion, it appears
that our factor analysis would retain six factors, as the first six factors generated display eigenvalues
greater than one. However, on considering the percentage of variance criterion, it is evident that
only the first four factors are able to add to the amount of variance explained by more than five per
cent. By the fifth factor, the amount of variance explained has dropped to below five per cent. We
also considered the fifth factor, as it is evident that the underlying questions relate to participation in
sport. Given that the literature on social capital suggests that sport contributes to the creation and
development of social capital, this factor was also retained.

NCVER 15
Analysis The LSAY 2003 cohort at age 17
This analysis examines the influence of social capital on full-time participation in education and
training at age 17. This age (rather than later ages) is used, in part because it broadly represents the
first year following compulsory education. In 2005, when the respondent’s average age was 17, the
legal school leaving age was either 15 or 16 (depending on the state or territory in which the
respondent resided).3
We also note that social capital is likely to change throughout a person’s lifetime, and higher levels of
social capital evidenced at early stages are likely to help in increasing social capital in the future. In
this study, the earliest measures of social capital are available at the first wave of surveying, when
respondents are aged 15 years. The cumulative effects of social capital are likely to increase at later
ages (that is, at 18 or 19) and participation rates are likely to be a reflection of other unobservable
effects, including changing levels of social capital. Measuring participation at age 17 therefore
minimises these cumulative effects, and is more likely to represent the effects of social capital than
if participation were measured at later ages.
Measuring participation at any age prior to 17 years would not provide much
insight, given that participation at this age was, broadly speaking, compulsory.
There were 10 370 respondents who undertook the initial LSAY 2003 telephone interviews when they
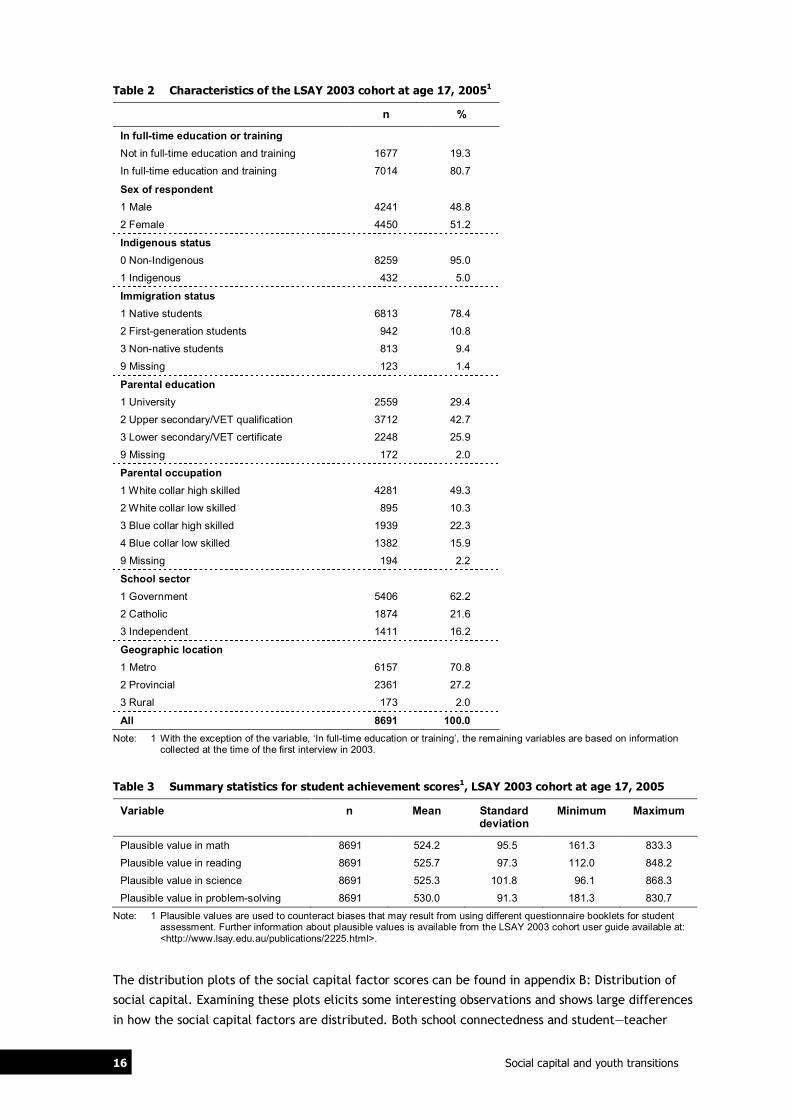
were, on average, 15 years of age. By the third wave in 2005, there were 8691 respondents. Table 2
profiles the LSAY respondents in 2005 during the third wave of interviewing when respondents were,
on average, 17 years of age. The first variable in the table shows that at this age, about 80 per cent
of respondents were still undertaking some form of education and training on a full-time basis. This
includes study or training undertaken at school or as part of a recognised qualification. We see a
reasonably equal split between males and females, about five per cent of our sample is Indigenous,
and about four in five of the respondents are native students, that is, they are Australian-born and
born to Australian parents. Close to one-third of the sample have parents with a university education,
while more than two in five have upper secondary or vocational education and training (VET)
qualifications. The remainder, about one in four, have lower secondary education or a VET
certificate. Parental occupation is categorised using the International Standard Classification of
Occupations (ISCO), and about half fall under the category ‘white collar high skilled’. This category
includes occupations from ISCO major groups 1, 2 and 3 (that is, 1 Legislators, senior officials and
managers; 2 Professionals and technicians; and 3 Associate professionals). Close to two-thirds of
respondents surveyed went to government schools, and about 70 per cent went to schools in
metropolitan areas.
Table 3 provides summary statistics for student achievement scores. The achievement scores for
maths, science, reading, and problem-solving are all normally distributed around a mean of about
526. Science has a slightly higher level of variability than the other subjects, with a standard
deviation of 101.8, while problem-solving has the lowest standard deviation — about 91.3. The ranges
for achievement scores also vary slightly; science has the largest range, from 96 to 868, while
problem-solving has the smallest range, from 181 to 831.
3 Note that since the introduction of the Commonwealth Government’s ‘Compact for Young Australians’, the school
leaving age has now been raised to age 17 (from 1 January 2010).
16 Social capital and youth transitions
Table 2 Characteristics of the LSAY 2003 cohort at age 17, 20051
n %
In full-time education or training Not in full-time education and training 1677 19.3
In full-time education and training 7014 80.7
Sex of respondent 1 Male 4241 48.8
2 Female 4450 51.2
Indigenous status 0 Non-Indigenous 8259 95.0
1 Indigenous 432 5.0
Immigration status 1 Native students 6813 78.4
2 First-generation students 942 10.8
3 Non-native students 813 9.4
9 Missing 123 1.4
Parental education 1 University 2559 29.4
2 Upper secondary/VET qualification 3712 42.7
3 Lower secondary/VET certificate 2248 25.9
9 Missing 172 2.0
Parental occupation 1 White collar high skilled 4281 49.3
2 White collar low skilled 895 10.3
3 Blue collar high skilled 1939 22.3
4 Blue collar low skilled 1382 15.9
9 Missing 194 2.2
School sector 1 Government 5406 62.2
2 Catholic 1874 21.6
3 Independent 1411 16.2
Geographic location
1 Metro 6157 70.8
2 Provincial 2361 27.2
3 Rural 173 2.0
All 8691 100.0 Note: 1 With the exception of the variable, ‘In full-time education or training’, the remaining variables are based on information
collected at the time of the first interview in 2003.
Table 3 Summary statistics for student achievement scores1, LSAY 2003 cohort at age 17, 2005
Variable n Mean Standard deviation
Minimum Maximum
Plausible value in math 8691 524.2 95.5 161.3 833.3
Plausible value in reading 8691 525.7 97.3 112.0 848.2
Plausible value in science 8691 525.3 101.8 96.1 868.3
Plausible value in problem-solving 8691 530.0 91.3 181.3 830.7
Note: 1 Plausible values are used to counteract biases that may result from using different questionnaire booklets for student assessment. Further information about plausible values is available from the LSAY 2003 cohort user guide available at: <http://www.lsay.edu.au/publications/2225.html>.
The distribution plots of the social capital factor scores can be found in appendix B: Distribution of
social capital. Examining these plots elicits some interesting observations and shows large differences
in how the social capital factors are distributed. Both school connectedness and student—teacher

NCVER 17
relations are negatively skewed; a large proportion of respondents display high levels of
connectedness with their school and in student—teacher relations, but for those with lower levels, the
distribution is more widely spread. The distribution of the social capital factor that depicts the
influence of peers shows a slight negative skew, no activity in the tails, and a relatively small range,
indicating that peer influences are a lot more homogenous than for the other factors. Participation in
activities displays a positive skew, indicating that most respondents have, on average, low levels of
participation in activities. For those with above average participation in activities, these levels are
more variable. Finally, the distribution of participation in sport is a little obscure and appears to
demonstrate a somewhat bi-modal nature. This may reflect the fact that only two questions
constitute this social capital factor. Respondents tend to either have low (below average) or high
(above average) levels of participation in sport, with little variation.
Survey attrition
It is also important to note the limitation of the analysis due to survey attrition, which occurs when
respondents drop out of the survey. This limitation is made worse if we find that attrition is biased,
that is, respondents with certain characteristics are more likely to drop out of the survey. This issue
is, in part, dealt with by creating attrition weights in an attempt to address bias.
Characteristics considered in the LSAY Y03 weights include: family structure; parents’ highest
education level; immigration status; year level; intended occupational level; education program;
Indigenous status; sex and geographic location (Rothman 2007). These variables, which were used to
calculate the LSAY weights, encapsulate the variables we use to determine a respondent’s background
(which we use later to control for background effects). We can therefore be confident that any
attrition bias that results from using data from the third wave is accounted for by using weights, and
we subsequently use weights for all analyses conducted for this paper.
We also need to consider how attrition bias may pose other limitations on our analysis, as there could
be some attrition bias present relating to differing levels of social capital. For example, respondents
with low levels of social capital may be more likely to drop out of the survey than their peers with
high levels of social capital. We test this theory by comparing the distribution of social capital from
the first wave of interviewing (2003) to the wave of interest (wave 3 in 2005).
Table 4 shows the distribution of respondents using social capital quartiles. The social capital
quartiles are calculated using the scores from the factor analysis in wave 1 in 2003. We note that
social capital factor scores are missing for about one-third of respondents,4
which allows for about
17 per cent of respondents to fall within each quartile. The distribution of respondents in 2005 is then
compared using the same social capital quartiles calculated in 2003. We find that the distributions of
social capital are comparable between the two survey waves, and any differences are only minor. This
suggests that any attrition bias related to social capital would only be small.
4 A missing response to just one of the 26 data items would result in a missing factor score.

18 Social capital and youth transitions
Table 4 LSAY 2003 respondents by social capital factor score quartile (unweighted), 2003 and 2005
2003 2005
n % n % Factor 1: Connectedness with school
1 Lowest quartile 1 758 17.0 1 479 17.0
2 Second quartile 1 759 17.0 1 473 16.9
3 Third quartile 1 758 17.0 1 500 17.3
4 Highest quartile 1 758 17.0 1 490 17.1
9 Missing 3 337 32.2 2 749 31.6
Factor 2: Student–teacher relations
1 Lowest quartile 1 758 17.0 1 399 16.1
2 Second quartile 1 759 17.0 1 481 17.0
3 Third quartile 1 758 17.0 1 513 17.4
4 Highest quartile 1 758 17.0 1 549 17.8
9 Missing 3 337 32.2 2 749 31.6
Factor 3: Influence of peers
1 Lowest quartile 1 758 17.0 1 471 16.9
2 Second quartile 1 759 17.0 1 498 17.2
3 Third quartile 1 758 17.0 1 518 17.5
4 Highest quartile 1 758 17.0 1 455 16.7
9 Missing 3 337 32.2 2 749 31.6
Factor 4: Participation in school-based activities 1 Lowest quartile 1 758 17.0 1 453 16.7
2 Second quartile 1 759 17.0 1 471 16.9
3 Third quartile 1 758 17.0 1 492 17.2
4 Highest quartile 1 758 17.0 1 526 17.6
9 Missing 3 337 32.2 2 749 31.6
Factor 5: Participation in sport
1 Lowest quartile 1 758 17.0 1 451 16.7
2 Second quartile 1 759 17.0 1 487 17.1
3 Third quartile 1 758 17.0 1 494 17.2
4 Highest quartile 1 758 17.0 1 510 17.4
9 Missing 3 337 32.2 2 749 31.6
All 10 370 100.0 8 691 100.0
Modelling educational participation using social capital
In developing our model, we conceptualise the relationship between social capital and future
participation in education and training by using an ‘education production function’.5
5 We thank an anonymous referee for suggesting this conceptualisation.
Production
functions simply describe maximum feasible outputs, based on different sets of inputs (Hanushek
1979). Education production functions have commonly been used to examine relationships between
schooling inputs and test score outcomes (Todd & Wolpin 2003). For this study, the output can be
conceptualised as participation in education and training, and measures of social capital (and the
other background variables) provide us with the model inputs. If the production function is known for
educational participation, then it is possible to predict what would happen if certain resources, that
is, social capital, were added or removed (Hanushek 1989); this therefore enables us to determine the
relative importance of the social capital inputs.

NCVER 19
Our choice of background variables draws on the substantial body of previous research using LSAY
data. Students whose parents had higher education levels and occupational status are more likely to
participate in education and training (Marks et al. 2000; Fullarton 2002; Curtis & McMillan 2008).
Cultural background is also an important predictor: students’ whose parents are born in non-English
speaking countries are more likely to stay in education (Lamb 1997; Marks et al. 2000). Indigenous
students are also found to have significantly lower rates of participation than non-Indigenous students
(Marks et al 2000; Curtis & McMillan 2008). There are also gaps in participation, based on school
sector and location: independent school students and students from metropolitan schools have higher
retention rates than those from non-independent and non-metropolitan schools (Lamb 1997; Marks
et al. 2000; Curtis & McMillan 2008). And finally, academic achievement is also a strong predictor of
educational participation (Lamb 1997; Marks et al. 2000; Curtis & McMillan 2008).
As with all models of this type, we are not immune from missing variables, such as teaching quality or
a child’s capacity to learn, and endogeneity. In relation to the latter, our models condition
importantly on two variables: the extent of social capital at age 15 and academic achievement at age
15. Clearly, there are broader factors that impinge on the variables, but we have no way of capturing
— or instrumenting these. Instrumental variables (IV) regression can be used to obtain consistent
estimates of the unknown coefficients of the regression model by using additional variables to isolate
variations in the covariates that are uncorrelated with the error term. However, in practice, finding
valid instruments can be extremely difficult (Stock & Watson 2003).
The inclusion of educational achievement is our attempt to at least partially overcome these issues. A
‘value-added’ specification incorporates a lagged achievement score into the model to account for
historical inputs and heritable endowments (Todd & Wolpin 2003); this specification is generally
regarded as being better than that based on purely contemporaneous specifications. Academic
achievement is used because it is an outcome of a cumulative process of acquired knowledge, and
past achievement is likely to influence future outcomes. By controlling for academic achievement at
age 15, we are able to consider the effect that personal characteristics, such as ability, might have on
our social capital and educational participation. We can therefore estimate the effect of social
capital on educational participation, conditional on past educational achievement.
However, we acknowledge that our approach most likely underestimates the effect of social capital
on participation. This is because high levels of early social capital are likely to have led to better
academic achievement at age 15 — on which we are conditioning.
Multivariate logistic regression modelling
Using the five social capital factors obtained in the previous section, we use logistic regression to
model the impact of these five explanatory social capital variables (at an average age of 15) on
participation in education and training two years later (at age 17). We control for a range of
background effects that are known predictors of educational retention including: Indigenous status;
immigration status; parental education; parental occupation; school sector; school location; and
student achievement.
Separate models are estimated for males and females on the basis that levels of social capital and its
effects are likely to be different for males and females. For example, boys’ rates of participation in
sport are higher than those of females, while females have higher rates of participation in other
activities such as drama. These different levels of participation reflect different rates of access to
social capital and may be an influence on future participation in education and training. Studies show

20 Social capital and youth transitions
that, after taking into account school achievement, individual schools and other factors, boys are
more likely to leave school early than girls (Fullarton 2002). One could hypothesise that this
difference could be attributed to boys’ lower rates of participation in some types of school-based
activities.
Results from the logistic regression models are reported in table 5. The estimated coefficients
represent the average effect of the explanatory variables on the likelihood of participation in
education and training at age 17. A positive coefficient indicates that having larger values of that
characteristic increases an individual’s likelihood of educational participation.
We find that, for both males and females, student—teacher relations and participation in school-
based activities are positively and significantly related to the likelihood of participation in education
and training at age 17.
For females, participation in sport also plays an important role in predicting educational
participation. In contrast, participation in sport appears to have a negligible and insignificant
relationship to future educational participation for males. However, the connectedness males have
with their school, while not statistically significant at the ten per cent level, does still show some
importance. The effect of school connectedness for females is less pronounced.
Table 5 Logistic regression results for males and females, LSAY 2003 cohort
Males Females
Parameter Coeff. Pr > Chi Sq
Coeff. Pr > Chi Sq
Intercept 0.658 0.574 -0.497 0.519
F1_school 0.075 0.152 0.058 0.225
F2_teacher 0.158 0.002 0.158 0.003
F3_peer 0.048 0.401 0.022 0.658
F4_activities 0.243 0.000 0.234 <.0001
F5_sport -0.001 0.985 0.149 0.008
Indigenous status 0 Non-Indigenous 0.668 0.044 0.171 0.601
Indigenous status 1 Indigenous - - - -
Immigration status 1 Native students -0.319 0.109 -0.041 0.814
Immigration status 2 First-generation students 0.080 0.758 0.045 0.836
Immigration status 3 Non-native students - - - -
Parental education 1 University 0.601 0.000 0.428 0.002
Parental education 2 Upper secondary/VET qualification 0.153 0.213 0.273 0.015
Parental education 3 Lower secondary/VET certificate - - - -
Parental occupation 1 White collar high skilled 0.422 0.005 -0.042 0.772
Parental occupation 2 White collar low skilled 0.297 0.134 -0.152 0.408
Parental occupation 3 Blue collar high skilled 0.278 0.077 -0.222 0.135
Parental occupation 4 Blue collar low skilled - - - -
School sector 1 Government -0.390 0.025 -0.234 0.119 School sector 2 Catholic 0.181 0.370 0.167 0.337
School sector 3 Independent - - - -
School location 1 Metro -1.290 0.222 -0.106 0.855
School location 2 Provincial -1.406 0.183 -0.214 0.714
School location 3 Rural - - - -
Maths achievement -0.001 0.690 0.004 0.007
Reading achievement 0.003 0.025 0.001 0.394
Science achievement 0.000 0.873 0.002 0.112
Problem-solving achievement 0.001 0.658 -0.003 0.046

NCVER 21
The coefficients from table 5 can be used to calculate the predicted likelihood of each respondent
participating in education and training at age 17, based on their individual characteristics, as
represented by the explanatory variables.
To better understand the results of the logistic regression, we determine the relative importance of
the social capital factors by calculating the likelihood of participation in education and training based
on the ‘size’ of a respondent’s social capital. The ‘size’ of a respondent’s social capital can be
illustrated using percentiles of the factor scores. For example, respondents who have weak bonds with
their teachers are represented by the fifth percentile of factor scores for student—teacher relations,
and respondents with strong bonds with their teachers are represented by the 95th percentile of
factor scores. Similarly, we define low and high scores for student connectedness with their school,
influence of networks, participation in school-based activities, and participation in sport.
The coefficients on the social capital variables are difficult to understand intuitively, so we convert
them to the probability of educational participation being associated with a particular social capital
factor in isolation from the impact of the remaining explanatory variables. We do this by taking the
average values for the remaining explanatory variables and substitute values for the social capital
factor at the fifth and 95th percentiles. This illustrates how the probability of educational
participation varies across the range of social capital factor scores.
Table 6 shows the likelihood of participating in education and training based on the lowest (fifth
percentile) and highest (95th percentile) scores for the five social capital factors for both males and
females.
Table 6 Probability of participating in education and training at 17 years by level of social capital at 15 years, LSAY 2003 cohort
Social capital factor Level of social capital
Males Females Low
(5th percentile)
High (95th
percentile)
Difference Low (5th
percentile)
High (95th
percentile)
Difference
1 Connectedness with school 0.817 0.849 0.032 0.789 0.817 0.029
2 Student—teacher relations 0.800 0.870 0.070 0.770 0.842 0.073
3 Influence of networks 0.828 0.848 0.020 0.803 0.814 0.011
4 School-based activities 0.804 0.891 0.087 0.760 0.871 0.111
5 Sport 0.840 0.839 0.000 0.776 0.839 0.064
Note: Probabilities are calculated for males and females for all social capital factors; however, not all social capital factors were found to impact significantly on the likelihood of educational participation. Those deemed significant at the five per cent level are highlighted.
Table 6 shows that positive student—teacher relations is a very important influence on a student’s
future educational participation. The probability of participating in education and training at age 17
increases from 80 to 87 per cent for males and from 77 to 84 per cent for females as the factor score
for student teacher relations increases from the fifth to the 95th percentile.
Participation in school-based activities has an even larger impact on the likelihood of participating in
education and training at age 17. As the factor score for participation in school-based activities
increases from the fifth to the 95th percentile, the likelihood of participation in education and
training increases from 80 to 89 per cent for males, and from 76 to 87 per cent for females.
We also find that females who participate in sport more frequently were also more likely to
participate in education and training two years later. For females at the fifth percentile of

22 Social capital and youth transitions
participation in sport (that is, with the lowest rates of sporting participation), the likelihood of
participating in education and training at age 17 was 78 per cent. For females at the 95th percentile
of participation in sport (that is, with the highest rates of sporting participation), educational
participation rose to 84 per cent.
For males, their sense of belonging to their school, while not significant at the ten per cent level,
does play some role in increasing their rates of educational participation. An increase of the factor
score for school connectedness from the fifth to the 95th percentile increases the likelihood of
participation in education and training for males from 82 to 85 per cent.
From this analysis we can conclude that higher levels of social capital, at least in the form of
student—teacher relations and school-based activities, do impact significantly on future participation
in education and training for both males and females. In addition, participation in sport is an
important influence for females, while the connectedness that males have with their schools also
plays some role on their future rates of educational participation.
Social capital and academic orientation
We have inferred from our model that social capital matters and this suggests that intervention to
increase social capital could affect disadvantage, such as low socioeconomic status. However, this
conclusion would be problematic if it turned out that all variation in social capital occurs among the
advantaged students. In that case, our model would merely be telling us that increasing social capital
adds to advantage.
We must therefore test whether the results presented here suffer from a problem of ‘common
support’. In randomised experiments, the common support problem occurs when there is a lack of
overlap in the distributions of the key predictors between the treatment and control groups (Rubin
2008). For our study, a common support problem would equate to a lack of overlap in the
distributions of the social capital factor scores between respondents from both advantaged and
disadvantaged backgrounds.
Rather than investigate the relationships between each background characteristic and factor score
separately (which would require 50 separate analyses), we summarise the effects of the background
characteristics on educational participation using an academic orientation score. We measure
academic orientation by modelling the probability of participation in education and training at age 17
against a series of background variables that are known predictors of educational retention. These
include respondent’s Indigenous status, their parents’ socioeconomic status as measured by parental
educational and occupational levels, school sector, geographic location, and student achievement
(Dockery 2005). Cultural background, measured by immigration status, is also included in the model,
as students whose parents are from non-English speaking backgrounds are found to have higher rates
of educational participation (Marks et al. 2000). A logistic regression model is used to estimate the
effect of these individual background characteristics on the probability of educational participation.
The results of the regression analysis can be found in appendix D: Logistic regression (2).
The coefficients from the model are then used to calculate the predicted likelihood of each
respondent participating in education and training at age 17, based on their individual characteristics
as represented by the explanatory variables. This calculation produces a score for each respondent
that represents educational orientation — a high score would indicate they are more likely to
participate in education and training, while a low score would indicate the reverse.

NCVER 23
We then compare the distribution of the social capital factor scores for respondents with high and low
educational orientations. For this analysis, we define those with low educational orientation as those
with an educational orientation score in the bottom 25th percentile (that is, the lowest quartile), and
similarly those with high educational orientations as those with an educational orientation score in
the top 25th percentile (that is, highest quartile). The distributions of the social capital scores for the
two groups can be found in appendix E: Distribution of social capital by academic orientation.
We find that the distributions of social capital are comparable across respondents with high and low
academic orientations. We can therefore conclude that social capital is not simply something that
occurs among the already advantaged.
We can further examine the relationships between the social capital factor scores and academic
orientation by calculating a simple correlation between the variables. The results are shown in
table 7. Broadly speaking, the correlations between academic orientation and the social capital factor
scores are weak and do not vary much between males and females.
We can therefore be confident that social capital is relevant across the full range of backgrounds,
which is important because it means that social capital has the potential to address the influence of
disadvantageous background characteristics.
Table 7 Pearson correlation coefficients of academic orientation scores with social capital factor scores
Social capital factor Males Females
Coeff. Pr > |r| Coeff. Pr > |r| 1 Connectedness with school 0.00 0.943 0.05 0.003
2 Student—teacher relations 0.20 <.0001 0.20 <.0001
3 Influence of networks -0.20 <.0001 -0.18 <.0001
4 Participation in school-based activities 0.19 <.0001 0.16 <.0001
4 Participation in sport 0.03 0.134 0.12 <.0001

24 Social capital and youth transitions
Conclusion This paper has explored the notion that social capital is an important determinant of educational
outcomes. From our analysis, it is clear that social capital does play an important role in influencing
educational participation. What is most interesting is that we were able to demonstrate the relative
importance of different types of social capital.
We found that, for both males and females, participation in school-based activities was the most
important social capital factor influencing educational participation; this was followed by the
strength of the relationship students have with their teachers. Increasing rates of participation in
sport also increased educational participation at age 17 for females. And for males, the level of
connectedness they had with their school also appears to have played some role in promoting higher
rates of participation in education and training.
Overall, it is likely that our findings underestimate the net effects of social capital. This is because the
results obscure the role of social capital accumulated prior to the age of 15. Specifically, the effect of
previous social capital will have been captured to some extent by our academic achievement control.
One of the key discussions emerging from the literature is how social capital can mediate the effects
of disadvantage. Social capital has been used to explain how students from low socioeconomic
backgrounds are able to achieve successful outcomes, and this analysis sheds further light on this
issue. We observed that, on controlling for background characteristics that considered the
socioeconomic predictors of student retention (including parental education and occupation,
Indigenous status, school sector and geographic location), increases in social capital factor scores
were found to increase the likelihood of participation in education and training. This analysis thus
shows that social capital does have the potential to mediate the effects of disadvantage.
Our confidence in this conclusion is further strengthened by our analysis of the distribution of social
capital across young people with different academic orientations. It is not the case that social capital
is heavily skewed towards those who already have high probabilities of participation in education and
training and that social capital is merely loading advantage on advantage. This suggests that increased
social capital can have a real effect on the educational outcomes of young people from disadvantaged
backgrounds.

NCVER 25
References Banks, G 2010, ‘Advancing Australia’s “human capital agenda”’, lecture presented at the fourth Ian Little
lecture, 13 April 2010, Melbourne, viewed April 2010, <http://www.apo.org.au/research/advancing-australias-human-capital-agenda>.
Bexley, E 2007, Social capital theory and practice, Centre for the Study of Higher Education, University of Melbourne.
Biddle, N, Davis, E, Myers, J & Dodhy, RS 2009, Exploring measures of social capital, cat.no.1351.0.55.024, ABS, Canberra.
Bourdieu, P 1986, ‘The forms of capital’, in J Richardson (ed.), Handbook of theory and research for the sociology of education, Greenwood, New York, pp.183—98.
Coleman, JC 1988, ‘Social capital in the creation of human capital’, American Journal of Sociology, vol.94, pp.S95—S120.
Curtis, D & McMillan, J 2008, School non-completers: profiles and initial destinations, LSAY research report no.54, Australian Council for Educational Research, Camberwell, Vic.
Dockery, A 2005, Assessing the value of additional years of schooling for the non academically inclined, LSAY research report no.38, Australian Council for Educational Research, Camberwell, Vic.
Dockery, AM & Strathdee, R 2003, The job finding methods of young people in Australia: an analysis of the Longitudinal Surveys of Australian Youth, Year 9 (1995) sample, LSAY research report no.37, Australian Council for Educational Research, Camberwell, Vic.
Edwards, RD 2004, Measuring social capital: an Australian framework, cat.no.1378.0, ABS, Canberra.
Fullarton, S 2002, Student engagement with school: individual and school-level influences, LSAY research report no.27, Australian Council for Educational Research, Camberwell, Vic.
Hair, JF Jr, Anderson, RE & Tatham, RL 1984, Multivariate data analysis with readings, 2nd edn, Macmillan Publishing Company, New York.
Halpern, D 2005, Social capital, Polity Press, Cambridge, UK.
Hanushek, EA 1979, ‘Conceptual and empirical issues in the estimate of educational production functions’, The Journal of Human Resources, vol.14, no.3, pp.351—88.
——1989, ‘The impact of differential expenditures on school performance’, Educational Researcher, vol.18, no.4, pp.45—62.
Holland, J 2009, ‘Young people and social capital: uses and abuses’, SAGE publications, vol.17, no.4, pp.331—50.
Khoo, ST & Ainley, J 2005, Attitudes, intentions and participation, LSAY research report no.41, Australian Council for Educational Research, Camberwell, Vic.
Lamb, S 1997, School achievement and initial education and labour market outcomes, LSAY research report no.4, Australian Council for Educational Research, Camberwell, Vic.
Marks, GN & McKenzie, P 2000, Early school leaving and 'non-completion' in Australia, LSAY briefing paper no.2, Australian Council for Educational Research, Camberwell, Vic.
Marks, GN, Fleming, N, Long, M & McMillan, J 2000, Patterns of participation in Year 12 and higher education in Australia: trends and issues, LSAY research report no.17, Australian Council for Educational Research, Camberwell, Vic.
OECD (Organisation for Economic Cooperation and Development) 2001, The well-being of nations: the role of human and social capital, Paris.
Perna, LW & Titua, MA 2005, ‘The relationship between parental involvement as social capital and college enrolment: an examination of racial/ethnic group differences’, Journal of Higher Education, vol.76, no.5, pp.485—518.
Productivity Commission 2003, Social capital: reviewing the concept and its policy implications, research paper, AusInfo, Canberra.
Putnam, R 1993, Making democracy work and civic traditions in modern Italy, Princeton University Press, Princeton, NJ.
Rothman, S 2007, Sampling and weighting of the 2003 LSAY cohort, LSAY technical report no.43, Australian Council of Educational Research, Camberwell, Vic.
Rubin, DB 2008, ‘For objective causal inference, design trumps analysis’, The Annals of Applied Statistics, vol.2, no.3, pp.808—40.
Stock, JH & Watson, MW 2003, Introduction to econometrics, Addison Wesley, Boston, MA.

26 Social capital and youth transitions
Stone, W & Hughes, J 2002, Social capital: empirical meaning and measurement validity, Australian Institute of Family Studies, Melbourne.
Thomson, S & Hillman, K 2010, Against the odds: influences on the post-school success of ‘low performers’, NCVER, Adelaide.
Todd, PE & Wolpin, KI 2003, ‘On the specification and estimation of the production function for cognitive achievement’, The Economic Journal, vol.113, no.485, pp.F3—F33.
Winter, I 2000, Towards a theorised understanding of family life and social capital, working paper no. 21, Australian Institute of Family Studies, Melbourne.

NCVER 27
Appendix A: Factor analysis A factor analysis is conducted to group together 26 data items from the LSAY 2003 cohort to establish
factors that reflect discrete social capital constructs. Responses were recoded from the original
categories into a seven-point scale, where 1 indicates a low incidence of social capital and 7 indicates
a high incidence of social capital.6
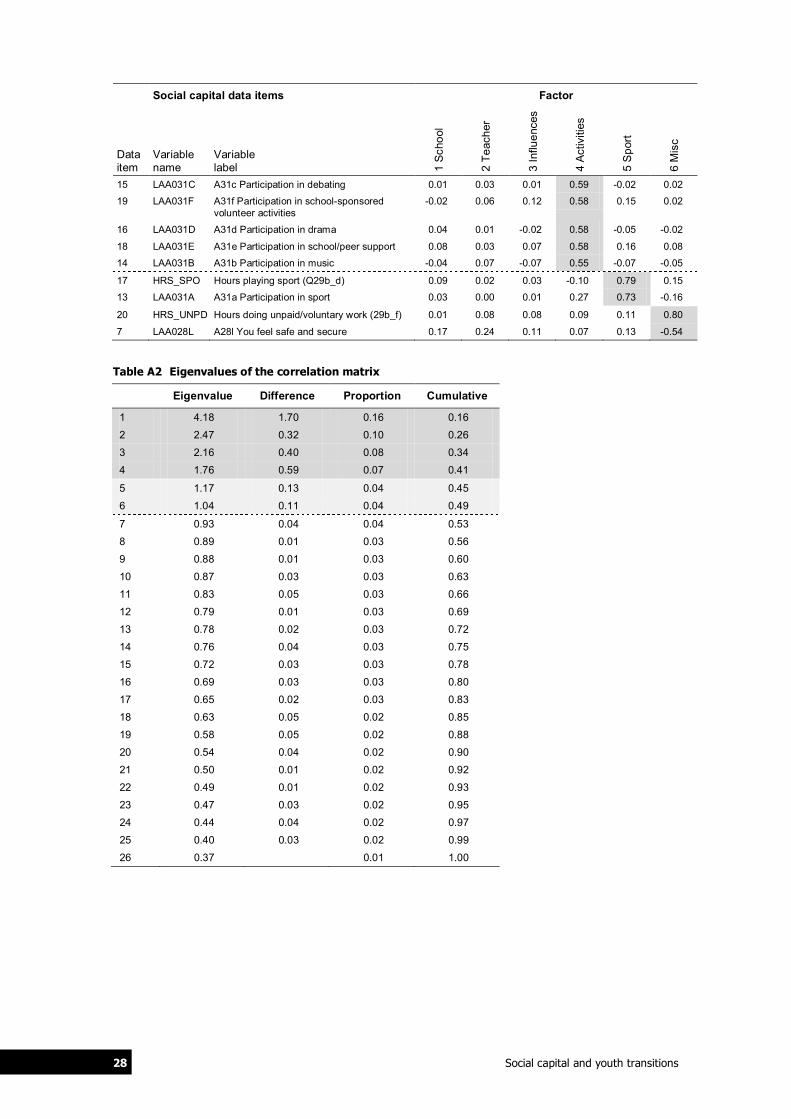
The correlations between the variables and the resulting factors can be found in table A1. The
eigenvalues of the correlation matrix and percentage of variance explained for each factor can be
found in table A2.
Five discrete factors were retained: student connectedness with school; student—teacher relations;
influence of networks when thinking about the future; participation in school-based activities; and
participation in sport. This decision was based on two criteria: the ‘latent root criterion’ and the
‘percentage of variance criterion’. On examining the eigenvalues of the correlation matrix, and using
the latent root criterion, our factor analysis would retain six factors, as the first six generated factors
display eigenvalues greater than 1. However, on considering the percentage of variance criterion, it is
evident that only the first four factors are able to add to the amount of variance explained by more
than five per cent. The fifth factor was also retained, as the underlying questions relate to
participation in sport and the literature on social capital suggests that sport contributes to the
creation and development of social capital.
Table A1 Rotated factor pattern
Social capital data items Factor
Data item
Variable name
Variable label 1
Scho
ol
2 Te
ache
r
3 In
fluen
ces
4 Ac
tiviti
es
5 S
port
6 M
isc
1 ST27Q01 Feel an outsider Q27a 0.80 0.08 -0.01 -0.03 0.01 -0.10
6 ST27Q06 Feel lonely Q27f 0.77 0.04 0.00 -0.02 0.00 -0.08
4 ST27Q04 Feel awkward Q27d 0.77 0.08 0.00 0.01 0.02 -0.13
3 ST27Q03 Feel I belong Q27c 0.72 0.21 0.07 0.03 0.03 -0.05
2 ST27Q02 Make friends Q27b 0.69 0.05 0.07 0.05 0.08 0.07
5 ST27Q05 Think I'm liked Q27e 0.68 0.07 0.03 0.05 0.01 0.11
10 ST26Q03 Listen to me Q26c 0.10 0.78 0.04 0.05 0.04 -0.05
12 ST26Q05 Treat me fairly Q26e 0.06 0.77 0.02 0.03 -0.03 -0.07
9 ST26Q02 Interested in students Q26b 0.10 0.77 0.04 0.05 0.02 0.00
11 ST26Q04 Give extra help Q26d 0.11 0.72 0.03 0.05 -0.03 0.01
8 ST26Q01 Well with students Q26a 0.08 0.71 0.02 0.05 0.05 0.00
23 LAA035C A35c Influence of school teachers 0.01 0.17 0.68 0.03 0.04 0.02
22 LAA035B A35b Influence of friends 0.05 -0.03 0.65 0.01 0.02 -0.07
21 LAA035A A35a Influence of family 0.02 0.03 0.63 -0.04 0.04 -0.04
24 LAA035E A35e Influence of school career advisor 0.01 0.05 0.63 -0.02 0.07 -0.03
25 LAA035F A35f Influence of work experience 0.05 0.01 0.52 0.01 0.00 0.14
26 LAA035D A35d Influence of media -0.02 -0.04 0.48 0.08 -0.09 -0.01
6 A false assumption was made about the size of the scale for the series of data items ST26Q01 to ST26Q05. This was
found to have no material effect on the eigenvalues of the correlation matrix or subsequent analyses and, as a result, the analyses were not re-run.
28 Social capital and youth transitions
Social capital data items Factor
Data item
Variable name
Variable label 1
Scho
ol
2 Te
ache
r
3 In
fluen
ces
4 Ac
tiviti
es
5 S
port
6 M
isc
15 LAA031C A31c Participation in debating 0.01 0.03 0.01 0.59 -0.02 0.02
19 LAA031F A31f Participation in school-sponsored volunteer activities
-0.02 0.06 0.12 0.58 0.15 0.02
16 LAA031D A31d Participation in drama 0.04 0.01 -0.02 0.58 -0.05 -0.02
18 LAA031E A31e Participation in school/peer support 0.08 0.03 0.07 0.58 0.16 0.08
14 LAA031B A31b Participation in music -0.04 0.07 -0.07 0.55 -0.07 -0.05
17 HRS_SPO Hours playing sport (Q29b_d) 0.09 0.02 0.03 -0.10 0.79 0.15
13 LAA031A A31a Participation in sport 0.03 0.00 0.01 0.27 0.73 -0.16
20 HRS_UNPD Hours doing unpaid/voluntary work (29b_f) 0.01 0.08 0.08 0.09 0.11 0.80
7 LAA028L A28l You feel safe and secure 0.17 0.24 0.11 0.07 0.13 -0.54
Table A2 Eigenvalues of the correlation matrix
Eigenvalue Difference Proportion Cumulative
1 4.18 1.70 0.16 0.16
2 2.47 0.32 0.10 0.26
3 2.16 0.40 0.08 0.34
4 1.76 0.59 0.07 0.41
5 1.17 0.13 0.04 0.45
6 1.04 0.11 0.04 0.49
7 0.93 0.04 0.04 0.53
8 0.89 0.01 0.03 0.56
9 0.88 0.01 0.03 0.60
10 0.87 0.03 0.03 0.63
11 0.83 0.05 0.03 0.66
12 0.79 0.01 0.03 0.69
13 0.78 0.02 0.03 0.72
14 0.76 0.04 0.03 0.75
15 0.72 0.03 0.03 0.78
16 0.69 0.03 0.03 0.80
17 0.65 0.02 0.03 0.83
18 0.63 0.05 0.02 0.85
19 0.58 0.05 0.02 0.88
20 0.54 0.04 0.02 0.90
21 0.50 0.01 0.02 0.92
22 0.49 0.01 0.02 0.93
23 0.47 0.03 0.02 0.95
24 0.44 0.04 0.02 0.97
25 0.40 0.03 0.02 0.99
26 0.37 0.01 1.00

NCVER 29
Appendix B: Distribution of social capital The following charts provide an illustration of the distribution of the social capital factor scores.
Figure B1 Distribution of school connectedness (factor 1 scores)
Figure B2 Distribution of student-teacher relations (factor 2 scores)
0
2
4
6
8
10
12
14
16
18
20
-6 -5.5 -5 -4.5 -4 -3.5 -3 -2.5 -2 -1.5 -1 -0.5 0 0.5 1 1.5 2
Prop
ortio
n of
res
pond
ents
(%)
Level of school connectedness (social capital factor score 1)
0
5
10
15
20
25
-6 -5.5 -5 -4.5 -4 -3.5 -3 -2.5 -2 -1.5 -1 -0.5 0 0.5 1 1.5 2 2.5 3
Prop
ortio
n of
res
pond
ents
(%)
Level of student-teacher relations (social capital factor score 2)

30 Social capital and youth transitions
Figure B3 Distribution of peer influences (factor 3 scores)
Figure B4 Distribution of participation in activities (factor 4 scores)
0
1
2
3
4
5
6
7
8
-3.5 -3 -2.5 -2 -1.5 -1 -0.5 0 0.5 1 1.5 2 2.5
Prop
ortio
n of
res
pond
ents
(%)
Level of peer influence (social capital factor score 3)
0
2
4
6
8
10
12
14
16
18
-2 -1.5 -1 -0.5 0 0.5 1 1.5 2 2.5 3 3.5 4 4.5 5
Prop
ortio
n of
res
pond
ents
(%)
Level of participation in activities (social capital factor score 4)

NCVER 31
Figure B5 Distribution of participation in sport (factor 1 scores)
0
2
4
6
8
10
12
14
16
-3 -2.5 -2 -1.5 -1 -0.5 0 0.5 1 1.5 2 2.5 3 3.5 4
Prop
ortio
n of
res
pond
ents
(%)
Level of participation in sport (social capital factor score 5)

32 Social capital and youth transitions
Appendix C: Logistic regression (1) We use the social capital factors outlined in appendix A: Factor analysis to determine whether having
(higher levels of) social capital can influence a student’s future participation in education and training.
Background effects were controlled for by modelling the social capital factor scores as a function of
the background variables and using the factor score residuals obtained to model participation in
education and training.
Estimating propensity scores of participation in education or training using logistic regression:
Let p= Pr(Y = 1│x), then
where
Y is the binary response variable where Y = 1 if individual participated in education and training, and
0 otherwise
pi is the predicted probability of participating in education and training, given the response variable
Y = 1. The predicted probabilities are the estimated propensity scores.
αi is the intercept parameter
βi is the vector of regression coefficients for the explanatory variables
xi is the vector of explanatory variables
ε is the vector of residuals
The regression analyses were carried out using SAS v9.1 and the results are presented in the main
body of the paper.

NCVER 33
Appendix D: Logistic regression (2) The academic orientation scores are obtained by modelling the probability of participation in
education and training at age 17 against a series of background variables that are known predictors of
educational retention. These include a respondent’s Indigenous status, parental education and
occupation, school sector, school location, immigration status and student achievement. The
academic orientation scores are obtained using logistic regression:
Let p= Pr(Y = 1│x), then
where
Y is the binary response variable where Y = 1 if individual participated in education and training, and
0 otherwise
pi is the predicted probability of participating in education and training, given the response variable
Y = 1. The predicted probabilities are the estimated propensity scores.
αi is the intercept parameter
βi is the vector of regression coefficients for the explanatory variables
xi is the vector of explanatory variables
ε is the vector of residuals
The regression analyses were carried out using SAS v9.1 and the results are presented in table D1.

34 Social capital and youth transitions
Table D1 Logistic regression results for modelling academic orientation for males and females, LSAY 2003 cohort
Males Females
Parameter Coeff. Pr > Chi Sq
Coeff. Pr > Chi Sq
Intercept -0.842 0.180 -0.964 0.107
Indigenous status 0 Non-Indigenous 0.601 0.024 0.339 0.156
Indigenous status 1 Indigenous - - - -
Immigration status 1 Native students -0.427 0.007 -0.129 0.373
Immigration status 2 First-Generation students -0.385 0.047 0.116 0.530
Immigration status 3 Non-native students - - - -
Parental education 1 University 0.522 <.0001 0.470 <.0001
Parental education 2 Upper secondary/VET qualification 0.174 0.077 0.252 0.007
Parental education 3 Lower secondary/VET certificate - - - -
Parental occupation 1 White collar high skilled 0.338 0.005 0.007 0.950
Parental occupation 2 White collar low skilled 0.183 0.254 -0.040 0.790
Parental occupation 3 Blue collar high skilled 0.065 0.596 -0.082 0.497
Parental occupation 4 Blue collar low skilled
School sector 1 Government -0.349 0.012 -0.305 0.018 School sector 2 Catholic 0.236 0.148 0.079 0.601
School sector 3 Independent - - - -
School location 1 Metro 0.017 0.972 0.093 0.837
School location 2 Provincial -0.105 0.830 -0.085 0.853
School location 3 Rural - - - -
Maths achievement 0.001 0.445 0.002 0.112
Reading achievement 0.001 0.217 0.001 0.411
Science achievement 0.001 0.294 0.003 0.006
Problem-solving achievement 0.001 0.567 -0.001 0.301
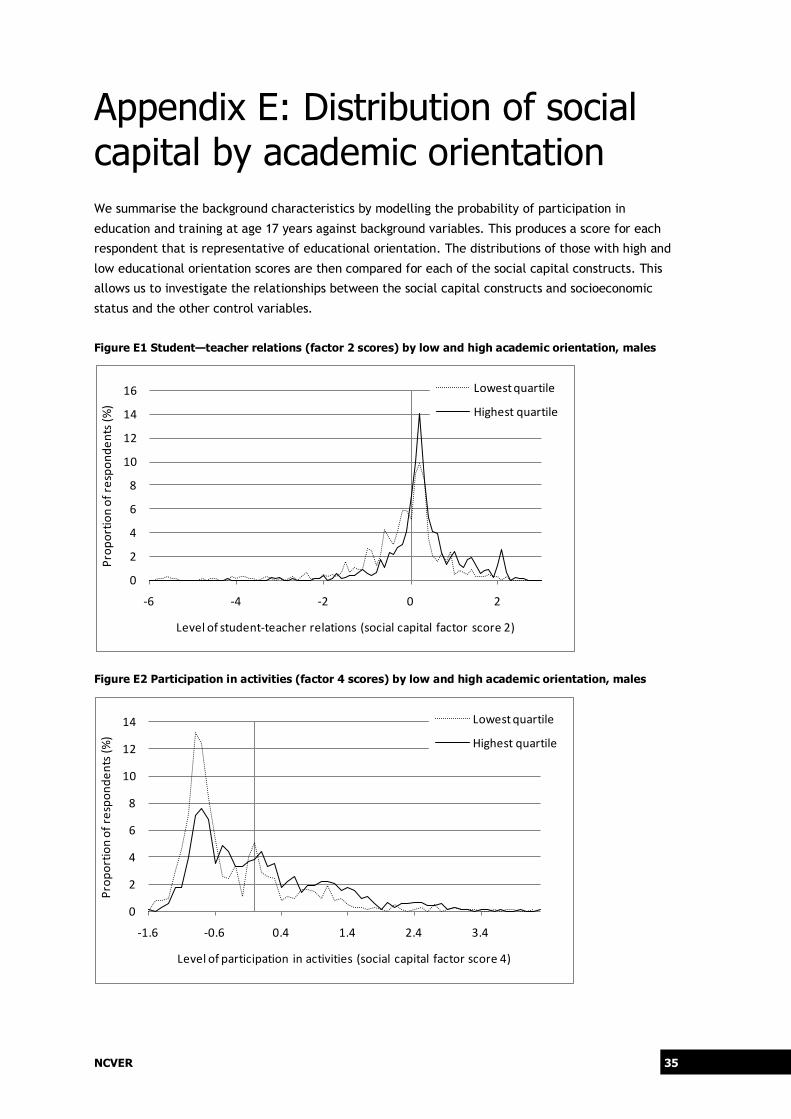
NCVER 35
Appendix E: Distribution of social capital by academic orientation We summarise the background characteristics by modelling the probability of participation in
education and training at age 17 years against background variables. This produces a score for each
respondent that is representative of educational orientation. The distributions of those with high and
low educational orientation scores are then compared for each of the social capital constructs. This
allows us to investigate the relationships between the social capital constructs and socioeconomic
status and the other control variables.
Figure E1 Student—teacher relations (factor 2 scores) by low and high academic orientation, males
Figure E2 Participation in activities (factor 4 scores) by low and high academic orientation, males
0
2
4
6
8
10
12
14
16
-6 -4 -2 0 2
Prop
ortio
n of
res
pond
ents
(%)
Level of student-teacher relations (social capital factor score 2)
Lowest quartile
Highest quartile
0
2
4
6
8
10
12
14
-1.6 -0.6 0.4 1.4 2.4 3.4
Prop
ortio
n of
res
pond
ents
(%)
Level of participation in activities (social capital factor score 4)
Lowest quartile
Highest quartile

36 Social capital and youth transitions
Figure E3 Student—teacher relations (factor 2 scores) by low and high academic orientation, females
Figure E4 Participation in activities (factor 4 scores) by low and high academic orientation, females
0
2
4
6
8
10
12
14
-6 -4 -2 0 2
Prop
ortio
n of
res
pond
ents
(%)
Level of student-teacher relations (social capital factor score 2)
Lowest quartile
Highest quartile
0
2
4
6
8
10
12
-1.6 -0.6 0.4 1.4 2.4 3.4
Prop
ortio
n of
res
pond
ents
(%)
Level of participation in activities (social capital factor score 4)
Lowest quartile
Highest quartile

NCVER 37
Figure E5 Participation in sport (factor 5 scores) by low and high academic orientation, females
0
1
2
3
4
5
6
7
8
-3 -2 -1 0 1 2 3 4
Prop
ortio
n of
res
pond
ents
(%)
Level of participation in activities (social capital factor score 4)
Lowest quartile
Highest quartile

National Centre for Vocational Education Research Ltd
Level 11, 33 King William Street, Adelaide, South Australia
PO Box 8288, Station Arcade, SA 5000 Australia
Telephone +61 8 8230 8400 Facsimile +61 8 8212 3436
Website www.ncver.edu.au Email [email protected]