RONALD JAMES JAMESON for the degree MASTER OF … · AN ABSTRACT OF THE THESIS OF RONALD JAMES...
77
AN ABSTRACT OF THE THESIS OF RONALD JAMES JAMESON for the degree MASTER OF SCIENCE (Name) (Degree) in FISHERIES AND WILDLIFE presented on December 20, 1974 (Major Department) (Date) Title: AN EVALUATION OF ATTEMPTS TO REESTABLISH THE SEA OTTER IN OREGON Abstract approved: During the summers of 1970 and 1971 a total of 95 sea otter (Enhydra lutris) were shipped to Oregon from Amchitka Island, Alaska. The 1970 shipment consisted of 31 otter which were to be released on the southern Oregon Coast near the town of Port Orford. Two of these animals died in holding pens and 29 were successfully released to the wild on 18 July 1970. A second shipment of 64 sea otter was divided into two groups. On 24 June 1971, 24 otter were released at Port Orford and 40 more were released near Cape Arago. Total documented mortality of the translocated sea otter consisted of eight animals, seven of these were found within 1 week of the releases. During the study period reports of sea otter were distributed from Tillamook Head to Brookings, Oregon, a distance of approxi- mately 276 miles. A single report was received from Tolvana Beach, Oregon, 181 miles north of the nearest release site.
Transcript of RONALD JAMES JAMESON for the degree MASTER OF … · AN ABSTRACT OF THE THESIS OF RONALD JAMES...

AN ABSTRACT OF THE THESIS OF
RONALD JAMES JAMESON for the degree MASTER OF SCIENCE (Name)
(Degree)
in FISHERIES AND WILDLIFE presented on December 20, 1974(Major Department)
(Date)
Title: AN EVALUATION OF ATTEMPTS TO REESTABLISH THE
SEA OTTER IN OREGON
Abstract approved:
During the summers of 1970 and 1971 a total of 95 sea otter
(Enhydra lutris) were shipped to Oregon from Amchitka Island,
Alaska. The 1970 shipment consisted of 31 otter which were to be
released on the southern Oregon Coast near the town of Port Orford.
Two of these animals died in holding pens and 29 were successfully
released to the wild on 18 July 1970. A second shipment of 64 sea
otter was divided into two groups. On 24 June 1971, 24 otter were
released at Port Orford and 40 more were released near Cape Arago.
Total documented mortality of the translocated sea otter consisted of
eight animals, seven of these were found within 1 week of the releases.
During the study period reports of sea otter were distributed
from Tillamook Head to Brookings, Oregon, a distance of approxi-
mately 276 miles. A single report was received from Tolvana Beach,
Oregon, 181 miles north of the nearest release site.

Concentrations of otter were established at two locations during
1972, Simpson and Blanco reefs. The number of animals that could.be
observed at either of these sites seemed to be related to the season,
with most otter using Simpson Reef during the winter months, sub-
sequently moving to Blanco Reef 35 miles to the south as the weather
subsided. The use patterns for 1972-73 were similar to those for
1971-72; however, the number of otter using Simpson Reef during the
winter of 1972-73 was less than for the previous winter, suggesting
that a portion of the herd may have remained in the vicinity of Cape
Blanco during winter 1972-73. It is estimated that 30-35 sea otter
were on the coast at the termination of this study (5 October 1973).
The first sea otter pup was sighted on 20 February 1972, 19
months after the 1970 release at Port Orford. Subsequently nine
more pups were observed during the study period: three in 1972 and
six in 1973.
Data on food habits were gathered at Simpson Reef. Sea urchins
(Strongylocentrotus spp. ) comprised the major portion of the sea
otter's diet and accounted for nearly 64 percent of the total number of
observations. Mollusks accounted for 14.4 percent and several
species of crabs comprised 5.2 percent. Underwater surveys of 13
areas indicate that sea urchins are the most abundant macroinverte-
brates normally preyed upon by sea otter. They occur at densities of
up to 47 purple sea urchins (S. purpuratus) per 0.25 m2 , with red sea

urchins (S. franciscanus) occurring as high as an estimated six to
eight animals per 1 m2 .
Results of this study indicate that approximately one-third of the
Oregon coastline is suitable for sea otter habitation; approximately
80 percent of the suitable area is situated along the south coast from
Coos Bay to the Oregon-California border, with the remainder in the
central region near the town of Newport.
Both sites chosen for the translocations contain good sea otter
habitat; however, because of greater probability of human-related
mortality and environmental pollution and the lesser amount of con-
tiguous sea otter habitat in the vicinity of Cape Arago than near Port
Orford; the latter appears to have been the better site.
It is suggested that in the future, translocated sea otter be
tagged to facilitate their identification. Recommended management of
the translocated otter in Oregon includes establishment of refuges,
protection of the otter and their habitat, and periodic shoreline and
aerial surveys to ascertain population growth and range expansion.

An Evaluation of Attempts to Reestablish theSea Otter in Oregon
Ronald James Jameson
A THESIS
submitted to
Oregon State University
in partial fulfillment ofthe requirements for the
degree of
Master of Science
June 1975

APPROVED:
Professor of Wildlife Eco
in charge of major
Le-`74a1r,„." Head of Department of Fisheries and Wildlife
Dean of Graduate School
Date thesis is presented December 20, 1974
Typed by Clover Redfern for Ronald James Jameson

ACKNOWLEDGMENTS
For their help and criticism throughout the study I wish to extend
my gratitude and appreciation to Professor Howard M. Wight, my
major professor, and Dr. E. Charles Meslow. I would also like to
thank Dr. Theodore P. Kistner and Dr. Robert M. Storm for their
critical review of this report.
Much of the knowledge I gained during my stay at Oregon State
University was derived from informal discussions with graduate
students of the Department of Fisheries and Wildlife, particularly
James Tabor and Michael Vaughan. I thank them for sharing their
knowledge and perceptions with me.
Subtidal surveys could not have been completed without the able
assistance of diver-biologists, Dr. Anthony Gharrett, Donald Holm,
John Richards, and Gerald Rowan. Oliver Stephenson acted as diver-
tender on several occasions.
Others who in some way contributed to this study either by
giving advice, supplying information, or lending logistic support
include: William Hall (biologist, Oregon State Wildlife Commission),
Richard Kelly (commercial fisherman), Karl Kenyon (biologist, U.S.
Fish and Wildlife Service), Dr. Bruce Mate (biologist, Oregon State
University), Richard Rodgers (Refuge Manager, William L. Finley
National Wildlife Refuge), Karl Schneider (biologist, Alaska
Department of Fish and Game), and Paul Wild (biologist, California
Department of Fish and Game).
Financial support for this study was supplied by the United
States Fish and Wildlife Service through the Oregon Cooperative Wild-
life Research Unit.
To my wife, Gwen, and to my children, Steven and Robin, go my
deepest appreciation and love for their patience and the sacrifices they
made which allowed me to complete this study. Their support was and
is irreplaceable.

TABLE OF CONTENTS
Chapter Page
I. INTRODUCTION 1Oregon History 2Natural History 4Sea Otter Translocations 5
Alaska 5California 6British Columbia and Washington 6Oregon 7
Objectives of This Study 8
II. METHODS AND MATERIALS 9Distribution and Abundance 9Food Habits 9Habitat Description 10
III. DESCRIPTION OF STUDY AREA 12General View 12Areas of Intensive Study 14
IV. RESULTS AND DISCUSSION 16Distribution and Abundance 16
Results 16Discus sion 24
Reproduction of Translocated Sea Otter 30Results 30Discussion 31Pup Maturation and Dependency Period 35
Food Habits and Food Availability 39Results 40Discussion 51
Potential Sea Otter Habitat in Oregon 54Results 54
North Coast 54Central Coast 55South Coast 56
Discus sion 56
V. CONCLUSIONS AND RECOMMENDATIONS 57Evaluation of Translocations 57Future Translocations of Sea Otter 59Management 60
LITERATURE CITED 63

LIST OF TABLES
Table Page.
1. Relative abundance ratings assigned to potential seaotter prey species encountered in qualitative benthicsurveys. 11
2. Criteria used to assess potential sea otter habitats inOregon. 11
3. Summary of sea otter sightings made in Oregon subse-quent to the July 1970 release and prior to the initiationof this study on 2 November 1971. 17
4. Sea otter use of Simpson and Blanco reefs, January1972-September 1973. 21
5. Sea otter sighted on aerial surveys of the Oregon Coast1971-1973. 22
6. Documented mortality of translocated sea otter, July1970 -October 1973. 25
7. Sea otter sighted on 23 shoreline surveys of Simpson,Blanco and Orford reefs completed from 19 February1972-15 August 1973. 26
8. Summary of sightings of sea otter pups in Oregon,1 November 1971-5 October 1973. 30
9. Summary of relative ages and sex ratios of sea ottertranslocated to Oregon in 1970 and 1971. 33
10. Elapsed time from release dates of sea otter to date ofpup sighting. 34
11. Food items ingested by sea otter at Simpson Reef,June-August 1972. 41
12. Test diameters and weights of five red sea urchinscollected at Nellie's Cove, Oregon on 17 August 1973. 42

Table page
13. Test diameters and weights of 21 purple sea urchinscollected at Nellie's Cove, Oregon on 28 July, 1973. 43
14. Results of quantitative underwater surveys of macro-invertebrates occurring at Simpson Reef, Oregon. 45
15. Abundance of macroinvertebrates encountered during10 subtidal surveys conducted along the southern coastof Oregon during August and September 1973. 47
16. Comparison of foods eaten by sea otter at Simpson Reef,Oregon and occurrence of these prey species in thequantitative sample from the same location. 52
17. Percent occurrence of selected macroinvertebratesutilized as sea otter food items in California and Oregon. 52

LIST OF FIGURES
Figure Page
1. Map of the Oregon Coast indicating sites mentioned inthis report, including release locations for the 1970and 1971 sea otter translocations. 13
2. Sea otter use of Simpson and Blanco reefs, January1972-September 1973. 23

AN EVALUATION OF ATTEMPTS TO REESTABLISH THESEA OTTER IN OREGON
I. INTRODUCTION
Before exploitation and near extirpation by Russia, Spain,
Great Britain, and the United States, sea otter ( ...EILha lutris)
ranged from the northern islands of Japan to the central coast of Baja
California. Exploitation of the otter began soon after the discovery
of the Commander Islands by Vitus Bering in 1741. It was in the same
year that sea otter were first described by George Wilhelm Steller
(Kenyon 1969).
Exploitation continued for 170 years (Wild 1972); during this
period sea otter were eliminated from much of their range. Remnant
populations remained only in the Aleutian and Commander Islands of
the North Pacific, and along the coast of central California. In 1911
protection was afforded the species under the International Fur Seal
Treaty; and, subsequently, population numbers increased and avail-
able habitat began to fill. Current estimates put the California popu-
lation at 1600-1800 and the Alaskan population at 50,000 otter (Wild
and Ames 1974). Thus, it appears the species has reoccupied a por-
tion of its former range and is not in any immediate danger of extinc-
tion, although local populations may be endangered by the threat of oil
spills.

2
Ore on Histo
The presence of sea otter was first recorded in Oregon in 1772
when Robert Gray purchased 150 pelts from Indians near the
mouth of the Columbia River (Scheffer 1940). Vernon Bailey (1936)
lists several sea otter records for Oregon: Lewis and Clark reported
that the Clatsop Indians commonly wore sea otter skins; Franchere,
in 1811, also traded for otter skins with the same tribe near the mouth
of the Columbia. Bailey also lists reports from: J. K. Townsend,
Port Orford in 1839; George Gibbs, Port Orford and the mouth of the
Columbia River in 1855 and 1856; and George Suckly and R. W. Dunbar
sent skulls collected at Port Orford to the National Museum in 1856
and 1859.
Scammon (1968) states that the Cape Blanco area was a favorite
hunting ground for those pursuing sea otter. According to Bailey
(1936) the period of profitable hunting ended in Oregon in 1872.
Nash (1919), while traveling with Henry Moseley, former
naturalist aboard the "Challenger" with Charles Darwin, observed a
sea otter carcass at Newport, Oregon in 1877. No reference was
made as to the location of the animal's capture; however, the only
good sea otter habitat in the area extends from Newport north to
Depoe Bay. Nash states that Moseley was able to obtain the otter's
skeleton which he later took to England and placed in the Oxford

Museum. By 1877, according to Nash, sea otter had been nearly
extirpated from Oregon and one otter might represent a year of work
for a sea otter hunter.
Sherrell (1970) reported that two sea otter were taken near the
mouth of the Rogue River in 1888; however, the specimens were not
placed in any museum collection or otherwise documented (Olterman
1972), therefore the credibility of this report is questionable.
Kenyon (1969) cites a letter he received in 1965 which describes
the taking of a sea otter near Newport in 1906. This is presumably
the last sea otter taken in the area, and may have been the last of the
original population in Oregon.
Prior to the translocations, Pederson and Stout (1963) published
the most recent record of a sea otter in Oregon. They observed in
August and November of 1961 and February of 1962 what they identified
as a sea otter. All observations were made on the northern Oregon
Coast near Neakanie. The only descriptive material given was that
the animal was feeding and initially was thought to be an immature
seal. A physical and behavioral description would have added credi-
bility to their account, especially in view of the rarity of such a
sighting. Kenyon (1969) believed the otter was probably a wandering
individual from southeastern Alaska or California and did not indicate
a viable sea otter population remaining in Oregon.
Bailey (1936) interpreted his sources to indicate that sea otter.
inhabited the entire Oregon coastline. However, other records indi-
cate only three major areas of concentration: the mouth of the
Columbia River, the Newport vicinity, and the Cape Blanco to Pistol
River section (Scammon 1968, Nash 1919, Kenyon 1969). The pre-
ponderance of historical data comes from Oregon's south coast indi-
cating that sea otter were probably most abundant in this region with
smaller numbers inhabiting areas to the north.
Natural History
Sea otter are the only members of the genus Enhydra and are
considered recent invaders of the marine environment (Kenyon 1969).
They are the largest of the family Mustelidae and the smallest marine
mammal. Adult males weigh up to 100 pounds and adult females may
attain 72 pounds (Kenyon 1969).
Sea otter inhabit the nearshore marine environment, preferring
areas where rocky headlands, sea stacks, and offshore reefs occur.
Kelp beds are found in many areas of sea otter habitation and are
preferred resting areas when present.
Sea otter are polygamous and reach sexual maturity at 3-4 years
of age; females produce a single pup approximately every 2 years
thereafter (Kenyon 1969, Schneider 1973).
•

Sea otter prey primarily on marine invertebrates and benthic
fishes, and their diets may vary somewhat depending upon availability
of prey species. Their energy requirements are high, and thermo-
regulation is accomplished by combining a high metabolic rate with an
extremely dense pelage which traps a thin insulating layer of air within
it (Kenyon 1969).
Sea Otter Translocations
Alaska
Early attempts to translocate sea otter were unsuccessful. Upon
release into new habitat the otter suffered from and, subsequently,
died of exposure (Kenyon 1969). Failure to successfully translocate
sea otter before 1959 was directly attributed to inadequate knowledge
of the animal's needs in captivity and transportation (Kenyon and
Spencer 1960). Later studies indicated that during the interim
between capture and release the otter's fur became soiled and matted,
which destroyed its insulative quality. This problem was eventually
alleviated by holding otter in tanks containing circulating sea water
which allowed them to adequately groom their fur.
The first apparently successful translocations of sea otter were
made in 1965 and 1966 when a total of 43 otter were liberated in Klag
Bay, southeastern Alaska. In 1967 Alaska Department of Fish and
Game biologists completed a 6-day survey of the release area and

6
tallied nine sea otter including a female with a young pup (Schneider
1968). No in-depth studies have been conducted on translocated sea
otter in Alaska (K. Schneider personal communication).
California
The first translocations outside of Alaska took place in
California from January to August 1969; 17 sea otter were moved a
distance of 45 miles (Odemar and Wilson 1969). The attempt was
deemed unsuccessful since tagged otter were observed near the cap-
ture site shortly after translocation, and subsequently no tagged
animals were observed at the release site (Odemar and Wilson 1969,
Wild and Ames 1974).
British Columbia and Washington
Translocations of sea otter from Amchitka Island, Alaska to
portions of their former range, outside of Alaska, began in 1969.
British Columbia received three shipments of sea otter, 29 in 1969,
14 in 1970, and 46 in 1972 (Cameron 1972). No follow-up studies were
conducted although infrequent sightings have been made by biologists
and coastal visitors (Ian D. Smith personal communication).
During the summers of 1969 and 1970 sea otter were released
along the Washington coast near the town of La Push. Many of the
otter released in 1969 died, and the success of the 1970 liberation of

30 otter is unknown (Burton Lauckhart personal communication).
Oregon
Two translocations totaling 93 sea otter have been made in
Oregon. Twenty-nine were released near Port Orford, Oregon on
18 July 1970. A second release of 64 sea otter was made on 24 June
1971: 40 were liberated at Simpson Reef approximately 3 miles south
of the mouth of the Coos River; and 24 were released at Port Orford.
Otter released in 1970 were flown to an airport near Port
Orford. They were then transported to Port Orford and placed in
floating holding pens designed by the Alaska Department of Fish and
Game. After a 2-day holding period, the pens containing the otter
were towed approximately 3 miles south to Redfish Rocks where they
were liberated.
Two release sites were selected for the June 1971 translocation,
South Cove of Cape Arago, and Port Orford. Upon arrival the otter
were to be placed in holding pens; however, because of an unseason-
able storm the otter were released directly to the open water from
their carrying cages.

8
Objectives of This Study
Kenyon (1969) posed several questions regarding the fate of
translocated sea otter: Will they scatter upon release thus failing to
form breeding colonies? Will they attempt to return to their "home
territory"? Will human encroachment and habitat pollution inhibit the
establishment of a viable population? Such questions were instrumen-
tal in formulating the following objectives of this study:
1. Evaluate the short-term success of attempts to reestablish
sea otter along the coast of Oregon by:
a. documenting the distribution and abundance, and repro-
ductive success of the translocated otter.
b. documenting otter food habits and assess the availability
and abundance of potential food species.
c. documenting habitats favored by translocated sea otter.
2. Identify potential sea otter habitat along the Oregon Coast.

II. METHODS AND MATERIALS
Distribution and Abundance
Distribution and abundance records were obtained by several
methods. Reports of sea otter sightings by coastal observers, such
as fishermen and biologists were requested; and the southern Oregon
Coast was periodically searched using a telescope (40-80X) from
observation points. Offshore reefs were searched by boat and aerial
survey. Aerial surveys were flown at altitudes ranging from 100 to
500 feet; airspeed varied, depending upon the type of aircraft, from
70 to 150 mph.
Food Habits
Sea otter characteristically bring food to the surface before
eating (Murie 1940, Daughtery 1972, Kenyon 1969). With a telescope
I was often able to identify the foods brought to the surface and eaten
by otter at Simpson Reef. Observation periods ranging from 1-5
hours were spent at this location, depending upon the level of the tide.
To complement the food habit portion of this study an underwater
survey was made of Simpson Reef to assess the relative abundance
and availability of sea otter prey.

10
Quantitative sampling of the benthos was accomplished with the
aid of SCUBA (self contained underwater breathing apparatus). A plot
transect method was used. Those sites receiving foraging use by sea
otter were sampled by swimming a compass transect at the surface
and approximately every 10 meters dropping a 0.25 m2
or 1.0 m2
metal frame which settled to the bottom. I then dove and recorded the
number and species of each potential otter food item that was wholly
or partially inside the frame. Only invertebrates equal to or larger
than turban snails (Tegula spp. , 2-3 centimeters in diameter) were
recorded. Also recorded for each plot were character of substrate
and depth of water. Depths were taken with an oil filled depth gauge.
Qualitative underwater surveys of several areas were completed.
Invertebrates encountered during the survey were assigned a relative
abundance rating (Table 1). In addition, character of substrate (rock,
rock-shell, shell, gravel, or sand) and depths were recorded. The
areas surveyed were selected on the basis of current sea otter use or
on their suitability as potential sea otter habitat.
Habitat Description
Sites utilized by sea otter were described. Descriptions included
major vegetational types, physiography of shorelines and emergent
reefs, depth of water, and character of benthic substrates. These
data were obtained from Coast and Geodetic Survey navigational

11
charts, aerial photographs, and on-site observations from above and
below the water surface (Table 2).
Table 1 Relative abundance ratings assigned to potential sea otterprey species encountered in qualitative benthic surveys.
A: Abundant - Species encountered in suitable habitats at highdensities on suitable substrates.
C: Common - Species encountered on suitable substrates throughout sample area but at lower densities than above.
U: Uncommon - Species encountered, but not on all suitable sub-strates and at low densities.
R: Rare - Species encountered only one or two times duringsurvey.
P: Present - Species observed but not given an abundance rating(motile and burrowing species were usually placedin this category),
Table 2. Criteria used to assess potential sea otter habitat in Oregon.
1. Presence of rocky headlands, capes, islands and/or sea stacks.
2. Presence of extensive submergent reefs.
3. Presence of kelp beds.
4. Relative abundance and availability of food resources.
5, Presence of areas offering protection from winter and summerstorms.
6. Water depth less than 20 fathoms.
7. Water relatively free of pollution and threat of pollution.
8. Human encroachment minimal.

12
III. DESCRIPTION OF STUDY AREA
General View
The general study area included the entire coast of Oregon
(Figure 1). The area extending south from the mouth of the Columbia
River is characterized by rocky capes and headlands separated by
low sand dunes and sand beaches of various lengths. Sea stacks are
relatively common from Tillamook Head to Cape Foulweather. The
ocean floor from Tillamook Head to Lincoln City is primarily mud and
sand, but rock substrates predominate from Lincoln City to the mouth
of the Yaquina River. Beds of bull kelp (Nereocystis luetkeana)
extend over an area of approximately 625 acres in this region
(Waldron 1955).
The coastline from Yaquina Bay to Heceta Head consists of
intrusive basalt headlands separated by sand beaches, with sand and
mud the predominating subtidal substrates. Beyond Heceta Head 53
miles of sand beaches and dunes extend south to the mouth of the Coos
River (Dicken 1965). Coos Head is the southern terminus of this
section of coast. Southward for approximately 7 miles, the coastline
is rugged and broken and the bottom rocky.
South of Cape Arago for 13 miles the coastline is comprised of
sand beach disrupted by a small sandstone intrusion and associated
reef (Five-Mile Point) and a series of sea stacks and small islands at

13Columbia River
Cape Foulweather
OREGON
CALIFORNIAFigure 1. Map of the Oregon Coast indicating sites mentioned in
this report, including release locations for the 1970and 1971 sea otter translocations.
Cape Lookout'-
Gull RockBlanco Reef\ Blacklock PointOrford Reef" Cape Blanco
Nellie's Cove Port Orford
Redfish Rocks /Humbug Mtn.

14
the mouth of the Coquille River. A sand beach, 10 miles in length,
extends from Coquille Rocks to Blacklock Point. Beyond this point
the coastline becomes broken, beaches are shorter, and offshore
seastacks and reefs are relatively common. The coastline continues
in this manner to the Oregon-California border.
Areas of Intensive Study
Two areas used by sea otter received intensive study, Simpson
and Blanco reefs. Simpson Reef is an offshore rock area consisting
primarily of erosion resistant sandstone (Ehlen 1967). Two emergent
reefs lying roughly parallel to each other and to the mainland are the
predominant physiographic features. Substrates are primarily bed-
rock with many depressions and crevices filled with the broken shells
and tests of mollusks and sea urchins (Strongylocentrotus sp. ). The
mean tidal range for the vicinity is 5.2 feet (Bourke and Glenne 1971).
According to Waldron (1955) 358 acres of kelp lie between Coos
Bay and Cape Arago; much of this acreage is found at Simpson Reef.
Simpson Reef is the only location along the Oregon Coast that supports
large beds of giant kelp (Macrocystis pyrifera). These beds account
for approximately 33 percent of the total kelp acreage at Simpson Reef;
bull kelp accounts for the remainder.
The invertebrate community at Simpson Reef is typical of those
found in similar habitats throughout Washington, Oregon, and northern

15
California (Ekmen 1953). Marine birds and mammals found at these
latitudes are also common at Simpson Reef.
Blanco Reef is comprised of eight emergent rocks; the outermost
is 1.12 miles offshore. Blackrock is the largest, approximately 40
yards in length. The orientation of Blanco Reef is north-south which
affords a considerable amount of protection from westerly seas. The
entire emergent portion of the reef lies within the 10 fathom contour;
the mean water depth of this area is 5.02 fathoms (30. 12 feet, depths
obtained from Coast and Geodetic Survey Navigational Charts). Sub-
strates are primarily rock with some depressions and crevices con-
taining sand and broken shells.
Blanco Reef supports floral and faunal communities similar to
those of Simpson Reef. The dominant emergent alga found here is bull
kelp. According to Waldron (1955) kelp beds at Blanco Reef range
from thin to dense and cover an area of 223 acres.

16
IV. RESULTS AND DISCUSSION
Distribution and Abundance
Results
Prior to the initiation of this study (1 November 1971) several
sightings of translocated sea otter were reported (Table 3). Within
7 days after the July 1970 release at Redfish Rocks at least one sea
otter had moved 40 miles north of the release site into the Coos River
estuary (B. Mate and B. Williams unpublished manuscript). A
survey conducted on 26 August 1970 indicated that sea otter were
distributed from Humbug Mountain, 3 miles south of the release site,
to Simpson Reef 46 miles north of Redfish Rocks (Oregon State Game
Commission 1970). This census tallied seven otter; the largest
single group contained three otter. Another survey was completed by
Bruce Mate (personal communication) on 19 and 20 October 1970.
He observed 14 sea otter on this survey at five locations. The largest
groups were seen at Orford Reef (four otter) and Humbug Mountain
(four otter). The remaining three sites, Cape Blanco, Gull Rock,
and Coos Bay yielded two, three, and one otter respectively.
No confirmed sightings were reported from October 1970 until
26 April 1971 when three otters were sighted at Orford Reef. A

Table 3. Summary of sea otter sightings , made in Oregon subsequent to the July 1970 release andprior to the initiation of this study on 2 November 1971.
Date Location
Numb erof
Otter
Time LapsesFrom ReleaseDate in Days
Miles DistantFrom NearestRelease Point
197018 July: first translocation accomplished 2927 July Coos Bay 1 7 5026 August Humbug Mountain 3 37 3
Cape Blanco 2 37 11Simpson Reef 2 37 46
19-20 October Humbug Mountain 4 49-50 3Cape Blanco 2 49-50 11Gull Rock 3 49-50 13Orford Reef 4 49-50 9Coos Bay 1 49-50 50
197126 April Orford Reef 3 188 92 May Bastendorff Beach 1 194 4724 June: second translocation accomplished 6425 June Simpson Reef-Gregory Point 11 1 0-229 June Meyers Creek 1 5 3523 July Cape Blanco 3 29 9
Fivemile Point 2 29 6Simpson Reef 3 29 0
31 July Blacklock Point 5 37 1321 September Simpson Reef 2 89 44
18
subsequent survey on 2 May 1971 yielded one otter just south of the
mouth of the Coos River (Mate unpublished data).
The second release was made on 24 June 1971. One day after
the liberation a survey of the Cape Arago area yielded 11 otter, all
within 2 miles of the release point (B. Mate personal communication).
On 29 June I observed a single sea otter 35 miles south of Port Orford
near the mouth of Meyers Creek. Whether this animal was from the
1970 or 1971 release is unknown. During the 3-month period subse-
quent to the 24 June releases sea otter were sighted at five locations
(Table 3), and were distributed from Meyers Creek to Simpson Reef
a distance of approximately 75 miles.
I began field work on this study on 2 November 1971. During
the 2-year study period I received 26 reports of sea otter from fisher-
men and coastal residents. Reports were distributed from Tillamook
Head to Brookings, Oregon, a distance of 276 miles.
The validity of many of these reports is questionable due to the
inexperience of many observers. River otter (Lutra canadensis),
harbor seals (Phoca vitulina), fur seals (Callorhinus ursinus), and
sea lions (Eumetopias jubata and Zalophus californianus) may all be
observed in the nearshore marine environment and could be mistaken
for sea otter by an inexperienced observer. All trips to report sites
yielded no observations of sea otter, but two reported sightings do
warrant consideration. On 10 June 1972 four to five sea otter were

19
reported, near Neskowin, Oregon, 128 miles north of the nearest
release site. A description of the animals and their behavior was
supplied by the observer and supported his conclusion that they were
sea otter. A second report of three sea otter was made by a pro-
fessional naturalist with experience observing sea otter along the
central coast of California. The animals were observed, with the aid
of binoculars, from a distance of 50 feet near Tolovana State Park,
181 miles north of Cape Arago (Christian Nelson personal communica-
tion). I consider this report to be valid and representative of the
northernmost sighting of sea otter in Oregon since the 1970, 1971
reintroductions.
The apparent distribution of the translocated sea otter is
reduced when only confirmed sightings are considered. Most sea otter
habitat in Oregon is located along the southern portion of the coast
relatively close to the release sites; therefore, I conducted a more
concerted search in this region. During 1971 sea otter were distrib-
uted over a distance of approximately 75 miles and were sighted at
seven locations. In 1972 they were observed at four locations; how-
ever, three of the sites were located within 5 miles of each other.
By 1972 and throughout 1973, the translocated sea otter were distrib-
uted over a 40 mile coastal section with Orford Reef the southern
terminus and Simpson Reef the northern limit. Areas of otter concen-
tration were Simpson and Blanco reefs.

20
Movements of sea otter are not well known. Kenyon (1969)
stated that the home range of a sea otter extends over probably no
more than 10 miles of coastline. Lensink (1962:95) states that "sea
otters generally have not tended to exploit unoccupied areas, even
when adjacent regions offer suitable habitat and no barriers exist to
retard movements." This statement supports Kenyon's opinion that
sea otter occupy a limited home range and further implies that a fairly
strong affinity for an area may exist.
The average number of sea otter observed per observation day
during January of 1972 at Simpson Reef was 6.5 (Table 4). By March
of the same year the average had increased to 17.6. The April figure
of 15.0 marked the initiation of a decline in use of Simpson Reef that
continued throughout subsequent months reaching a low point in
September. A census made at Simpson Reef on 8 October 1972
yielded three sea otter indicating little change in the number of ani-
mals using the reef since the previous month. However, counts made
later in October increased, thereby increasing the average for the
month to 5.8. This increase continued until December when the aver-
age was 13.3. Numbers of otter at Simpson Reef during the month of
December 1972 ranged from 11 to 15, the greatest sea otter use for
any period during the 1972-1973 winter. The use pattern for the

Table 4. Sea otter use of Simpson and Blanco reefs, January 1972-September 1973.
Month
1972 1973Simpson Reef Blanco Reef Simpson Reef Blanco Reef
X N Range X N Range X N Range X Range
Jan 6.5 2 5-8 - 11.0 2 10-12 - -
Feb 14. 3 4 8-21 -- - 12.0 2 12-12 - -Mar 17. 6 5 14 -20 _ 9. 8 4' 9-10 7.0 2 7-7Apr 15.0 4 12-18 - 5.3 7 1-10 12.5 6 4-19May 9.3 6 3-16 - 1.3 6 0-4 16.7 6 14-19Jun 3.9 7 2-6 - - 0.0 5 0 14.8 4 15-18Jul 5.7 14 4-7 - - 0.5 4 0-2 17.9 7 15-21Aug 4.4 18 2-9 14.0 6 10-16 0.0 7 0 18.3 6 16-20Sep 1. 7 7 0-3 14.7 3 12-18 - - 19.0 1 19Oct 5.8 5 3-8 0.0 1 0Nov 10. 8 5 8-13 -
Dec 13. 3 6 11-15 0.0 1
Sum of daily census counts X -
Number of census days (N)

22
1972-73 winter was similar, but not identical, to the one for 1971-72
(Figure 2). The 1973 maximum figure occurred at a lower level and
earlier than the 1972 peak.
Surveys of Orford and Blanco reefs were limited during the
1971-72 winter; however, data from shoreline and aerial surveys
indicate that sea otter were present at least until the middle of
December (Table 5).
Table 5. Sea otter sighted on aerial surveys of the Oregon Coast1971-1973.
Date
Location of Otter Sightings
Survey AreaOrfordReef
BlancoReef
GullIsland
SimpsonReef
19 Dec. 1971 2 2 4 Coos Bay-Calif.26 Apr. 1972 0 0 0 13 Coos Bay-Calif.26 Jun. 1972 2 0 0 3 Entire Coast4 Jun. 1973 0 10 0 0 Entire Coast
29 Jun. 1973 0 15 0 0 Entire Coast
I first observed relatively large numbers of sea otter at Blanco
Reef (10 otter) on 2 August 1972 (Table 4). Surveys of Blanco Reef
completed on 7 October, 28 December and 19 March 1973 were nega-
tive. Surveys of Blanco Reef on 23 and 24 March 1973 each yielded
7 otter indicating recent immigration to the area. Sea otter were
observed on all subsequent surveys of Blanco Reef to the time field
work was terminated on 5 October 1973, and the average number seen
for the period was 16.4 (sd=3.6).

07—•
FMAMJJA1973
•
20
cdrj
0--a
a)ri)_0 150pi
rja)
a)
O• 10
a)
0•
a)a)
0
a) 5
ca
-0
a)
Figure 2. Sea otter use of Simpson and Blanco reefs, January 1972-September 1973.

24
Discussion
Upon liberation the translocated sea otter initially scattered and
several moved considerable distances from the point of release. After
the 1970 liberation, the otter apparently moved in small groups over
a section of coast from 3 miles south to 50 miles north of Redfish
Rocks. Moreover, no sea otter were observed near the release site
in any of the subsequent surveys. After the 1971 release, a shoreline
survey from Cape Arago north to Coos Bay yielded 11 sea otter 1 day
after the June 1971 release (B. Mate unpublished manuscript). This
sighting accounts for 28 percent of the 40 otter released in the area,
and it raises a question regarding the fate of the remaining 29 ani-
mals, Possible explanation for this disparity include: inaccurate
counts, high post-release mortality, or emigration. Surveys (129
during the study) of Simpson Reef and vicinity yielded a maximum
count, excluding pups, of 20 sea otter. Thus, never more than 50
percent of the number of sea otter liberated in 1971 were observed.
Documented post-release mortality is insufficient to resolve the
disparity between the number of otter released and the number
observed on later surveys (Table 6). Emigration seems to be the
most plausible explanation for the disappearance of a large portion of
the otter released at Simpson Reef .

25
Table 6. Documented mortality of translocated sea otter July 1970-October 1973, Oregon: M = male, F = female, A = adult,P = pup, U unknown.
Year of Recovery Cause of
Recovery Date Sex Age Location Death
1970
1971
1973
18 July18 July
24 June
25 June24-28 June24-28 June24-28 June
3 Aug.
M UF U
U U
U UM PU UU U
M A
Port OrfordPort Orford
Port Orford
Simpson ReefPort OrfordSimpson ReefSimpson Reef
Cape Blanco
ExposureExposure
Drowned incage
UnknownUnknownUnknownUnknown
Unknown,carcassbadlydecomposed
Summary of Otter Mortality FemalesMalesUnknownTotalTotal otter translocatedPercent mortality
125 8
958.4
A considerable amount of the effort was directed at determining
the abundance of sea otter in Oregon after the reintroductions were
completed (Table 7). I estimate that a resident population of
sea otter numbering 30 to 35 animals, including pups was present at
the termination of this study. Therefore, of the 93 otter success-
fully released in Oregon an estimated 33-38 percent of that number,
including pups, were on the coast in June of 1973.

Table 7. Sea otter sighted on 23 shoreline surveys ofSimpson, Blanco and Orford Reefs completedfrom 19 February 1972-15 August 1973.
DateSimpson
ReefBlancoReef
OrfordReefb Total
20 February 1972 19 1 202 August 1972 9 10 19
15 August 1972 2 16 1818 August 1972 3 15 1824 August 1972 3 13 1630 August 1972 3 15 1813 September 1972 2 18 2024-25 March 1973 a 10 7 0 175 April 1973 10 4 146 April 1973 10 10 20
20 April 1973 3 15 1826 April 1973 3 13 1627 April 1973 5 14 194 May 1973 0 17 175 May 1973 0 19 19
18 May 1973 1 18 1924 May 1973 1 15 1625 May 1973 2 17 197 June 1973 0 16 0 16
29 June 1973 0 15 154 July 1973 0 15 15
20 July 1973 2 19 2315 August 1973 0 20 20
Mean 18
a .Simpson Reef was surveyed on 24 March and Blanco andOrford reefs were surveyed 25 March.
bAtmospheric conditions usually precluded searchingOrford Reef from shore.
26

27
Sea otter appear to have an affinity for a particular home range
(Lensink 1962, Khromovskikh 1968, Kenyon 1969). Translocated sea
otter upon being released into an unfamiliar environment may, there
fore, exhibit "homing" behavior. A California translocation of sea
otter suggests that this does occur. Observations made within 2
months of the release (17 otter were translocated) indicated that at
least 29 percent of the translocated otter had returned to the capture
site (Odemar and Wilson 1969).
Nelson's (1972 personal communication) observation of three
sea otter on 24 August 1972, 181 miles north of the nearest Oregon
release site, suggests that otter may move considerable distances
after being liberated. Whether these were sea otter released in
Oregon, Washington, or British Columbia is a matter of conjecture;
however, since no resident populations were known to exist in these
areas it can safely be assumed that the otter probably came from one
of the translocation sites.
Why some sea otter may scatter and move significant distances
after being released and others do not is unknown. Possibly, there is
a differential affinity for a home range among age classes. Range
expansion in California seems to be accomplished primarily by young
adult and subadult otter (Wild and Ames 1974). Perhaps subadult and
younger adult otter have not yet developed a propensity for a home
range and would, therefore, more readily accept a new environment.

28
The distributional patterns of sea otter suggests seasonal
movements. The patterns of sea otter use of Simpson Reef for 1972
and 1973 are similar, but not identical, with the heaviest use occur-
ring during the winter storm season (January-April), and the lightest
use occurring during the calmer summer months.
Previous workers have stated that seasonal movements of sea
otter are restricted to offshore movements during periods of calm
weather with a return to more protected waters, usually closer to
shore, during periods of storm activity (Barabash-Nikiforov 1947,
Lensink 1962, Kenyon 1969). To my knowledge no regular long
distance movements of sea otter have been reported. However, the
data gathered during this study indicated a seasonal movement of 35
miles between Simpson and Blanco reefs, rather than an onshore-
offshore movement described by previous workers.
Observations (Tables 4 and 5) suggest sea otter migrate between
Simpson Reef and Blanco and Orford reefs in response to inclement
winter weather conditions. The otter return to Blanco and Orford
reefs as severe weather subsides and the frequency of human
encroachment at Simpson Reef increases. Simpson Reef has good
summering habitat available, but the Cape Arago -Coos Bay section
receives intensive human use during the summer; therefore, human
encroachment should be included here as a possible cause of emigra-
tion.

29
Aerial surveys completed on 4 and 29 June 1973 of the entire
Oregon coastline yielded observations of sea otter only at Blanco
Reef. These otter were probably the same animals that had been at
Orford and Simpson reefs during the winter months.
Ten sea otter were sighted at Orford Reef on 29 December 1972.
This sighting may explain the comparatively lower counts on Simpson
Reef during the winter of 1972-73. Apparently a portion of the herd
chose to winter at Orford Reef.
The sighting of a newborn pup at Simpson Reef on 21 October
1972 and its subsequent disappearance after 3 November, and the later
sightings of a 4-5 month old pup on Blanco Reef on 30 March 1973,
also suggest seasonal movements. These data do not preclude, how-
ever, the possibility that the older pup had been born in the vicinity of
Cape Blanco and escaped detection. Whether these movement patterns
become traditional will require further observations. Otter use of
Simpson Reef in 1972-73 has declined, and a single survey of the area
in February of 1974 yielded only three sea otter. Average otter use
for February 1972 and 1973 was 14.3 and 12.0 respectively.
Possibly the utilization of Simpson Reef by sea otter will decrease as
the animals become more familiar with the Blanco Reef area.

30
Reproduction of Translocated Sea Otter
Results
The first sea otter pup was sighted on 20 February 1972, 19
months after the July 1970 release at Port Orford. Subsequently,
three more young pups (less than 1 month old) were observed in 1972.
Three of the four pups were first seen at Simpson Reef, and one was
seen at Blanco Reef (Table 8).
Sightings of six otter pups were made during 1973, five at
Blanco Reef and 1 at Simpson Reef.
Table 8. Summary of sightings of sea otter pups in Oregon, 1 Novem-ber 1971-5 October 1973.
Year1972 1973
Date Location Number Date Location Number
20 Feb. Simpson R. 1 5 Apr. Simpson R. 124 Aug. Blanco R. 1 6 Apr. Blanco R. 121 Oct. Simpson R. 1 19 Apr. Blanco R. 127 Nov. Simpson R. 1 17 Jul. Blanco R. 1
13 Aug. Blanco R. 129 Aug. Blanco R. 1
Total 4 6
Copulation was observed on 17 occasions, nine in 1972 and six in
1973. Copulating pairs were observed on three occasions in December
1972 and March and April of 1973. No more than three such pairs
31
were observed in any month, with most months yielding only one
observation.
The duration of copulation was timed on three occasions during
1973. Periods lasted 2.95, 5.00, and 2.18 minutes (X = 3.38).
Breeding behavior was generally in aggrement with Kenyon's
description (1969). A male usually "tested" a female by approaching
and nuzzling her genitalia and hindquarters. If the female were
receptive, the pair would often leave the herd and begin a period of
rapid swimming and vigorous play prior to coitus.
Pre-copulatory activities appeared to be led by the female with
the male always the aggressor, but never the leader. The female
initiated any new activity such as feeding or grooming. Copulation
was often followed by a period of vigorous grooming after which the
pair would return to the herd, or begin a feeding period. I was unable
to determine if the otter remained together for more than the duration
of a single breeding sequence. Kenyon (1969) stated that a mated pair
may remain together for a 3-day period after the initial copulation;
Vandevere (1973) concurred with Kenyon's statement.
Discus s ion
Estimates of the length of sea otter gestation range from 7.5 to
13 months (Lensink 1962, Kenyon 1969, Schneider 1973). However, in
estimating the reproductive potential of a population the age of

32
reproductive maturity and the interim between births are of greater
significance than the actual length of the gestation period. Schneider
(1972:35) states that an average female sea otter "...has a pup every
2 years" and its first estrus in the third or fourth year of life.
In view of the current knowledge of the reproductive biology of
sea otter, the growth rate of the translocated population will be slow.
The sex ratios and relative ages of sea otter translocated to Oregon
are partially known (Table 9); however, there is no way of knowing
which otter survived the translocation or remained within the study
area. Because of this, a prediction of the potential growth rate of the
population cannot be made utilizing relative age and sex ratio data.
The first pup was observed on 20 February 1972 at Simpson
Reef, 8 months after the June 1971 liberation and 19 months after the
1970 Port Orford release. This pup could have been conceived in
Alaska; however, all subsequent pups would have resulted from repro-
ductive activity by otter in Oregon, since sufficient time for a com-
plete gestation period would have elapsed (Table 10).
The age distribution of a population is an important factor in
determining its reproductive potential. Of the 95 sea otter shipped to
Oregon, at least 37.9 percent were adult females and 9.5 percent
were adult males.
Schneider (1972) reports that sexually mature female sea otter
may develop large follicles each year but if accompanied by

Table 9. Summary of relative ages and sex ratios of sea otter translocated to Oregon in 1970 and1971.
Sex and Age Composition of Translocated Sea Otter
YearFemales Males Grand
TotalAdult Subadult Unknown Total Adult Subadult Unknown Total
1970a 8 7 6 21 5 5 10 31
1971 28 12 3 43 4 16 1 21 64
Total 36 19 9 64 9 21 1 31 95
aOne male and one female died in the holding pens at Port Orford in 1970; therefore, of the 31 ottershipped to Oregon in 1970, 29 were successfully released. No age information for either the maleor female was located. The total number of otter successfully released for both years is 93.

34
dependent pups normally do not mate. Anestrous females having
recently weaned a pup may not enter estrus immediately, but will
. Hrest u for a few months before breeding again. If, however, a
pregnancy fails, or the pup dies, the female may breed again within a
few weeks of the pup's death.
Table 10. Elapsed time from release dates of sea otterto date of pup sighting.
Month and Yearof Sighting
Time Lapse FromYears of Release
(Months)
Number of NewPups Sighted Each
Month
1970 1971
February 1972 19 8 1August 1972 25 13 1October 1972 27 15 1November 1972 28 16 1
April 1973 33 21 3July 1973 36 24 1August 1973 37 25 2
Total 10
In view of this information it appears that adult female otter
released in Oregon should have bred within a relatively short time
(1-4 months) after being released; and, consequently, several pups
would have been produced during the first year. The data collected
during this study indicate that this did not occur. The reasons for the
delay in reproduction remain unknown.

35
Researchers in California and Alaska have noted that small sea
otter pups are observed more frequently at certain times of the year
than at others. Vandevere (1973) reported the peak period of pupping in
California as occurring during the fall and winter months (November-
March). Kenyon (1969) reported that parturition may occur at any
season, although new-born pups are observed more frequently during
March and April. Schneider (1973) reports a more well defined per-
iod of pupping for otter in Alaska. His results, which were based on
the examination of 1178 female reproductive tracts, suggest a
primary pupping season beginning in April, peaking in May, and
falling off in June.
The translocated otter have produced at least 10 pups; 70 per-
cent of these were born during the period from April to August.
These data seem to suggest a temporal pattern, with most births
occurring during the mid-spring to late summer period, with a pos-
sible peak in April.
Pup Maturation and Dependency Period
A pup first observed on 20 February 1972 remained at Simpson
Reef until 11 August 1972. During this period I made regular visits
to the area and recorded the physical and behavioral development of
the young otter.

36
A considerable body of literature exists regarding the
female-pup relationship; however, none of these reports deal with the
development of a single known age pup (Fisher 1940, Lensink 1962,
Kenyon 1969, Sandegren et al. 1973). The pup discussed here was
observed on a weekly basis, excepting a 30 day period from 14 May-
14 June. Female and pup were not observed at Simpson Reef after
11 August.
At the initial sighting, the pup was helpless and could only nurse
and move its head weakly while lying on the female's abdomen.
According to Kenyon (1969), sea otter pups remain helpless during the
first few weeks of life. Based upon descriptions of sea otter pups
given by Pearson (1952) and Kenyon (1969) I estimated the age of the
pup discussed here as 2-3 weeks at the time of the initial sighting,
and it was probably born in early February.
By 25 February the pup, when in the water, was able to make
uncoordinated movements of its limbs but was unable to swim. Swim-
ming was first noted on 19 March, and was accomplished in a belly
down position. Although awkward and inefficient the pup was able to
swim in a non-random direction by this time.
The female appeared to offer the pup solid food once during this
early period, but subsequently gave solid food only on demand. The
pup was first noted soliciting for solid food on 31 March and made its
first attempts to dive, although unsuccessfully, on this date.
37
In early April the pup began resting in the water perpendicular to the
female with its head supported by the mother's chest. However, when
the pair moved to a new location the female still carried the pup even
for short distances.
By mid-April the pup could swim poorly on its back and by early
May it was diving and procuring nonfood items. Upon surfacing with
an object the pup would, bite it a few times or pound it against its
chest, discard the item, and dive again. This sequence was usually
repeated several times, and a series was often terminated by the pup
soliciting food from the female. No obvious changes in the pup's
behavior were noted during the remainder of May.
By late June the pup was still taking food, and was occasionally
groomed by the female, although it was capable of grooming itself.
The pounding behavior had become more refined: rather than pounding
a single item against its chest, two items, still nonedibles, were
pounded one against the other. No objects obtained by the pup were
observed to be ingested.
I first observed the pup capturing and consuming small prey
items during its fifth month; however, it still depended on the female
to supply much of its food. Purple sea urchins (Strongvlocentrotus
purpuratus) were being gathered by the young otter, but it was unable
to penetrate the urchin's test. Consequently, they were not ingested
but were discarded. By the end of July, when slightly over 6 months

38
old, the pup was obtaining much of its own food, could open purple sea
urchins with the aid of a stone, and appeared more independent of the
female. The female, however, would still surrender food to the pup
upon demand. Little change in the pup's development was noticed
between 31 July and 11 August.
Kenyon (1969) states that sea otter pups remain with their
mothers for as long as a year. Lensink (1962) suggests a somewhat
shorter period for male pups. According to Vandevere (1973) sea
otter in California may have a dependency period of less than a full
year. The Oregon pup was dependent upon its mother for at least 6
months. At the end of that time, it was obtaining a significant propor-
tion of its own food, but was also soliciting and receiving both solids
and milk from the female. Unfortunately, the pair left Simpson Reef
when the pup was approximately 6 months old and observations were
therefore terminated.
A series of observations made at Simpson Reef during December
1972 suggest that the duration of the pup dependency period is at least
10 months. On 20, 24, and 27 December a female and large pup were
sighted on the reef. In the water only a slight size difference was
discernible; but the behavior of the smaller animal, taking of food
and on one occasion nursing, indicated it was a large pup. These
observations were made over 10 months after the sighting of the first
pup on 20 February 1972. During the interim period 3 other pups had

39
been observed but the oldest of these would only have been 4 months
old by this time. Therefore, assuming the large pup observed during
December to be the same animal first observed during February, the
dependency period would be at least 10 months long.
Food Habits and Food Availability
The feeding habits of sea otter have been studied in both the
northern and southern portions of its range. Williams (1938), Wilke
(1957), Lensink (1962), Kenyon (1969), and Calkins (1972) completed
food habit studies of sea otter in the Alaskan portion of the species
range. None of these studies incorporated an assessment of food
availability.
Numerous food habit studies have been done in California.
Fisher (1939) published one of the earliest accounts of sea otter food
habits. More recently, several other food habit studies have been
completed. Hall and Schaller (1964) reported that California mussels
(Mytilus californianus) and purple sea urchins comprised over 70 per-
cent of the diet of a group of otter near Point Lobos, California.
Ebert (1968) studied food habits near Pico Creek, California. His
results indicate that abalone (Haliotus sp. ) and crabs comprised nearly
90 percent of the otter's diet. Ebert's study also incorporated SCUBA
surveys to determine the relative abundance and availability of poten-
tial food resources. Wild and Ames (1974) have presented food habit

40
data from several sites in California that indicate sea otter diets may
vary from area to area and within the same area over an extended
period of time.
The marine invertebrate communities of Oregon are similar to
those found in central California; therefore, the results of my study
are compared with those of California researchers.
Results
Purple and red sea urchins occurred most frequently in the diet
of the otter comprising nearly 64 percent of the total number of
observations. Mollusks accounted for 14.4 percent of the total, with
rock scallops (Hinnites multirugosus), California mussels, and turban
snails occurring most frequently. The remaining 5.2 percent of the
diet consisted of several species of crabs (Table 11). Large Cancer
crabs which were not identified to species were probably rock crabs
(Cancer antennarius or Cancer productus). Kelp crabs (Pugettia
producta) probably occurred more frequently in the otter's diet, but
because of their relatively small size could not be identified as readily
as, larger crabs.
Sea otter require an amount equaling approximately 20 percent
of their total weight in food per day (Kenyon 1969). Kenyon has stated
that this amount of food would have a caloric content of 3000 plus
calories. He concluded that green sea urchins (S. drobachiensis) at

41
Table 11. Food items ingested by sea otter at Simpson Reef, JuneAugust 1972.
Number of
Percentage ofGroup Observations Observations
Echinodermata:Strongylocentrotus purpuratus 223 52.47Strongylocentrotus franc is canus 48 11.29
Cucumar is miniata 7 1.64
Pisaster ochraceus 2 .47
Total 280 65.88
Mollus ca:Saxidomis sp. and Protothaca sp. 7 1.64Hinnites: multir ugo sus 10 2.35Mytilus californianus 13 3.05
Tegula sp. , 25 5.88Haliotus sp. 1 .23Cryptochiton stelleri 1 .23
Octopus sp. 4 .94
Total 61 14.35
Crustacea:Cancer magister 5 1.17Cancer productus and antennarius 4 .94Pugettia producta 2 .47Unidentified crabs 11 2.58
Total 22 5.17
Unidentified items 62 14.58
Grand Total 425 100.00

42
Amchitka Island, Alaska were nutritionally unimportant to the otter
since nearly 6500 urchins of the size most commonly encountered in
the area would be required to satisfy a sea otter's daily energy demand.
Because sea urchins accounted for a major portion of the otter's diet
at Simpson Reef I estimated the number needed to satisfy an otter's
daily energy needs.
Sea urchins occurring in Oregon are congeneric with those in
Alaska. I calculated the average caloric content of local urchins from
values given by Kenyon (1969) for green sea urchins assuming no dif-
ferences in caloric content between congeneric organisms.
The mean caloric value calculated for five adult red sea urchins
collected at Nellie's Cove was 127.8 calories (Table 12). Assuming
an average daily energy demand of 3000 calories, 23.5 red sea
urchins of the size collected would satisfy the daily energy needs of a
sea otter for a 24 hour period.
Table 12. Test diameters and weights of five red sea urchins collectedat Nellie's Cove, Oregon on 17 August 1973.
Test Diameter(mm)
Whole Weight(g)
Viscera PlusGonad Weight
(g)Gonad Weight
(g)
111.2 625.2 156.7 92.9128.6 280.6 185.0143.0 383.3 206.2141.0 331.6 173.7152.0 1060.9 431.8 260.3
135.2 316.8 183.6(sd = 15.8) (sd=105.8) (sc1,7,60.7)
43
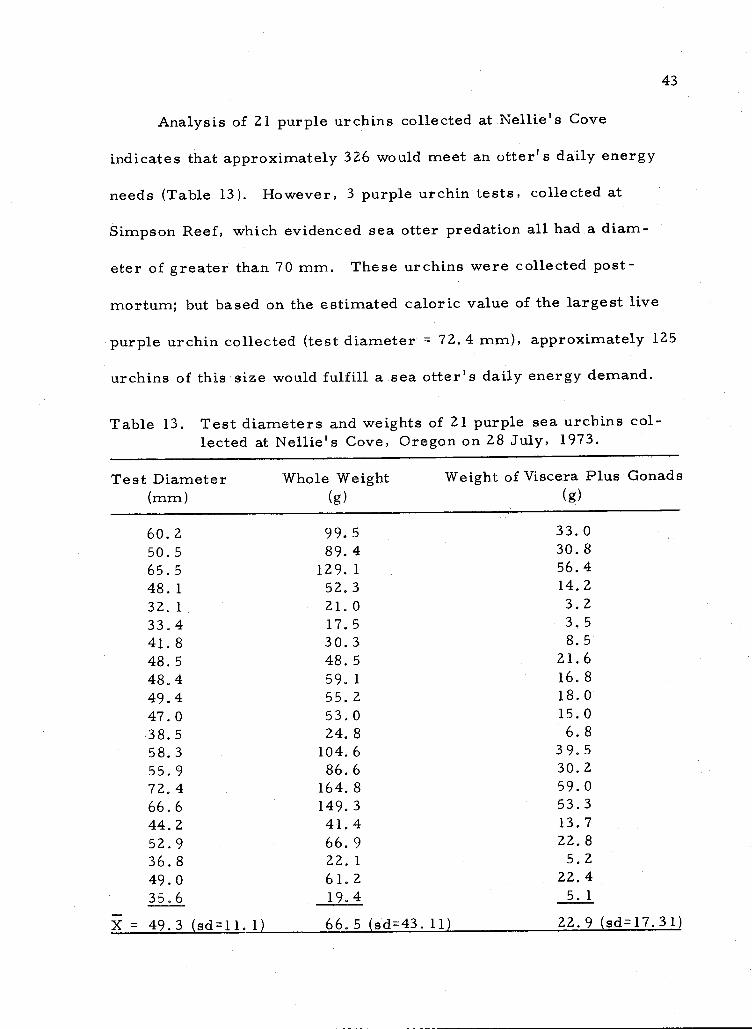
Analysis of 21 purple urchins collected at Nellie's Cove
indicates that approximately 326 would meet an otter's daily energy
needs (Table 13). However, 3 purple urchin tests, collected at
Simpson Reef, which evidenced sea otter predation all had a diam-
eter of greater than 70 mm. These urchins were collected post -
mortum; but based on the estimated caloric value of the largest live
purple urchin collected (test diameter = 72.4 mm), approximately 125
urchins of this size would fulfill a sea otter's daily energy demand.
Table 13. Test diameters and weights of 21 purple sea urchins col-lected at Nellie's Cove, Oregon on 28 July, 1973.
Test Diameter(mm)
Whole Weight Weight of Viscera Plus Gonads(g) (g)
60.2 99.5 33.050.5 89.4 30.865.5 129.1 56.448.1 52.3 14.232.1 21.0 3.233.4 17.5 3,541.8 30.3 8.548.5 48.5 21.648.4 59.1 16.849.4 55.2 18.047.0 53.0 15.038.5 24.8 6.858.3 104.6 39.555.9 86.6 30.272.4 164.8 59.066.6 149.3 53.344.2 41.4 13.752.9 66.9 22.836.8 22.1 5.249.0 61.2 22.435.6 19.4 5.1
X = 49.3 (sd=11.1 66.5 (sd = 43. 11) 22.9 (sd=17.31)

44
A total of 67 plots was quantitatively sampled at Simpson Reef
to assess the relative abundance and availability of potential sea otter
prey items. Fifty 0.25 m2 plots and seventeen 1 m
2 plots were
sampled (Table 14).
Purple sea urchins occur at high densities at Simpson Reef
comprising 75 percent of all organisms enumerated. The average
number of purple sea urchins occurring per 0.25 m 2 was 1.7. How-
ever, these urchins have clumped distribution patterns and occurred
in only 12.0 percent of the 0.25 m2 plots sampled. Densities of as
high as 47 urchins per 0.25 m2 were found. On suitable substrates
purple urchin beds often extended over large areas, virtually exclud-
ing all other macro invertebrates and flora. Ebert (1967) has
reported urchin densities of up to 200 per m2
at Sunset Bay (1 mile
north of Simpson Reef).
The average number of red sea urchins per 0.25 m2
was 0.08,
and they were represented in 6 percent of the sample plots. The
highest red urchin density observed was 2 per 0.25 m2.
No crabs occurred in the quantitative sample. This was
probably due to the sampling method which might frighten any mobile
organisms from the confines of the quadrate. Moreover, crabs tend to be
nocturnal, retreating to dark crevices or hiding beneath rocks during
daylight hours increasing the probability of their being overlooked.

Table 14. Results of quantitative underwater surveys of macroinvertebrates occurring at SimpsonReef, Oregon.
Species
Quadrat Size
0.25 m2 (N=50) 1.0 m2 (N=17) CombinedPercentageTotal X % T otal Total X % Total
Purple sea urchins 86 1.72 69.9 103 6. 06 80.5 75. 3
Red sea urchins 4 0.08 3.3 0 0. 00 00.0 1. 6
Brown turban snails 8 0. 16 6. 5 1 0. 05 0.8 3. 6
Gumboot chiton 6 0. 12 4. 9 3 0.18 2.3 3. 6
Common seastar 6 0. 12 4. 9 3 0.18 2. 3 3. 6
Keyhole limpet 2 0.04 1. 6 0 0.00 0. 0 0. 8
Rock snails 9 0. 18 7. 3 16 0. 94 12.5 10. 0
Barnacle 1 0.02 0.8 0 0.00 0.0 0.4
Sea squirt 1 0.02 0. 8 0. 0.00 0.0 0.4
California mussel 0 0, 00 0. 0 1 0. 05 0.8 0. 4
Little-neck clam 0 0.00 0.0 1 0.05 0.8 0.4
Total 123 100 128 100 100

46
The results of the 1 m2 sampling are similar to those obtained
with the smaller device.
Macroinvertebrates were observed most frequently on solid rock
substrates and did not occur on gravel or shell-sand. Ninety-five
percent of the total number of individual organisms in the samples
occurred on rock substratum (74.6 percent of all substrates
encountered).
Purple sea urchins were observed at depths ranging from 7-25
feet (X=10.4. ft). Red sea urchins may occur in the low intertidal
zone but are normally more common in the sublittoral (Ebert 1968).
At Simpson Reef red urchins were observed from 16-21 feet
(X =18.0). Brown turban snails, which probably were the predominant
Tegula occurring in the otter's diet, occurred at depths ranging from
7-23 feet (X = 11.4).
Several qualitative benthic surveys were completed in August and
September of 1973 (Table 15). Survey sites were selected on the basis
of current otter use, or the possibility of potential use as the animals'
range expands.
Red sea urchins were the most commonly occurring large
inveertebrate at eight of the ten sites surveyed.
Nellie's Cove was surveyed on 5 August 1973. The area con-
sisted of approximately 75 percent rock substrates, with the remainder
shell sand, and averaged 40 feet in depth. Purple sea urchins were

Table 15. Abundance of macroinvertebrates encountered during 10 subtidal surveys conducted along the southern coast of Oregon during August andSeptember 1973: A = abundant, C = common, U = uncommon, R = rare, P = present. **
Location of Survey
Nellie's Zwagg Orford Redfish Redfish Humbug Port Lone Blanco Simpson ReefCove Cove Reef Rocks Rocks-2 Mountain Orford Ranch Reef Gregory Point
Strongylocentrotus purpuratus* U U R C AStrongylocentrotus franciscanus* A A A A A C C ACucum aria miniata* C C C U U U CPisaster ochraceus* C U U U C C C CPycnopodia helianthoides C U U C C C C C C CSolaster sp. U U UHenrcia leviuscula C U U C C C C U C UDermasterias imbricata U U U U U CStichopus californicus C C
Hinnites multirugosus* C C U U C A UProtothaca staminea* UMytilus californianus* U U C ATegula funebralis A A ATegula brunnea* C CMuricidae (rock snails) U U U C C CHaliotis walallensis U U RHaliotis rufescens UCryptochiton stelleri* C C C U C C C CSmall chitons U CDiodora aspera U U C U A CNudibranchia U C UOctopus sp. * P P
Cancer sp. * P PPugettia producta* P PBalanus nubilus P U
*Species noted in the sea otter's diet at Simpson Reef.**Motile organisms were placed in this category.
48
uncommon, while the larger red sea urchin was abundant. Bull kelp
was the predominant emergent kelp at this location and occurred to
depths of 45 feet.
Zwagg Cove was surveyed on 6 August 1973. The average depth
of the survey area was 21 feet, and the substrates were an estimated
60 percent rock and 40 percent sand. No sea urchins
were observed at this site and the most abundant prey species
encountered here was brown turban snails. Brown algae were com-
mon on suitable substrates, with bull kelp predominating. Basket
grass (Phyllospaddix sp. ) was also abundant at this location.
Orford Reef was surveyed on 7 August 1973. The mean depth of
the survey area was 54 feet. Red sea urchins were abundant and rock
scallops (Hinnetes multirugosus) were common. Substrate composi-
tion was 75 percent rock and 25 percent gravel. Brown algae con-
sisted primarily of a few scattered junveile bull kelp sporophytes.
Red Fish Rocks are located approximately 5 miles south of Port
Orford and were surveyed on 8 August 1973. The mean depth was
46 feet. Red sea urchins were abundant to 65 feet and rock scallops
were common. Substrates were 100 percent rock to the 65 foot level
where large boulders 4-6 feet in diameter were encountered. Bull
kelp was abundant to a depth af 50 feet and the lower limit for brown
algae appeared to be approximately 55 feet with few if any plants
found beyond this depth.

49
A survey was completed on the south side of Humbug Mountain
on 8 August. The mean depth of the area was 29 feet. Red sea
urchins were abundant throughout the area. Substrates consisted of
large boulders 3-6 feet in diameter surrounded at the base with broken
shell and sand. Bull kelp was abundant enough to provide a thin sur-
face canopy.
A second dive was made at Nellie's Cove on 26 August 1973.
The mean water depth of the sample area was 26 feet. Red sea
urchins were abundant; purple sea urchins were uncommon. Substrates
were primarily rock with sand filling many of the depressions and
crevices. Bull kelp was abundant, forming a dense surface canopy in
some areas.
A single survey dive was completed at Lone Ranch Beach on
12 September 1973. Purple and red urchins were observed and rated,
respectively, as uncommon and common. The mean depth of the area
surveyed was 21 feet. Seventy percent of the substrates were rock,
and 30 percent were sand types. Only a few scattered bull kelp plants
were encountered in the area.
The second survey at Redfish Rocks was made on 14 September
1973 near the site of the 1970 otter release. The mean depth of the
area surveyed was 43 feet; the predominant substratum was rock.
Very few macroinvertebrates were found, the most abundant being
sea squirts (Styella sp. ). Bull kelp was very dense consisting

50
primarily of young sporophytes that at times were so abundant they
hindered our forward progress.
A portion of Blanco Reef was surveyed on 16 September 1973.
The survey area had been used by otter throughout the summer of
1973 and may have been used by sea otter for 3 years. The mean depth
of the area surveyed was 27 feet (sd 7--4. 43). Ninety percent of the sub-
strates were rock and 10 percent were shell-sand. Purple and red
sea urchins were common in the area, as were rock scallops. Red
urchins were somewhat restricted in their distribution and rather than
occurring on exposed areas, as they do at sites not being exploited by
sea otter, they were restricted to overhanging projections and
crevices. Red sea urchin tests were abundant on the bottom, and the
majority of those examined exhibited the broken oral surface indica-
tive of sea otter predation. Bull kelp formed a dense surface canopy
at Blanco Reef and was observed throughout the survey area.
Surveys were conducted from Cape Arago to Gregory Point on
5, 7, and 9 August 1972. The mean depth of the area surveyed was
18 feet. Red and purple sea urchins were abundant except in areas
where otter had been foraging heavily, there, red urchins were
noticeably absent. In areas that had not been subjected to otter
predation red urchins were still abundant with estimated densities of
up to 6-8 per m 2 . Sea urchin tests showing a broken oral surface
were in evidence in those areas where otter frequently foraged.

51
Substrates encountered during these dives ranged from sand to rock,
with rock predominating. As in all other areas the major portion of
the invertebrates encountered were associated with rock substrates.
Both bull and giant kelp were noted, with both species forming dense
surface canopies at Simpson Reef.
Discussion
Sea urchins constitute the greatest percentage of food items in
the otter's diet and seem to be taken relative to their abundance and
availability (Table 16). The quantitative and qualitative food avail-
ability data suggest that sea urchins are the predominant large marine
invertebrates in Oregon waters. Ebert (1968) suggested that when sea
otter occupy a new habitat they will forage heavily on red sea urchins.
He supported his statement with an underwater survey of the sea
otter's range in California, and his findings indicated that red urchins
were uncommon in areas that had been exploited by sea otter for an
extended period. Conversely, they were common and readily avail-
able in areas where otter had not foraged in recent times.
Wild and Ames (1974), Hall and Schaller (1964), and Boolootian
(Senate Permanent Factfinding Committee on Natural Resources 1965)
have presented data which indicate that in newly exploited areas
sea otter prey heavily on sea urchins (Table 17). However, where
a population of sea otter has been established for a long period of
time sea urchins will constitute only a minor percentage of, or be

52
Table 16. Comparison of foods eaten by sea otter at Simpson Reef,Oregon and the occurrence of these prey species in thequantitative sample from the same location.
Species % of Diet % of Quantitative Sample
Purple sea urchins 52.5 75„3Red sea urchins 11.3 1.6Red sea cucumber 1.6 0.0Common seastar 0. 5 3.6Clams* 1.6 0.4Rock scallop 2.4 0.0California mussel 3.1 0.4Brown turban snail 5.9 3.6Abalone 0.2 0.0Gumboot chiton 0.2 3. 6Octopus* 0.9 0.0Crabs* 5.2 0.0
*The sampling technique used is probably biased against clams andmotile organisms, therefore not indicating their relative abundance.
Table 17. Percent occurrence of selected macroinvertebratesutilized as sea otter food items in California and Oregon.Otters had only recently occupied all study areas.
Food Items ObservedThisStudy
Hall andSchaller
(1964)
Wildand Ames
(1974)Boolootian
(1965)
Purple sea urchin 52.5 32.4 13.0Red sea urchin 11.3 0.4 48.9 43.4California mussel 3.1 40.0 7.1 33.8Abalone 0.2 9.9 26.1 8.2Other mollusks 11,1 1.2 0.3Crabs 2.6 14.5 17.4 0.8
Totals 80.8 98.4 99.5 99.5

53
completely absent from, the animal's diet (Ebert 1968, Vandevere
1969,1971, Wild and Ames 1974).
The effects of sea otter predation on red sea urchins are
evidenced at Simpson and Blanco Reefs. Although red urchins are
abundant in areas that have received little or no otter foraging, they
were not encountered at Simpson Reef where heavy foraging has
occurred, and appear to have been reduced in numbers at Blanco Reef.
Purple urchin densities are still quite high at Simpson Reef, although
a few localized beds show evidence of being reduced (broken tests,
many empty urchin created depressions). Other areas surveyed have
estimated densities of 6-8 red urchins per m2.
Paine and Vadas (1969) have shown that both red and purple sea
urchins, which are algal grazers, can effectively reduce the diversity
and biomass of algae at a foraging site, McLean (1962:102) suggests
that when sea otter were absent or at low population levels, sea
urchins were abundant and the ''...1Nereocystis-Pterygophora associa-
tion...is at a minimal level of development as a result of grazing.
Ebert (1968:41) states that sea urchins were probably ''... minor faunal
constituents" of the nearshore marine ecosystem when sea otter were
abundant in California. He further relates that removal of algal
grazers such as sea urchins and abalones will result in a notable
rejuvenation of the plant community. This suggests that the current
species composition of Oregon's reef communities probably differs

54
considerably from what it was during pristine times. As the otter
population grows sea urchins will become less important constituents
of the animal's diet.
The floral community may also exhibit some profound changes,
and this may already be evidenced at Blanco Reef. Plant life here is
extremely profuse, especially on the more exposed portions of rock
substratum. At other sites this type of habitat is occupied by red
urchins; and algal densities are extremely low, with many areas
cropped to bare rock.
Sea otter may be part of a climax marine community (Faro 1970)
and conceivably could function in maintaining the diversity and stability
of the community by controlling sea urchin populations in much the
same way that sea stars (Pisaster spp.) seem to affect the intertidal
zone by preying upon mussels (Paine 1966). In any event, I suggest
that sea otter will have a substantial effect on the sublittoral reef
communities of Oregon; and this effect will become more evident
as the population grows.
Potential Sea Otter Habitat in Oregon
Results
North Coast. The north coast region extends from the mouth of
the Columbia River to Lincoln City, a distance of approximately

55
90 miles (Figure 1). Superficially the area appears to have several
potential sea otter habitats and the historical record indicates that sea
otter once occurred here (Bailey 1936, Scheffer 1940, Scammon 1968).
However, data obtained from nautical charts indicate that most of
the substrates are sand or shell-sand with very limited rocky areas.
Moreover, Waldron's (1955) survey of the kelp beds of Oregon yielded
none on the north coast, and I located only one sparse kelp bed on the
south side of Cape Lookout. These data suggest a limited amount of
rock substrate along the north coast.
Central Coast. The central coast region extends from Lincoln
City to Coos Bay a distance of approximately 115 miles. Aerial and
shoreline surveys, plus data obtained from nautical charts indicate
that approximately 83 percent of the region would be poor to unsuitable
sea otter habitat (Table 2). However, I judge a 20-mile section of
coast extending from Lincoln City to the north jetty at the mouth of the
Yaquina River to be good to excellent otter habitat. Kelp beds of
varying size and density occur throughout the area (Waldron 1955, and
this study) and rock substrates occur to the 20 fathom contour. The
offshore reefs have a rich and varied invertebrate fauna (Freeman
Button personal communication). The region was also the location of
one of the last reports made of the original Oregon sea otter popula-
tion (Nash 1919).

56
South Coast. The south coast region extends from the entrance
of Coos Bay south to the Oregon-California border (approximately 100
miles). Approximately 85 percent of the area contains good to excel-
lent sea otter habitat. Six offshore reefs are situated in this section,
of these Blanco and Simpson reefs were surveyed and were found to
have abundant sea otter food resources. This region, which repre-
sents about 33 percent of the coastline, encompasses approximately
80 percent of the sea otter habitat in Oregon. Waldron (1955)
reported 3079 acres of kelp in this region, over 83 percent of all the
beds he had sighted within the boundaries of the state.
Discussion
Results of this study indicate that approximately one-third of the
Oregon coastline is suitable for sea otter habitation; approximately
80 percent of the suitable area is situated along the south coast, with
the remainder in the central region. Based on the criteria set forth
in this study to describe optimum habitat (Table 2.), I believe that all
the suitable habitat along the southern and central portion of the coast
will be occupied before any significant use of the other areas will be
evidenced.

57
V. CONCLUSIONS AND RECOMMENDATIONS
Evaluation of Translocations
The sites chosen for the 1970 and 1971 releases were Port
Orford and Cape Arago (South Cove) (Figure 1). Both locations
offered good to excellent sea otter habitat. The amount of contiguous
habitat available at each site, however, differs considerably.
Approximately 4 square miles of sea otter habitat exists within a 10
mile radius of Cape Arago, while approximately 18 square miles of
contiguous habitat can be found within a 10 mile radius of Port Orford,
Moreover, the distance to the nearest section of good otter habitat
north of Cape Arago is just under 100 miles while to the south 30 miles
of sand beach occurs before good otter habitat is again available. In
contrast, Port Orford lies within a 75 mile section of coast consisting
of nearly contiguous sea otter habitat. Thus, the probability of
encountering optimal habitat would be greatest if the population were
located within a relatively contiguous section of habitat such as that
found in the vicinity of Port Orford.
When dealing with a small number of animals, such as the
translocated otter population, minimization of mortality both during
and after the introduction should be of prime consideration. Natural
predation of sea otter is probably of little consequence to the species
(Kenyon 1969, Wild and Ames 1974).

58
Although the effects of natural predation are probably negligible,
the effects of human encroachment may not be, especially when the
number of otter is small. Wild and Ames (1974) list shootings and
boating accidents as important man-related mortality factors of sea
otter in California; Kenyon (1969) has suggested that pollution of sea
otter habitat might preclude the reestablishment of the species within
portions of its former range. Therefore, in order to minimize
mortality the reestablishment site should be as free as possible of
potential man-related mortality factors. The Coos Bay, Empire,
North Bend metropolitan complex (located 4 miles north of Cape
Arago) has the highest human population on the Oregon Coast and is
also a major shipping port (Highsmith and Liverenz 1962). The prob-
ability of sea otter dying due to human related factors would appear
to be higher here than in the Port Orford area, located in Curry
County. Curry County has the lowest human population density on the
Oregon Coast (Dicken 1965). I concluded, therefore, that Port Orford
was the better of the release sites.
The data presented in this report indicate that the attempt to
reestablish sea otter in Oregon has succeeded at least from a short
term viewpoint. Reproduction has resulted in at least ten pups born
since the 1971 release.
The most perplexing question suggested by this study relates to
the number of sea otter released and the number remaining in the
59
reestablishment area. Ninety-five sea otter were shipped to Oregon;
seven were known to have died before or soon after the liberations,
leaving a potential population of 88 sea otter on the coast. It would
certainly be presumptive to believe that all dead otter were recovered;
however, if massive mortality did occur more than 6 otter should
have been found. With 88 otter potentially surviving the translocations,
and 10 pups produced during the study period the colony would have
numbered 98 sea otter at the termination of the study. Moreover, a
group of 88 otter with the same sex and age ratios of the released
otter should have produced approximately 33 pups during the study
period. I have estimated that 30-35 otter were on the Oregon Coast at
the conclusion of this study. This disparity in potential and estimated
numbers remains an unanswered question. Nelson's report, however,
of sea otter 181 miles north of Cape Arago suggests that emigration
may be a partial explanation.
Future Translocations of Sea Otter
Translocation sites should be selected using criteria which
characterize optimum sea otter habitat (Table 2). Potential sites can
initially be located by studying coastal maps and navigation charts.
In this way unsuitable areas can quickly be eliminated. Once several
tentative release sites have been located, a reconnaissance should
be made to assess conditions that are not discernable on maps and

60
charts, such as the availability of areas providing respite from
storms and the availability of food. The latter could be assessed
quickly and inexpensively by diver-biologists familiar with sea otter
food preferences. The results of this study have shown that areas
superficially appearing to be excellent otter habitat may have limited
available otter forage (Table 15). Once all other factors have been
considered, the final choice should be based upon the threat of poten-
tial human encroachment and the probability of, or existence of,
environmental pollution.
In view of the polygamous nature of sea otter a 2:1 sex ratio
favoring females, such as was done in the Oregon translocation, will
probably enhance initial reproduction.
Sea otter translocated in the future should be marked so that
individuals can be identified at a later date. The resting posture of
sea otter when in the water facilitates observing a colored tag on the
animal's rear flipper; if the otter is in close proximity to the viewer
a number on the tag may also be read.
Management
Management of the Oregon sea otter population should include
protection of the otter and their habitat. Sea otter were afforded full
protection under the Marine Mammals Act of 1972. Enforcement will
require routine surveillance of areas inhabited by sea otter and

6 1
apprehension of offenders. Since Oregon has no commercial fisheries
on invertebrates exploited by sea otter, other than the dungeness crab
which constitutes a relatively minor portion of the otter's diet, a
problem similar to the sea otter-abalone controversy in California
should not develop. Of greater import is the protection and preserva-
tion of Oregon's sea otter habitat. This could be done by establishing
refuges along the south coast of Oregon, coupled with strict enforce-
ment of established and proposed laws.
Presently, 28 small offshore islands and sea stacks are part of
the Oregon Islands National Wildlife Refuge and 28 more have been
proposed for addition (USBSFW 1972). Already included in the refuge
are Orford and Blanco reefs; Simpson Reef has been proposed for
inclusion. Federal permits must be obtained to gain legal access to
those areas already within the system. Sea otter may occasionally
haul out on these rocks but are more dependent on the associated sub-
tidal reef areas and their fauna than upon the islands and stacks them-
selves. For this reason the protected areas should be extended
subtidally, not only affording protection to the otter but to their food
resource and aquatic habitat. These areas could be delineated on
shore by some landmark such as a cape, headland or jetty. Seaward
the boundaries could be delineated by depth contours. The 20 fathom
contour would be inclusive of all areas likely to receive use by sea
otter plus provide a horizontal buffer zone around the emergent

62
portions of the reefs. Restrictions within these zones would include:
1. A ten knot speed limit to minimize boat-related mortality and
harassment of the resident animals.
2. A restriction on the taking of all invertebrates, except by
special permit, excluding dungeness crab and intertidal
clams.
3. A restriction on the carrying of firearms within the refuge
boundary.
The refuges would not only protect sea otter, but would give
added protection to other marine mammals and marine birds inhabit-
ing the areas.
Areas recommended for refuge status would include: the section
of coast from Blacklock Point south to 2 miles south of Humbug
Mountain, including all the seaward area to the 20 fathom contour;
the area south from the town of Nes ika Beach to the seaward tip of
North Jetty at the mouth of the Rogue River inclusive of all seaward
area to the 20 fathom contour; and the area from Gregory Point south
to the mouth of Fivemile Creek seaward to the 20 fathom contour
(Figure 1).
The Oregon sea otter colony should also continue to be
monitored. This program should include a minimum of two shoreline
surveys a year to assess population growth and at least one aerial
survey to determine distribution and range expansion. The shoreline
surveys should be conducted in June and in the fall before the onset
of the winter storm season.
63
LITERATURE CITED
Bailey, V. 1936. The mammals and life zones of Oregon. NorthAm. Fauna, 55. 416pp.
Barabash-Nikiforov, I.I. 1947. Kalan (The sea otter, in Russian,translated by Dr. A. Birron and Z.S. Cole, 1962) Israel Pro-gram for Scientific Translations, Jerusalem. 227pp.
Bourke, R.H. and B. Glenne. 1971. Coastal currents. Pages 87-110 in Oceanography of the nearshore coastal waters of thePacific Northwest relating to possible pollution, Volume 1.E. P. A. 615pp.
Calkins, D. G. 1972. Some aspects of the behavior and ecology of thesea otter, Enhydra lutris, in Montague Straight, Prince WilliamSound, Alaska. M.S. Thesis. Univ. of Alaska. 55pp.
Cameron, R. 1972. More sea otters come home. British ColumbiaWildl. Rev. 6(6):8-9.
Daugherty, A.E. 1972. Marine mammals of California. 2nd ed.California Dept. Fish and Game, Sacramento. 9Opp.
Dicken, S.N. 1962. Oregon geography the people the place and thetime. Edward Brothers, Inc. , Ann Arbor, Mich. 147pp.
Ebert, E.E. 1968. A food habits study of the southern sea otter,Enhydra lutris nereis. California Fish Game 54(1):33-42.
Ebert, T. A. 1967. Negative growth and longevity in the purple seaurchin Strongylocentrotus purpuratus (Stimpson). Science157:557-558.
Ehlen, J. 1967. Geology of state parks near Cape Arago, CoosCounty, Oregon. Ore Bin 29(4):61-82.
Ekmen, S. 1953. Zoogeography of the sea. Sidgwick and JacksonLtd., London. 417pp.
Faro, J. B. 1970. Subtidal sea otter habitat off Point Pinos,California. M.S. Thesis. Humbolt State College. 278pp.

64
Fisher, E. M. 1939. Habits of the southern sea otter. J. Mammal.20(0:21-36.
1940. Early life of a sea otter pup. J. Mammal.21(2):132-137.
Hall, K. R. L. and G. B. Schaller. 1964. Tool-using behavior of theCalifornia sea otter. J. Mammal. 45(2):287-298.
Highsmith, R.M. and J. M. Liverenz. 1962. Atlas of the PacificNorthwest. Oregon State Univ. Press, Corvallis. 168pp.
Kenyon, K. W. 1969. The sea otter in the Eastern Pacific Ocean.North Am. Fauna. 68. U.S. Gov. Printing Office, Washingto352pp.
Kenyon, K. W. and D. L. Spencer. 1960. Sea otter population andtransplant studies in Alaska, 1959. U.S. Fish Wildl. Serv.Spec. Sci. Rep. Wildl. 48. 29pp.
Khromovskikh, B. V. 1968. Ecology and population numbers of seaotters on Medny Island. Pages 167-174 in V.A. Arsen'ev andK.I. Panin, eds. Pinnipeds of the North Pacific. Israel Prog.Sci. Translations, Jerusalem. 274pp.
Lensink, C. J. 1962. The history and status of sea otters in Alaska.Ph.D. Thesis. Purdue Univ. 141pp.
McLean, J. H. 1962. Sublittoral ecology of kelp beds of the opencoast area near Carmel, California. Bio. Bull. 122(1):95-114.
Murie, O.J. 1940. Notes on the sea otter. J. Mammal 21(2):119-131.
Nash, W. 1919. A lawyer's life on two continents. Richard G. Badger.The Garham Press, Boston, Mass. 212pp.
Odemar, M. W. and K. C. Wilson. 1969. Results of sea ottercapturing, tagging and transplanting operations by the CaliforniaDepartment of Fish and Game. California Dept. Fish Game.Marine Resour. Oper. MRR Ref. No. 70-5. 9pp.
Olterman, J.H. 1972. Rare, endangered, and recently extirpatedmammals in Oregon. M.S. Thesis. Oregon State Univ. 134pp.

65
Oregon State Game Commission. 1970. Sea otter. Pages 151-152 inAnnual Report. Oregon State Game Commission. Portland.201pp.
Paine, R.T. 1966. Food web complexity and species diversity.Am. Nat. 100(910):65-75.
Paine, R.T. and R. L. Vadas. 1969. The effects of grazing by seaurchins, Strongylocentrotus spp. , on benthic algal populations.Limnol. Oceanogr. 14:710-719.
Pearson, O.P. 1952. Notes on a pregnant sea otter. J. Mammal.33(3):387.
Pederson, R. J. and J. Stout. 1963. Oregon sea otter sighting.J. Mammal. 44(3):415.
Sandegren, F.E. , E. W. Schu, and J.E. Vandevere. 1973. Maternalbehavior in the California sea otter. J. Mammal. 54(3):668-679.
Scammon, C.M. 1968. [First published in 1874]. The marinemammals of the north-western coast of North America. DoverPublications, Inc. New York, N.Y. 319pp.
Scheffer, V. B. 1940. The sea otter on the Washington Coast.Pacific Northwest Quarterly. 3:370-388.
Schneider , K.B. 1968. Sea Otter. Alaska Dept. Fish and Game.Fed. Aid in Wildl. Restor. Proj. Rep. , W-14-R-2. 26 pp.
. 1972. Sex and age segregation of sea otters.Alaska Dept. Fish and Game. Fed. Aid in Wildl. Restor. Proj.Rep. , W 17-4-8.9R . 26pp.
1973. Reproduction in the female sea otter.Alaska Dept. Fish and Game. Fed. Aid in Wildl. Restor. Proj.Rep. , W-17-4 and 5.8.11R. 13 pp.
Senate Permanent Factfinding Committee on Natural Resources. 1965.The sea otter and its effect upon the abalone resource. in ThirdProg. Rep. to the Senate, Section I, Sacramento, Calif. 144pp.
Sherrell, P.E. 1970. An annotated check list of the land mammalsof Curry County, Oregon. M.S. Thesis. Central WashingtonState College, Ellensberg. 150pp.
66
U.S. Bureau of Sports Fisheries and Wildlife. 1972. Oregon Islandswilderness proposal. 2Opp. Rep.
Vandevere, J.E. 1969. Feeding behavior of the southern sea otter.Proc. Annu. Conf. Biol. Sonar and Diving Mammals. 6:87-94.
. 1971. Fecal analysis of the southern sea otter.Proc. Annu. Conf. Biol. Sonar, and Diving Mammals. 8:1-7.
. 1973. Behavior of the southern sea otter Enhydralutris nereis. Annu. Meet. Am. Soc. Mammal. 53. llpp.Typescript.
Waldron, K. D. 1955. A survey of the bull kelp resources of Oregon.Res. Briefs, Fish. Comm. Oregon 6(2):15-20.
Wild, P.W. 1972. Introduction. Pages 1-4 in A. Seed, compiler.Sea otter in eastern North Pacific waters. Pacific Search,Seattle, Wash. 37pp.
Wild, P. W. and J.A. Ames. 1974. A report on the sea otter,Enhydra lutris L. in California. California Dept. Fish. Game,Marine Resour. Tech. Rep. 20. 94pp.
Wilke, F. 1957. Food of sea otters and harbor seals at AmchitkaIsland. J. Wildl. Manage. 21(2):241-242.
Williams, C.S. 1938. Notes on food of the sea otter. J. Mammal.19(0:105-107.


![[Fredric Jameson, Ian Buchanan] Jameson on Jameson(BookZa.org)](https://static.fdocuments.net/doc/165x107/55cf98d7550346d03399feaa/fredric-jameson-ian-buchanan-jameson-on-jamesonbookzaorg.jpg)