
ROLE OF THE INOSITOL PHOSPHATASE INPP4B IN THE GENERATION...
201
ROLE OF THE INOSITOL PHOSPHATASE INPP4B IN THE GENERATION OF OVARIAN TERATOMAS by Ashwini Balakrishnan Bachelor of Technology, Anna University, 2006 Submitted to the Graduate Faculty of the School of Medicine in partial fulfillment of the requirements for the degree of Doctor of Philosophy University of Pittsburgh, School of Medicine 2012
Transcript of ROLE OF THE INOSITOL PHOSPHATASE INPP4B IN THE GENERATION...

i
ROLE OF THE INOSITOL PHOSPHATASE INPP4B IN THE GENERATION OF OVARIAN TERATOMAS
by
Ashwini Balakrishnan
Bachelor of Technology, Anna University, 2006
Submitted to the Graduate Faculty of
the School of Medicine in partial fulfillment
of the requirements for the degree of
Doctor of Philosophy
University of Pittsburgh, School of Medicine
2012

ii
UNIVERSITY OF PITTSBURGH
SCHOOL OF MEDICINE
This dissertation was presented
by
Ashwini Balakrishnan
It was defended on
November 28, 2012
and approved by
Marie C. DeFrances, MD PhD, Department of Pathology
Denise S. O'Keefe, PhD, Department of Urology
Urvashi Surti, PhD, Department of Pathology
William H. Walker, PhD, Department of Obstetrics, Gynecology and Reproductive Sciences
Thesis Director: J.Richard Chaillet, MD PhD, Department of Microbiology and Molecular
Genetics

iii
Copyright © by Ashwini Balakrishnan
2012

iv
Teratomas are a unique class of tumors composed of ecto- meso- and endodermal tissues,
all foreign to the site of origin. In humans, the most common teratoma is the ovarian
teratoma. Not much is known about the molecular and genetic etiologies of these tumors.
Female carriers of the Tgkd transgene are highly susceptible to developing teratomas.
Ovaries of Tgkd/+ hemizygous female mice exhibit defects in luteinization, with
numerous corpora lutea, some of which contain central trapped, fully-grown oocytes.
Genetically, Tgkd teratomas originate from mature oocytes that have completed meiosis
I, suggesting that Tgkd teratomas originate from these trapped oocytes. The insertion of
the Tgkd transgene 3’ of the Inpp4b gene is associated with decreased expression of
INPP4B and changes in intracellular PI3 Kinase/AKT signaling in follicular granulosa
cells. An increase in granulosa cell proliferation and a decrease in apoptosis is also
observed in Tgkd GCs of late stage follicles. Because INPP4B is not expressed in fully-
grown wild-type or Tgkd oocytes, these findings suggest that enhanced activation of the
PI3K/AKT pathway caused by the decrease in INPP4B in granulosa cells promotes an
ovarian environment defective in folliculogenesis and conducive to teratoma formation.
ROLE OF THE INOSITOL PHOSPHATASE INPP4B IN THE GENERATION
OF OVARIAN TERATOMAS
Ashwini Balakrishnan, PhD
University of Pittsburgh, 2012

v
TABLE OF CONTENTS
PREFACE .................................................................................................................... XIV
ACKNOWLEDGEMENTS .......................................................................................... XV
NOMENCLATURE ................................................................................................... XVII
1.0 INTRODUCTION .................................................................................................... 1
1.1 STRUCTURE OF THE OVARY AND FOLLICULAR MATURATION . 1
1.1.1 Structure of the ovary .......................................................................... 1
1.1.2 Follicular maturation ........................................................................... 2
1.2 THE HYPOTHALAMIC-PITUITARY-OVARIAN (HPO) AXIS AND
FOLLICLE SELECTION ........................................................................................ 7
1.3 THE HUMAN MENSTRUAL AND MOUSE ESTROUS CYCLE .......... 13
1.4 PROMINENT SIGNALING PATHWAYS DURING FOLLICULAR
MATURATION IN THE OVARY ........................................................................ 15
1.5 OOCYTE MATURATION AND EGG ACTIVATION ............................. 17
1.6 OVARIAN TERATOMA BACKGROUND & INCIDENCE .................... 20
1.7 GENETIC ANALYSIS OF OTS AND TYPES OF ERROR ..................... 20
1.8 MOUSE MODELS OF OTS ......................................................................... 23
2.0 MATERIALS AND METHODS ........................................................................... 25
2.1 ANIMAL STUDIES ....................................................................................... 25

vi
2.2 SNP GENOTYPING OF OTS ...................................................................... 25
2.3 IDENTIFICATION OF TGKD INSERTION SITE ................................... 26
2.4 COLLECTION OF EMBRYOS ................................................................... 26
2.5 EMBRYONIC STEM CELL STUDIES ...................................................... 27
2.5.1 Embryonic stem (ES) cell derivation and generation of shRNA
clones 27
2.5.2 IGF1 stimulation protocol in ES cells ............................................... 28
2.5.3 ELISA analysis .................................................................................... 28
2.6 OVARY STUDIES ......................................................................................... 28
2.6.1 Collection of ovaries and oocytes ....................................................... 28
2.6.2 Ovarian morphometric analysis and follicle counting .................... 29
2.6.3 Oocyte parthenogenetic activation assay .......................................... 29
2.6.4 Granulosa cell culture ........................................................................ 29
2.6.5 Lentiviral transduction of GCs .......................................................... 30
2.6.6 Corpora lutea clearance assay ........................................................... 30
2.7 BISULFITE GENOMIC SEQUENCING .................................................... 31
2.8 SOUTHERN BLOT ANALYSIS OF Tgkd METHYLATION .................. 31
2.9 METHYLATION-SENSITIVE PCR ........................................................... 32
2.10 PCR FOR DETECTING NOVEL Inpp4b SPLICE ISOFORMS ........... 32
2.11 SINGLE NUCLEOTIDE PRIMER EXTENSION (SNuPE) ANALYSIS
33
2.12 REAL TIME PCR ........................................................................................ 33
2.13 IMMUNOBLOT ANALYSIS ..................................................................... 34

vii
2.14 BrDU INCORPORATION ASSAY ............................................................ 35
2.15 IMMUNOHISTOCHEMISTRY ................................................................ 35
2.16 RNA IN SITU HYBRIDIZATION (ISH) ................................................... 36
2.17 STATISTICAL ANALYSIS ........................................................................ 37
3.0 THE FVB-Tgkd STRAIN AS A MODEL TO STUDY OVARIAN
TERATOMA FORMATION ......................................................................................... 38
3.1 INTRODUCTION: THE FVB-Tgkd MOUSE STRAIN ............................ 38
3.2 ADVANTAGES OF THE FVB-Tgkd OT MODEL .................................... 43
3.3 GENOTYPING OF THE Tgkd MOUSE ..................................................... 43
3.4 STRAIN SPECIFICITY OF THE OT PHENOTYPE ............................... 46
3.5 CONCLUSIONS ............................................................................................ 49
4.0 OVARIAN DEFECTS ASSOCIATED WITH THE Tgkd OT MODEL .......... 50
4.1 AIMS OF THESE STUDIES ........................................................................ 50
4.2 ABNORMAL FOLLICLE MATURATION AND LUTEINIZED
FOLLICLE SYNDROME IN Tgkd OVARIES .................................................... 51
4.3 ABSENCE OF PREMATURE OVARIAN FAILURE IN Tgkd MICE .... 54
4.4 OVARIAN TERATOMAS ARISE FROM OOCYTES THAT HAVE
COMPLETED MEIOSIS I .................................................................................... 57
4.5 PARTHENOGENETIC ACTIVATION OF Tgkd OOCYTES ................. 60
4.6 ROLE OF OOCYTE Tgkd METHYLATION IN DEVELOPMENT OF
OTS 62
4.7 ROLE OF Tgkd METHYLATION IN STRAIN SPECIFICITY OF OT
PHENOTYPE .......................................................................................................... 64

viii
4.8 CONCLUSIONS ............................................................................................ 66
5.0 INSERTIONAL EFFECTS OF THE Tgkd TRANSGENE ................................ 67
5.1 AIMS OF THESE STUDIES ........................................................................ 67
5.2 MAPPING OF THE Tgkd TRANSGENE INTEGRATION SITE ........... 68
5.3 ALLELE SPECIFIC TRANSCRIPTION STUDIES ON GENES
SURROUNDING Tgkd INSERTION .................................................................... 71
5.4 TRANSCRIPTIONAL PROFILE OF INPP4B IN EMBRYONIC BRAIN
84
5.5 EFFECT OF Tgkd ON INPP4B EXPRESSION IN E13.5 EMBRYONIC
BRAIN ...................................................................................................................... 87
5.6 IMPACT OF THE Tgkd INSERTION ON SPLICE ISOFORMS OF
Inpp4b ....................................................................................................................... 91
5.7 CONCLUSIONS ............................................................................................ 92
6.0 ES CELL MODEL TO STUDY EFFECT OF Tgkd ON INPP4B AND
DOWNSTREAM SIGNAL TRANSDUCTION PATHWAYS ................................... 94
6.1 AIMS OF THESE STUDIES ........................................................................ 94
6.2 DEVELOPMENT OF THE Tgkd ES CELL MODEL AND
METHYLATION STATUS OF Tgkd IN ES CELLS .......................................... 95
6.3 EFFECT OF Tgkd ON INPP4B IN ES CELLS ......................................... 102
6.4 EFFECT OF Tgkd ON PI3-KINASE/AKT ACTIVATION IN ES CELLS
106
6.5 ASSESSING THE RELEVANCE OF INPP4B IN ES CELLS ............... 109
ix
6.6 EFFECT OF Tgkd ON METHYLATION OF SURROUNDING GENES
112
6.7 CONCLUSIONS .......................................................................................... 117
7.0 EFFECT OF Tgkd TRANSGENE ON INPP4B AND DOWNSTREAM PI3-
KINASE/AKT PATHWAY IN TGKD OVARIES ..................................................... 118
7.1 AIMS OF THESE STUDIES ...................................................................... 118
7.2 INPP4B EXPRESSION IN THE OVARY ................................................. 119
7.3 REGULATION OF INPP4B IN Tgkd OVARIES DURING
GONADOTROPHIN STIMULATION .............................................................. 124
7.4 REGULATION OF PI3-KINASE/AKT PATHWAY IN Tgkd OVARIES
ON GONADOTROPHIN STIMULATION ....................................................... 129
7.5 FUNCTIONAL CONSEQUENCES OF HYPERACTIVATION OF PI3-
KINASE/AKT SIGNALING IN Tgkd OVARIES .............................................. 139
7.6 CONCLUSIONS .......................................................................................... 146
8.0 DISCUSSION AND FUTURE DIRECTIONS .................................................. 147
8.1 EFFECT OF THE Tgkd TRANSGENE ON OT DEVELOPMENT ....... 147
8.2 INPP4B AND REGULATION OF PI3K/AKT PATHWAY ................... 148
8.3 ALTERED KINETICS OF THE PI3K/AKT PATHWAY LEADS TO OT
DEVELOPMENT ................................................................................................. 149
8.4 EFFECT OF INPP4B LEVELS ON OT PHENOTYPE .......................... 151
8.5 EFFECT OF Tgkd ON INPP4B IN THE ES CELL MODEL ................. 153
8.6 CELL AUTONOMOUS AND NON-AUTONOMOUS ORIGINS OF OTS
154

x
8.7 STRAIN SPECIFICITY OF THE OT PHENOTYPE ............................. 155
8.8 OT DEVELOPMENT IS A MULTIFACTORIAL PROCESS ............... 156
8.9 FUTURE DIRECTIONS ............................................................................. 160
APPENDIX A ................................................................................................................. 163
APPENDIX B ................................................................................................................. 165
APPENDIX C ................................................................................................................. 170
BIBLIOGRAPHY .......................................................................................................... 171

xi
LIST OF TABLES
Table 1: Analysis of meiotic error in human OTs ............................................................. 22
Table 2: Analysis of viability of hemizygous and homzygous FVB-Tgkd embryos ........ 42
Table 3: Strain specific effects on OT phenotype ............................................................. 48
Table 4: OTs arise from mature oocytes that have completed meiosis I ........................... 59
Table 5: Analysis of F1 hybrids for allelic specific expression ........................................ 73
Table 6: Derivation of Tgkd ES cell lines and expected methylation state ....................... 97
xii
LIST OF FIGURES
Figure 1: Stages of follicular maturation ............................................................................. 7
Figure 2: Initial and cyclic recruitment of follicles ........................................................... 10
Figure 3: Positive and negative regulation in the HPO axis .............................................. 12
Figure 4: Serum levels of hormones during the human menstural cycle .......................... 14
Figure 5: Arrests in meiosis during follicular maturation ................................................. 19
Figure 6: Structure and description of the Tgkd transgene ................................................ 39
Figure 7: Genotyping of the Tgkd transgene in FVB-Tgkd mice ...................................... 45
Figure 8: Defects in follicular maturation in Tgkd ovaries ................................................ 54
Figure 9: Fertility studies with Tgkd mice ......................................................................... 56
Figure 10: Parthenogenetic activation studies in wildtype and Tgkd oocytes ................... 61
Figure 11: Role of oocyte Tgkd methylation in OT formation .......................................... 63
Figure 12: Tgkd transgene methylation on the 129 background ....................................... 65
Figure 13: Schematics of the location of the Tgkd insertion site on chromosome 8 ......... 70
Figure 14: Representation of the SNuPE Assay ................................................................ 74
Figure 15: Imprinting status of the Tgkd transgene in F1 hybrid progeny ........................ 76
Figure 16: SNuPE analysis of genes on chromosome 8 centromeric relative to Tgkd ...... 80
Figure 17: SNuPE analysis of genes telomeric relative to the Tgkd insertion .................. 84

xiii
Figure 18: Determining Inpp4b levels across gestation .................................................... 86
Figure 19: Effect of Tgkd on Inpp4b levels in E13.5 embryos ......................................... 90
Figure 20: PCR genotyping of ES cell lines and maintenance of Tgkd methylation ...... 101
Figure 21: Tgkd induced effects on Inpp4b levels in ES cells ........................................ 105
Figure 22: Kinetics of the PI3-Kinase/AKT pathway in Tgkd ES cell lines ................... 108
Figure 23: shRNA-mediated downregulation of Inpp4b in mouse ES cells ................... 111
Figure 24: CpG islands examined by HpaII-McrBC PCR .............................................. 114
Figure 25: CpG island methylation in Tgkd ES cell lines ............................................... 116
Figure 26: INPP4B expression in the ovary .................................................................... 120
Figure 27: Inpp4b expression in the adult wildtype ovary .............................................. 123
Figure 28: Inpp4b expression in oocyte and GCs of PD30 ovaries ................................ 123
Figure 29: Inpp4b transcript and protein levels in wildtype and Tgkd ovaries ............... 126
Figure 30: INPP4B expression in wildtype and Tgkd GCs ............................................. 128
Figure 31: Role of INPP4B in regulation of the PI3K/AKT pathway ............................ 130
Figure 32: Activation of PI3K/AKT pathway in Tgkd ovaries on PMSG stimulation ... 132
Figure 33: Activation of PI3K/AKT pathway in Tgkd ovaries on HCG stimulation ...... 135
Figure 34: Kinetics of PI3K/AKT activation in Tgkd oocytes and GCs ......................... 137
Figure 35: shRNA-mediated downregulation of INPP4B in wildtype GCs .................... 138
Figure 36: Comparison of GC proliferation in wildtype and Tgkd ovaries ..................... 140
Figure 37: Comparison of apoptosis in wildtype and Tgkd ovaries ................................ 141
Figure 38: Persistence of corpora lutea in wildtype and Tgkd ovaries ............................ 143
Figure 39: FOXO1 localization in wildtype and Tgkd PD30 ovaries ............................. 145
Figure 40: Model of Tgkd induced OT formation ........................................................... 160

xiv
PREFACE
Chapters of this dissertation contain results from a peer reviewed published
manuscript on which I am first author:
Ashwini Balakrishnan and J.Richard Chaillet. Role of the inositol
polyphosphate-4-phosphatase type II Inpp4b in the generation of ovarian teratomas.
Developmental Biology. Oct 16 2012. PMID: 23078915

xv
ACKNOWLEDGEMENTS
I would first and foremost like to thank my thesis advisor Dr. Richard Chaillet for his
constant support and encouragement during my graduate school years. He gave me the
freedom to chose my research area, develop relevant hypotheses, troubleshoot hurdles
and shape the direction of the project. With his guidance, I was able to design thoughtful
experiments, which gave us exciting insights on the etiology of ovarian teratomas. Most
importantly, the time spent in his lab has given me the confidence and ability to approach
scientific problems in a rational and independent manner. Thank you Dr. Chaillet!
I thank my thesis committee Drs. Marie DeFrances, Denise O’Keefe, Urvashi
Surti, William Walker and Jes Klarlund for all the advice and technical help, which
helped make my project more tractable. They motivated me to pursue alternate
hypotheses and helped me keep up my morale in the face of negative data. They always
encouraged me to improve my technical skills and reasoning abilities, assets that will
always remain with me. Thank you for all the advice in my thesis project and all my
scientific endeavors. Many thanks to Dr. Anthony Zeleznik for an enormous amount of
help with many difficult experiments.

xvi
I would like to thank several past and present members of the Chaillet lab for help
with troubleshooting and discussions during experimental design. I thank Ben, our lab
manager for helping me with numerous experiments, tolerating last minute orders for
reagents and the much-needed coffee breaks. I would like to thank Ceci, who was a
valuable guide during my initial years in the lab and taught me many of the techniques
relevant to my project. Thank you, Kata for the help, encouragement and humor, which
made us good-natured even when our experiments refused to co-operate. I also thank
Ewa, Mohan and Dino for their advice. Many thanks to fellow grad students Erik and Jim
for their help and sharing the Oohs and Aahs of grad school with me. Thank you Chaillet
lab for a wonderful and friendly learning environment. I would also like to thank my
classmates and friends for many fun-filled times after long days in lab. Special thanks to
my friends Kristina and Revati for helping me stay positive and jovial when the times
were tough.
I am grateful to my parents and my brother Karthik for their love, support and
constant encouragement during my years in graduate school. My parents always
encouraged me to dream big and follow my goals with great zeal. Last but not least, I
thank grad school for introducing me to my husband Hetu. Life and graduate school has
been a fulfilling experience with him. His scientific curiosity and excitement has always
motivated me to be a better scientist.
“Sometimes our light goes out but is blown into flame by another human being. Each of
us owes deepest thanks to those who have rekindled this light.” Albert Schweitzer

xvii
NOMENCLATURE
Tgkd mice – Hemizygous FVB-Tgkd mice Cyclin-dependent kinase 1 – Cdk1
Tgkd(m)/+ – Hemizygous Tgkd (maternal
inheritance) Myelin transcription factor 1 – Myt1
Tgkd(p)/+ – Hemizygous Tgkd (paternal
inheritance) Cytostatic factor – CSF
Tgkd/Tgkd – Homozygous Tgkd Anaphase promoting complex/cyclosome –
APC/C
Ovarian teratoma – OT Single nucleotide polymorphism – SNP
FVB/N – FVB Embryonic stem cell – ES cell
C57BL/6 – B6 Insulin growth factor 1 – IGF1
129/Sv – 129 Germinal vesicle – GV
Primordial germ cells – PGC Intra-peritoneal – IP
Embryonic day – E Hematoxylin and eosin – H&E
Granulosa cell – GC Short hairpin RNA – shRNA
Follicle stimulating hormone – FSH Reverse transcription PCR – RT-PCR
Luteinizing hormone – LH Untranslated region – UTR
Post natal day – PD Single Nucleotide Primer Extension - SnuPE

xviii
Hypothalmic pituitary ovary – HPO TATA-binding protein – TBP
G protein coupled receptor – GPCR Beta glucuronidase – GUSB
Gonadotrophin-releasing hormone –GnRH Bromodeoxyuridine – BrdU
Pregnant mare serum gonadotrophin –
PMSG Immunohistochemistry – IHC
Human chorionic gonadotropin – HCG In situ hybridization – ISH
Cumulus enclosed oocyte – COC Rous sarcoma virus – RSV
Small interfering RNA – siRNA Long terminal repeat – LTR
Cyclic AMP – cAMP Differentially methylated domain – DMD
Protein kinase A – PKA Ovarian teratoma susceptibility – Ots
Phosphatidylinositol-3 kinase – PI3K Phosphorylated-AKT – P-AKT
Acute transforming retrovirus thymoma –
AKT Phosphorylated-FOXO1 – P-FOXO1
Mitogen-activated protein kinase – MAP
kinase Pten – Phosphatase and tensin homolog
Epidermal growth factor – EGF Maturation promoting factor – MPF
Forkhead box O - FOXO Metaphase II arrested oocyte –MII oocyte

1
1.0 INTRODUCTION
1.1 STRUCTURE OF THE OVARY AND FOLLICULAR MATURATION
1.1.1 Structure of the ovary
The ovary is one of the primary organs of the female reproductive system. The ovary is a highly
organized composite structure composed of germ cells (oocytes) and somatic cells (granulosa
cells, thecal cells and stromal cells). The adult ovary is involved in 2 major processes: release of
eggs (oocytes) for fertilization and production of the hormones estradiol and progesterone. The
ovary fulfills 2 major objectives, which are generation of fertilizable ova and preparation of the
endometrium for implantation of fertilized eggs through secretion of estradiol and progesterone.
Adult human ovaries are 2-5cm in length, 1.5-3cm in width and 0.5-1.5cm in thickness
[1]. Paired ovaries lie on either side of the uterus in the pelvic cavity and are connected to the
uterus by ovarian ligaments. The ovaries lie close to the posterior and lateral pelvic wall and are
attached to the posterior surface by a peritoneal fold called the mesovarium. Blood vessels,
nerves and lymphatics traverse the mesovarium and enter the ovary at the hilium. The ovary
consists of 3 distinct regions, which are the outer cortex, inner medulla and hilium. The cortex
consists of an outer layer of connective tissue called the tunica albuginea covered by a single
layer of cuboidal germinal epithelium and an inner zone of ovarian follicles. The inner medulla is
2
composed of mainly vascularized stromal tissue. Blood vessels, nerves and lymphatics traverse
the mesovarium and enter the ovary at the hilium [2]. The ovarian follicle is a basic functional
unit of the ovary and consists of a single oocyte surrounded by somatic cells. Follicles at earlier
stages of development lie adjacent to the tunica in an avascularized layer while more advanced
growing follicles are present at the cortico-medullary border, where they are surrounded by
stromal cells and vasculature.
1.1.2 Follicular maturation
During embryogenesis, the mammalian gonad develops between the coelomic epithelium and the
mesonephros adjacent to the urogenital ridge. The gonad is designated as a bipotential or
indifferent gonad at this stage as development is identical in the male and female lineage. The
primordial germ cells (PGCs) migrate from the yolk sac into the indifferent gonad and can be
identified as alkaline phosphatase-positive cells. Once the PGCs colonize the female gonad, they
proliferate and differentiate into oocytes by entering meiosis by embryonic day 13.5 (E13.5) in
the mouse. Development of germ cells into the male or female lineage depends on their
interactions with the surrounding somatic cells. Before the formation of the ovarian follicle, the
oocytes exist as germ cell clusters or nests due to incomplete cytokinesis after the mitotic
proliferation of the PGCs. These germ cell nests break down to form primordial follicles
consisting of a single oocyte arrested early in meiosis surrounded by a single layer of flattened
squamous pregranulosa cells (Figure 1). Breakdown of the germ cell nests occur prenatally in
humans and shortly after birth in the mouse [3]. The formation of primordial follicles is
associated with massive apoptosis of germ cells resulting in a decline in this cell population in
humans from 6 million to 1 million at birth. The primordial follicle serves as the quiescent

3
ovarian reserve and recruitment of ovarian follicles for subsequent maturation from this pool
constantly depletes the ovarian supply of female germ cells. The two types of recruitment
processes in the ovary are initial recruitment of primordial follicles from the quiescent pool and
cyclic recruitment of small growing follicles for further maturation and ovulation [4]. The factors
that initiate primordial follicle recruitment are not well understood but primordial follicles
develop into primary follicles and this is marked morphologically by the differentiation of the
squamous pregranulosa cells to cuboidal granulosa cells (GCs). This process is thought to be
follicle stimulating hormone (FSH) independent, as these follicles do not possess FSH receptors
[5, 6]. Follicle maturation involves 2 simultaneous processes, which are the growth of the oocyte
and acquisition of additional layers of GCs. Primordial follicles develop into primary follicles,
which develop into secondary follicles when they acquire an additional layer of GCs (Figure 1).
Subsequent preantral folliculogenesis involves oocyte growth, acquisition of several layers of
GCs and appearance of the outermost layer of thecal cells. Preantral follicles with more than 2
layers of GCs start expressing the FSH receptor, which is required during later stages of
maturation. Preantral growth of the recruited follicles occurs 10-12 days after birth in the mouse
[7]. Follicle development up until the preantral stage is considered gonadotrophin-independent as
in mice deficient for the FSH receptor, healthy preantral follicles are observed but follicles do
not progress beyond this stage of development [8]. However morphometric analysis of follicle
numbers was not performed in this study and other mouse models with defective gonadotrophin
production displayed lower numbers of healthy preantral follicles than controls with many
preantral follicles depicting structural abnormalities [9-11]. Preantral folliculogenesis involves
complex bidirectional communication between the oocyte and surrounding GCs. The oocyte
relies on somatic GCs for growth and development, however the rate of follicular development is

4
determined by the oocyte. This was demonstrated in an experiment using reaggregated ovaries
consisting of oocytes from postnatal day 12 (PD12) mice and somatic cells from ovaries from
newborn mice [7]. These reaggregated ovaries showed accelerated folliculogenesis compared to
control reaggregated ovaries, when both the somatic cells and oocytes were from newborn mice.
The oocytes of PD12 ovaries were at a more advanced stage of growth hence were able to
accelerate the rate of folliculogenesis compared to oocytes from newborn ovaries. Once the
follicles acquire 3-6 layers of GCs, they acquire an additional outer later of thecal cells. The
theca can be divided into the theca interna and the theca externa, which serve different roles later
in folliculogenesis. Maturation of the ovarian follicle from the primordial stage to the preantral
stage is classified as the phase of initial recruitment as it can occur in the absence of the cyclical
rise in gonadotrophin levels.
Further stages of ovarian follicle maturation and ovulation are dependent on the release
of gonadotrophin hormones by the anterior pituitary and these stages of follicle maturation are
designated as cyclic recruitment. The exact mechanism by which these hormones regulate
follicle survival and selection is defined in the next section. A subset of the preantral follicles in
the presence of the gonadotrophin FSH acquire multiple fluid-filled spaces, which eventually
coalesce to form a single antral cavity. These antral follicles have 2 types of GCs, those that line
the outer wall of the follicle called mural GCs and GCs that surround the oocyte called cumulus
GCs (Figure 1) [12]. Mural GCs line the follicle wall and play a vital role in steroidogenesis and
ovulation. Cumulus GCs are in close contact with the oocyte through connexin junctions and
promote oocyte growth and developmental competence, while maintaining meiotic arrest of the
oocyte. Depending on the species, one or more of the early antral follicles is able to promote its
growth into the preovulatory stage and are known as graafian follicles. Graafian follicles are

5
known as dominant follicles as they not only are able to promote their growth but also are able to
promote atresia of other early antral follicles [4]. The preovulatory follicle contains an oocyte
competent to reenter meiosis and its formation precedes the rapid release or surge of the
luteinizing hormone (LH). This surge triggers the completion of meiosis I in the oocyte, which
then arrests in the metaphase II (MII) stage of meiosis [13] The LH surge also triggers ovulation
of the mature oocyte and the remnants of the follicles are converted into a steriodogenic structure
called the corpus luteum. The GCs of the ovarian follicle show a high rate of proliferation from
the preantral stage [14]. Transformation of the preovulatory follicle into the corpus luteum
involves cell cycle exit and terminal differentiation of GCs and thecal cells into non-proliferative
luteal cells [15]. The main function of the corpus luteum is the production of progesterone,
which is required for the initiation and maintenance of pregnancy [2]. In summary, the
primordial follicle undergoes a process of initial and cyclical recruitment and matures through
the primary, secondary, preantral, antral and preovulatory stages prior to ovulation. The adult
ovary is heterogenous organ and multiple follicles in different stages of maturation are observed
simultaneously in the ovarian cortex. Pedersen and Peters suggested a more robust classification
of ovarian follicles at different stages of maturation, based on the number of GCs present at each
stage of maturation (Figure 1) [16].

6
Prim
ary
Prim
ordi
al
Seco
ndar
y Prea
ntra
l Antra
lPr
eovu
lato
ryO
vula
tion
Cor
pus
Lute
um
FSH
LHG
onad
otro
phin
Inde
pend
ent g
row
th
Type
3b
Type
4
Type
5
Type
6
Type
8
Type
2-3
a

7
Figure 1: Stages of follicular maturation
The various stages of follicle maturation from primordial follicle recruitment to ovulation and
corpus luteum formation are represented in the above figure. The development of the follicle up
to the preantral stage is considered gonadotrophin independent. The gonadotrophin hormone
FSH is required for acquisition of the antrum and subsequent maturation, while the LH surge is
required for ovulation and corpus luteum formation. Type 2 - Type 8 represent the Pedersen and
Peters classification [16].
1.2 THE HYPOTHALAMIC-PITUITARY-OVARIAN (HPO) AXIS AND FOLLICLE
SELECTION
The selection and survival of early antral follicles to the preovulatory stage is mediated by
hormones secreted by the hypothalamus, the anterior pituitary and the ovaries, which play a very
vital role in successful ovulation of the oocyte [17, 18]. Because this process is associated with
cyclical changes in levels of hormones, the process is considered the cyclical stage of follicle
recruitment (Figure 2) [4].
The primary event in the HPO axis in the process of follicle maturation is the pulsatile
release of a decapeptide called gonadotrophin-releasing hormone (GnRH) by GnRH secreting-
neurons in the hypothalamus [19]. The pulsatile release of GnRH causes the pulsatile release of 2
gonadotrophins from the anterior pituitary namely FSH and LH. The pulsatile nature of GnRH is
8
important as continuous levels of GnRH during early follicular maturation causes desensitization
of the receptors and cessation of FSH and LH production [20, 21]. FSH and LH are glycoprotein
hormones consisting of non-covalently bonded α and β subunits. They share a common α
subunit but possess unique β subunits, which confer receptor specificity [19]. The receptors of
FSH and LH are G-protein coupled receptors (GPCR) with 7 transmembrane domains. The
pulsatile generation of GnRH appears to favour the rise in FSH levels during early follicular
maturation over LH and this phenomenon may be regulated by the frequency of GnRH release
by the hypothalamus [22, 23]. The increase in FSH levels recruits a cohort of early antral
follicles to escape atresia and progress in follicular maturation [4]. In humans, one of the follicles
manages to grow faster than the rest of the cohort and the reason for the growth advantage is not
well understood. This follicle, which is known as the dominant follicle is observed to have an
abundance of FSH receptors and abundant well-developed vasculature in the thecal layers [24,
25]. Cells in the theca interna of the dominant follicle have LH receptors and are steroidogenic in
nature. The thecal cells respond to LH by upregulating enzymes involved in steroid production
and are involved in the production of androstenedione. GCs in the dominant follicle produce the
enzyme aromatase (CYP19A1) and convert the secreted androgen from the thecal cells into
estradiol [26]. Therefore, the increase in serum FSH seen in the early follicular phase is followed
by an increase in the levels of serum estradiol and inhibins produced by the GCs of the dominant
follicle. Increasing levels of estradiol exert a negative feedback on the production of FSH and
LH from the pituitary and on the pulsatile secretion of GnRH from the hypothalamus [27]. This
feedback inhibition by estradiol causes a drop in the levels of serum FSH. FSH acts as a survival
factor during late antral folliculogenesis and a drop in FSH levels causes atresia of the recruited
antral follicles. The dominant follicle is sensitive to lower levels of FSH possibly due to the

9
abundance of FSH receptors and the GCs of the dominant follicle begin to express LH receptors
[28]. The estradiol produced by the dominant follicle also induces FSH receptor expression in
the GCs and promotes follicular growth in the dominant follicle through its mitogenic activity
and stimulation of local growth factors. Through these mechanisms, the dominant follicle is able
to promote its own follicular growth in low FSH conditions and induce atresia in the other
recruited antral follicles. In polyovulatory species such as rodents, the only difference in the
mechanism of follicle selection is the lowering of the FSH threshold by the negative feedback
through estradiol [4]. Lower levels of negative feedback in polyovulatory species allow multiple
follicles to become dominant and develop to the preovulatory stage.

10
PrimordialPrimary
Preantral
Antral
Dominant follicle
Atresia
Initial Recruitment
Cyclic RecruitmentSelection & Dominance
Ovulation
??? >120 days 71days 14 days
>30 days 28 days 2-3 days
Human
Rat
Figure 2: Initial and cyclic recruitment of follicles
The initital and cyclic recruitment phases are represented in the above figure. Initial recruitment
of follicles is continuous and independent of the cyclical gonadotrophin surges and involves
primordial recruitment to early antral follicle formation. The cyclic recruitment is affected by the
cyclic changes of FSH, which induce the processes of dominant follicle selection, non-dominant
follicle atresia and ovulation of the dominant follicle. Adapted from [4].

11
There is a steady increase in estradiol production during the growth of the preovulatory
follicle, which reaches a peak just before the LH surge. The high level of estradiol produced by a
mature preovulatory follicle with a meiotically competent oocyte acts as a positive feedback on
GnRH production causing a continuous surge of GnRH production from the hypothalamus [29].
This GnRH surge is followed by a preovulatory surge in LH levels, which is responsible for
initiating the process of ovulation [30]. The LH surge stimulates a series of ovarian gene
expression cascades resulting in the production of inflammatory mediators such as
prostaglandins and proteolytic enzymes, which cause degradation of the perifollicular matrix of
the follicle [3]. The LH surge also triggers the oocyte to complete meiosis I, and the oocyte is
ovulated through the ruptured follicular wall. The basal lamina between the GCs and thecal cells
breaks down and the vessels in the thecal layer invade the previously avascular GC zone of the
follicle. The GCs and thecal cells exit the cell cycle and differentiate into steroidogenic luteal
cells, which produce estrogen and progesterone in the newly formed corpus luteum [31]. The
progesterone and estradiol produced by the corpus luteum suppresses FSH and LH secretion by
the pituitary [18]. In the absence of pregnancy, regression of the corpus luteum in the late luteal
phase causes a decrease in progesterone levels allowing an increase in FSH production by the
pituitary. This paves way for a new cycle of folliculogenesis causing cyclic recruitment of a new
batch of antral follicles. In summary, the hormones of the HPO axis control the phases of follicle
maturation and the stage of follicle maturation can be identified by the profile of these hormones
(Figure 3).

12
Hypothalamus
Anterior pitutary
Ovary
GnRH
FSH, LH
+
+
EstradiolInhibin B
- inhibition
Figure 3: Positive and negative regulation in the HPO axis
The HPO axis plays a major role in the cyclic recruitment of follicles and follicle selection. The
hypothalamus secretes GnRH, which induces secretion of FSH and LH from the pituitary. FSH
and LH stimulate estradiol production by the GCs of the dominant follicle. Estradiol inhibits the
production of FSH and LH, lowering serum FSH levels and promoting atresia in non-dominant
antral follicles dependent on FSH for survival.

13
1.3 THE HUMAN MENSTRUAL AND MOUSE ESTROUS CYCLE
The menstrual cycle in women illustrates the hormonal changes that take place during the
process of cyclic follicle recruitment, selection, ovulation and corpus luteum formation (Figure
4). In terms of follicular development, the menstrual cycle is divided into the follicular phase
and the luteal phase [32]. The luteal phase is marked by the preovulatory LH surge, which results
in ovulation of the oocyte and corpus luteum formation. The corpus luteum produces
progesterone and estrogen, which suppress levels of FSH and LH during the luteal phase [4].
Regression of the corpus luteum causes a decrease in progesterone and estrogen levels in the
transition between the luteal and follicular phase, which results in an increase in FSH levels in
the early follicular phase. Progression through the follicular phase involves follicle maturation
and a subsequent increase in estradiol levels and decrease in FSH levels during the process of
follicle selection.
The menstrual cycle can also be classified into the menstrual, proliferative and secretory
phases based on the lining of the endometrium, which is highly sensitive to ovarian steroid
hormones [32]. The most luminal layer of the endometrium called the functionalis is thickened
and sloughed off during the menstrual phase due to low levels of estradiol, which coincides with
the luteal follicular transition and early follicular phase. The next phase of the cycle is termed as
the proliferative phase as the endometrial layer thickens and has proliferation of stromal cells and
glands due to the high levels of estradiol during the mid ovarian follicular phase. The luteal
phase of follicle maturation is known as the secretory phase as high levels of progesterone cause
production of glycogen and mucus, when the endometrium becomes decidualized and receptive
to the fertilized embryo. In the absence of pregnancy, there is a drop in progesterone and
estrogen levels leading back to the menstrual phase of the cycle (Figure 4).

14
FSH
Estrogen
LH surge
Progesterone
Follicular phase Luteal phase
Ovulation
Figure 4: Serum levels of hormones during the human menstural cycle
The level of different hormones during the menstrual cycle is represented in the above diagram.
In the early follicular phase, a rise in FSH levels promotes follicle maturation and increase in
estrogen levels, which suppresses the levels of FSH. After the midcycle LH surge, ovulation
occurs and the corpus luteum is formed. Progesterone and estrogen secretion by the corpus
luteum suppress FSH and LH levels. Regression of the corpus luteum at the end of the luteal
phase causes a rise in FSH levels. Adapted from [33].

15
The main difference between the menstrual cycle and the estrus cycle is the reabsorption
of the endometrium in the absence of pregnancy in the estrous cycle. The mouse estrous cycle is
4-6 days in length and consists of 4 stages [34]. The proestrous stage is the first stage when a
new batch of follicles reach maturity in the ovarian follicle and serum estrogen levels rise. The
estrous stage involves the final stage of selection and ovulation of the fully mature oocytes. The
estrous stage is when the female is maximally receptive to the male and estrus begins after
midnight lasting 6-8 hours on standard light-dark cycle. Metestrus is the phase during corpora
lutea formation and when the mature egg moves through the oviduct and the uterus. If pregnancy
does not occur, diestrus is the phase when unfertilized eggs are eliminated and the corpora lutea
regress. The proestrous and estrous phase constitute the follicular phase of ovarian maturation
while the metestrus and diestrus phases comprise of the luteal phase. The period of
gonadaotrophin induced cyclic recruitment and follicle selection takes 2-3 days in mice (Figure
2). The process of follicular maturation can be mimicked to induce ovulation in immature mice
by single precisely timed intraperitoneal injections of pregnant mare serum gonadotrophin
(PMSG) and Human chorionic gonadotropin (HCG), which are analogs of FSH and LH
respectively with a long half-life [35].
1.4 PROMINENT SIGNALING PATHWAYS DURING FOLLICULAR
MATURATION IN THE OVARY
Numerous transcription factors and signal transduction pathways are involved during the entire
process of folliculogenesis from the primordial stage to the formation of the corpus luteum [3,
36]. FSH binds to its receptor in GCs, which is a GPCR and activates a classical adenyl cyclase/

16
cAMP/PKA signal transduction pathway that directly regulates many target genes such as
aromastase, inhibin and the LH receptor. FSH also activates independently or through cAMP
mediated mechanisms many signal transduction molecules such as PI3-kinase/AKT, SRC, RAS
and MAP kinase and their downstream pathways [36, 37]. FSH induces a pro-proliferative
pathway in GCs, whereas LH induces cell cycle exit. LH binding to the LH receptor also
stimulates PKA, PI3K/AKT, RAS signaling cascades, which are critical for ovulation. The LH
surge triggers release of EGF-like factors, which is critical for cumulus cell expansion and
ovulation [3, 36]. The LH surge turns off the FSH gene expression program in preovulatory GCs
and turns on genes controlling matrix formation and inflammation.
One of the primary signal transduction pathways activated in GCs by FSH is the
phosphatidylinositol-3 kinase (PI3K)/acute transforming retrovirus thymoma (AKT) signal
transduction pathway. The PI3K/AKT pathway plays a vital role during many stages of
folliculogenesis. The PI3K/AKT pathway regulates PGC migration, survival and primordial
follicle recruitment [38-40]. The pathway has also been shown to be critical for gonadotophin
mediated-GC differentiation, cumulus cell expansion and resumption of oocyte meiosis [41-45].
This pathway is necessary but not sufficient for the induction of many FSH target genes in GCs
such as LH receptor, 3β-hydroxysteroid dehydrogenase, aromatase, and inhibin [44]. One of the
main functions of this pathway in GCs is to promote G1/S phase transition in the cell cycle.
Activation of the PI3K/AKT pathway promotes phosphorylation and degradation of the
transcription factor FOXO1 relieving transcriptional repression on the S phase Cyclin D2 [46].
An increase in Cyclin D2 levels is seen after PMSG stimulation, while Cyclin D2 null ovaries
depict defective GC proliferation and block in folliculogenesis [47]. Deletion of the Pten
(negative regulator of PI3K/AKT pathway) gene in GCs led to hyperactivation of AKT on

17
gonadotrophin stimulation in GCs [48]. Increased phosphorylation of AKT was associated with
degradation of FOXO1, higher levels of Cyclin D2 and an increase in GC proliferation in this
model. This was associated with increased rate of ovulation and litter sizes from females with
Pten-/- GCs. The PI3K/AKT pathway also appeared to play a role in corpora lutea clearance in
this model as persistent non-functional corpora lutea were observed in females with Pten-/- GCs.
In summary, the PI3K/AKT pathway is one of the primary signal transduction pathways that
promote the proliferative effects of FSH in GCs. Components of the PI3K/AKT pathway are
examined in detail in this thesis.
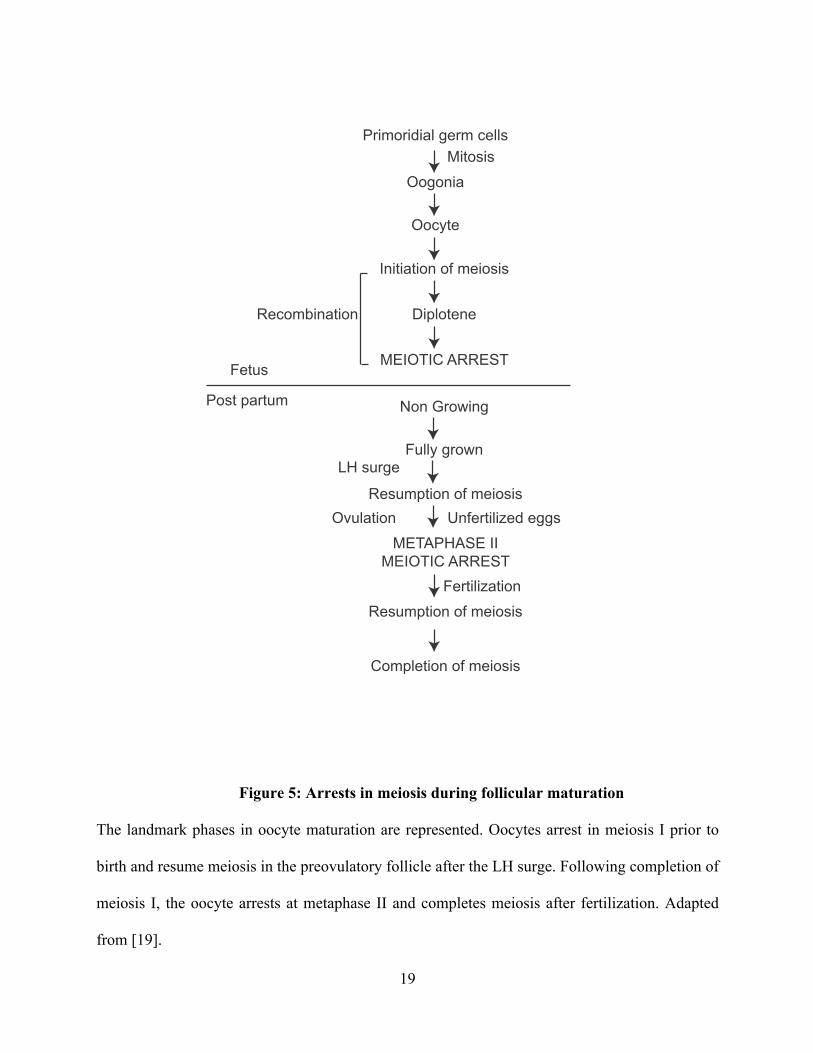
1.5 OOCYTE MATURATION AND EGG ACTIVATION
During the process of folliculogenesis, oocytes arrest early in meiosis in the diplotene stage prior
to completion of meiosis I in the embryonic gonad around E14.5 (Figure 5). The oocyte acquires
competence to resume meiosis at the antral stage due to achieving a threshold in the
accumulation of the complex maturation promoting factor (MPF) complex, which consists of the
proteins CDK1 and cyclin B [49]. The oocyte resumes meiosis only after the LH surge, hence
this complex is maintained in the inactive state in the antral follicle. It is known that the follicular
milieu specifically the mural GCs maintain meiotic arrest of the oocyte as removal of cumulus
enclosed oocytes (COCs) from antral follicles causes meiotic resumption of the oocyte. Further
high cAMP levels in oocytes are required to maintain meiotic arrest as phosphodiesterase
inhibitors prevent a decrease in intra-oocyte cAMP levels and meiotic resumption [50]. The
activity of CDK1 of MPF is negatively regulated by phosphorylation on Threonine 14 and
Tyrosine 15 residues by the protein kinases WEE1/MYT1 [3, 51]. The phosphatase CDC25

18
dephosphorylates these residues thereby activating CDK1. During meiotic arrest, high cAMP
levels in the oocyte activate PKA, which phosphorylates CDC25 and sequesters it in the
cytoplasm in association with the protein 14-3-3 [52]. The LH surge causes a decrease in intra-
oocyte cAMP levels resulting in dephosphorylation of CDC25. The CDC25 phosphatase
activates CDK1 causing activation of MPF and reentry into meiosis. The first morphological
change in the oocyte is the breakdown of germinal vesicle (GV) or nuclear membrane followed
by asymmetric division of the cytoplasm and extrusion of the first polar body. A decline in MPF
activity is required for progression into anaphase and telophase of meiosis I and increase in MPF
levels is seen at metaphase II [53].
After completion of meiosis I, the ovulated oocyte is arrested at metaphase II due to the
activity of the cytostatic factor (CSF). The MOS serine/threonine kinase is a vital component of
CSF and causes oocyte metaphase II arrest by stabilizing MPF [54]. CSF stabilizes MPF by
inhibiting the E3 ubiquitin ligase anaphase promoting complex/cyclosome (APC/C), which
targets cyclin B for degradation [55]. Oocytes from mos-/- mice demonstrate an inability to
maintain metaphase II arrest and thereby undergo parthenogenetic cleavage [56, 57]. The oocyte
completes the final stage of meiosis after fertilization, after introduction of phospholipase C into
the oocyte cytoplasm by the sperm [55, 58]. This triggers calcium oscillations in the oocyte
activating APC/C leading to cyclin B degradation and completion of meiosis.
19
Primoridial germ cells
Oogonia
Oocyte
Initiation of meiosis
Diplotene
MEIOTIC ARRESTFetus
Post partum Non Growing
Fully grown
Resumption of meiosis
METAPHASE IIMEIOTIC ARREST
Resumption of meiosis
Completion of meiosis
Mitosis
Recombination
LH surge
Ovulation Unfertilized eggs
Fertilization
Figure 5: Arrests in meiosis during follicular maturation
The landmark phases in oocyte maturation are represented. Oocytes arrest in meiosis I prior to
birth and resume meiosis in the preovulatory follicle after the LH surge. Following completion of
meiosis I, the oocyte arrests at metaphase II and completes meiosis after fertilization. Adapted
from [19].
20
1.6 OVARIAN TERATOMA BACKGROUND & INCIDENCE
Ovarian teratomas (OTs) are tumors of the ovary derived from non-ovulated female germ cells
that have undergone parthenogenetic activation and display a disorganized pattern of cellular
differentiation [59, 60]. Human OTs are relatively common, constituting 95% of all ovarian
germ cell tumors [60]. Most OTs are benign but a small percentage (1-2%) transform into
malignant tumors [61]. OTs contributed to 1.5% of the invasive ovarian cancer cases in the
United States between 2004 and 2008 [62]. OTs are also seen at a low frequency in other
mammalian species, including the mouse [63]. Most OTs are benign and are composed of
differentiated ectodermal, mesodermal and endodermal tissues, proportions varying from
teratoma to teratoma. Immature OTs contain undifferentiated cells (primarily immature
neuroepithelium or embryonal carcinoma cells) in addition to the differentiated tissues and have
malignant potential.
1.7 GENETIC ANALYSIS OF OTS AND TYPES OF ERROR
Human OTs arise due to the parthenogenetic activation of an oocyte caused by errors in meiosis
or initiation of OT formation at a follicular stage prior to the resumption of meiosis. Oocytes as
described are arrested in prophase of meiosis I until ovulation and are arrested in metaphase II
until fertilization. Five mechanisms have been proposed to explain the origin of human OTs.
These mechanisms can be distinguished by analyzing a series of pericentric and distal markers
on different chromosomes in the teratoma DNA, which are identified as heterozygous in the host
tissue (Table 1) [64].

21
Human OTs originate from oocytes at all meiotic stages, although most develop by Type
II error from oocytes that have completed meiosis I [64-69]. Rarely, benign cystic ovarian
teratoma and specific malignant germ cell tumor cases have been observed within families,
suggesting one or more underlying genetic etiologies [70-75]. However, the majority of OTs
occur sporadically. No associations with known genetic loci have been established in either
familial or sporadic OT cases. The absence of a clear genetic association raises the possibilities
that mutations in many different genes can cause OTs or that non-genetic etiologies are common.
22
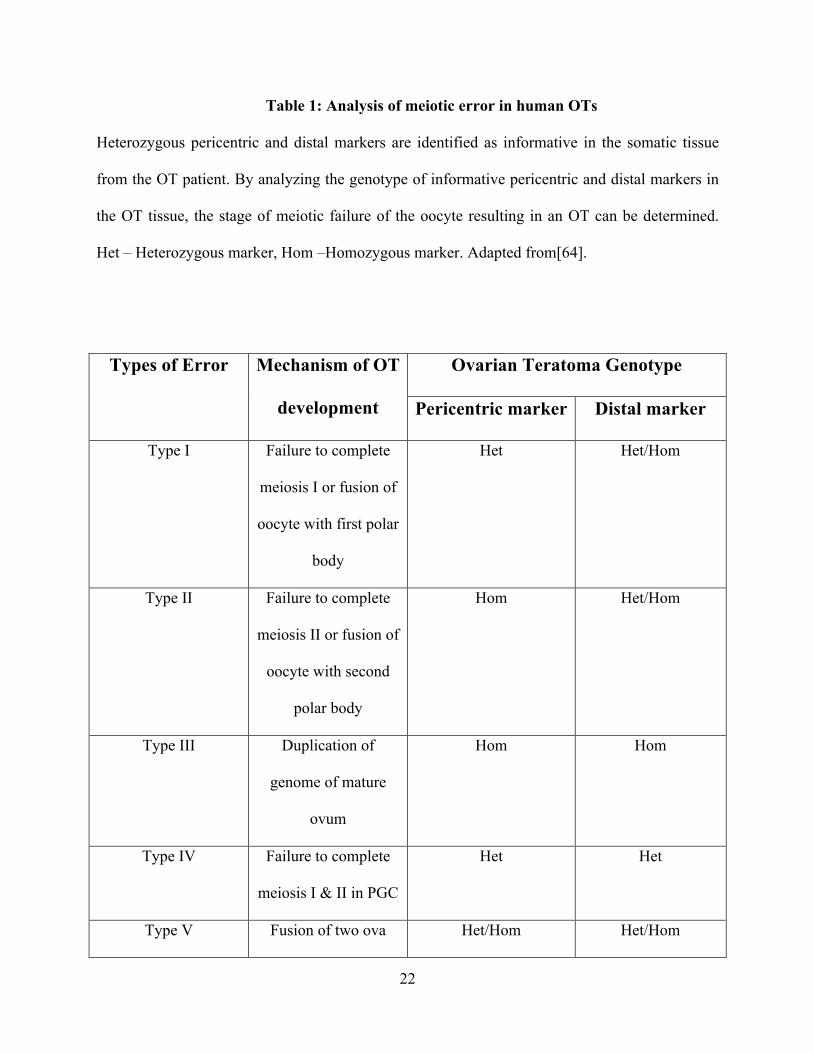
Table 1: Analysis of meiotic error in human OTs
Heterozygous pericentric and distal markers are identified as informative in the somatic tissue
from the OT patient. By analyzing the genotype of informative pericentric and distal markers in
the OT tissue, the stage of meiotic failure of the oocyte resulting in an OT can be determined.
Het – Heterozygous marker, Hom –Homozygous marker. Adapted from[64].
Types of Error Mechanism of OT
development
Ovarian Teratoma Genotype
Pericentric marker Distal marker
Type I Failure to complete
meiosis I or fusion of
oocyte with first polar
body
Het Het/Hom
Type II Failure to complete
meiosis II or fusion of
oocyte with second
polar body
Hom Het/Hom
Type III Duplication of
genome of mature
ovum
Hom Hom
Type IV Failure to complete
meiosis I & II in PGC
Het Het
Type V Fusion of two ova Het/Hom Het/Hom

23
1.8 MOUSE MODELS OF OTS
Mouse strains predisposed to developing OTs have provided insight into the genes involved in
OT development. LT/Sv is an inbred mouse strain in which approximately 50% of the females
develop OTs by 90 days of age [63]. These OTs originate from parthenogenetically activated
oocytes that have completed meiosis I [76]. LT/Sv oocytes experience a prolonged period of
meiotic arrest at metaphase I [77]. This arrest (delayed metaphase to anaphase I transition) has
been linked to the sustained activity of MPF [53]. Normally, a decrease in MPF activity is
required for metaphase I to anaphase I transition, and sustained MPF activity and metaphase I
arrest may predispose unfertilized LT/Sv oocytes to spontaneous cell division (parthenogenesis)
and OT formation. Prolonged metaphase I arrest and parthenogenetic activation of oocytes have
been reported to be necessary but not sufficient for OT formation [78]. Other requirements for
OT formation have been revealed in an analysis of crosses between C57BL/6 (B6) and LT/Sv
mice, which identified OT susceptibility loci, including a prominent locus (Ots1) on
chromosome 6 [79].
Targeted mutagenesis in mice has also produced mouse strains susceptible to developing
OTs. The c-mos gene encodes the cytostatic factor responsible for metaphase II arrest.
Consequently, oocytes of homozygous c-mos-null mice fail to maintain metaphase II arrest and
spontaneously initiate parthenogenetic embryonic development in the absence of fertilization.
Approximately 40% of c-mos-null mice develop OTs [56, 57]. Mutations in the coding region of
the human c-mos gene have not been reported, suggesting that mutations in the c-mos gene do
not play a role in the genesis of human OTs [80]. The MommeR1 mouse strain with a missense
mutation in the transcription factor Foxo3a is predisposed to developing OTs; one-sixth of
homozygous MommeRI females develop OTs [81]. The missense mutation was found to cause a

24
decrease in the transactivation potential of the transcription factor FOXO3A. Notably, both
FOXO3A and c-MOS proteins are primarily expressed in the oocyte, with little expression in
somatic cells of the ovary [82, 83].
Genetic defects in genes expressed in follicular GCs, but not in oocytes, also lead to OT
formation in mice. One fifth of mFshrD580H transgenic mice expressing a constitutively active
form of the FSH receptor in GCs develop OTs [84]. Similarly, overexpression of the Bcl-2 gene
in mouse GCs led to a 20% incidence of OTs [85]. Hence alteration in normal cell signaling
within the GCs can predispose to OTs. Transgenic mice expressing small interfering RNAs
(siRNAs) targeting the Gata4 (siGata4) gene also developed OTs [86]. In the mouse ovary
GATA4 is primarily expressed in GCs [87]. Although the mechanism of OT formation in this
model is presently unknown, it is possible that a decrease in granulosa-cell GATA4 indirectly
influences oocyte function, leading to OT formation. Taken together, the molecular and
functional abnormalities observed in the various OT mouse models suggest that several distinct
cell-signaling or cell-cycle defects in cells of the ovarian follicle can mediate OT development.
We have previously reported that 15-20% of hemizygous female carriers of the imprinted
Tgkd transgene develop OTs in the inbred FVB/N (FVB) strain [88]. Because numerous other
transgenic mouse lines with the same or related imprinted trangenes did not develop teratomas,
we postulated that the development of OTs in FVB-Tgkd females is due to disruptions in one or
more genes near the genomic site of transgene integration on mouse chromosome 8. In this
study, I have examined the mechanism by which the transgene Tgkd predisposes FVB mice to
OT formation.

25
2.0 MATERIALS AND METHODS
2.1 ANIMAL STUDIES
The Tgkd transgene was maintained on the inbred FVB as described previously and on the OT
non-permissive 129/Sv (129) background [88]. All experiments were performed in compliance
with guidelines established by the Institutional Animal Care and Use Committee of the
University of Pittsburgh. For determining the onset of puberty, females were examined daily for
vaginal opening from day 22 postpartum. Primers and conditions for PCR genotyping of +/+ and
Tgkd mice are provided in Appendix B.
2.2 SNP GENOTYPING OF OTS
Spleen and teratoma DNA samples were collected from female progeny of the backcross of F1
(FVB-Tgkd X B6) to FVB mice. 20 pericentric and 20 distal SNPs (one per chromosome) were
examined in the spleen DNA for evidence of heterozygosity. This was performed by PCR
amplification and DNA sequencing of the region surrounding the single nucleotide
polymorphism (SNP) allele. The heterozygous SNPs in the spleen were examined in the teratoma
to determine the last meiotic stage completed by the oocyte before initiating OT formation [64].

26
Detailed information of SNP locations and sequence in the spleen and OT are provided in
Appendix A.
2.3 IDENTIFICATION OF TGKD INSERTION SITE
This was accomplished by identifying the two Tgkd-genome junctional fragments on Southern
blots of FVB-Tgkd DNA probed with fragments of the Tgkd transgene, constructing Tgkd
subgenomic libraries in the λFixII vector (Stratagene, La Jolla, CA), and identifying clones
containing the two junctional fragments. DNA sequencing of the junctional fragments containing
Tgkd and endogenous genomic sequence was used for mapping of the insertion site.
2.4 COLLECTION OF EMBRYOS
Crosses were set up between hemizygous Tgkd/+ and +/+ animals so that the parental origin of
the Tgkd transgene was known. The day on which the plug was observed was noted as day 0.5.
E9.5 embryos, E13.5 and E16.5 embryo heads were collected 9, 13 and 16 days after observation
of the plug respectively. The samples were frozen at -80ºC until RNA extraction or protein
extraction. Tail DNA was isolated from these embryos and used to determine presence or
absence of Tgkd.
27
2.5 EMBRYONIC STEM CELL STUDIES
2.5.1 Embryonic stem (ES) cell derivation and generation of shRNA clones
129-Tgkd(maternal) ES cell lines were derived from 129-Tgkd X 129 crosses and 129-
Tgkd(paternal) ES cell lines were derived from 129 X 129-Tgkd crosses. Homozygous Tgkd ES
cell lines were derived from 129-Tgkd X 129-Tgkd crosses. ES cell lines were generated by
collection of E3.5 blastocysts and ES cell lines were established using previously published
methods [89]. Briefly, blastocysts were seeded on 24 well dishes (coated with gelatin) with
irradiated feeder cells in ES cell media containing Leukemia inhibitory factor (LIF) (1000U/ml).
After 5 days, the inner cell mass was dissociated from blastocysts that had attached to the bottom
of the well into clumps of 6-12 cells. The dissociated inner cell mass was transferred to a new
plate with feeder cells. ES cell colonies began to grow in a subset of wells and these wells were
passaged into new wells with feeder cells every 3-4 days. After 2-3 passages, the established ES
cell lines were frozen down until further use.
Stable knockdown clones of INPP4B were obtained by the electroporation of linearized
shRNA plasmid constructs TRCN0000080645 and TRCN0000080646 (Open Biosystems,
Huntsville, AL) followed by isolation of puromycin-resistant colonies. The extent of knockdown
of INPP4B was determined by immunoblot analysis.

28
2.5.2 IGF1 stimulation protocol in ES cells
ES cells were passaged twice without feeders and then plated on 12 well plates coated with 0.1%
gelatin. The cells were serum starved for 34 hours and then stimulated with 1µg/ul of mouse
insulin growth factor-1 (IGF1) (Sigma-I8779) for indicated periods.
2.5.3 ELISA analysis
Phospho-AKT activation was measured in ES cell lysates using the PathScan® Phospho-Akt1
(Ser473) and Total Akt1 Sandwich ELISA Kit (Cell signaling: 7160 & 7170) according to
manufacturer instructions.
2.6 OVARY STUDIES
2.6.1 Collection of ovaries and oocytes
Whole ovary, GV-stage oocytes and GCs were collected from immature females (21-23 day post
partum) at designated time points following intra-peritoneal (IP) injection of 5IU PMSG
(Calbiochem- 367222, LaJolla, CA) and 5IU of HCG (Sigma- C5297, St Louis, MO) injection
48 hours later. GCs and oocytes were collected in M2 medium (Millipore-MR-015-D,
Temecula, CA) following needle puncture of the ovaries. The oocytes were collected and the
remaining GCs were pelleted and lysed in 1X Laemmli sample buffer.

29
2.6.2 Ovarian morphometric analysis and follicle counting
Ovarian morphology was examined in hematoxylin and eosin (H&E)-stained paraffin sections of
ovaries fixed overnight in 4% paraformaldehyde. Follicle counting and classification were
performed on every fifth adjacent section of 5µm thickness according to an established system
described by Pederson and Peters [16].
2.6.3 Oocyte parthenogenetic activation assay
Parthenogenetic activation of FVB-Tgkd oocytes was examined by isolating COCs from
immature PD23 FVB and FVB-Tgkd mice after 48 hours of PMSG stimulation. Oocytes were
separated from surrounding cumulus cells after 17 hours of in-vitro maturation and the frequency
of 2-cell embryos was determined after 24 hours of additional culture in KSOM (Embryomax-
MR-106-D, Millipore) as described previously [78].
2.6.4 Granulosa cell culture
This experiment was performed as described previously with minor modifications [90]. This
protocol enables selective enrichment of GCs by isolating and culturing GCs from ovaries and
excludes oocytes, and the ovarian capsule from the analysis. Ovaries were harvested from
immature females (day 21-23 postpartum) and incubated in 6mM EGTA and 0.5M Sucrose in
DMEM/F12 (Cellgro-10-092-CV, Herndon, VA). The ovaries were punctured with needles to
release GCs in DMEM/F12. The GCs were pelleted at 100g for 10 minutes and resuspended at a
density 0.5 X 10⁶ cells /well in DMEM/F12 +10%FBS. After overnight culture the cells were
30
stimulated for indicated time points with DMEM/F12+ recombinant human FSH (LER-4161B)
(50ng/µl-final concentration) (Kind gift from Dr. Anthony Zeleznik) and the cells were
subsequently lysed in 1X Laemmli sample buffer.
2.6.5 Lentiviral transduction of GCs
For lentiviral infections, 106 GCs were subjected to centrifugation and then resuspended in
DMEM/F12 containing 8µg/ml polybrene (hexadimethrin bromide – Sigma H9268). The GCs
were infected with lentivirus expressing short hairpin RNA (shRNA) constructs to Inpp4b, either
TRCN0000080645 or TRCN0000080646 (Open Biosystems) at an MOI (multiplicity of
infection) of 10. The GCs and the lentiviral suspension tubes were subjected to centrifugation at
1200g at 35°C for 2 hours (4X30 minutes) and the lentivirus-cell suspension was plated in
DMEM/F12 +10%FBS. After 48 hours of culture, the cells were stimulated with DMEM/F12+
FSH (50ng/µl) for the indicated times.
2.6.6 Corpora lutea clearance assay
Immature females were given an IP injection of 5IU PMSG and 5IU of HCG (Sigma- C5297, St
Louis, MO) 48 hours after PMSG stimulation. The ovaries were collected 7 days after HCG
stimulation. Presence and size of corpora lutea was examined in H&E stained paraffin sections
of ovaries fixed overnight in 4% paraformaldehyde.

31
2.7 BISULFITE GENOMIC SEQUENCING
Bisulfite genomic sequencing was performed using the EpiTect Bisulfite Kits (Qiagen-59104,
Valencia, CA) [91]. Following bisulfite treatment, the RSV sequence was amplified with PCR
primers flanking the RSV DMD (within the Ig and c-myc sequences). Primer sequences are
provided in Appendix B. The PCR products were cloned into the Topo-TA cloning vector
(Invitrogen -K4550-40) and transformed into electrocompetent cells. Individual plasmid clones
were isolated and sent for sequencing with the M13 forward sequencing primer.
2.8 SOUTHERN BLOT ANALYSIS OF Tgkd METHYLATION
To assess the extent of Tgkd methylation, genomic DNA was digested with the methylation
sensitive restriction enzyme BstUI [92]. The digested DNA was subjected to electrophoresis on a
0.7% agarose gel, transferred onto Genescreen nylon filters (NEN, Boston, MA). The filter
membrane was hybridized with the Ca probe 42°C and subsequently washed with 2X SSC and
0.1X SSC at 65°C. The Ca probe is a 1.75kb EcoRI – XbaI fragment of the Ca region in the
RSVIgmyc transgene (Figure 6). DNA probes were prepared from gel-purified fragments. 100ng
of DNA was denatured at 100°C and annealed with random primers on ice. Synthesis of a 32P Ca
probe was done in the presence of (α-32P) dCTP and the Klenow fragment. The labeled probe
was purified using the Probe Quant G50 microcolumns (Amersham Bioscience, Piscataway, NJ).
Bands were visualized by autoradiography and quantified using Image J analysis software.

32
2.9 METHYLATION-SENSITIVE PCR
Genomic DNA was isolated from ES cell lines and digested with the restriction enzyme AseI.
The cut genomic DNA was purified by phenol/chloroform extraction, precipitated and subjected
to another round of restriction digest by the methylation sensitive restriction enzymes HpaII or
McrBC or the enzyme MspI. The DNA from this round was once again purified and PCR
primers were used to amplify 10 CpG islands identified by the program CpG island searcher in a
2 Mb region surrounding the Tgkd insertion. Primer sequences are provided in Appendix B.
2.10 PCR FOR DETECTING NOVEL Inpp4b SPLICE ISOFORMS
RNA from FVB and homozygous Tgkd/Tgkd E13.5 brains were converted to cDNA. A series of
reverse transcription PCRs (RT-PCRs) were done on the cDNA samples to span the entire
coding region and transcribed but untranslated region (UTR) of Inpp4b α and β isoforms. The
PCR primers were designed to generate approximately 1kb amplicons and successive PCR
products had overlap regions greater than 200bp. The PCR amplified amplicons were cloned
followed by sequencing of 4 clones per amplicon from FVB E13.5 brains and 8 clones from
Tgkd/Tgkd brains. The sequence from FVB and Tgkd/Tgkd embryos were compared for
differences in cDNA sequence or novel splice isoforms. Primer sequences are provided in
Appendix B.

33
2.11 SINGLE NUCLEOTIDE PRIMER EXTENSION (SNuPE) ANALYSIS
RNA was isolated from adult tissues and converted to cDNA. RT-PCR was performed on the
cDNA with primers amplifying the region surrounding the SNP allele difference between FVB
and 129 strains for each gene (Appendix B). The RT-PCR product was gel extracted and
resuspended in water before performing the SNuPE reaction. Each SNuPE reaction was
performed in a 10ul reaction mix containing (32P) dNTP (appropriate nucleotide), 2mM MgCl2,
50mM KCl, 10mM Tris-HCl at pH 8.3, 0.001% gelatin, 1µM of the appropriate SNuPE primer,
approximately 10ng of RT-PCR product and 0.75 units of Taq polymerase (Invitrogen). Samples
were incubated at 95°C for 30s, 42°C for 30s and 72°C for 1 minute in a thermocycler. After
separating the products on a 15% denaturing polyacrylamide gel, the ratio of the SNP alleles
were determined by autoradiography and quantified using a phosphoimager. RT-PCR primers
and the SNuPE primer sequence for each gene are provided in Appendix B [93].
2.12 REAL TIME PCR
RNA was extracted using the RNeasy Micro kit (Qiagen). 1µg of RNA was converted to cDNA
using the high capacity cDNA reverse transcription kit (Applied Biosystems, Foster City CA) in
a reaction volume of 20µl. 2µl of the cDNA was used in a 10µl Real time PCR reaction. Real
time PCR was performed using the SYBR Green master mix (Applied Biosystems) on the
7900HT Fast Real-Time PCR System machine (Applied Biosystems). Steady-state transcript
levels were measured by real-time PCR using oligonucleotide primers located across exons 23
and 24 of Inpp4b mRNA, a region common to all known forms of Inpp4b transcripts. The α and

34
β isoforms were assayed separately by amplification of their alternative terminal exons. The
Pfaffl method was used to determine fold changes and the fold changes were determined as fold
change over wildtype levels [94]. TATA-binding protein (TBP) (E13.5 embryo studies) and beta
glucuronidase (GUSB) (Ovary studies) were selected as housekeeping control genes. Primer
sequences are provided in Appendix B and efficiency curves in Appendix C.
2.13 IMMUNOBLOT ANALYSIS
E13.5 heads, ovaries and ES cell proteins were extracted using RIPA lysis buffer supplemented
with complete protease inhibitor and PhosSTOP phosphatase inhibitor (Roche, Basel,
Switzerland). Oocytes and GCs were lysed in 1X Laemmli sample buffer. Immunoblot analysis
was performed as described previously [95]. In brief, samples were denatured by heating at
100°C for 5 minutes and then separated by electrophoresis on SDS-7% polyacrylamide gels.
Afterwards, they were transferred to PVDF membranes (Immobilon-P, Millipore). Membranes
were blocked in 5% dry skim milk in 0.1% Tween-20 TBS (TBS-T) for 1 hour and probed with
the indicated antibodies overnight at 4°C according to manufacturer’s instructions. Following 5
washes of 5 minutes each in TBS-T, the membranes were incubated for 1 hour in the respective
secondary antibody in blocking solution. Membranes were washed as above. Bound antibody
was detected using the chemiluminescence detection kit ECL Plus (Amersham, Piscataway, NJ).
When a blot was reprobed with a different primary antibody, the first antibody was removed by
incubation with stripping solution (100 mM 2-Mercaptoethanol, 2% SDS, 62.5 mM Tris-HCl pH
6.8) at 50°C for half hour, washed for an hour in TBS-T and then the blot was blocked for 1 hour
at room temperature.

35
Membranes were probed with the following antibodies: INPP4B (Brain and ES cells -
Santa Cruz-sc12318, Santa cruz, CA), INPP4B (Ovary and GCs - 106), Phospho-AKT (Ser-473)
(9271), phospho-FOXO1 (Ser-256) (9461), E2F1 (3742), Cyclin D2 (3741) (Cell Signaling
technology, Beverly, MA) and Actin (Abcam, Cambridge, MA). The blots were stripped and
reprobed with FOXO1 (2880), AKT (9272) (Cell Signaling technology) and P27KIP (Santa cruz-
sc528). Anti–rabbit (GE healthcare: NA934V, Piscataway, NJ) or anti-goat (sc-2020) secondary
antibodies were diluted in blocking solution (5% milk). Protein levels were determined by
comparison of intensity on autoradiography films using the BioSpectrum 500 imager and
VisionWorks®LS analysis software (UVP, LLC, Upland, CA).
2.14 BrDU INCORPORATION ASSAY
PD30 mice received an IP injection of 100mg/kg of bromodeoxyuridine (BrdU) (Sigma -B9285)
and were killed 2 hours after injection. Ovaries were isolated and the BrdU incorporation was
detected by immunohistochemistry.
2.15 IMMUNOHISTOCHEMISTRY
Ovaries were fixed in 4% PFA and embedded in paraffin. Immunohistochemistry (IHC) was
performed on 5µm sections using the Vectastain Elite ABC Kit (Vector laboratories,
Burlingame, CA) according to manufacturer instructions. Mouse anti-BrdU (Sigma- B2531) was
used to evaluate cell proliferation and rabbit anti-cleaved caspase3 (Cell Signaling Technology-
36
9664) was used to determine the rate of apoptosis in follicles. IHC was performed on 4 non-
adjacent sections and positive cells were counted in 25 follicles containing a clear oocyte. Rates
of proliferation and apoptosis per follicle were determined by the number of positive cells in
each preantral (Type 5) and antral follicle divided by the total number of cells in the follicle.
FOXO1 IHC was performed on wildtype and Tgkd PD30 ovaries using the FOXO1 antibody
(Cell Signaling - 2880) and the Vectastain Elite ABC Kit.
2.16 RNA IN SITU HYBRIDIZATION (ISH)
RNA in situ hybridization (ISH) was performed using digoxigenin-labelled cRNA riboprobes.
The unique terminal exon (exon 25) of Inpp4b α and β isoforms were amplified by RT-PCR
from E13.5 brain cDNA and cloned into the pBluescript vector (Primers for RT-PCR –
Appendix B). The resultant vectors were linearized and antisense plus sense riboprobes were
prepared by in vitro transcription using the Riboprobe Combination System-T3/T7 RNA
Polymerase (Promega –P1450) and DIG RNA Labeling Mix (Roche – 11277073910). Ovaries
from 7-week-old mice were dissected in M2 media, washed in 1X PBS and fixed in fresh 4%
paraformaldehyde. Paraformaldehyde-fixed samples were immersed in 10%, then 20% sucrose
in PBS, followed by OCT embedding. Cryosections (10 µm) of the OCT-embedded placentas
were used for ISH as previously described [96]. Briefly, sections were fixed in 4%PFA, washed
in PBS (3 X 5 min), acetylated for 10 minutes at room temperature and washed again in PBS.
Prehybridization (Hybridization solution - 50% Formamide, 5X SSC, 5X Denhardts solution,
0.25mg/ml tRNA, 0.5mg/ml Herring sperm DNA) was performed in a humidified chamber for 2
hours at room temperature. Hybridization (denatured riboprobe in hybridization solution) was

37
performed at 65°C overnight in a humidified chamber. Sections were stained overnight with
anti-digoxigenein antibody conjugated to alkaline phosphatase (Roche - 11093274910).
Detection was performed with nitro blue tetrazolium chloride (NBT) and 5-bromo-4-chloro-3-
indolyl-phosphate, toluidine-salt (BCIP) and levamisole (Roche 11681451001) reagent solutions.
The slides were subsequently dehydrated and mounted in cytoseal.
2.17 STATISTICAL ANALYSIS
Each experiment was repeated a minimum of 3 times. A mean and standard error was calculated.
Significance was assessed using the Wilcoxon Rank-sum test. Results were considered
significant (*) if the p value was less than 0.05.

38
3.0 THE FVB-Tgkd STRAIN AS A MODEL TO STUDY OVARIAN TERATOMA
FORMATION
3.1 INTRODUCTION: THE FVB-Tgkd MOUSE STRAIN
The FVB-Tgkd mouse strain carries a randomly inserted transgene Tgkd on the FVB mouse
strain background. The Tgkd transgene is a genomically imprinted transgene that is methylated in
offspring when inherited from the mother and unmethylated on paternal inheritance [92]. The
Tgkd transgene is imprinted irrespective of the location of genomic integration. The Tgkd
transgene is a modified version of the RSVIgmyc transgene, which also exhibits maternal allele
specific methylation [97]. The RSVIgmyc transgene was originally designed to express the c-myc
oncogene in the mouse. The Tgkd transgene consists of the Rous Sarcoma Virus (RSV) Long
Terminal Repeat (LTR) sequence and the Igα/c-myc Burkitt-like fusion gene product from the
S107 plasmacytoma cell line in which the 5’ region of the switch recombination sequences of
IgA (Sa) has translocated into the 5’ region of c-myc [92, 98] (Figure 6A). The c-myc/Igα regions
within the transgene are organized such that the constant and switch regions of the
immunoglobin locus are immediately followed by the c-myc gene having a truncated exon 1. The
RSV LTR serves as the differentially methylated domain (DMD) of the Tgkd transgene and the
Tgkd transgene is not genomically imprinted in the absence of the RSV LTR sequence (Figure
6B).

39
2 kb
3’ myc Ca Sa 1 2 3
3’ myc Ca Sa 1 2 3
RSV DMD
Tgkd
Ig/myc
Imprinted
Non-imprinted
2 kb3’ myc Ca Sa 1 2 3
A
B
Figure 6: Structure and description of the Tgkd transgene
Figure and legend adapted from [92] (A) The Tgkd transgene is a fusion gene product composed
of the IgA/c-myc translocation with the switch region (Sa) of the immunoglobin locus adjacent to
the truncated exon 1 of c-myc. Numbers 1-3 represent exons 1-3 of the endogenous c-myc gene.
Sa and Ca represent the switch recombination sequences and constant region coding exons of the
endogenous immunoglobin Igα. The hatched region is a 440bp fragment of the LTR of the RSV
of the Schmidt-Ruppin strain (subgroup D). (B) The RSV region constitutes the DMD of the
Tgkd transgene. The Tgkd transgene is methylated on maternal inheritance and Tgkd loses this
genomic imprinting property in the absence of the RSV region.
40
Hemizygous carriers of the Tgkd transgene on the FVB strain background (FVB-Tgkd
mice) are observed to develop OTs at a frequency of 15-20% between 12-22 weeks of age [88].
The OTs in the FVB-Tgkd mice exhibit a malignant mixed germ cell phenotype
(teratocarcinoma) with evidence of metastases to the mesenteric lymph node and lung. The
tumors contain areas of well-differentiated benign teratoma structures such as keratinizing
squamous epithelium, respiratory epithelium, cartilage, sebaceous glands, hair follicles, intestine,
bone, fat, smooth muscle and nerves which constitute derivatives of the embryonic layers:
ectoderm, mesoderm and endoderm. The FVB-Tgkd OTs also contain immature malignant
components such as areas of undifferentiated highly mitotic embryonal carcinoma cells,
embryoid bodies, Schiller-Duval bodies (characteristic of endodermal sinus tumors) and
malignant trophoblasts (characteristic of choriocarcinoma). The central areas of the larger tumors
also exhibited substantial amounts of necrosis [88].
Homozygous carriers of the Tgkd transgene on the FVB strain exhibit perinatal lethality.
To determine the time of death of homozygous FVB-Tgkd mice, embryos from crosses between
hemizygous FVB-Tgkd mice were genotyped at various time points during gestation (Table 2)
[88]. The observed percentages of the different genotypes of embryos were equivalent to the
expected mendelian ratios from the cross at days 8.5 and 10.5 of embryogenesis. However at
birth, the expected number of homozygous Tgkd/Tgkd embryos was one-half of the expected
mendelian ratio and adult Tgkd/Tgkd mice were absent at 3 weeks of age (Table 2). Both the OT
phenotype in hemizygous Tgkd mice and the perinatal lethality phenotype of Tgkd/Tgkd mice on
the FVB strain are integration-site dependent as other independently derived transgenic lines
with the Tgkd transgene construct do not develop OTs or exhibit perinatal lethality, even though
the Tgkd transgene is imprinted in all these lines [88, 92]. In initial studies, the Tgkd transgene

41
array was found to be inserted on chromosome 8 in the FVB-Tgkd strain [88]. Hence, the
development of the OT phenotype is most likely due to the disruption or interference by Tgkd of
genes surrounding the genomic integration site on chromosome 8.

42
Table 2: Analysis of viability of hemizygous and homzygous FVB-Tgkd embryos
Crosses were set up between hemizygous FVB-Tgkd males and females. 78 carrier offspring out
of 115 tested were hemizygous Tgkd mice when analyzed at 3 weeks of age. The ratio of
hemizygous to wildtype offspring (78:37) is close to the expected mendelian ratio of 2:1
confirming normal viability of hemizygous offspring at this age. However homozygous
Tgkd/Tgkd offspring were absent at 3 weeks of age. Further at birth, the number of Tgkd/Tgkd
offspring observed was half the expected value (wildtype=15, Tgkd/Tgkd=7) indicating perinatal
lethality of homozygous FVB-Tgkd embryos. +/+ - Wildtype embryos, Tgkd/+ - Hemizygous
FVB-Tgkd embryos, Tgkd/Tgkd - Homozygous FVB-Tgkd embryos. Data adapted from [88].
Embryonic
Stage
Embryo Genotype
+/+ Tgkd/+ Tgkd/Tgkd
Day 8.5 5 14 5
Day 10.5 5 13 5
Birth 15 40 7
Adult 37 78 0

43
3.2 ADVANTAGES OF THE FVB-Tgkd OT MODEL
The aim of these studies was to characterize the process by which the insertion of the Tgkd
transgene leads to the development of OTs on the FVB strain background. The FVB-Tgkd mouse
strain is an excellent model to study teratoma formation as the defined insertion of the Tgkd
transgene array at a single genomic integration site causes the OT-free FVB females to become
susceptible to formation of teratomas. This suggests that OT formation in this model may be
linked a limited set of gene/genes close to the site of the transgene insertion on chromosome 8.
The integration site (characterized later on in the thesis) is distinct from previously described OT
susceptibility loci or genes; hence the evaluation of the FVB-Tgkd OT model may provide new
insights into distinct pathways to OT formation.
Another important aspect in the FVB-Tgkd model is the requirement of the FVB strain
background for the development of the OT phenotype. We have presented some preliminary
experiments in this section that illustrate the strain specific features of the OT phenotype and
have aimed to identify chromosomal regions associated with the strain specific modifier alleles
that confer susceptibility to this phenotype (Eicher et al., manuscript in preparation).
3.3 GENOTYPING OF THE Tgkd MOUSE
To identify carriers of the Tgkd transgene, genotyping studies were performed with primers
designed across the Igα/c-myc translocation of the Tgkd transgene (Figure 7A). The design of
these primers across the translocation prevented PCR amplification from the endogenous IgA or
c-myc genomic sequence. Further primers were designed to be complementary to endogenous

44
sequences lost by the insertion of Tgkd on chromosome 8. These primers were used to detect the
wildtype allele as PCR amplification occurred only when the Tgkd transgene array was absent.
Using a combination of the wildtype allele and Tgkd transgene PCR, I was able to distinguish
wildtype (+/+), homozygous (Tgkd/Tgkd) and hemizygous (Tgkd/+) Tgkd genotypes (Figure 7B).
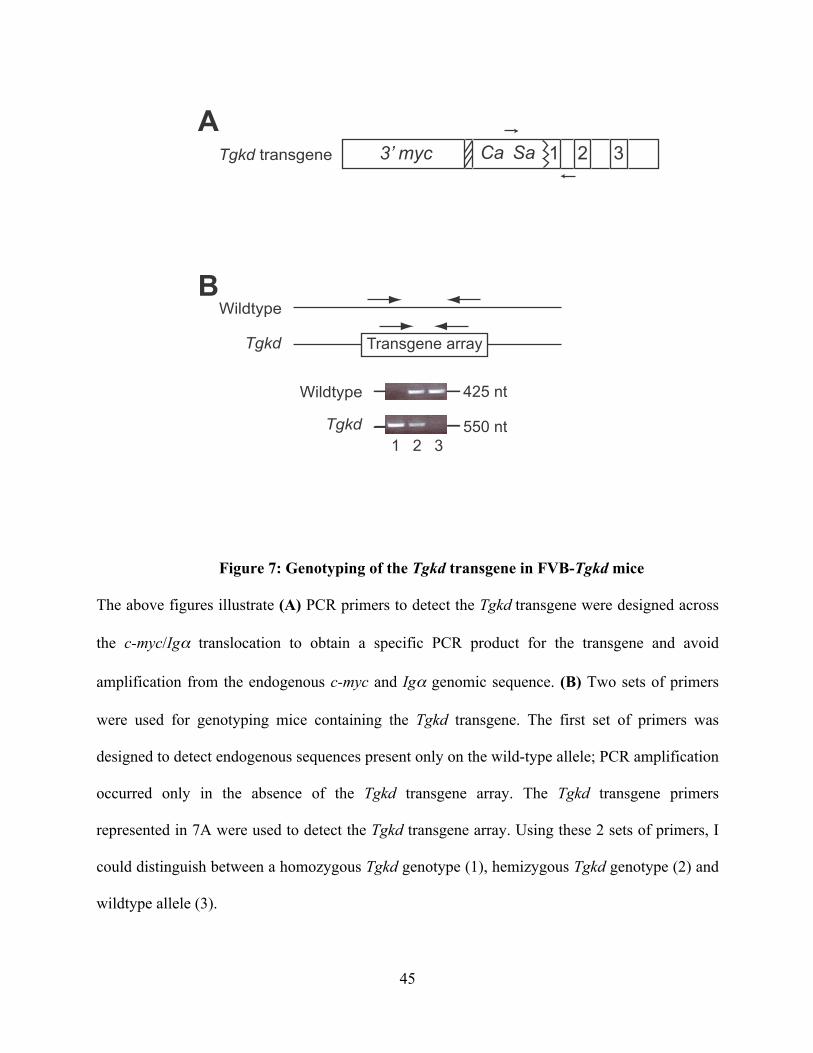
45
3’ myc Ca Sa 1 2 3Tgkd transgene
Wildtype
Tgkd
Tgkd
Wildtype
1 2 3
Transgene array
425 nt
550 nt
A
B
Figure 7: Genotyping of the Tgkd transgene in FVB-Tgkd mice
The above figures illustrate (A) PCR primers to detect the Tgkd transgene were designed across
the c-myc/Igα translocation to obtain a specific PCR product for the transgene and avoid
amplification from the endogenous c-myc and Igα genomic sequence. (B) Two sets of primers
were used for genotyping mice containing the Tgkd transgene. The first set of primers was
designed to detect endogenous sequences present only on the wild-type allele; PCR amplification
occurred only in the absence of the Tgkd transgene array. The Tgkd transgene primers
represented in 7A were used to detect the Tgkd transgene array. Using these 2 sets of primers, I
could distinguish between a homozygous Tgkd genotype (1), hemizygous Tgkd genotype (2) and
wildtype allele (3).
46
3.4 STRAIN SPECIFICITY OF THE OT PHENOTYPE
The OT phenotype in the FVB-Tgkd strain is observed to be highly dependent on the FVB strain
background. As described before, 17% of the hemizygous female carriers of Tgkd develop OTs
on the FVB strain background. However none of the females carrying the Tgkd transgene (at the
same genomic integration site) develops OTs on the B6 or 129 strain background (Table 3). This
data suggests that besides the gene disrupted by the Tgkd insertion, there are additional FVB
modifier alleles required for the OT phenotype.
Further studies to characterize the FVB strain specific effect on Tgkd induced OTs were
performed by Dr. Eva Eicher at Jackson Laboratories (Bar Harbor, Maine). In these studies,
FVB-Tgkd females were crossed to B6 males and no OTs were observed in the Tgkd females of
the F1 generation (Table 3). The absence of the OT phenotype was also observed in the Tgkd
females of the reciprocal cross. When the Tgkd females from the F1 cross (FVB-Tgkd X B6)
were backcrossed to FVB males, 8% of the F2 Tgkd females developed OTs by 120 days of age
(Table 3) (Eicher et al., manuscript in preparation). These experiments illustrate two aspects of
the FVB strain effect on OT development in FVB-Tgkd mice. The first aspect is that there is an
absolute requirement of the FVB strain background for Tgkd induced teratoma development.
Further, the gene/genes promoting OT development in the FVB background are recessive in
nature and have to be in the homozygous state to promote teratoma formation in Tgkd females.
The genomic region/regions carrying the FVB strain specific modifier alleles for the OT
phenotype was designated as ovarian teratoma susceptibility region 2 (Ots2). Lee et al identified
a similar susceptibility locus in OT-susceptible LT/Sv mice, which has a semi-dominant effect
on OT development in this strain. This locus was designated as ovarian teratoma susceptibility

47
region 1 (Ots1) and linkage analysis studies identified an OT susceptibility region on mouse
chromosome 6 [79].
Linkage analysis studies were also performed on Tgkd positive females that developed
OTs to identify the FVB strain specific modifier alleles required for the phenotype. Linkage
analysis was performed on DNA isolated from 31 OT positive females from the Tgkd progeny of
the backcross [(B6 X FVB-Tgkd) F1 X FVB]. Besides the region on chromosome 8 associated
with the Tgkd insertion, a significant linkage score was associated with markers between 20-50
cM on mouse chromosome 6 (Eicher et al., manuscript in preparation). These results indicate
that both Ots1 and Ots2 loci reside on chromosome 6.
To investigate whether Ots1 and Ots2 involve the same susceptibility genes, FVB-Tgkd
mice were crossed with LT/Sv mice and the progeny were scored at 120 days for the presence of
OTs (Table 3). 43 out of 48 Tgkd positive F1 progeny (89.5%) from the above cross developed
OTs indicating that Ots1 and Ots2 loci may involve the same subset of genes or the two loci
complement each other to increase the penetrance of the Tgkd induced OT phenotype (Eicher et
al., manuscript in preparation). These studies indicate in addition to the genes disrupted by the
insertion of Tgkd transgene on chromosome 8, additional modifier alleles exist on mouse
chromosome 6 of the FVB strain that contribute to the development of OTs. The identity of these
genes is not known; however; they may constitute susceptibility loci that are common to
different OT mice models. These susceptibility loci may be necessary but not sufficient for OT
formation. Identification of these loci may help identify common processes involved in OT
formation.

48
Table 3: Strain specific effects on OT phenotype
Data for table adapted from Eicher et al., manuscript in preparation. The table illustrates that
Tgkd females develop OTs only on the permissive FVB strain background. A heterozygous
FVB/B6 background is not permissive to OT formation in F1 females between FVB-Tgkd and
B6 mice. However on backcrossing these F1 progeny to FVB mice, half of the F2 mice possess
homozygous FVB loci and the frequency of the OT phenotype (8%) is correspondingly reduced
to about half of that in the FVB-Tgkd frequency (17%). On crossing the FVB-Tgkd mice to the
OT susceptible LT/Sv mice, 89.5% of the Tgkd positive mice develop OTs.
Mouse Strain OT incidence (%)
FVB-Tgkd 17
B6-Tgkd 0
129-Tgkd 0
(B6 X FVB) F1 – Tgkd 0
[(B6 X FVB) F1 X FVB] F2 – Tgkd 8
(LT/Sv X FVB) F1 – Tgkd 89.5

49
3.5 CONCLUSIONS
This section summarized the abnormalities observed in the FVB-Tgkd strain of mice.
Hemizygous carrier females of the imprinted Tgkd transgene developed OTs at a frequency of
17-20% while homozygous Tgkd mice exhibited perinatal lethality. These phenotypes were
consistent with the notion of the Tgkd disrupting one or more genes surrounding the insertion site
on chromosome 8.
In addition to the Tgkd insertion, there was a strain specific modifier effect on the Tgkd
induced OT phenotype. Tgkd positive females only developed OTs on the FVB strain
background and homozygosity of the FVB background was required for teratoma formation. The
only other strain background with predisposition to OT formation was the LT/Sv strain
background, which appeared to enhance the frequency of OT formation in FVB-Tgkd mice.
In this thesis, I have focused on the genetic and molecular effects of the Tgkd transgene
on OT formation in hemizygous FVB-Tgkd (henceforth designated Tgkd) mice.
50
4.0 OVARIAN DEFECTS ASSOCIATED WITH THE Tgkd OT MODEL
4.1 AIMS OF THESE STUDIES
The aims of these studies are to characterize the defects present in Tgkd ovaries and assess how
they may relate to OT formation. Many OT models exhibit several follicular defects such as
oocyte growth asynchronous with ovarian follicle growth, alterations in the distribution of
various follicle types, depletion of the primordial follicle pool and associated decrease in
reproductive fitness [81, 84]. I wanted to evaluate whether there were any alterations in ovarian
follicle development between FVB (wildtype) and Tgkd ovaries or whether the defects leading to
OT development are confined to the oocyte.
Further studies also aimed to evaluate the properties of wildtype and Tgkd oocytes in
terms of potential of parthenogenetic activation as oocyte parthenogenetic activation has been
reported to be a necessary requirement but not sufficient for OT formation [78]. Additionally, I
have analyzed the type of error or the last stage of meiosis completed by Tgkd oocytes before
initiating OT formation. In terms of oocyte requirements for OT formation, I evaluated whether
methylation on the Tgkd transgene is required for the OT phenotype and whether this
methylation plays a role in the strain specificity of the OT phenotype. In summary, I have
evaluated the contribution of various aspects of ovarian development to the OT phenotype.

51
4.2 ABNORMAL FOLLICLE MATURATION AND LUTEINIZED FOLLICLE
SYNDROME IN Tgkd OVARIES
The ovarian follicle comprising of the oocyte and the surrounding GCs form the main
developmental component of the ovary. The ovarian follicle goes through various stages of
development and all these stages can be seen in serial sections of the whole mouse ovary. The
earliest stage of the follicular development is the quiescent ovarian reserve of primordial
follicles, which consist of oocyte surrounded by a single layer of squamous GCs. Once a follicle
is recruited from the primordial follicle pool towards further development, the follicle either
successfully ovulates the oocytes or undergoes atresia during development. A reliable way of
assessing follicular function is by counting the number of different follicle types in the ovary and
defects in follicle development are manifested as significant changes in one or more follicle
stages. Recruited follicles were classified as primary (1 layer of cuboidal GCs – Type 3b),
secondary (2 layers of GCs – Type 4), preantral (3 or more layers of GCs – Type 5) and antral
follicles (Type 6-8) according to Pedersen and Peters method of classification [16]. Primordial
follicles quantification is presented along with fertility studies in the next section. In these
studies, I have quantified the different activated follicular types in pre-pubertal PD23 mice and
just after puberty at PD30 to evaluate if the gonadotrophin hormones play a role in promoting
follicular defects. Both wildtype and Tgkd mice attained puberty on PD28 (n=4 mice) consistent
with normal gonadotrophin signaling during puberty in Tgkd female mice.
The distribution of follicle types differed in PD23 wildtype and Tgkd mice, although the
total number of activated follicles was not significantly different. Absolute numbers of primary
(Type 3b) and secondary follicles (Type 4) were similar in wildtype and Tgkd ovaries, but there
were twice the number of preantral (Type 5) follicles in Tgkd ovaries (Figure 8A, p<0.05). This

52
was accompanied by a decrease in the absolute number of early and late antral (Type 6-8)
follicles per ovary. Similar defects in folliculogenesis were seen in post-pubertal PD30 Tgkd
female mice. Specifically, I observed a significant 1.6-fold increase in the number of preantral
follicles in PD30 Tgkd mice, which was accompanied by a 0.4-fold decrease in the number of
antral follicles (Figure 8A). A subset of large preantral follicles without antrum formation was
observed in PD30 Tgkd ovaries, which may contribute to the increase in the number of preantral
follicles and decrease in the number of antral follicles (# - Figure 8C). The cause for this lag in
antrum formation in these follicles is not known but these follicles manifest defects in follicle
maturation.
PD30 Tgkd ovaries showed additional follicular defects, not present in age-matched
wildtype mice, which are indicative of perturbed follicle maturation. An average of 4.4 corpora
lutea were observed, whereas no corpora lutea were observed in control wildtype mice (Figure
8B). In addition, trapped oocytes were observed in many PD30 Tgkd corpora lutea (& - Figure
8C); one examined ovary contained four corpora lutea with trapped oocytes. A corpus luteum is
formed from the remnants of the follicle after ovulation of the oocyte; hence a trapped oocyte
indicates that the follicle has luteinized prior to ovulation of the oocyte. These luteinized,
unruptured follicles are a further indication of defective ovarian follicle maturation in Tgkd mice
that may be directly relevant to teratoma formation as the associated OTs may form via
parthenogenetic activation of these trapped oocytes.

53
0
40
80
120 PD23 follicles
No
. fo
llic
les/O
va
ry
PD30 follicles
+/+
Tgkd/+
Prim
ary
Seco
ndary
Pre
antral
Antral
+/+ Tgkd/+
A
B
C
*0
40
80
120
Prim
ary
Seco
ndary
Pre
antral
Antral
*
0
2
4
6
8
10
+/+
Tgkd
/+
(n=6)
(n=2)
(n=2)
(n=2)
*
Ovary
No. CL
No
. fo
llic
les/O
va
ry
#& &
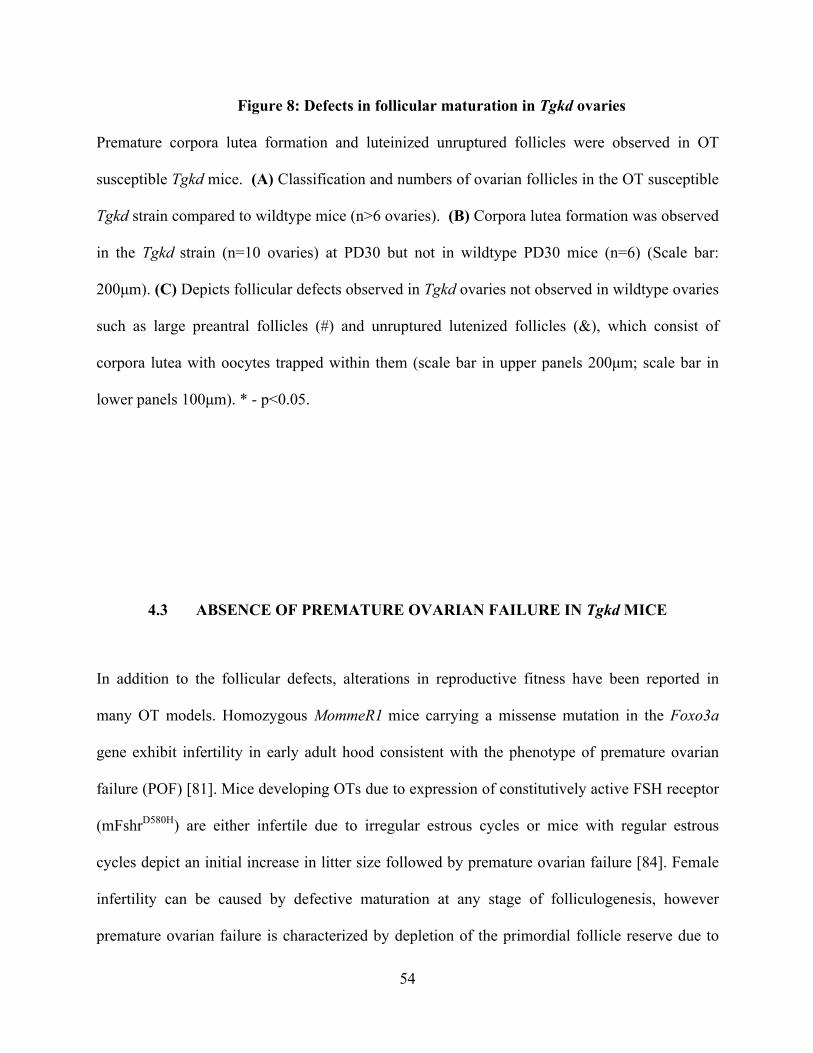
54
Figure 8: Defects in follicular maturation in Tgkd ovaries
Premature corpora lutea formation and luteinized unruptured follicles were observed in OT
susceptible Tgkd mice. (A) Classification and numbers of ovarian follicles in the OT susceptible
Tgkd strain compared to wildtype mice (n>6 ovaries). (B) Corpora lutea formation was observed
in the Tgkd strain (n=10 ovaries) at PD30 but not in wildtype PD30 mice (n=6) (Scale bar:
200µm). (C) Depicts follicular defects observed in Tgkd ovaries not observed in wildtype ovaries
such as large preantral follicles (#) and unruptured lutenized follicles (&), which consist of
corpora lutea with oocytes trapped within them (scale bar in upper panels 200µm; scale bar in
lower panels 100µm). * - p<0.05.
4.3 ABSENCE OF PREMATURE OVARIAN FAILURE IN Tgkd MICE
In addition to the follicular defects, alterations in reproductive fitness have been reported in
many OT models. Homozygous MommeR1 mice carrying a missense mutation in the Foxo3a
gene exhibit infertility in early adult hood consistent with the phenotype of premature ovarian
failure (POF) [81]. Mice developing OTs due to expression of constitutively active FSH receptor
(mFshrD580H) are either infertile due to irregular estrous cycles or mice with regular estrous
cycles depict an initial increase in litter size followed by premature ovarian failure [84]. Female
infertility can be caused by defective maturation at any stage of folliculogenesis, however
premature ovarian failure is characterized by depletion of the primordial follicle reserve due to

55
excessive recruitment, which leads to a sudden decrease in fertility in early adulthood. Some OT
models such as the mice overexpressing Bcl-2 in GCs (Inhα-bcl2) display an increase in litter
size compared to wildtype controls [85].
These reports on the relationship of the OT phenotype with female fertility led me to
examine the effect of the Tgkd transgene on the reproductive fitness of the Tgkd mice. Further I
have evaluated the effect of Tgkd on the number of primordial follicles in PD23 and PD30
ovaries to assess for premature follicle depletion. Despite the observed abnormalities in Tgkd
ovary morphology, there was no evidence of a significant reduction in the fertility of hemizygous
Tgkd females, and no differences in primordial follicle numbers between wildtype and Tgkd mice
at both PD23 and PD30 (Figure 9A and 9B). A decrease in fertility in older Tgkd females was
seen due to the death of OT positive females set up for mating. Once the OTs reached a large
size, the females died or were sacrificed due to the large size of the teratomas. When the fertility
data was examined only in the Tgkd females without palpable OTs, there was no difference in
fertility from wildtype controls. Consequently there was no evidence of premature ovarian
failure (POF) in Tgkd females, which is associated with OT formation in other mouse strains.
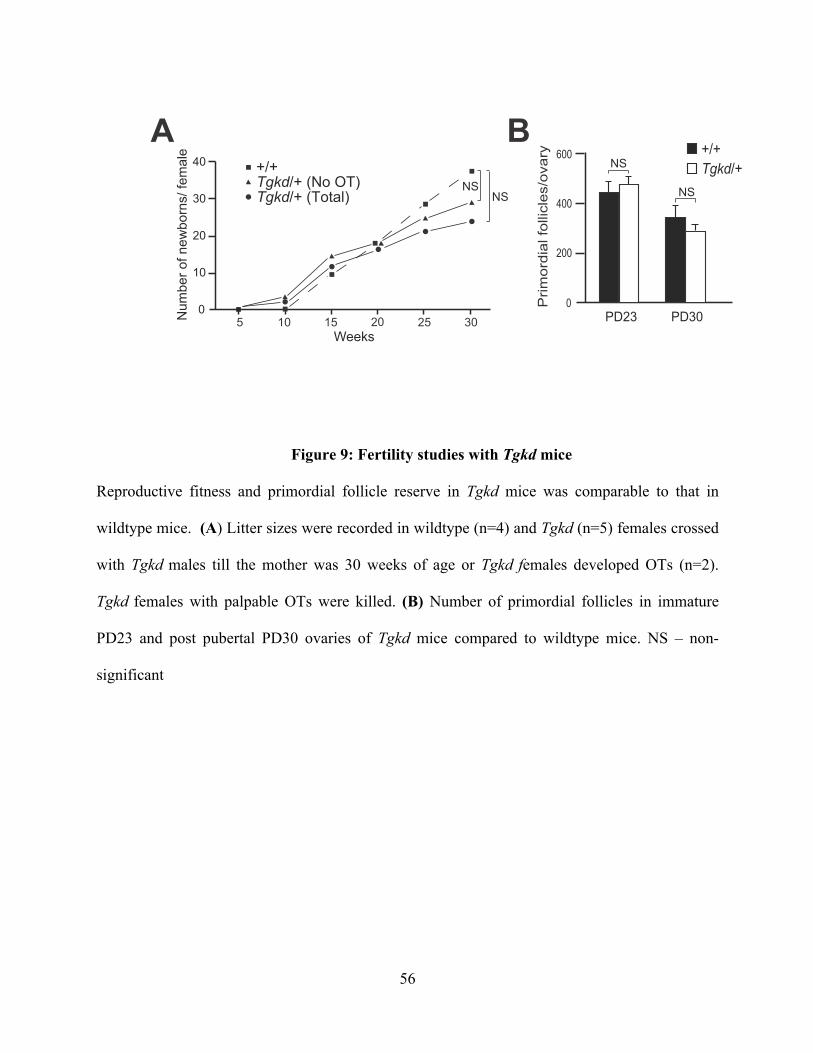
56
Figure 9: Fertility studies with Tgkd mice
Reproductive fitness and primordial follicle reserve in Tgkd mice was comparable to that in
wildtype mice. (A) Litter sizes were recorded in wildtype (n=4) and Tgkd (n=5) females crossed
with Tgkd males till the mother was 30 weeks of age or Tgkd females developed OTs (n=2).
Tgkd females with palpable OTs were killed. (B) Number of primordial follicles in immature
PD23 and post pubertal PD30 ovaries of Tgkd mice compared to wildtype mice. NS – non-
significant
0
10
20
30
40
Nu
mb
er
of
ne
wb
orn
s/
fem
ale
Weeks
+/+
Tgkd/+ (Total)
Tgkd/+ (No OT)
A B
3020 2515105
0
200
400
600
PD23 PD30
Prim
ordia
l fo
llic
les/o
vary +/+
Tgkd/+
NS
NS
NS NS

57
4.4 OVARIAN TERATOMAS ARISE FROM OOCYTES THAT HAVE
COMPLETED MEIOSIS I
Both follicle luteinization and meiotic maturation of fully-grown oocytes require the LH surge.
Therefore if trapped oocytes were postulated to give rise to OTs, we would expect the OTs to
develop from mature oocytes that have completed meiosis I. To test this hypothesis and more
definitively determine the cellular etiology of Tgkd OTs, I studied genomic DNA samples from
Tgkd OTs and paired host spleens obtained from Tgkd transgenic offspring of F1 (FVB-Tgkd x
B6) hybrid male mice backcrossed to inbred FVB female mice. Genotypes of paired OT and
spleen DNA samples were compared using pericentric and distal single nucleotide
polymorphisms (SNPs) between FVB and B6 strains for each autosome and the X chromosome.
If OTs arise from oocytes that have failed to complete meiosis I, pericentric markers of the OTs
would be genetically identical to the paired spleen. However if they arise from oocytes that have
completed meiosis I, the pericentric markers (FVB/B6) heterozygous in the host spleen would
become homozygous in the OT. For the majority of informative (heterozygous FVB/B6)
pericentric markers in each spleen DNA sample, genotypes of the paired OT DNA sample were
homozygous (Table 4). In contrast, the majority of the informative distal SNPs in each spleen
DNA sample remained heterozygous in the OT, consistent with frequent meiotic recombination
between a distal SNP marker and the centromere of the same chromosome. Detailed description
of the SNPs and their chromosomal location are provided in Appendix A. The small number of
pericentric SNPs that were heterozygous in both paired OT and spleen DNA was likely due to a
low frequency of recombination events near the centromere. These studies are consistent with
OTs arising from oocytes through Type II meiotic error (Table 1)[64]. I could conclude from

58
these findings that each of the seven examined Tgkd/+ OTs originated from a single mature
oocyte that had completed meiosis I.

59
Table 4: OTs arise from mature oocytes that have completed meiosis I
Heterozygous pericentric and distal SNPs were identified in the spleens of 7 females with OTs
from the cross between F1 (FVB-Tgkd X B6) and FVB mice. Genotypes (heterozygous or
homozygous FVB) of these SNPs were then determined in each of the paired OTs. SNP
information and location are provided in Appendix A.
Tgkd ovarian teratoma
Genotype (b/a)
Pericentric Distal
1 0/11 6/7
2 0/11 7/7
3 1/12 6/6
4 2/11 4/4
5 0/7 5/5
6 1/7 6/8
7 0/8 6/8
a – Number of heterozygous SNPs in spleen of mouse with OT
b – Number of SNPs heterozygous in both OT and spleen of host Tgkd/+ female

60
4.5 PARTHENOGENETIC ACTIVATION OF Tgkd OOCYTES
From the above studies, it is clear that abnormal follicular development, specifically the presence
of lutenized unruptured follicles (trapped oocytes), may play a crucial role in OT formation.
Trapped oocytes have been observed in other OT models such as the constitutively active FSH
receptor (mFshrD580H) mice, however all mouse models with luteinized unruptured follicles do
not develop OTs [3]. This observation indicates that some property of oocytes may have a role in
increasing the propensity of OT development.
Parthenogenetic activation of oocytes has been reported to be necessary for OT formation
[78]. Given this, I measured spontaneous parthenogenetic activation in cultured unfertilized Tgkd
oocytes by measuring the frequency of oocytes that progressed to the 2-cell stage [78]. COCs
were collected and matured for 17 hours in vitro after which the oocytes were separated from the
surrounding cumulus cells. Parthenogenetic activation was scored as the number of oocytes that
progressed to the 2-cell stage after an additional 24 hours of culture [78]. Approximately 30% of
cultured Tgkd oocytes underwent cell division, similar to the percentage of 2-cell embryos seen
in cultured wildtype FVB oocytes (Figure 10). The presence of the Tgkd transgene did not seem
to significantly increase the rate of parthenogenetic activation seen in FVB oocytes. However the
rate of parthenogenetic activation of FVB oocytes was much greater than that reported in B6
oocytes (3%) and even the OT susceptible LT/Sv mice (18%) (Eppig et al., 1996), suggesting
that mature oocytes in inbred FVB mice have a propensity toward parthenogenetic activation.
The absence of OTs in inbred FVB female mice however indicates that the FVB strain
background alone is not sufficient for OT formation reiterating a previously reported observation
that parthenogenetic activation is necessary but not sufficient for OT formation [78]. In this

61
regard, we speculate that the strain-specific modifier alleles (e.g. Ots2) promoting Tgkd-induced
OT development in the FVB background also promote oocyte parthenogenetic development.
20
40
+/+
Tgkd
/+
2-ce
ll em
bryo
s (%
of t
otal
) 60
80
100
Figure 10: Parthenogenetic activation studies in wildtype and Tgkd oocytes
Parthenogenetic activation and development to 2-cell stage was examined in wildtype (43 COCs
from 4 females) and Tgkd oocytes (37 COCs from 4 females). Both wildtype and Tgkd oocytes
of the FVB strain exhibited a high rate of parthenogenetic activation, which was not increased in
the presence of the Tgkd transgene.
62
4.6 ROLE OF OOCYTE Tgkd METHYLATION IN DEVELOPMENT OF OTS
Because the Tgkd transgene is maternally imprinted in Tgkd mice, I determined whether the loss
of Tgkd transgene methylation influenced the formation of Tgkd OTs. The RSV sequences of
Tgkd are methylated on the maternal and unmethylated on the paternal Tgkd alleles [92]. To
assess the importance of Tgkd methylation on OT formation, Tgkd mice were crossed to Dnmt3l-
/- mice (FVB strain) in order to obtain Dnmt3l-/-Tgkd females as DNMT3L protein is vital to the
establishment of genomic methylation, including imprinted methylation, during development of
mouse oocytes [99]. As expected, RSV sequences were highly methylated in Tgkd Dnmt3l+/+ MII
oocytes (82%) and Tgkd OTs (84%), but poorly methylated in Tgkd Dnmt3l -/- MII oocytes (26%)
(Figure 11A).
OTs were correspondingly found in Tgkd and Tgkd Dnmt3l+/- heterozygous female mice,
but not in Tgkd, Dnmt3l-/- female mice (Figure 11B). These findings support the notion that
Tgkd transgene methylation may be required for OT formation in Tgkd female mice. However
since the phenomenon of genomic imprinting is perturbed in Dnmt3l-/-oocytes, I cannot exclude
the possibility that abnormal maternal imprints and not the unmethylated Tgkd transgene
precludes OT formation in these mice.

63
Tgkd MII oocytes
(81.7%)
Tgkd teratoma
(84.0%)
Tgkd Dnmt3l -/- MII oocytes
(26.5%; p<0.05)
Genotype OT incidence (%)
12/80 (15)Tgkd, Dnmt3l+/+
5/31 (16)Tgkd, Dnmt3l+/-
0/14 (0)Tgkd, Dnmt3l -/-
A
B
Figure 11: Role of oocyte Tgkd methylation in OT formation
Loss of oocyte Tgkd methylation is associated with the loss of the OT phenotype in the Tgkd
strain. (A) Methylation of RSV region of Tgkd in MII oocytes (from 4 Tgkd mice), teratomas
(from 2 Tgkd mice) and MII oocytes (from 2 Tgkd, Dnmt3l-/- mice) determined by bisulfite
genomic sequencing. Filled circles – Methylated CpGs and absence of circle – Unmethylated
CpGs (B) The OT phenotype is present in 15% of Tgkd hemizygous females but is lost in the
Dnmt3l -/- background. *- p value < 0.05.
64
4.7 ROLE OF Tgkd METHYLATION IN STRAIN SPECIFICITY OF OT
PHENOTYPE
Since the loss of Tgkd methylation in FVB-Tgkd Dnmt3l -/- MII oocytes was associated with lack
of OTs, I assessed whether strain permissiveness for OT formation was a function of Tgkd
methylation. To do this, I examined whether the Tgkd transgene was genomically imprinted
(methylated on maternal allele) in the OT non-permissive 129 strain background. The FVB-Tgkd
strain was backcrossed to the 129 strain for several generations (n>10) and 129-Tgkd females did
not develop OTs.
Methylation of genomic imprints that are established in the female oocyte are maintained
post fertilization and during adult development of most somatic tissues [100]. Hence I analyzed
the methylation of Tgkd in the genomic DNA of F1 mice that either inherited the Tgkd transgene
from the mother or from the father. The methylation of the Tgkd transgene in F1 progeny that
inherit Tgkd only from the female recapitulate the state of Tgkd methylation in the oocytes of
129-Tgkd mother. On assessing the methylation state of the RSV sequences in the maternal Tgkd
allele and the paternal Tgkd allele in genomic DNA from adult spleen, I found that the Tgkd
transgene methylation is intact on the maternal allele and the Tgkd transgene is more highly
methylated on the maternal allele (62.3%) than on the paternal allele (41.1%) (Figure 12). The
methylation of maternally inherited Tgkd on the 129 background (62.3%) is lower than the level
in Tgkd oocytes on the FVB background (81.7%), however Tgkd methylation is not depleted to
levels observed in Tgkd Dnmt3l -/- MII oocytes (26%), where OTs are absent. These studies led
me to conclude that a high level of Tgkd methylation exists in 129-Tgkd oocytes and the non-
permissiveness of the OT phenotype on this background is not connected to the loss of Tgkd
methylation.
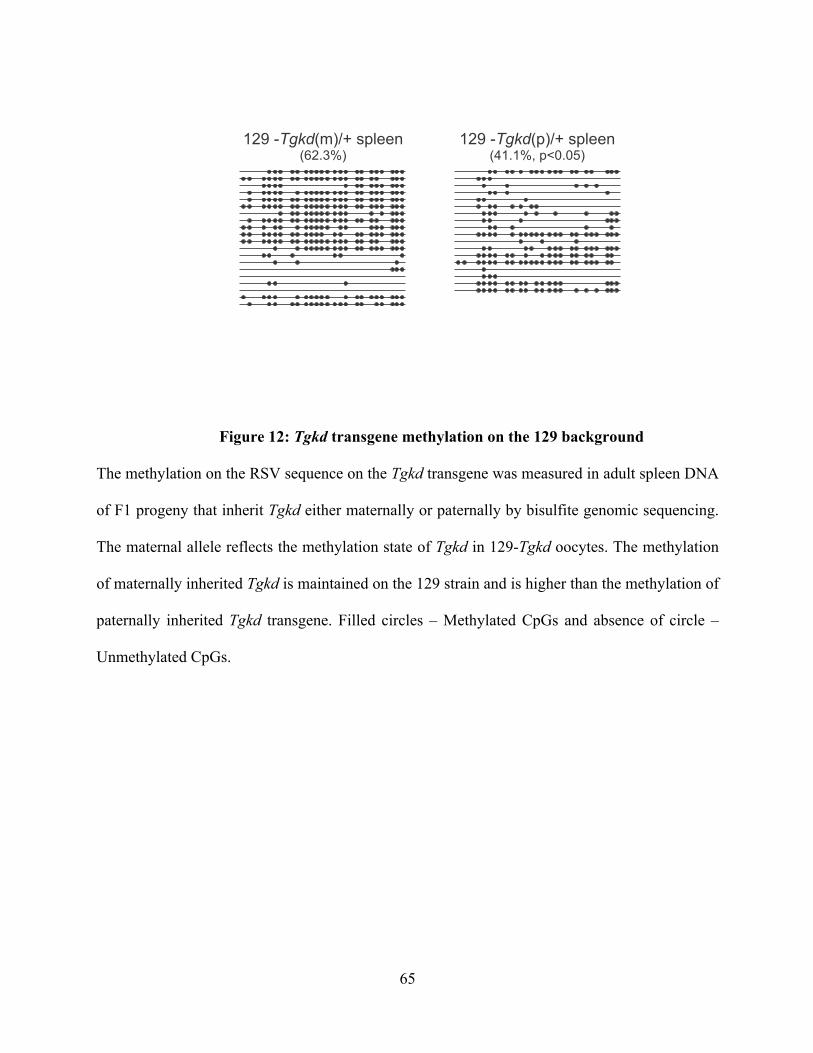
65
129 -Tgkd(m)/+ spleen(62.3%)
129 -Tgkd(p)/+ spleen(41.1%, p<0.05)
Figure 12: Tgkd transgene methylation on the 129 background
The methylation on the RSV sequence on the Tgkd transgene was measured in adult spleen DNA
of F1 progeny that inherit Tgkd either maternally or paternally by bisulfite genomic sequencing.
The maternal allele reflects the methylation state of Tgkd in 129-Tgkd oocytes. The methylation
of maternally inherited Tgkd is maintained on the 129 strain and is higher than the methylation of
paternally inherited Tgkd transgene. Filled circles – Methylated CpGs and absence of circle –
Unmethylated CpGs.

66
4.8 CONCLUSIONS
In this chapter, I have examined the development defects in Tgkd ovaries. The Tgkd OT model is
a complex model with several features contributing to the OT phenotype. I have observed a
number of dramatic follicular defects such as premature corpora lutea formation and the presence
of trapped oocytes in a subset of these follicles in Tgkd ovaries. OTs in Tgkd mice arise from
mature oocytes that have competed meiosis I supporting the hypothesis that a subset of the
trapped oocytes may develop into OTs. The oocytes of these mice display a high frequency of
parthenogenetic activation, which is independent of the Tgkd transgene but highly dependent on
the FVB strain. The parthenogenetic activation property may be linked to Ots2 alleles on
chromosome 6, which is associated with the FVB strain specificity of the phenotype. Previous
studies by Lee et al also suggested that oocyte parthenogenetic development in the OT
susceptible LT/Sv mice might be linked to Ots1 alleles on chromosome 6 [79]. Surprisingly I
found that OT development in Tgkd mice was not associated with fertility defects or premature
ovarian failure observed in other reported OT mouse models.
Another important aspect in the Tgkd model was the requirement of the oocyte DNMT3L
protein for subsequent OT formation. This observation indicated that either oocyte Tgkd
methylation or the presence of intact maternal imprints was necessary for OT development. Tgkd
methylation in oocytes was maintained in the non-permissive strains such as the 129 strain.
Therefore strain specific OT non-permissiveness was not connected to the inherited methylation
of Tgkd in the 129 strain.
I have characterized the ovarian follicular and oocyte defects that are associated with the
OT phenotype [101]. In the next sections, I aim to identify the molecular and signaling defects
that lead to these maturation defects in Tgkd ovaries.

67
5.0 INSERTIONAL EFFECTS OF THE Tgkd TRANSGENE
5.1 AIMS OF THESE STUDIES
The aim of these studies was to identify the gene or genes affected by the Tgkd insertion in order
to explain the molecular and signaling defects that lead to OT formation in Tgkd females. To
explore this possibility, we first mapped the precise insertion site of the Tgkd transgene array and
surveyed the effect of the Tgkd insertion on the transcription of the surrounding genes. Because
OTs arise from oocytes and the quantity of oocytes from female mice is limited (20
oocytes/mouse), each gene was characterized in tissues where the gene was highly expressed.
The tissues of interest to study the expression of each gene was chosen on the basis of expression
data curated in Mouse Genome Informatics (http://www.informatics.jax.org/) website. These
gene transcription studies were performed on the assumption that the effect of the transgene Tgkd
on the surrounding genes would be similar in the tissue analyzed and the Tgkd oocyte that leads
to OTs. I also separated the tissues based on parental inheritance of Tgkd to analyze whether
methylation of the transgene contributing to its effect on gene transcription. Alterations of gene
transcription observed in Tgkd tissues would be independently confirmed in Tgkd oocytes that
lead to the OT.

68
5.2 MAPPING OF THE Tgkd TRANSGENE INTEGRATION SITE
To explore the molecular basis of Tgkd OTs, we first identified the genomic location into which
the Tgkd transgene array had inserted. The integration site of Tgkd was determined by
identifying the genomic fragments flanking both sides of the Tgkd insertion by Dr. Richard
Chaillet (University of Pittsburgh, Pittsburgh, PA). This was accomplished by identifying single
copy junction fragments on southern blots of DNA from FVB-Tgkd mice probed with Tgkd
transgene fragments. Two junctional fragments, one from either side of the Tgkd insertion were
cloned from sub-genomic libraries of FVB-Tgkd DNA. Sequences of the endogenous genomic
ends of both junctional fragments containing endogenous and Tgkd transgene sequences aligned
with sequences on mouse chromosome 8, between the Inpp4b and I15 genes.
Further analysis of the junctional fragments indicated that approximately one kilobase of
endogenous genomic DNA was deleted from the insertion site in Tgkd mice. The Tgkd transgene
is located ~65 kilobases 3’ of the known 3’ end of the inositol polyphosphate-4-phosphatase type
II (Inpp4b) gene and ~120 kilobases 5’ of the known 5’ end of the Interleukin 15 (Il5) gene
(Figure 13A). The location of the large Tgkd transgene array in the intergenic region of Inpp4b
and Il15 suggested that the phenotypic abnormalities in Tgkd mice were due to disruption of one
or more unidentified genes in the intergenic region or due to effects on the gene function of
surrounding genes on chromosome 8. No spliced or unspliced transcripts have been reported in
the Inpp4b-Il15 intergenic region and multiple attempts to recover exons in this intergenic region
using exon-trapping strategies failed. Therefore we postulated that the abnormalities observed in
Tgkd mice were due to effects of the transgene on transcription of surrounding genes. In terms of
the genes surrounding the integration site, I hypothesized that the novel inositol phosphatase
Inpp4b was more likely to play a role in the etiology of OTs for a number of reasons. The first
69
reason was that the Tgkd insertion site was closest to the 3’ end of the Inpp4b gene. Secondly the
gene downstream of the Tgkd insertion Il15 has been mainly reported to be involved in the
control of the innate immune system and neither Il15-/- mice nor mice that overexpress IL15 have
been reported to develop OTs [102, 103]. However there have been reports of long-range
transcriptional effects of DNA hypermethylation on surrounding genes [104, 105]. Therefore to
perform an unbiased survey of the effect of the Tgkd transgene on genes surrounding the
insertion site, I assessed the effect of Tgkd on transcription of protein-coding genes in a 2Mb
region (1Mb on either side) on chromosome 8 surrounding the Tgkd insertion site (Figure 13B).
Two genes 4930579O11Rik and Gm9725 encoding long intergenic non-coding RNAs
(lincRNA) have been reported to be present 0.5Mb and 1Mb centromeric to the Tgkd transgene
on chromosome 8, but no function has been attributed to either lincRNA transcript
(http://www.informatics.jax.org/). The effect of the Tgkd transgene in altering the levels of these
lincRNA transcripts was not examined in this thesis.

70
Inpp4b Il15
Il15Inpp4bTgkd
50 kb
Wildtype
Chromosome 8Centromere Telomere
38 cM
Tgkd
Inpp4b Il15
Zfp330
Rnf150
Tbc1d9Usp38
Gab1
Smarca5
100kb
Chromosome 8
A
B
Figure 13: Schematics of the location of the Tgkd insertion site on chromosome 8
Representation of the insertion site of Tgkd transgene and surrounding genes on chromosome 8
(A) The Tgkd allele is inserted on chromosome 8 between the genes Inpp4b and Il15 as a
transgene tandem array in head-head, tail-tail or head-tail orientation. Each arrow represents a
single copy of the transgene. (B) Genes located on chromosome 8 in a 2Mb region surrounding
the insertion of the Tgkd transgene array. The effect of the Tgkd insertion on the transcription of
the genes represented in the figure was analyzed in adult Tgkd tissues. Description of the

71
function and nomenclature of each of the genes are provided in subsequent sections. Arrow on
each gene indicates sense or antisense transcription from the genomic strand.
5.3 ALLELE SPECIFIC TRANSCRIPTION STUDIES ON GENES SURROUNDING
Tgkd INSERTION
The hemizygous Tgkd transgene on the FVB strain causes the OT phenotype in 15-20% of mice.
Therefore, if we envision a cis-acting effect of Tgkd on the surrounding genes on chromosome 8,
we would expect only the allele on the chromosome with the transgene to be affected by the
insertion. As a result, we would expect an affected locus to have a normal wildtype allele on
chromosome 8 without the Tgkd insertion and an altered allele on the copy of chromosome 8
with the Tgkd transgene. If we presume that Tgkd completely suppresses the expression of a gene
by 100%, the overall reduction in the cellular levels of the gene product would be 50% due to the
contribution of the wildtype allele in hemizygous Tgkd mice.
I first decided to examine whether the Tgkd transgene array affected the transcription of
the genes surrounding the insertion site. To magnify the difference in gene expression caused by
the Tgkd transgene and eliminate the contribution of the wildtype allele, we decided to use allele
specific expression studies to specifically analyze cis-acting effects of Tgkd in a 2Mb region only
on the copy of chromosome 8 where it is inserted. I analyzed the expression of each gene in the
presence and absence of Tgkd in adult tissues, where they have previously been reported to be

72
highly expressed (http://www.informatics.jax.org/). To distinguish the gene expression between
the 2 parental copies of chromosome 8, I utilized previously described SNP differences between
mouse strains in the transcribed but untranslated UTRs or the coding exons of the gene. I set up
crosses between FVB and 129 mice and analyzed allelic differences in the tissues of the F1
hybrid progeny. Further the crosses were set up such that the Tgkd transgene was always on the
FVB copy of chromosome 8 and we could modify the parental inheritance of the transgene Tgkd
and accordingly modify the methylation of the transgene by the design of the parental cross
(Table 5).
I was able to subsequently analyze allele specific transcription in F1 hybrid tissues by the
use of the method Single Nucleotide Primer Extension (SNuPE) assay (Figure 14) [93]. In this
technique, RNA isolated from the F1 hybrid tissues was converted to cDNA and subsequently
reverse transcriptase PCR was performed on the converted cDNA. Both the FVB allele and 129
allele of the specific gene are amplified by the RT-PCR, however they are amplified in
proportion to the expression level in the tissue. Therefore if the Tgkd transgene has an effect on
the FVB allele of the specific gene, the contribution of the FVB allele would be unequal to that
of the 129 allele in the RT-PCR product. To measure this bias in the RT-PCR product, a single
cycle of PCR is performed with a common primer (SNuPE primer) exactly 5’ of a reported SNP
in the RT-PCR product and radioactive nucleotides corresponding to the respective SNPs of the
FVB and 129 alleles (Figure 14). The extent of radioactive incorporation of the FVB SNP is a
measure of the transcript levels of the FVB allele. When both alleles are equally transcribed as in
wildtype (+/+) F1 hybirds, the FVB to 129 allele incorporation ratio is 1:1. Significant deviations
from this ratio of 1:1 indicate the effect of the Tgkd transgene on the FVB allele of the gene as it
is normalized to the unaffected 129 allele. Since we are analyzing cis-acting effects of the Tgkd

73
transgene, I restricted the allele specific expression studies to a 2Mb region surrounding the Tgkd
insertion on chromosome 8.
Table 5: Analysis of F1 hybrids for allelic specific expression
Allele specific expression was analyzed in adult tissues of F1 progeny obtained from the
following crosses. The crosses were set up such that the Tgkd transgene was always on the FVB
chromosome in the progeny. Further Tgkd transgene was inherited maternally in the progeny of
the first cross and paternally in the progeny of the second cross.
Cross
(Female X Male)
Transgene
Inheritance
Expected Methylation of
Tgkd
FVB-Tgkd X 129 Maternal Highly Methylated
129 X FVB-Tgkd Paternal Relatively Unmethylated
FVB X 129 None None

74
RNA Template
Allele a
CG
A
T
Allele b
CG
A
T
RT-PCR (Gene X)
+ SNuPE primer
Primer Extension
+32P-dGTP +32P-dTTP
Gel electrophoresisRT-PCR fragment isolation
GC
TA
Figure 14: Representation of the SNuPE Assay
The SNuPE assay was used to detect allele specific gene expression from the FVB allele on
chromosome 8 with the Tgkd transgene insertion. RT-PCR for each gene was performed on
cDNA from equal quantities of RNA. A single round of primer extension on the RT-PCR
product with radioactive nucleotides revealed allele specific differences in transcription.

75
Once we obtained progeny from the F1 crosses described in Table 5, I wanted to first
confirm that the imprinted methylation of the Tgkd transgene is maintained in the F1 hybird
background. Tgkd as previously described in methylated on maternal inheritance and relatively
unmethylated on paternal inheritance in both the FVB and 129 strain (Figure 12) [92]. I used a
Southern blot approach with a probe located in the Tgkd transgene to confirm the imprinted
status of Tgkd in the F1 hybrids [92].
The Tgkd transgene was heavily methylated on maternal inheritance (F1 Tgkd(m)/+) and
relatively unmethylated on paternal inheritance (F1 Tgkd(p)/+) in F1 hybrid progeny from
crosses between FVB-Tgkd and 129 mice (Figure 15). The specificity of the probe is confirmed
by the absence of Tgkd methylated and unmethylated bands in the F1 hybird (+/+) mice (Figure
15). The 129 strain also depicted an imprinted methylation state similar to FVB-Tgkd mice as
determined by Southern blot and bisulfite genomic sequencing analysis.
Since I have confirmed that the methylation of Tgkd can be altered by parental
inheritance in F1 hybrid mice, I subsequently analyzed the effect of Tgkd methylation on the
transcription of the FVB allele of each of the genes analyzed on chromosome 8.
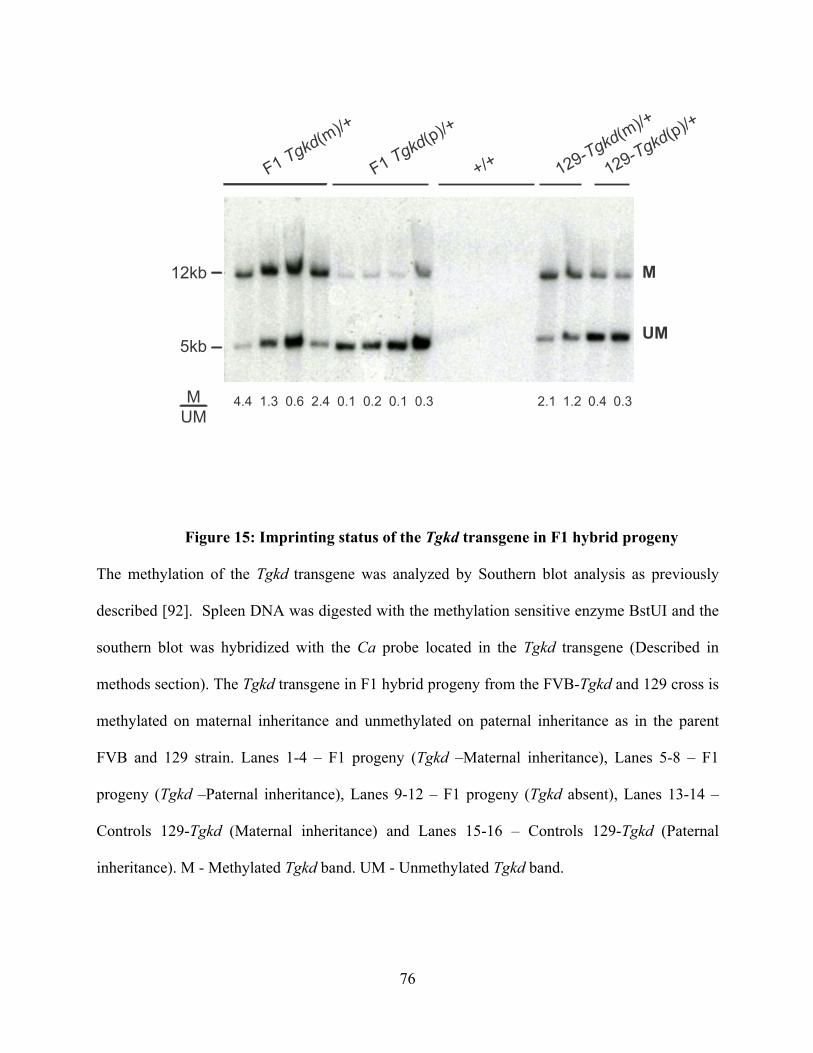
76
Figure 15: Imprinting status of the Tgkd transgene in F1 hybrid progeny
The methylation of the Tgkd transgene was analyzed by Southern blot analysis as previously
described [92]. Spleen DNA was digested with the methylation sensitive enzyme BstUI and the
southern blot was hybridized with the Ca probe located in the Tgkd transgene (Described in
methods section). The Tgkd transgene in F1 hybrid progeny from the FVB-Tgkd and 129 cross is
methylated on maternal inheritance and unmethylated on paternal inheritance as in the parent
FVB and 129 strain. Lanes 1-4 – F1 progeny (Tgkd –Maternal inheritance), Lanes 5-8 – F1
progeny (Tgkd –Paternal inheritance), Lanes 9-12 – F1 progeny (Tgkd absent), Lanes 13-14 –
Controls 129-Tgkd (Maternal inheritance) and Lanes 15-16 – Controls 129-Tgkd (Paternal
inheritance). M - Methylated Tgkd band. UM - Unmethylated Tgkd band.
F1 Tgkd(m)/+
F1 Tgkd(p)/+
+/+ 129-Tgkd(m)/+
129-Tgkd(p)/+
12kb
5kb
M
UM
MUM
4.4 1.3 0.6 2.4 0.1 0.2 0.1 0.3 2.1 1.2 0.4 0.3

77
Allele specific expression studies using SNuPE analysis were performed on F1 hybrid
tissue on 8 genes located either 1Mb upstream or downstream of the Tgkd insertion site (Figure
13B). Expression studies for each gene were performed on a tissue reported to have a high level
of expression. We assumed that the Tgkd transgene would have the same effect on gene
transcription in all tissues with sufficient expression and I would subsequently confirm
alterations in oocytes, which give rise to OTs. The SNP differences between the FVB and 129
allele were confirmed in the RT-PCR product by sequencing prior to SNuPE analysis. RT-PCR
primers and the SNuPE reaction primer for each gene are provided in Appendix B.
On the centromeric side of the Tgkd transgene, I analyzed 4 genes – SWI/SNF related,
matrix associated, actin dependent regulator of chromatin, subfamily a, member 5 (Smarca5),
growth factor receptor bound protein 2-associated protein 1 (Gab1), ubiquitin specific peptidase
38 (Usp38) and inositol phosphatase Inpp4b. Smarca5 and Inpp4b were previously reported to
depict high expression in the adult brain [106, 107]. Gab1, Usp38 and Inpp4b were reported be
highly expressed in the adult spleen. I analyzed allele specific expression of Inpp4b in brain and
spleen, as it is located closet to the Tgkd insertion site [108]. For each SNuPE experiment, FVB
and 129 control samples were used to depict the specificity and quantitative nature of the SNuPE
analysis. The radioactive incorporation of the FVB specific SNP was quantitated using
phosphoimager analysis and this was normalized to the level of 129 specific SNP. The 129
chromosome 8 did not have the Tgkd transgene insertion, hence was used as normalization
control between the different groups.
I analyzed 3 different regions in the gene Smarca5 for SNP differences between the FVB
and 129 alleles, but none of the reported SNPs were true SNPs. In each case, the FVB SNP was
also present on the 129 allele. Since, I could detect only the FVB cytosine SNP as depicted in

78
Figure 16A, I could not perform allele specific expression analysis on this gene. Since Smarca5
was located farthest away (1.36Mb) from the Tgkd transgene, I did not pursue further SNuPE
experiments on this gene.
Both Gab1 and Usp38 had SNP differences in the 5’UTR and coding exon 9 respectively
(Figure 16B and C). On performing SNuPE analysis in adult spleens of F1 hybrids, I obtained a
G/C ratio for Gab1 and T/C ratio for Usp38 when the FVB allele expression was normalized to
the 129 allele. The G/C ratio for Gab1 was similar in wildtype (+/+) F1 hybrids and F1 hybrids
with the Tgkd transgene irrespective of parental inheritance (Tgkd(m)/+ and Tgkd(p)/+) (Figure
16B). The T/C ratio for Usp38 from SNuPE analysis was also similar among the various groups
(Figure 16C). On performing SNuPE analysis on the Inpp4b gene in adult brain tissue, I
observed a statistically significant 2 fold decrease in the levels of the FVB allele expression (C/T
ratio) in maternal Tgkd(m)/+ F1 hybrids compared to wildtype F1 hybrids (Figure 16D). This
decrease was a Tgkd parent of origin specific effect as it was not observed in paternal Tgkd(p)/+
hybrids. I observed a similar trend in adult spleen tissue but the effect of Tgkd on FVB Inpp4b
expression was not as pronounced as that observed in the brain (Figure 16E). This parent specific
decrease in Inpp4b is consistent with the importance of Tgkd methylation on the transgene-
induced decrease of Inpp4b levels. Further an increase in CpG methylation has been correlated
with a decrease in transcription of nearby genes, therefore we can hypothesize that the array of
CpG methylation on Tgkd may cause transcriptional suppression of Inpp4b.

79
ATAATTTTCTATGCATATTT[C/T]
FVB-C
129-T
Smarca5 3’UTR - Brain
FVB-G
129-C
CAGTTCTGGGCTCCCTGTCC[G/C]
Gab1 5’UTR - Spleen
0.0 0.2 0.4 0.6 0.8 1.0
Tgkd(m)/+ Tgkd(p)/+ +/+
G/C
ra
tio
F1 Hybrid (Female X Male)
Gab1 Spleen
129
FVB
F1 Tgkd(
m)/+
F1 Tgkd(
p)/+
+/+
T/C
ra
tio
129-C
FVB-T
ACATCTGCTGCCTAAACTG[T/C]Usp38 exon 9 - Spleen
129
FVB
F1 Tgkd(
m)/+
F1 Tgkd(
p)/+
+/+
0.0
0.2
0.4
0.6
0.8
1.0
Tgkd(m)/+ +/+ F1 Hybrid (Female X Male)
Usp38 Spleen
Tgkd(p)/+
GGTACCATTTGAAAAAGACA[C/T]Inpp4b 5’UTR - Brain
FVB-C
129-T
129
FVB
F1 Tgkd(
m)/+
F1 Tgkd(
p)/+
+/+
0.0
0.2
0.4
0.6
0.8
1.0
Tgkd(m)/+ Tgkd(p)/+ +/+
C/T
ra
tio
F1 Hybrid (Female X Male)
Inpp4b Brain
GGTACCATTTGAAAAAGACA[C/T]Inpp4b 5’UTR - Spleen
FVB-C
129-T
129
FVB
F1 Tgkd(
m)/+
F1 Tgkd(
p)/+
+/+
0.0
0.2
0.4
0.6
0.8
1.0
Tgkd(m)/+
C/T
ra
tio
F1 Hybrid (Female X Male)
Inpp4b Spleen
Tgkd(p)/+ +/+
A
B C
D E
*
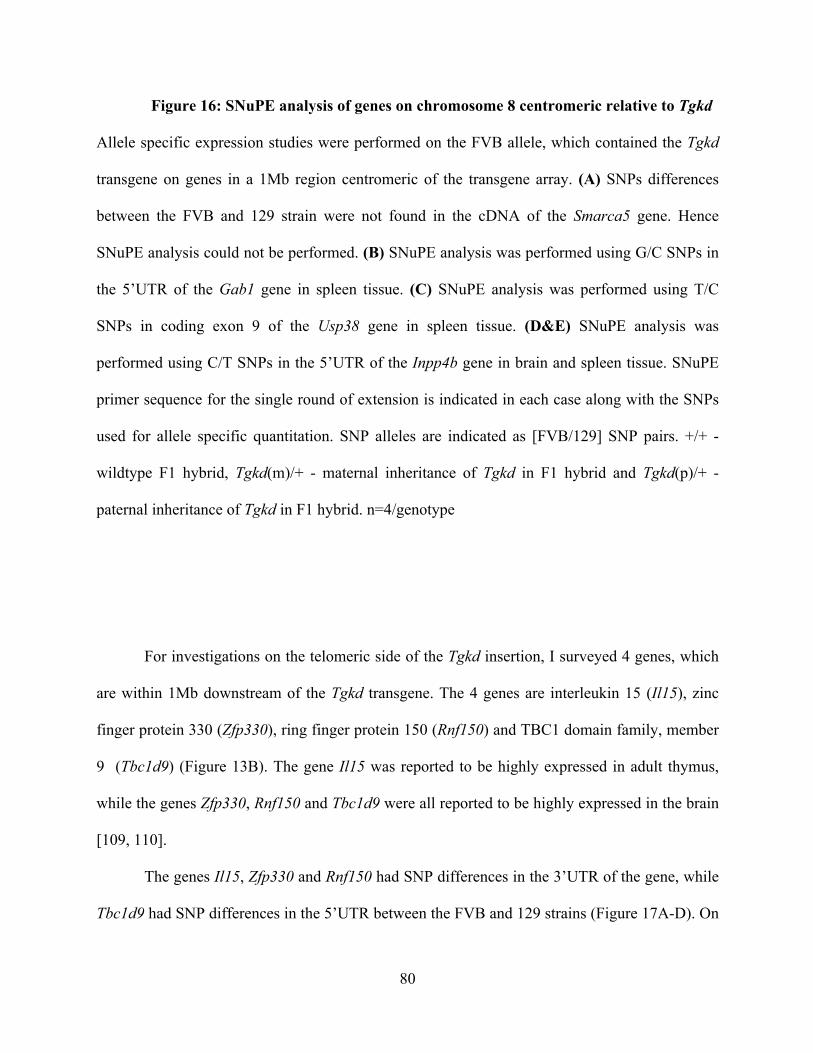
80
Figure 16: SNuPE analysis of genes on chromosome 8 centromeric relative to Tgkd
Allele specific expression studies were performed on the FVB allele, which contained the Tgkd
transgene on genes in a 1Mb region centromeric of the transgene array. (A) SNPs differences
between the FVB and 129 strain were not found in the cDNA of the Smarca5 gene. Hence
SNuPE analysis could not be performed. (B) SNuPE analysis was performed using G/C SNPs in
the 5’UTR of the Gab1 gene in spleen tissue. (C) SNuPE analysis was performed using T/C
SNPs in coding exon 9 of the Usp38 gene in spleen tissue. (D&E) SNuPE analysis was
performed using C/T SNPs in the 5’UTR of the Inpp4b gene in brain and spleen tissue. SNuPE
primer sequence for the single round of extension is indicated in each case along with the SNPs
used for allele specific quantitation. SNP alleles are indicated as [FVB/129] SNP pairs. +/+ -
wildtype F1 hybrid, Tgkd(m)/+ - maternal inheritance of Tgkd in F1 hybrid and Tgkd(p)/+ -
paternal inheritance of Tgkd in F1 hybrid. n=4/genotype
For investigations on the telomeric side of the Tgkd insertion, I surveyed 4 genes, which
are within 1Mb downstream of the Tgkd transgene. The 4 genes are interleukin 15 (Il15), zinc
finger protein 330 (Zfp330), ring finger protein 150 (Rnf150) and TBC1 domain family, member
9 (Tbc1d9) (Figure 13B). The gene Il15 was reported to be highly expressed in adult thymus,
while the genes Zfp330, Rnf150 and Tbc1d9 were all reported to be highly expressed in the brain
[109, 110].
The genes Il15, Zfp330 and Rnf150 had SNP differences in the 3’UTR of the gene, while
Tbc1d9 had SNP differences in the 5’UTR between the FVB and 129 strains (Figure 17A-D). On

81
performing SNuPE analysis in adult thymus of F1 hybrids, I obtained a T/C ratio for Il15 when
the FVB allele expression was normalized to the 129 allele. Similarly, on performing allele
specific expression studies on F1 hybrid brains, I was able to determine a T/C, C/T and T/C ratio
for Zfp330, Rnf150 and Tbc1d9 respectively to quantitate FVB allele expression. The T/C ratio
of Il15 in the thymus tissue of F1 hybrids was not significantly different in the presence or
absence of the Tgkd transgene (Figure 17A). The FVB allele expression or T/C ratio of Zfp330
showed a small but significant increase on both maternal (Tgkd(m)/+ - 1.7 fold of +/+) and
paternal (Tgkd(p)/+ - 1.4 fold) inheritance of Tgkd compared to the wildtype F1 hybrid in adult
brain (Figure 17B). The gene Rnf150 also depicted a small (0.8 fold) but significant decrease in
the C/T ratio in adult brain only on maternal inheritance of Tgkd (Figure 17C). The T/C ratios
obtained from allele specific expression studies on Tbc1d9 were not significantly different in the
presence or absence of the Tgkd transgene (Figure 17D).
This survey of allele specific expression of genes in a 2Mb region surrounding Tgkd
yielded 3 potential gene candidates to pursue, with significant transcription differences in the
presence of Tgkd: Inpp4b, Zfp330 and Rnf150. Since the transcription changes in Rnf150 were
small even in allele specific expression studies, I decided to exclude the gene from further
analysis. Between Inpp4b and Zfp330, I postulated that Inpp4b would be better potential
candidate involved in OT formation for several reasons. The first reason is that Inpp4b is closest
to the Tgkd integration site, therefore is more likely to be influenced by the insertion. Secondly
Inpp4b has the highest fold change (2 fold decrease) in the presence of maternal Tgkd and a
decrease in expression would be consistent with the role of Tgkd methylation in transcriptional
suppression. I also observed a Tgkd parent of origin effect on Inpp4b in adult brain and this
effect is consistent with the notion that the heavily methylated maternal Tgkd is more effective at

82
transcriptional suppression of nearby genes (Inpp4b) than the unmethylated paternal Tgkd
transgene. In summary, the allele specific expression studies led us to focus on the effect of Tgkd
on Inpp4b levels and the mechanism by which transcriptional suppression of Inpp4b could lead
to OT formation.

83
FVB-T
129-C12
9FV
B
F1 Tgkd(
m)/+
F1 Tgkd(
p)/+
+/+
Il15 3’UTR - ThymusATCAACACGTCCTGACTGCA[T/C]
0.0 0.2 0.4 0.6 0.8 1.0
Tgkd(m)/+
T/C
rati
o
F1 Hybrid (Female X Male)
Il15 Thymus
Tgkd(p)/+ +/+
FVB-T
129-C
129
FVB
F1 Tgkd(
m)/+
F1 Tgkd(
p)/+
+/+
Zfp330 3’UTR - BrainTGTAATGGGTAAAATTACCA[T/C]
0.0 0.2 0.4 0.6 0.8 1.0
Tgkd(m)/+ +/+
T/C
rati
o
F1 Hybrid (Female X Male)
Zfp330 Brain
Tgkd(p)/+
FVB-C
129-T
129
FVB
F1 Tgkd(
m)/+
F1 Tgkd(
p)/+
+/+
Rnf150 3’UTR - BrainCACTTGACTTCAGCCTCTCC[C/T]
0.0 0.2 0.4 0.6 0.8 1.0
Tgkd(m)/+ +/+
C/T
rati
o
F1 Hybrid (Female X Male)
Rnf150 Brain
Tgkd(p)/+
FVB-T
129-C
129
FVB
F1 Tgkd(
m)/+
F1 Tgkd(
p)/+
+/+
Tbc1d9 5’UTR - BrainAATTAACTATTTATTAGTACC[T/C]
0.0 0.2 0.4 0.6 0.8 1.0
T/C
rati
o
Tbc1d9 Brain
F1 Hybrid (Female X Male)
Tgkd(m)/+ Tgkd(p)/+ +/+
A B
C D
**
*

84
Figure 17: SNuPE analysis of genes telomeric relative to the Tgkd insertion
Allele specific expression studies were performed on the FVB allele with the Tgkd insertion on
genes in a 1Mb region telomeric of the transgene array. (A) SNuPE analysis was performed
using T/C SNPs in the 3’UTR of the Il15 gene in thymus tissue. (B) SNuPE analysis was
performed using T/C SNPs in the 3’UTR of the Zfp330 gene in brain tissue. (C) SNuPE analysis
was performed using C/T SNPs in 3’UTR of the Rnf150 gene in brain tissue. (D) SNuPE
analysis was performed using T/C SNPs in the 5’UTR of the Tbc1d9 gene in brain tissue. SNuPE
primer sequence for the single round of extension is indicated in each case along with the SNPs
used for allele specific quantitation. SNP alleles are indicated as (FVB/129) SNP pairs. +/+ -
wildtype F1 hybrid, Tgkd(m)/+ - maternal inheritance of Tgkd in F1 hybrid and Tgkd(p)/+ -
paternal inheritance of Tgkd in F1 hybrid.
5.4 TRANSCRIPTIONAL PROFILE OF INPP4B IN EMBRYONIC BRAIN
The Tgkd transgene on the FVB background leads to 2 phenotypes: adult hemizygous Tgkd
females develop OTs and homozygous Tgkd mice die around birth. The perinatal death of
homozygous Tgkd mice led us to hypothesize that both the maternal and paternal copy of Tgkd
may have an effect on the surrounding genes and the additive effect of both copies of Tgkd in
homozygous Tgkd mice causes the death of the mice. Therefore I decided to perform a 4-way
comparison between wildtype (+/+), maternal Tgkd (Tgkd(m)/+), paternal Tgkd (Tgkd(p)/+) and

85
homozygous Tgkd (Tgkd/Tgkd) embryos to assess the effect of Tgkd on Inpp4b levels. I decided
to perform this analysis on embryos earlier in gestation to avoid biases due to developmental
defects later in gestation that eventually lead to the perinatal lethality of Tgkd/Tgkd mice.
I initially measured the levels of Inpp4b transcript in +/+, Tgkd(m)/+, Tgkd(p)/+ and
Tgkd/Tgkd E9.5 FVB embryos using real-time PCR analysis. I found that the levels of Inpp4b in
all four groups were similar to each other independent of the presence of the Tgkd transgene
(Figure 18A). However on evaluating the levels of Inpp4b transcript across gestation by real-
time PCR, I found that Inpp4b was not highly expressed in E9.5 embryos (Figure 18B). Inpp4b
has been reported to be expressed in the adult brain and I found that Inpp4b expression increases
8 fold in E13.5 wildtype embryo brains and 14 fold in E16.5 wildtype embryo brains compared
to the levels in E9.5 wildtype embryos (Figure 18B) [106]. Since E16.5 embryos were closer to
the time point of perinatal lethality, I decided to evaluate the effect of Tgkd on Inpp4b levels in
E13.5 embryonic brains.

86
Figure 18: Determining Inpp4b levels across gestation
Inpp4b levels were determined in embryos across gestation by real-time PCR analysis. (A)
Inpp4b levels were determined in hemizygous and homozygous Tgkd embryos at E9.5 during
gestation by real-time PCR analysis (n=3 embryos/group). Relative mRNA expression or fold
change was determined relative to wildtype (+/+) embryos. (B) Inpp4b transcript levels were
B
A
0
0.5
1
1.5
2
Rela
tive m
RN
A exp
ress
ion
+/+
Tgkd
(m)/+
Tgkd
(p)/+
Tgkd
/Tgkd
Inpp4b Total expression
0
4
8
12
16
E9.5 Embryo E13.5 Brain E16.5 Brain
Embryonic Stage
Inpp4b Total expression: Wildtype embryos
Rela
tive m
RN
A exp
ress
ion
NS NS NS
87
measured across gestation in wildtype FVB E9.5 embryos, E13.5 brain and E16.5 brain (n=1 at
each stage). Fold change was determined relative to the expression measured in E9.5 embryos.
Inpp4b levels were normalized to the housekeeping gene TBP. NS – non-significant
5.5 EFFECT OF Tgkd ON INPP4B EXPRESSION IN E13.5 EMBRYONIC BRAIN
Since Inpp4b transcripts are highly expressed in the adult and embryonic brain, I first explored
the effect of the Tgkd insertion on Inpp4b transcript and protein levels in the heads of E13.5
embryos (Figure 18B) [106]. This enabled us to perform a 4 way comparison of Inpp4b levels
between wildtype (+/+), maternal Tgkd (Tgkd(m)/+), paternal Tgkd (Tgkd(p)/+) and homozygous
Tgkd (Tgkd/Tgkd) embryos on the FVB strain. I was also able to perform an in-depth comparison
on the role of methylation and homozygosity of Tgkd in altering Inpp4b transcript and protein
levels. At the level of Inpp4b transcription, I also analyzed the effect of the Tgkd transgene on
known splice isoforms of Inpp4b.
The two well-characterized Inpp4b transcripts, Inpp4bα and Inpp4bβ are produced by
alternative splicing of the 3’ end of Inpp4b and are translated into the INPP4Bα and INPP4Bβ
proteins respectively [106]. A comparison of Inpp4b transcript levels was performed among
wild-type, Tgkd(m)/+, Tgkd(p)/+ and Tgkd/Tgkd E13.5 embryos (Figure 19A). The level of
Inpp4bβ was found to be most affected by the Tgkd insertion; Tgkd/Tgkd and Tgkd(m)/+
88
embryos expressed ~50% of wild-type Inpp4bβ, whereas Tgkd(p)/+ embryos showed an ~20%
decease in Inpp4bβ expression (p<0.05).
Inpp4bα (includes Inpp4bαs, a short α-like transcript) was less affected in Tgkd embryo
heads. Homozygous Tgkd/Tgkd embryos showed the most downregulation (20%) compared to
wildtype controls, and Tgkd(m)/+ embryos had comparable Inpp4bα expression as Tgkd/Tgkd
embryos (p<0.05). Levels of Inpp4bα in Tgkd(p)/+ embryos were somewhat lower than
wildtype embryos but this difference was not statistically significant. Total Inpp4b followed a
pattern of expression similar to the Inpp4bα transcript because the level of Inpp4bβ was
approximately 10-fold lower than the total levels of Inpp4b in adult brain.
INPP4B protein levels were correspondingly affected in E13.5 embryonic heads.
Individual Tgkd/Tgkd heads had a significant reduction of ~50% of the wildtype protein
concentration (Figure 19B). Individual Tgkd(m)/+ and Tgkd(p)/+ heads had somewhat lower
concentrations of INPP4B, although collectively, levels of INPP4B in hemizygous mice were not
statistically different than wild-type mice (Figure 19B). The combination of small effects on the
normally highly expressed Inpp4bα transcripts, and large effects on the normally poorly
expressed Inpp4bβ transcript from both parental Tgkd alleles accounts for the significant
differences in INPP4B expression between Tgkd/Tgkd and control wildtype embryos. I was
surprised to observe that the transcriptional differences observed between Tgkd(m)/+ and
Tgkd(p)/+ embryo heads did not manifest in the levels of total INPP4B protein. We cannot
distinguish between INPP4B α and β protein isoforms with the currently available antibodies,
which are targeted to the N-terminus of the INPP4B protein. The absence of significant
differences between Tgkd(m)/+ and Tgkd(p)/+ embryo heads is most likely due to the low levels
of the INPP4Bβ protein compared to the INPP4Bα protein. In summary, in E13.5 embryonic

89
brains, the Tgkd transgene has parent-specific effects on Inpp4b transcription, however the effect
on INPP4B protein levels is similar in hemizygous Tgkd brains to wildtype levels and an additive
decrease is seen in homozygous Tgkd brains.

90
Total
Alpha
Beta
Rel
ativ
e m
RN
A
exp
ress
ion
0 0.5
1 1.5
2
+/+
Tgkd
(m)/+
Tgkd
(p)/+
Tgkd
/Tgkd
INPP
4B/A
ctin
B
A
***
****
+/+ Tgkd(m)/+
Tgkd(p)/+
Tgkd/Tgkd
Tgkd(m)/+
Tgkd(p)/+
Tgkd/Tgkd
Tgkd(m)/+
Tgkd(p)/+
Tgkd/Tgkd
INPP4BActin
*
Inpp4b expression
+/+ +/+
1.2
0.8
0.4
0
Tgkd/TgkdTgkd(p)/+
Tgkd(m)/++/+
Figure 19: Effect of Tgkd on Inpp4b levels in E13.5 embryos
Expression of Inpp4b in E13.5 Tgkd embryonic brain. (A) Inpp4b total transcript and levels of
α and β isoforms were measured in Tgkd E13.5 embryo heads (+/+ - wildtype, Tgkd(m)/+ -
maternally inherited Tgkd, Tgkd(p)/+ - paternally inherited Tgkd, and Tgkd/Tgkd - homozygous
Tgkd) (n>3 mice/genotype). Inpp4b levels were normalized to the housekeeping gene TBP and

91
fold changes were expressed relative to +/+ embryos. (B) INPP4B protein levels in homozygous
and hemizygous Tgkd E13.5 embryo heads (n=3). * - p value <0.05
5.6 IMPACT OF THE Tgkd INSERTION ON SPLICE ISOFORMS OF Inpp4b
In the analysis of the effect of Tgkd on Inpp4b transcription, I found that the Tgkd transgene had
a more pronounced effect on Inpp4bβ compared to the Inpp4bα splice isoform. Inpp4bα and
Inpp4bβ are previously characterized splice isoforms generated due to alternative splicing of the
terminal exon of Inpp4b exon 25, resulting in different terminal exons and 3’ UTRs [106].
INPP4Bα has a hydrophilic carboxy terminus while INPP4Bβ has a hydrophobic carboxy
terminus. Inpp4b also has an alternative Inpp4bα isoform that lacks exon 5, however this
isoform is not expressed in the brain [106].
Given these results, I also wanted to determine whether the Tgkd insertion caused the
generation of any novel splice isoforms of the gene Inpp4b in addition to its effect on Inpp4bα
and Inpp4bβ. Transcripts from E13.5 embryonic brain from wildtype and homozygous
(Tgkd/Tgkd) were ideal for this analysis as Tgkd/Tgkd brains should show an enrichment for any
potential Tgkd induced splice isoforms. To investigate the existence of novel splice isoforms,
RNA from a Tgkd/Tgkd and wildtype E13.5 brain was converted to cDNA. A series of PCRs
after reverse transcription (RT-PCRs) were performed spanning the entire cDNA sequence of the

92
gene. The PCR primers were designed to generate 1kb amplicons and successive PCR products
had overlap regions of atleast 200bp. The PCR amplified amplicons were sequenced and the
sequence from wildtype and Tgkd/Tgkd embryos were compared. Overlap regions were designed
in PCR products to ensure sequencing of the entire Inpp4b cDNA sequence. Further if the loss of
sequence in potential novel isoforms were in the region of the forward or reverse primer, then
PCR amplification of that amplicon would not take place.
I designed 7 sets of primers to span the entire 3.23kb and 4.39kb Inpp4b α and β cDNA
sequence respectively. The primer sequence for each amplicon is provided in Appendix B. I
obtained successful PCR amplification of similar size for all sets of primers in both wildtype and
Tgkd/Tgkd E13.5 brains indicating no major loss or gain of sequence in Tgkd/Tgkd E13.5 brains.
DNA sequencing of the cloned RT-PCR products revealed no sequence differences or novel
splice isoforms between wildtype and Tgkd/Tgkd embryonic brains (Data not shown). In
summary, the insertion of Tgkd did not alter the sequence or generate novel isoforms of Inpp4b.
5.7 CONCLUSIONS
In this chapter, I have determined that the Tgkd transgene is inserted on chromosome 8 between
the Inpp4b and Il15 genes [101]. The Tgkd insertion is closest to the 3’ end of Inpp4b. Allele
specific expression studies revealed that the hemizygous Tgkd transgene had effects on the
transcript levels of Inpp4b, Zfp330 and Rnf150 genes. However the highest decrease induced by
the Tgkd insertion was on the Inpp4b gene and this suppression was caused by the methylated
maternal Tgkd transgene. Inpp4b transcript levels were examined in wildtype embryos prior to
the perinatal lethality observed in Tgkd/Tgkd mice. Inpp4b was not expressed in E9.5 embryos,
93
however the levels of Inpp4b were high in both E13.5 and E16.5 brains. On further examination
of E13.5 brains, homozygous Tgkd/Tgkd embryos showed the largest decrease in Inpp4b levels
specifically in the Inpp4bβ isoform compared to wildtype embryos. Embryos with maternal
inheritance of Tgkd (Tgkd(m)/+) mimic Inpp4b expression patterns in Tgkd/Tgkd embryos while
Tgkd(p)/+ embryos have wildtype Inpp4b levels. On examination of INPP4B protein in E13.5
brains, a significant decrease in INPP4B protein was observed only in homozygous Tgkd/Tgkd
embryos compared to wildtype levels. The Tgkd insertion did not alter the sequence or cause
generations of novel splice isoforms of Inpp4b in Tgkd/Tgkd E13.5 brains. Therefore Tgkd
mainly caused transcriptional suppression of Inpp4b levels in hemizygous and homozygous Tgkd
E13.5 brains, which manifested as a significant decrease in INPP4B protein in Tgkd/Tgkd
embryonic brains.
94
6.0 ES CELL MODEL TO STUDY EFFECT OF Tgkd ON INPP4B AND
DOWNSTREAM SIGNAL TRANSDUCTION PATHWAYS
6.1 AIMS OF THESE STUDIES
The effect of the Tgkd transgene in decreasing the levels of INPP4B was demonstrated in the
previous chapter by allele specific expression in adult brain and real time PCR studies in
embryonic brain. Recent studies have shown that the tumor suppressor Inpp4b is a negative
regulator of PI3-Kinase/AKT (PI3K/AKT) signaling pathway through degradation of PI(3,4)P2
to PI(3)P [111, 112]. An increase in PI(3,4)P2 levels promotes increased phosphorylation of
AKT; therefore by degrading PI(3,4)P2, Inpp4b acts as a suppressor of the PI3K/AKT pathway.
To study the role of Tgkd in OT formation, I decided to examine its role on the PI3K/AKT
pathway.
I did not perform PI3K/AKT activation studies in the adult or embryonic brain as the
levels of phospho-AKT (P-AKT) were very low (Data not shown) and the stimulation
experiments to study AKT activation kinetics on embryonic brain seemed difficult and
unconnected to the process of OT formation from oocytes. Inpp4b expression and PI3K/AKT
studies in oocytes were also challenging due to the limited amount of oocyte material. Therefore
to develop an in vitro model closer to the oocyte developmental time point, we decided to use ES
cells as a model to study Tgkd induced effects on Inpp4b levels and the activation of the

95
PI3K/AKT pathway. The ES cell model offered a number of advantages as a tool to study the
effect of Tgkd on the PI3K/AKT pathway. INPP4B is expressed in ES cells and ES cells are
derived from an early embryonic time point (E3.5 blastocysts), which is a closer developmental
time point to oocytes. They provide an unlimited amount of material to study AKT activation
kinetics and AKT phosphorylation can be modulated easily in ES cells through serum starvation
and subsequent stimulation with the hormone IGF1. Further, since ES cells are derived from
E3.5 blastocysts, we should be able to derive wildtype (+/+), hemizygous (Tgkd(m)/+ and
Tgkd(p)/+) and homozygous Tgkd/Tgkd ES cell lines to perform a 4-way comparison on the
effect of the Tgkd transgene on Inpp4b expression and subsequent PI3K/AKT activation in this
model.
These factors rendered the Tgkd ES cell model as an attractive model to study signaling
alterations in the PI3K/AKT pathway caused by the transgene, which can be subsequently
confirmed in Tgkd oocytes that lead to OT formation.
6.2 DEVELOPMENT OF THE Tgkd ES CELL MODEL AND METHYLATION
STATUS OF Tgkd IN ES CELLS
To develop the Tgkd ES cell model, I derived ES cell lines from E3.5 blastocysts by previously
established methods [89]. I decided to derive ES cell lines from blastocysts of the 129 strain as
these blastocysts depict a higher potential to give rise to ES cell lines than blastocysts from other
mouse strains [113]. The FVB strain is permissive to OT development and the 129 strain is not
OT permissive in the presence of the Tgkd transgene. However, the gene/genes linked to the
FVB strain specific OT phenotype was linked to a region on chromosome 6 independent of the

96
Tgkd transgene insertion on chromosome 8. This observation led us to assume that the cis-acting
effects of Tgkd on the surrounding genes on chromosome 8 in the 129 strain would be identical
to that observed in the FVB-Tgkd strain. However additional strain specific alleles on
chromosome 6 also are required for OT development. Hence, the effect of Tgkd on Inpp4b levels
and its effects on the PI3K/AKT pathway were examined in 129 ES cells with the Tgkd
transgene (129-Tgkd ES cells) and these effects were considered similar to that observed in FVB-
Tgkd ES cells.
To develop 129 wildtype, hemizygous and homozygous Tgkd ES cell lines, I set up the
following crosses to obtain blastocysts for ES cell derivation (Table 6). About 40% of the
blastocysts collected from matings gave rise to ES cell lines. Homozygous Tgkd (Tgkd/Tgkd) ES
cell lines could be derived from a cross between a hemizygous 129-Tgkd female and 129-Tgkd
male (Table 6). The homozygous Tgkd lines were obtained at a lower frequency as
approximately 1 out of 4 ES cell lines derived from the above cross were Tgkd/Tgkd lines
according to Mendelian ratios. Further I could derive hemizygous Tgkd lines that inherit the
transgene maternally (Tgkd(m)/+) or paternally (Tgkd(p)/+), thereby altering the methylation
state of Tgkd in the ES cell lines (Table 6). 129 wildtype lines were derived from 129 blastocysts
obtained from all the above crosses.
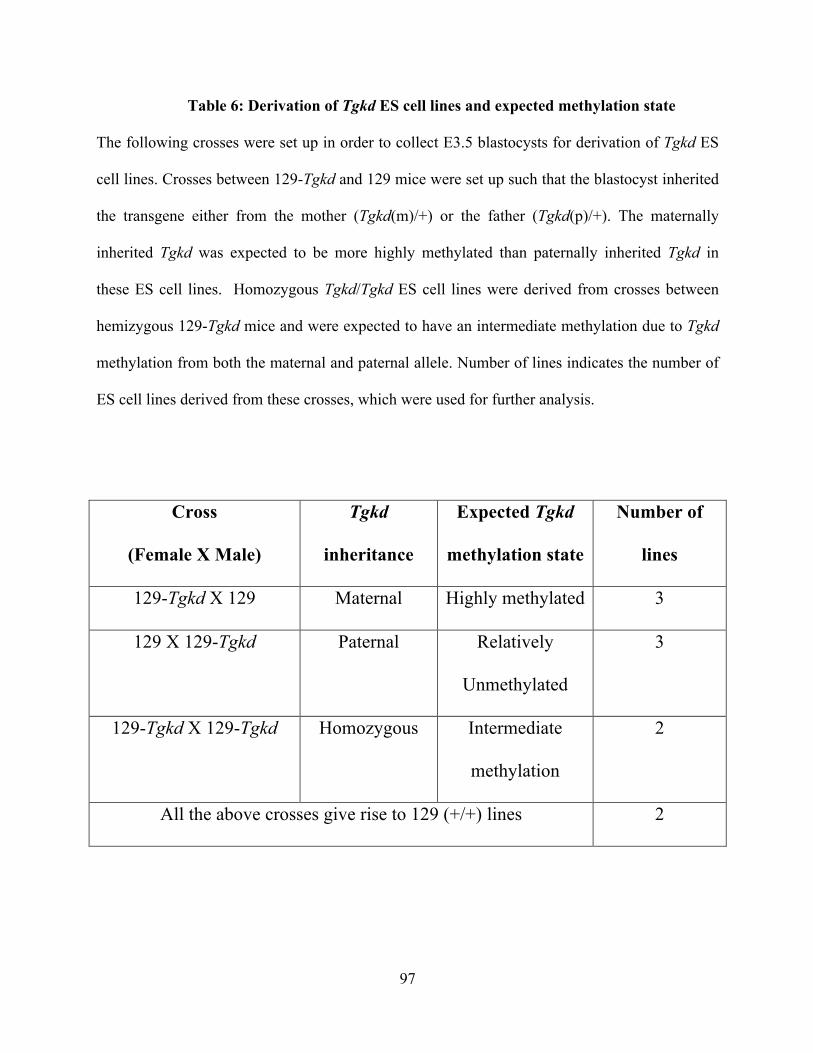
97
Table 6: Derivation of Tgkd ES cell lines and expected methylation state
The following crosses were set up in order to collect E3.5 blastocysts for derivation of Tgkd ES
cell lines. Crosses between 129-Tgkd and 129 mice were set up such that the blastocyst inherited
the transgene either from the mother (Tgkd(m)/+) or the father (Tgkd(p)/+). The maternally
inherited Tgkd was expected to be more highly methylated than paternally inherited Tgkd in
these ES cell lines. Homozygous Tgkd/Tgkd ES cell lines were derived from crosses between
hemizygous 129-Tgkd mice and were expected to have an intermediate methylation due to Tgkd
methylation from both the maternal and paternal allele. Number of lines indicates the number of
ES cell lines derived from these crosses, which were used for further analysis.
Cross
(Female X Male)
Tgkd
inheritance
Expected Tgkd
methylation state
Number of
lines
129-Tgkd X 129 Maternal Highly methylated 3
129 X 129-Tgkd Paternal Relatively
Unmethylated
3
129-Tgkd X 129-Tgkd Homozygous Intermediate
methylation
2
All the above crosses give rise to 129 (+/+) lines 2

98
The crosses detailed in Table 6 allowed us to derive ES cell lines to perform a 4-way
comparison analysis between +/+, Tgkd(m)/+, Tgkd(p)/+ and Tgkd/Tgkd ES cell lines. This
allowed me to study the effect of Tgkd methylation on Inpp4b levels and on the PI3K/AKT
pathway. Furthermore the derivation of the homozygous Tgkd/Tgkd ES cell lines helped me
analyze whether 2 copies of Tgkd had a larger effect on Inpp4b suppression and on the
PI3K/AKT pathway, as observed in Tgkd/Tgkd E13.5 brains (Figure 19). I derived 3 Tgkd(m)/+,
3 Tgkd (p)/+ and 2 Tgkd/Tgkd ES cell lines from the above crosses (Table 6). Several wildtype
lines were obtained from all 3 crosses out of which 2 lines were used for further analysis.
The ES cell lines were genotyped by the PCR assay described in Figure 7B and a
representative genotyping assay from the ES cell lines is depicted in Figure 20A. The wildtype
band is absent in homozygous Tgkd/Tgkd ES cell lines (Lane 1,2 - Figure 20A) while
hemizygous Tgkd lines have a wildtype and a Tgkd PCR band (Lane 3-16 - Figure 20A).
Maternal and paternal inheritance of Tgkd cannot be distinguished in the PCR genotyping of
hemizygous Tgkd ES cell lines (Lane 3-16 - Figure 20A). The Tgkd PCR product was absent in
wildtype ES cell lines (Data not shown).
After derivation of the 4 groups of ES cell lines, I wanted to first examine whether the
methylation status of the transgene Tgkd is maintained in the independently derived lines. Tgkd
is a maternally imprinted transgene and maternal imprints are established in the oocyte,
maintained in the early embryo and undergo erasure only in the PGCs [100]. Therefore, I
expected the maternal Tgkd(m)/+ lines to possess higher Tgkd methylation than paternal
Tgkd(p)/+ lines and Tgkd/Tgkd lines to depict intermediate levels of Tgkd methylation (Table 6).
However, on examining the levels of Tgkd methylation using Southern blot analysis, I found that
independently derived Tgkd lines of the same category depicted a wide range of Tgkd

99
methylation (Figure 20B). The upper band in the Southern blot in Figure 20B indicates
methylated Tgkd band (M), while the lower band constitutes the unmethylated Tgkd band (UM).
The extent of Tgkd methylation was determined in each of the ES cell lines by calculating a
methylation (M/UM) ratio by dividing the signal from the methylated band by the unmethylated
band. I expected a highly methylated Tgkd transgene to have ratio of greater than 1 and
unmethylated Tgkd to have a ratio much lower than 1. Homozygous Tgkd/Tgkd lines were
expected to show a ratio close to 1 due to the contribution of the maternal and paternal copies of
Tgkd.
In the methylation analysis of the Tgkd ES cell lines, both of the homozygous Tgkd/Tgkd
lines showed vey high Tgkd methylation (Methylation Ratio=1.9 &1.4), which were very
different from the expected methylation ratio of 1 (Figure 20B). The 3 independently derived
maternal Tgkd(m)/+ lines depicted the highest range of variability in Tgkd methylation (Ratio
range = 0.4-3.2) with Tgkd(m)/+ lines depicting high Tgkd transgene methylation (Ratio=3.2),
intermediate Tgkd methylation (Ratio=1) and low levels of Tgkd methylation (Ratio=0.4) (Figure
20B). The paternal Tgkd(p)/+ lines showed variability in the levels of Tgkd methylation between
the 3 independently derived lines but all the lines showed low levels of Tgkd methylation (Ratio
range = 0.3-0.7) (Figure 20B).
In summary, independently derived Tgkd ES cell lines depicted a wide variation in Tgkd
transgene methylation, which did not depend on the parental inheritance of the transgene. The
process of in vitro ES cell derivation from the inner cell mass may have led to an instability in
the maintenance of Tgkd methylation. ES cells are able to survive in the undifferentiated state
with very low levels of genomic DNA methylation [114]. This ability to survive in the absence
of proper genomic imprints may have removed the selection pressure for appropriate Tgkd

100
methylation. Further factors in the ES cell media, which maintain the undifferentiated state could
affect the levels of Tgkd transgene methylation.

101
w t w t w t w t w t w t w t w t
Tgkd/Tgkd
Tgkd/+
ES lines
A
BTgkd/Tgkd
Tgkd(m
)/+
Tgkd(p
)/+
1.9 1.4 3.2 1.0 0.4 0.3 0.5 0.7
12kb
5kb
M
UM
MUM
Figure 20: PCR genotyping of ES cell lines and maintenance of Tgkd methylation
ES cell lines were established from matings described in Table 6 to derive homozygous
(Tgkd/Tgkd), hemizygous (Tgkd/+) and wildtype (+/+) ES cell lines. Panel (A) describes the PCR
genotyping procedure used to assay for Tgkd/Tgkd and Tgkd/+ ES cell lines. w - PCR band
obtained for the wiltype allele in the absence of the Tgkd insertion and t –Tgkd transgene PCR
product. The wildtype (w) band is absent in homozygous (Tgkd/Tgkd) ES cell lines and the both
the wildtype (w) and Tgkd (t) band are present in hemizygous Tgkd/+ ES cell lines. (B) Southern
analysis on ES cell DNA digested with the methylation sensitive enzyme BstUI with the Ca

102
probe located in the Tgkd transgene (Described in methods section). M - Methylated Tgkd band
and UM - Unmethylated Tgkd band. M/UM ratio calculates extent of methylation by dividing the
signal from the methylated band to the unmethylated band. M/UM ratio for each ES cell lines is
indicated below the respective lane.
6.3 EFFECT OF Tgkd ON INPP4B IN ES CELLS
The methylation of the Tgkd transgene in the ES cell lines did not match the predicted pattern of
Tgkd methylation observed in somatic tissues. However I also wanted to determine the effect of
the Tgkd transgene on INPP4B levels in undifferentiated ES cells and whether the inheritance or
methylation of Tgkd affects INPP4B levels.
To study Tgkd induced effects on INPP4B levels, I compared INPP4B (I) protein levels,
normalized to the housekeeping gene Actin (A) between different groups of ES cell lines. I used
2 wildtype ES cell lines obtained during ES cell derivation and 1 previously available wildtype
ES line W9.5 as controls. I compared the levels of INPP4B (normalized to Actin) in the +/+ lines
to 3 Tgkd(m)/+, 3 Tgkd(p)/+ and 2 Tgkd/Tgkd ES cell lines (Figure 21A). The levels of INPP4B
were expressed as the fold change of expression relative to INPP4B levels in a single wildtype
ES cell lines generated in the experiment (Figure 21A, Lane 5, I/A=1) and statistical significance
of differences in the ES cell lines was assessed by comparison to the same wildtype ES line.

103
The wildtype line W9.5 expressed very high levels of INPP4B compared to the other 2
wildtype lines derived in the experiment (I/A=3.7 fold compared to 1 & 1.3). The 3 independent
Tgkd(m)/+ lines showed decreased levels of INPP4B compared to all the wildtype lines, however
this difference was not statistically significant. The Tgkd(p)/+ lines however depicted widely
variable INPP4B levels (I/A=2.7 - 0.7) with 1 ES line upregulating INPP4B and the 2 other
Tgkd(p)/+ lines having decreased levels of INPP4B. The levels of INPP4B in the 2 homozygous
Tgkd/Tgkd ES cell lines derived in the experiment were different from each other (I/A=0.7 &
1.1) with only one of the Tgkd/Tgkd ES cell lines showing a significant decrease in levels of
INPP4B compared to the wildtype line (Figure 21A). These results led us to conclude that
INPP4B levels were variable even in independently derived wildtype ES cell lines, which did not
contain the Tgkd transgene. There was variation in INPP4B levels between Tgkd ES cell lines of
the same group in paternal Tgkd(p)/+ and homozygous (Tgkd/Tgkd) ES cell lines. INPP4B levels
seemed to be more similar between the maternal Tgkd(m)/+ lines; however, these lines represent
a small sample size (n=3) and variation in INPP4B levels might be present in additional lines.
Inpp4b transcript levels were also measured in the 4 groups of ES cell lines and the fold
changes in transcript levels are similar to INPP4B protein expression levels. Inpp4bα is the only
isoform of Inpp4b expressed in ES cells. The β isoform of Inpp4b could not be detected in ES
cells (Figure 21B).
In conclusion, the ES cell model cannot accurately map the effect of the Tgkd transgene
on INPP4B expression due to the wide variation in INPP4B levels independent of the transgene.
These differences did not correlate with the extent of ES cell Tgkd methylation (Figure 20B).
The reason for this wide variation in INPP4B levels in ES cells is not known. ES cell lines
mainly consist of undifferentiated cells but a small subset of ES cell undergo differentiation in

104
culture. This proportion of differentiated cells may differ from cell line to cell line and may
cause the variation in INPP4B levels. These results led us to conclude that ES cell lines were not
suitable as a model system to study the effect of the Tgkd transgene on the Inpp4b gene.
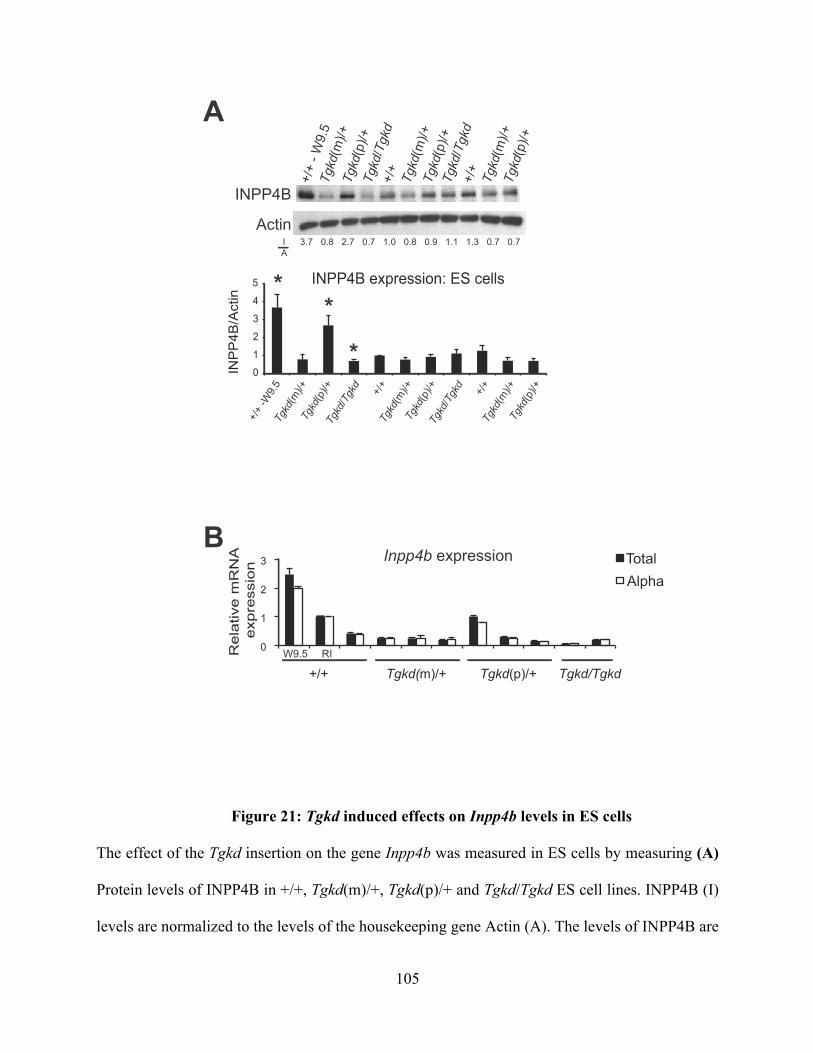
105
INPP4B
Actin
+/+
- W9.
5Tg
kd(m
)/+Tg
kd(p
)/+Tg
kd/T
gkd
+/+
Tgkd
(m)/+
Tgkd
(p)/+
Tgkd
/Tgk
d+/
+Tg
kd(m
)/+Tg
kd(p
)/+
0
1
2
3
4
5
INP
P4B
/Act
in INPP4B expression: ES cells
+/+
+/+
-W9.
5Tg
kd(m
)/+Tg
kd(p
)/+Tg
kd/T
gkd
Tgkd
/Tgk
d
Tgkd
(m)/+
Tgkd
(p)/+ +/+
Tgkd
(m)/+
Tgkd
(p)/+
**
*
3.7 0.8 2.7 0.7 1.0 0.8 0.9 1.1 1.3 0.7 0.7IA
0
1
2
3 Total Alpha
Inpp4b expression
Re
lativ
e m
RN
A
e
xpre
ssio
n
W9.5 RI
+/+ Tgkd(m)/+ Tgkd(p)/+ Tgkd/Tgkd
A
B
Figure 21: Tgkd induced effects on Inpp4b levels in ES cells
The effect of the Tgkd insertion on the gene Inpp4b was measured in ES cells by measuring (A)
Protein levels of INPP4B in +/+, Tgkd(m)/+, Tgkd(p)/+ and Tgkd/Tgkd ES cell lines. INPP4B (I)
levels are normalized to the levels of the housekeeping gene Actin (A). The levels of INPP4B are

106
represented relative to the INPP4B/Actin (I/A) ratio observed in the +/+ ES line in lane 5.
Immunoblot data is quantified in the graph below. * - p<0.05 (B) The levels of Inpp4b transcript
were also measured in the 4 groups of ES cell lines. The α isoform was the only Inpp4b isoform
present in ES cells. Inpp4b levels were normalized to the housekeeping gene TBP and fold
changes were expressed relative to the RI wildtype ES line.
6.4 EFFECT OF Tgkd ON PI3-KINASE/AKT ACTIVATION IN ES CELLS
The primary purpose for developing the Tgkd ES cell model was to evaluate Tgkd induced
effects on INPP4B levels and the regulation of PI3K/AKT signaling. On checking the levels of
INPP4B in wildtype, hemizygous and homozygous Tgkd ES cells lines, I found that the levels of
INPP4B were highly variable between lines of the same group and there was no consistent effect
of the Tgkd transgene on INPP4B in any group. However I still wanted to evaluate whether
changes in the levels of INPP4B observed are sufficient to alter the kinetics of PI3K/AKT
pathway in these ES cell lines.
The activation kinetics of the pathway was measured using a well-established protocol of
serum starvation for 34 hours followed by stimulation with IGF1 for indicated time points [115].
Activation of the pathway was quantified through phosphorylation of the AKT1 protein
measured by ELISA and normalized to the total levels of AKT1 in each ES cell lines. AKT1 is
the main isoform expressed in ES cell lines with minimal expression of AKT2 and AKT3.
107
Therefore, we assumed AKT1 phosphorylation represented all, or the majority, of AKT
phosphorylation in ES cells [116].
The first 4 ES cell lines in Figure 21A represent lines with the expected INPP4B levels
based on the E13.5 embryo data. The maternal Tgkd(m)/+ (I/A=0.8) and homozygous Tgkd/Tgkd
(I/A=0.7) ES line have lower levels of INPP4B compared to the wildtype W9.5 (I/A=3.7) and
paternal Tgkd(p)/+ ES line (I/A=2.7). I used these lines in the preliminary experiment to assess
whether the alterations in INPP4B levels affect AKT phosphorylation in ES cell lines.
On stimulating the ES cell lines with IGF1 after 34 hours of serum starvation, an increase
in the level of AKT1 phosphorylation (PAKT1/AKT1) was observed in all 4 ES cell lines, which
peaked at about 30 minutes after IGF1 stimulation (Figure 22). The levels of AKT1
phosphorylation remained steady and began to decline after 90 minutes of IGF1 stimulation.
However, I observed no differences in the kinetics of AKT phosphorylation at any time points
between the +/+, Tgkd(m)/+, Tgkd(p)/+ and Tgkd/Tgkd ES cell lines (Figure 22). The differences
in INPP4B levels between the various ES cell lines had no effect on the AKT activation kinetics
on IGF1 stimulation following serum starvation. The presence of the Tgkd transgene had no
significant effect on the regulation of the PI3K/AKT pathway in Tgkd ES cells.

108
0
2
4
6
8
10
0 10 20 30 40 60 90 120
P-A
KT1
/AK
T1
IGF1 stimulation (Min)
+/+ Tgkd(m)/+ Tgkd(p)/+ Tgkd/Tgkd
Figure 22: Kinetics of the PI3-Kinase/AKT pathway in Tgkd ES cell lines
Kinetics of AKT phosphorylation in +/+ (W9.5), Tgkd(m)/+, Tgkd(p)/+ and Tgkd/Tgkd ES cell
lines were during IGF1 stimulation following serum starvation of the ES cells. AKT
phosphorylation was represented as a PAKT1/AKT1 ratio. PAKT1 was the level of
phosphorylated AKT1 and AKT1 was the total level of AKT1 measured by ELISA.
109
6.5 ASSESSING THE RELEVANCE OF INPP4B IN ES CELLS
In the previous section, I found that the presence of the Tgkd transgene did not alter INPP4B
levels sufficiently enough to alter the activation kinetics of the PI3K/AKT pathway during IGF1
stimulation. These results could also indicate that the tumor suppressor Inpp4b is not a major
entity in controlling AKT1 phosphorylation in mouse ES cells. Other suppressors of the
PI3K/AKT pathway such as PTEN, SHIP1/2 or protein phosphastase PP2A could play a more
prominent role in ES cells [117, 118]. I decided to address this by examining PI3/AKT pathway
activation in ES cells during IGF1 stimulation after shRNA-mediated downregulation of Inpp4b.
To assess the effect of INPP4B on IGF1-induced signaling in ES cells, I electroporated 2
independent shRNA constructs to the Inpp4b gene and one control shRNA contruct into wildtype
RI ES cells. Electroporation led to stable integration of the constructs into ES cell genome and
stable clones were selected using puromycin selection. Both shRNA constructs to Inpp4b led to a
stable downregulation of the INPP4B protein to 50% of the levels measured in RI ES cells with
the shRNA control (Figure 23A). When the 3 ES cell lines were stimulated with IGF1 after 34
hours of serum starvation, the 2 ES cell lines with shRNA constructs to Inpp4b depicted a
significantly increased and prolonged phosphorylation of AKT1 (P-AKT1/AKT1) compared to
the control shRNA ES line (Figure 23B).
This result led me to conclude that Inpp4b was an important negative regulator of the
PI3K/AKT pathway in mouse ES cells as the shRNA mediated decrease of Inpp4b levels led to
an increase in AKT1 phosphorylation during IGF1 stimulation. The absence of AKT1
phosphorylation differences between Tgkd and wildtype ES cell lines could be due to the
adaption of the ES cell lines to changes in INPP4B levels during the process of ES cell
derivation, while the shRNA experiment involved a more sudden decrease in INPP4B levels
110
possibly not allowing for adaptation by other negative regulators of the PI3K/AKT pathway.
Further the shRNA-mediated downregulation of Inpp4b was performed in a single parent ES line
while the independently derived ES cell lines were more heterogeneous in nature. Mouse ES cell
lines requires an active PI3K/AKT pathway in order to maintain pluripotency, therefore
independent ES cell lines may have adapted during the process of derivation to be resist changes
in AKT1 phosphorylation [118]. In summary, the ES cell model may not be suitable to study the
effect of Tgkd on the PI3K/AKT pathway, even though INPP4B regulates AKT1
phosphorylation in mouse ES cells.
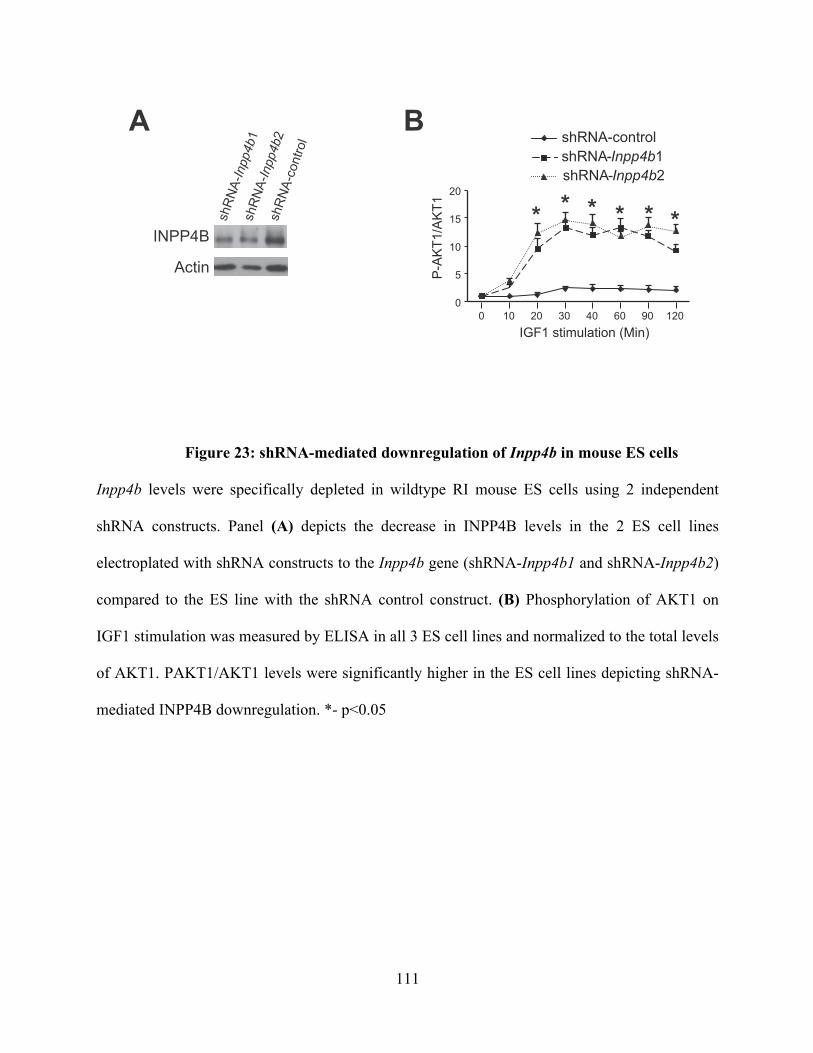
111
shR
NA-Inpp4b
2sh
RN
A-co
ntro
l
shR
NA-Inpp4b
1INPP4B
Actin
0
5
10
15
20
0 10 20 30 40 60 90 120
P-A
KT1
/AK
T1
IGF1 stimulation (Min)
shRNA-controlshRNA-Inpp4b1 shRNA-Inpp4b2
* * * * * *
BA
Figure 23: shRNA-mediated downregulation of Inpp4b in mouse ES cells
Inpp4b levels were specifically depleted in wildtype RI mouse ES cells using 2 independent
shRNA constructs. Panel (A) depicts the decrease in INPP4B levels in the 2 ES cell lines
electroplated with shRNA constructs to the Inpp4b gene (shRNA-Inpp4b1 and shRNA-Inpp4b2)
compared to the ES line with the shRNA control construct. (B) Phosphorylation of AKT1 on
IGF1 stimulation was measured by ELISA in all 3 ES cell lines and normalized to the total levels
of AKT1. PAKT1/AKT1 levels were significantly higher in the ES cell lines depicting shRNA-
mediated INPP4B downregulation. *- p<0.05

112
6.6 EFFECT OF Tgkd ON METHYLATION OF SURROUNDING GENES
The Tgkd transgene is inserted as multiple copies in head-head, tail-tail or head-tail orientation in
chromosome 8 (Figure 13). Therefore, the insertion of the methylated Tgkd transgene creates a
large area of CpG methylation on chromosome 8. This CpG methylation could cause large scale
epigenetic silencing through alterations of chromatin modifications in the region or cause CpG
methylation spreading on chromosome 8. As a preliminary study on the effect of Tgkd CpG
methylation, I decided to examine whether the methylated Tgkd transgene alters methylation of
CpG islands in a 2Mb region surrounding the insertion (Figure 24A).
I used the ES cell model for this methylation study and chose the heavily methylated
Tgkd(m)/+ (Figure 20B-Lane 3) ES line, the unmethylated Tgkd(p)/+ (Figure 20B-Lane 6) and
the wildtype RI ES line for this study. I analyzed the methylation of 10 CpG islands on
chromosome 8, which were identified by the program CpG island searcher in a 2Mb region
surrounding the Tgkd insertion (http://www.uscnorris.com/cpgislands2/cpg.aspx) (Figure 24A). I
analyzed the methylation status of these CpG islands using the HpaII-McrBC methylation-
sensitive PCR method [119] with minor modifications to the protocol. The genomic DNA from
these 3 ES cell lines was first digested with the restriction enzyme AseI, which was not present
in any of the CpG islands, to digest the genomic DNA into smaller fragments. One portion of the
AseI digested DNA was subsequently digested with the HpaII enzyme and the other with McrBC
enzyme followed by PCR amplification across the CpG island. HpaII is methylation sensitive
and cuts only unmethylated CpG islands at CCGG sites while McrBC digests methylated alleles
at RmCN40∼80RmC sites. Therefore, a completely methylated region would be digested only by
the McrBC enzyme and HpaII would fail to digest this region, hence amplification would be
successful only from the HpaII digested template (Figure 24B). Conversely a completely

113
unmethylated CpG island would be digested only with HpaII not McrBC resulting in PCR
amplification from the McrBC digested template. In principle the technique can distinguish
between 4 different kinds of CpG island methylation (Figure 24B). PCR amplification was
performed on just the AseI digested genomic DNA as a positive control and on AseI+MspI
digested DNA as a negative control. The enzyme MspI digests CpG rich regions at the site
CCGG irrespective of their methylation status. The Tgkd(m)/+, Tgkd(p)/+ and RI (+/+) ES cell
lines were analyzed for successful PCR amplifications after these enzymatic digests.

114
HpaII
digestion
McrBC
digestion
HpaII
digested DNA
McrBC
digested DNA
PCR product
- +
+ -
+ +
+/-+/-
B
Tgkd
Inpp4b Il15
Zfp330
Rnf150
Tbc1d9Usp38
Gab1
Smarca5
100kb
Chromosome 8
- CpG island
A
Figure 24: CpG islands examined by HpaII-McrBC PCR
The methylation state of each CpG island was analyzed by the HpaII-McrBC PCR. Panel (A)
indicates the position of each of the 10 CpG islands in a 1Mb region centromeric and a 1Mb
region telomeric of the Tgkd insertion. Schematic (B) illustrates the 4 possible methylation states
that can be distinguished by the HpaII-McrBC method and the amplification result in each case.

115
On examining the 10 CpG islands by the above method, I found that most CpG islands
(CpGi) were unmethylated in +/+, Tgkd(m)/+ and Tgkd(p)/+ ES cell lines (Figure 25). The CpG
island CpG9i had an unmethylated and a methylated allele according to the schematic in Figure
24B with an identical methylation pattern in all 3 ES cell lines. The CpG islands CpG5i and
CpG6i, which were closest to the Tgkd insertion also depicted a methylated and unmethylated
allele in the Tgkd(m)/+ and Tgkd(p)/+ ES cell lines (Figure 25). However these PCR reactions
did not work in the RI (+/+) ES cell line even in the control samples possibly due to SNP
differences in the region. However, since I did not see a difference in CpG island methylation
between the highly methylated Tgkd(m)/+ line and the relatively unmethylated Tgkd(p)/+ line in
the CpG islands closest to the insertion site, I concluded that the Tgkd transgene does not cause
aberrant methylation of unmethylated CpG islands surrounding the insertion site in ES cell lines.
The effect of Tgkd on surrounding genomic methylation may be different in different tissues.
Alternatively the Tgkd transgene may mediate transcriptional repression of the gene Inpp4b
through altered chromatin configuration or disruption of a distal enhancer.
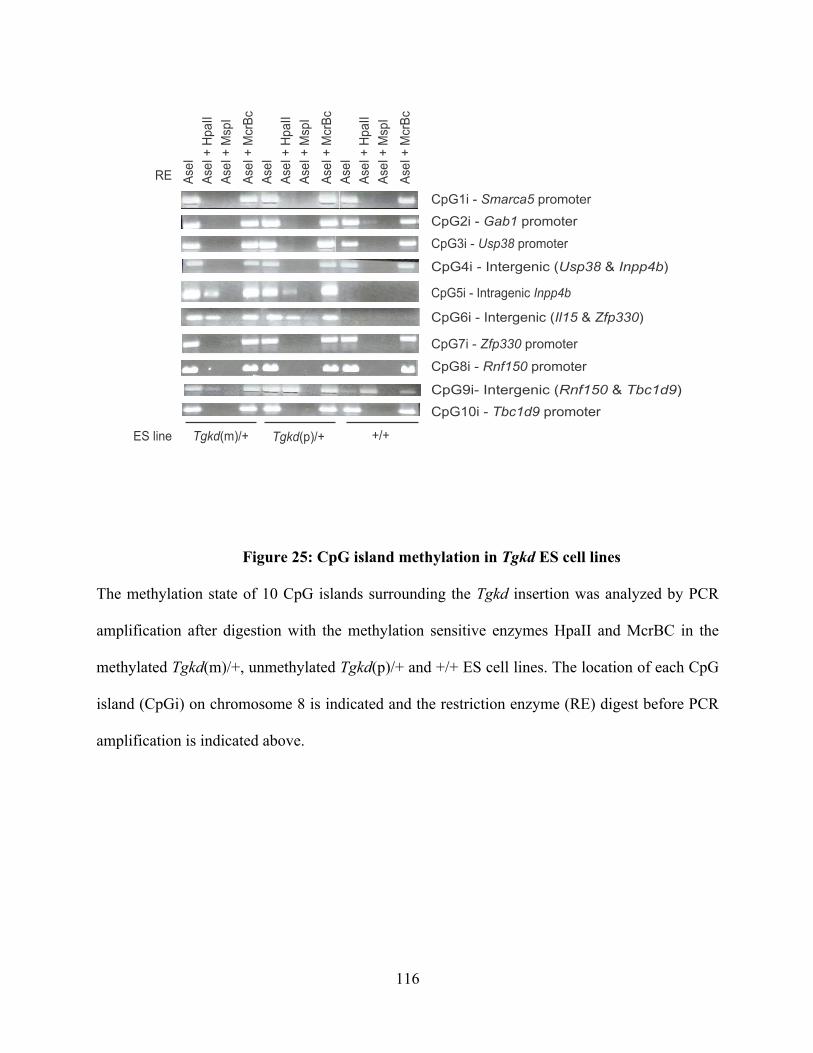
116
CpG1i - Smarca5 promoter
CpG2i - Gab1 promoter
CpG3i - Usp38 promoter
CpG4i - Intergenic (Usp38 & Inpp4b)
CpG5i - Intragenic Inpp4b
CpG6i - Intergenic (Il15 & Zfp330)
CpG7i - Zfp330 promoter
CpG8i - Rnf150 promoter
CpG9i- Intergenic (Rnf150 & Tbc1d9)
CpG10i - Tbc1d9 promoter
Ase
I
Ase
I +
Hp
aII
Ase
I +
Msp
I
Ase
I +
McrB
c
Ase
I
Ase
I +
Hp
aII
Ase
I +
Msp
I
Ase
I +
McrB
c
Ase
I
Ase
I +
Hp
aII
Ase
I +
Msp
I
Ase
I +
McrB
c
Tgkd(m)/+ Tgkd(p)/+ +/+ES line
RE
Figure 25: CpG island methylation in Tgkd ES cell lines
The methylation state of 10 CpG islands surrounding the Tgkd insertion was analyzed by PCR
amplification after digestion with the methylation sensitive enzymes HpaII and McrBC in the
methylated Tgkd(m)/+, unmethylated Tgkd(p)/+ and +/+ ES cell lines. The location of each CpG
island (CpGi) on chromosome 8 is indicated and the restriction enzyme (RE) digest before PCR
amplification is indicated above.

117
6.7 CONCLUSIONS
In the ES cell model to study Tgkd induced effects on Inpp4b, I managed to derive maternal,
paternal and homozygous Tgkd ES cell lines on the 129 strain background. The methylation of
the Tgkd transgene in these lines were not consistent between lines of the same genotype and did
not match the expected pattern of Tgkd methylation observed in somatic tissues. Further there
was a variation in INPP4B expression between independently derived ES cell lines, which did
not correlate with the presence or absence of the transgene. On analyzing PI3K/AKT activation
in wildtype and Tgkd ES cell lines, I found no significant changes in the kinetics of AKT
phosphorylation between wildtype, hemizygous and homozygous ES cell lines. shRNA mediated
downregulation of Inpp4b resulted in increased AKT phosphorylation in the +/+ RI ES line
indicating that a sudden and severe decrease in Inpp4b may be required to alter AKT activation
kinetics in ES cells. The insertion of the Tgkd transgene did not alter the methylation state of
CpG islands surrounding the transgene in Tgkd(m)/+ and Tgkd(p)/+ ES cell lines compared to
the wildtype line. In summary, Tgkd ES cells do not show a decrease in the level of INPP4B and
augmented effects on PI3K/AKT signaling following IGF1 stimulation.

118
7.0 EFFECT OF Tgkd TRANSGENE ON INPP4B AND DOWNSTREAM PI3-
KINASE/AKT PATHWAY IN TGKD OVARIES
7.1 AIMS OF THESE STUDIES
The results of the previous sections (Chapter 5) indicate that the Tgkd transgene causes
transcriptional suppression of the nearby gene Inpp4b leading to a decrease in the levels of
Inpp4b transcript and protein in embryonic FVB E13.5 Tgkd brains. I was unable to show a
consistent association between the Tgkd insertion and decreased INPP4B levels in mouse ES
cells and the alterations in INPP4B levels due to Tgkd did not affect PI3K/AKT signaling in ES
cells (Chapter 6).
Since OTs arise from mature oocytes in the ovary, which have completed meiosis I, we
decided to investigate the effect of the Tgkd transgene on the nearby inositol phosphatase Inpp4b
in FVB and FVB-Tgkd (Tgkd) ovaries. As described in chapter 4, Tgkd ovaries show defects in
follicular maturation (trapped oocytes) and a high rate of oocyte parthenogenesis. Therefore,
Tgkd induced effects on Inpp4b could be in Tgkd oocytes or in the surrounding somatic GCs of
the ovarian follicle or both. This led me to first examine Inpp4b expression in wildtype and Tgkd
oocytes and GCs. Further Inpp4b levels have been previously shown to be responsive to the
levels of androgens in prostate cancer cells, hence I examined whether Inpp4b levels in the ovary
were affected during gonadotrophin (FSH and LH) stimulation [112].

119
The PI3K/AKT pathway is an essential pathway in the ovary involved both in resumption
of oocyte meiosis and various steps of follicular maturation [41, 43, 44, 120]. As stated before,
INPP4B is a negative regulator of the PI3K/AKT pathway; therefore I examined the effect of the
Tgkd transgene on AKT phosphorylation and subsequent downstream steps of the pathway in
both GCs and oocytes. The functional consequences of the signaling alterations caused by the
Tgkd transgene were also studied, which could explain the follicular defects observed in Tgkd
ovaries. In summary, I worked to dissect out the molecular and signaling alterations in Tgkd
ovaries that could explain the route to OT formation.
7.2 INPP4B EXPRESSION IN THE OVARY
Since OTs were shown to arise from mature oocytes that have completed meiosis I, I first
examined the expression of INPP4B protein in MII oocytes that have completed meiosis I.
INPP4B protein expression could not be detected in wildtype (+/+, n=68) or Tgkd (Tgkd/+,
n=75) mature MII oocytes, whereas high levels of INPP4B were expressed in the adult mouse
brain (Figure 26A) (Experiment performed by Dr. M.C. Cirio). However, INPP4B expression
was detected in the ovary at numerous developmental stages in embryonic (E13.5, E16.5 and
E17.5) and adult ovary lysate (Figure 26B). These results suggested that Inpp4b may be
expressed and dysregulated at an earlier stage of oocyte development than the metaphase II stage
but oocytes need to complete meiosis I before OT formation. In the adult mouse ovary, oocytes
in different follicles (primordial versus antral) are at different stages of oocyte development.
Therefore, it difficult to isolate a pool of oocytes from the ovary from a single stage before
advanced stages of oogenesis. Alternatively Inpp4b may not be expressed in oocytes at any stage

120
and may be expressed in other ovarian cells, which promote OT formation through paracrine
mechanisms.
INPP4B
Oocytes
Brain
+/+
Tgkd/+
N 75 68
+/+
INPP4B
+/+ Ovaries
Adult
d13.5
d16.5
d17.5
A B
Figure 26: INPP4B expression in the ovary
INPP4B expression was examined in (A) Wildtype (+/+) and Tgkd MII oocytes. Adult brain
lysate was used as a positive control for INPP4B expression. N= number of oocytes. (B) Total
ovary lysates from embryonic (E13.5, E16.5 and E17.5) and adult ovaries in wildtype females.
INPP4B expression was seen in total ovary lysates but not in MII oocytes.

121
To sample Inpp4b expression in oocytes at several follicular stages, RNA in situ
hybridization (ISH) was used to determine the location of Inpp4b transcripts in the adult ovary.
This adult mammalian ovary contains follicles of all stages within the ovary; therefore RNA ISH
of ovarian sections would enable identification of the specific developmental stage and ovarian
cells with Inpp4b expression.
RNA ISH experiments on adult ovaries from 7-week old females showed that Inpp4bα,
but not the Inpp4bβ isoform was expressed in the ovary and this expression was confined to the
GCs of the ovary (Figure 27). No expression was observed in oocytes at any stage of ovarian
follicle development. These findings were confirmed in measurements of individual Inpp4b
transcripts by real-time PCR in GCs and oocytes from PD30 wildtype and Tgkd mice (Figure
28). The surprising finding that ovarian Inpp4b expression is confined to GCs raises the
possibility that the Tgkd insertion facilitates OT formation primarily by altering INPP4B
expression in GCs, which in turn alters follicular development and possibly normal GC-oocyte
interactions.

122
Inpp4b
Inpp4b
Slc39a10
Inpp4b
Inpp4b
Inpp4b

123
Figure 27: Inpp4b expression in the adult wildtype ovary
Inpp4b α and β isoform expression in the ovarian follicle was measured by in situ hybridization
in 7-week old wildtype ovaries. Top right panel: Oocyte specific probe: Slc39a10 to depict
oocyte specific staining. Lower right panel: Small Intestine as positive control for Inpp4bβ
probe. Other panels: Inpp4bα and Inpp4bβ isoform expression in ovarian follicles.
0
0.2
0.4
0.6
0.8
1
1.2
Rel
ativ
e m
RN
A +/+ oocytes Tgkd/+ oocytes +/+ GCs Tgkd/+ GCs
Total
Alpha
Beta
UD UDUD
Inpp4b expression
expr
essi
on
Figure 28: Inpp4b expression in oocyte and GCs of PD30 ovaries
Real-time PCR quantitation of Inpp4b in GCs and oocytes isolated from PD30 wildtype and
Tgkd ovaries. Inpp4b levels were normalized to the housekeeping gene TBP. Fold changes was
expressed relative to wildtype Inpp4b levels in GCs. UD – Undetected.

124
7.3 REGULATION OF INPP4B IN Tgkd OVARIES DURING GONADOTROPHIN
STIMULATION
Inpp4b is expressed primarily in the GCs of the ovarian follicle. With this result in hand, we
hypothesized that Tgkd induced effects on Inpp4b levels in GCs during follicular maturation may
lead to the maturation defects such as trapped oocytes. Inpp4b expression is known to be induced
by the androgen receptor in prostate cancer cells [112]. Therefore, I wanted to evaluate whether
Inpp4b levels vary during female gonadotrophin stimulation with FSH (PMSG) and LH (HCG).
For these reasons, the effect of Tgkd on Inpp4b levels was examined in ovarian cells
exposed to hormonal stimuli. Inpp4bα is the only isoform expressed in the ovary (Figure 27
&28). No difference in expression of Inpp4b was observed between immature PD23 wildtype
and Tgkd ovaries (Figure 29A). Synchronized in vivo maturation of wildtype and Tgkd ovarian
follicles was initiated with gonadotrophins (one-time IP injection of PMSG), followed by
induction of ovulation with a one-time injection of HCG. Levels of Inpp4b transcript in wildtype
mice fluctuated over the 48-hour time course of PMSG stimulation and 2 hours of HCG
stimulation. The Tgkd ovaries show a 20% decrease in the level of Inpp4b transcript compared
to the wildtype mice at 24 and 38 hours after PMSG stimulation (Figure 29A). A slightly larger
difference was seen between wildtype and Tgkd ovaries 48 hours after PMSG stimulation, where
Tgkd ovaries expressed 70% of wildtype levels of Inpp4b.
The Tgkd transgene also affected levels of ovarian INPP4B protein. INPP4B levels in
lysates of whole ovaries fluctuated slightly during the time course of PMSG stimulation. Tgkd
ovaries expressed approximately 70% of wildtype levels at 14 (p<0.05) and 24 hours after
PMSG stimulation (Figure 29B). The largest difference, a 50% decrease of INPP4B in Tgkd
ovaries (p<0.05), was recorded 38 hours after PMSG stimulation (Figure 29B). At other time

125
points during PMSG stimulation, the levels of INPP4B were comparable in wildtype and Tgkd
mice. I did not examine INPP4B levels in wildtype and Tgkd ovaries after HCG stimulation, as
no differences were observed in Inpp4b transcript levels (Figure 29A).

126
0.4
0.6
0.8
1
1.2
1.4
PD23 14 24 38 48 1 2
+/+ ovaries
Tgkd/+ ovaries
PMSG(Hr) HCG(Hr)
*
A
Rela
tive m
RN
A
expre
ssio
n
0
0.5
1
1.5
2
PD23 14 24 38 48
+/+ ovaries
Tgkd/+ ovaries
+/+ Tgkd
/++/+ Tgkd
/++/+ Tgkd
/++/+ Tgkd
/++/+ Tgkd
/+
PMSG(Hr)
PD23 14 24 38 48
B
*
PMSG(Hr)
INPP4B
AKT
INP
P4B
/AK
T *
Figure 29: Inpp4b transcript and protein levels in wildtype and Tgkd ovaries
(A) Real-time PCR quantitation of Inpp4b (Inpp4bα) in wildtype and Tgkd ovaries during the
time course of PMSG and HCG stimulation (n>3 mice/time point). Inpp4b levels were
normalized to the housekeeping gene GUSB and fold changes were expressed relative to

127
wildtype PD23 ovaries. (B) INPP4B protein levels in wildtype and Tgkd ovaries during PMSG
stimulation (n=3). *-p<0.05.
A more pronounced effect of the transgene on INPP4B expression was observed in
purified and in-vitro cultured GCs. INPP4B was significantly downregulated to a higher extent
even in cultured unstimulated PD23 Tgkd GCs (70% of wildtype GCs) and following 10 minutes
of FSH administration (Figure 30A). This method of enriching for GCs excluded the ovarian
capsule and stroma, which expressed low levels of Inpp4b (Figure 30B and C). The levels of
INPP4B in the ovary after removal of GCs are similar in wildtype and Tgkd ovaries. These
results indicate that the Tgkd GCs have lower levels of INPP4B than wildtype GCs even in
immature PD23 ovaries. However during PMSG stimulation, there is extensive GC proliferation
causing the number of GCs to exponentially increase [14]. This proliferation dramatically
increases the contribution of GCs in the ovary lysate resulting in larger INPP4B differences
between wildtype and Tgkd ovaries under PMSG stimulation than in the immature PD23 state. In
summary, the Tgkd transgene causes decrease in INPP4B levels specifically in Tgkd GCs.

128
0
0.5
1
1.5
2
2.5
0 10 20 40
FSH(Min)
0 10 20 40 0 10 20 40
+/+ GCs Tgkd/+ GCs
FSH(Min)
INP
P4
B/A
KT
INPP4B
AKT
+/+ GCs
Tgkd/+ GCs **
B
+/+ Tgkd
/++/+ Tgkd
/+
INPP4B
AKT
C
A
Figure 30: INPP4B expression in wildtype and Tgkd GCs
INPP4B levels were specifically measured in GCs to exclude the low levels expressed in the
tunica and stroma of the ovary (A) Measurement of INPP4B protein on enriching the GCs in
culture (n=3). * - p value <0.05. (B) Residual INPP4B expression in the tunica after removal of
129
the somatic follicle cells and oocytes. (C) Minimal expression of Inpp4b outside the ovarian
follicle.
7.4 REGULATION OF PI3-KINASE/AKT PATHWAY IN Tgkd OVARIES ON
GONADOTROPHIN STIMULATION
Inpp4b is a recently identified suppressor of the PI3K/AKT signal transduction pathway that has
not been studied previously in the ovary [111, 112, 121]. Inpp4b is an inositol-polyphosphate-4-
phosphatase, whose main substrate is phosphatidylinositol 3,4 bisphosphate (PI(3,4)P2), which
Inpp4b dephosphorylates to phosphatidylinositol-3-phosphate PI(3)P (Figure 31). Because
PI(3,4)P2 stimulates AKT phosphorylation, a decrease in Inpp4b levels has been linked to
increased AKT activation and the progression of breast, ovarian and prostate cancer [111, 112,
121]. Since Inpp4b is a suppressor of AKT phosphorylation, I decided to investigate whether the
Tgkd transgene alters the kinetics of AKT phosphorylation during gonadotrophin stimulation. I
also examined whether downstream components of the PI3K/AKT pathway were affected by the
decrease in INPP4B levels. The downstream signaling molecules of the PI3K/AKT pathway
were chosen based on their relevance to GC proliferation and follicular maturation described
previously in literature (Figure 31) [48, 122].

130
AKT AKT
FOXO1
FOXO1
FOXO1
PI(4,5)P2 PI(3,4,5)P3 PI(3,4)P2 PI(3)P
PI3K SHIP-1/2 INPP4B
P
P
P27 CyclinD2 E2F1
Degradation
Figure 31: Role of INPP4B in regulation of the PI3K/AKT pathway
The function of INPP4B in regulating AKT phosphorylation is depicted in the pathway. The
downstream signaling molecules affected by AKT phosphorylation, which were examined in the
ovary during gonadotrophin stimulaton are shown in the pathway diagram.
131
Whole ovaries were collected at different time points following in-vivo hormonal
stimulation, and the time course of phosphorylated AKT (P-AKT), an indication of PI3K/AKT
pathway activation, and its downstream effects were measured. P-AKT levels were roughly
similar in immature PD23 wildtype and Tgkd ovaries prior to administration of exogenous
hormones, but significant differences were evident following 14 and 24 hours of PMSG
stimulation (p<0.05) (Figure 32A; Quantified in Figure 32B). Corresponding differences in
levels of phosphorylated FOXO1 (P-FOXO1), a downstream target of P-AKT (Figure 31)
specifically in GCs, was also evident (Figure 32A&B) [122]. Time courses of changes in total
FOXO1, E2F1, CyclinD2 and P27 were similar between wildtype and Tgkd ovaries (Figure 32).
Following administration of a single dose of HCG 48 hours after PMSG stimulation, P-
AKT and P-FOXO1 concentrations declined at a much faster rate in Tgkd compared to wildtype
ovaries (Figure 33A; Quantified in Figure 33B). An accentuated rate of decline in the level of
FOXO1 and an accentuated rate of increase in CyclinD2 levels in Tgkd ovaries at specific time
points following HCG stimulation were also evident (Figure 33A). Time courses of changes in
E2F1, CyclinD2 and P27 were similar between wildtype and Tgkd ovaries (Figure 33A&B).
From these results, 2 types of Tgkd induced effects on the PI3K/AKT pathway were observed.
One is a proximal premature and increased phosphorylation of AKT and FOXO1 during PMSG
stimulation and a distal effect, where the AKT and FOXO1 phosphorylation are attenuated early
after HCG stimulation.
I conclude from these experiment that the presence of the Tgkd transgene 3’ of the
Inpp4b gene augments the response of mature ovarian follicles to stimuli known to mimic
endogenous ovulatory stimuli, leading to premature phosphorylation of the AKT protein and
activation of downstream effectors of the PI3K/AKT signaling pathway.

132
P-AKTAKT
P-FOXO1
FOXO1
E2F1CyclinD2
P27+/+ Ovaries Tgkd/+ Ovaries
PD23
14 24 38 48PMSG(Hr)
PD23
14 24 38 48PMSG(Hr)
A
0
0.4
0.8
1.2
P-A
KT/
AK
T
0
0.4
0.8
1.2
P-F
OX
O1/
AK
T
0
0.4
0.8
1.2
1.6
PD23 14 24 38 48
FOX
O1/
AK
T
PMSG(Hr)
0 0.4 0.8 1.2 1.6
2 E
2F1/
AK
T
0 0.4 0.8 1.2 1.6
2
Cyc
linD
2/A
KT
0
1
2
3
4
PD23 14 24 38 48
P27
/AK
T
PMSG(Hr)
B* *
* *
+/+ Tgkd/+
+/+ Tgkd/+
Figure 32: Activation of PI3K/AKT pathway in Tgkd ovaries on PMSG stimulation
(A) Dynamics of the PI3K/AKT pathway was measured in wildtype and Tgkd ovaries in
immature mice and on PMSG stimulation by investigating the levels of P-AKT, P-FOXO1,
FOXO1, E2F1, Cyclin D2 and P27 (ovaries from single female per lane). (B) Quantification of

133
P-AKT, P-FOXO1, FOXO1 E2F1, Cyclin D2 and P27 levels in wildtype and Tgkd ovaries on
PMSG stimulation (n=3 mice/time point). *- p<0.05

134
Tgkd/+ Ovaries+/+ OvariesPM
SG(4
8Hr)
HCG(Hr)1 2 8 PM
SG(4
8Hr)
1 2HCG(Hr)
P-AKT
AKT
P-FOXO1
FOXO1
E2F1
CyclinD2
P27
8
0
0.5
1
1.5
P-A
KT/
AK
T
0
0.5
1
1.5
2
0 1 2 8
FOX
O1/
AK
T
HCG(Hr)
0
0.5
1
1.5
P-F
OX
O1/
AK
T
0
1
2
3
E2F
1/A
KT
0 0.5
1 1.5
2 2.5
Cyc
linD
2/A
KT
0 0.5
1 1.5
2 2.5
P27
/AK
T
B
*
*
*
0 1 2 8 HCG(Hr)
+/+ Tgkd/+
+/+ Tgkd/+
A
135
Figure 33: Activation of PI3K/AKT pathway in Tgkd ovaries on HCG stimulation
(A) After 48 hours of PMSG stimulation; the mice were injected with HCG and the activation of
the PI3K/AKT pathway was measured in wildtype and Tgkd ovaries by investigating the levels
of P-AKT, P-FOXO1, FOXO1, E2F1, Cyclin D2 and P27 (ovaries from single female per lane).
(B) Quantification of P-AKT, P-FOXO1, FOXO1 E2F1, Cyclin D2 and P27 levels in wildtype
and Tgkd ovaries on HCG stimulation (n=3 mice/time point). *- p<0.05
The pattern of P-AKT activation following gonadotropin administration was then
investigated in wildtype and Tgkd oocytes. There was no difference in the P-AKT activation and
phosphorylation of its downstream target FOXO3A between wildtype and Tgkd oocytes during
the time course of gonadotrophin stimulation (Figure 34A). These findings are consistent with
the observed absence of Inpp4b expression in fully-grown oocytes (Figure 27&28). Collectively,
the observed effects of the Tgkd transgene on ovarian and oocyte AKT signaling are consistent
with effects of Tgkd on PI3K/AKT signaling in GCs.
To directly test this postulate, I obtained purified GC pools and stimulated them with
FSH. Tgkd GCs from PD23 ovaries had a lower level of INPP4B than wildtype GCs (Figure
30A). Tgkd GCs also had a slightly higher level of P-AKT and P-FOXO1 after overnight culture
in medium containing 10% FBS (Figure 34B, Quantified in Figure 34C). Tgkd GCs did not
show the decline in P-AKT levels seen in wildtype GCs after 40 minutes of FSH stimulation
(Figure 34B, Quantified in Figure 34C). These results indicate that the Tgkd transgene induced

136
decrease in INPP4B specifically in GCs is associated with hyperactivated PI3K/AKT activation
in GCs not oocytes.
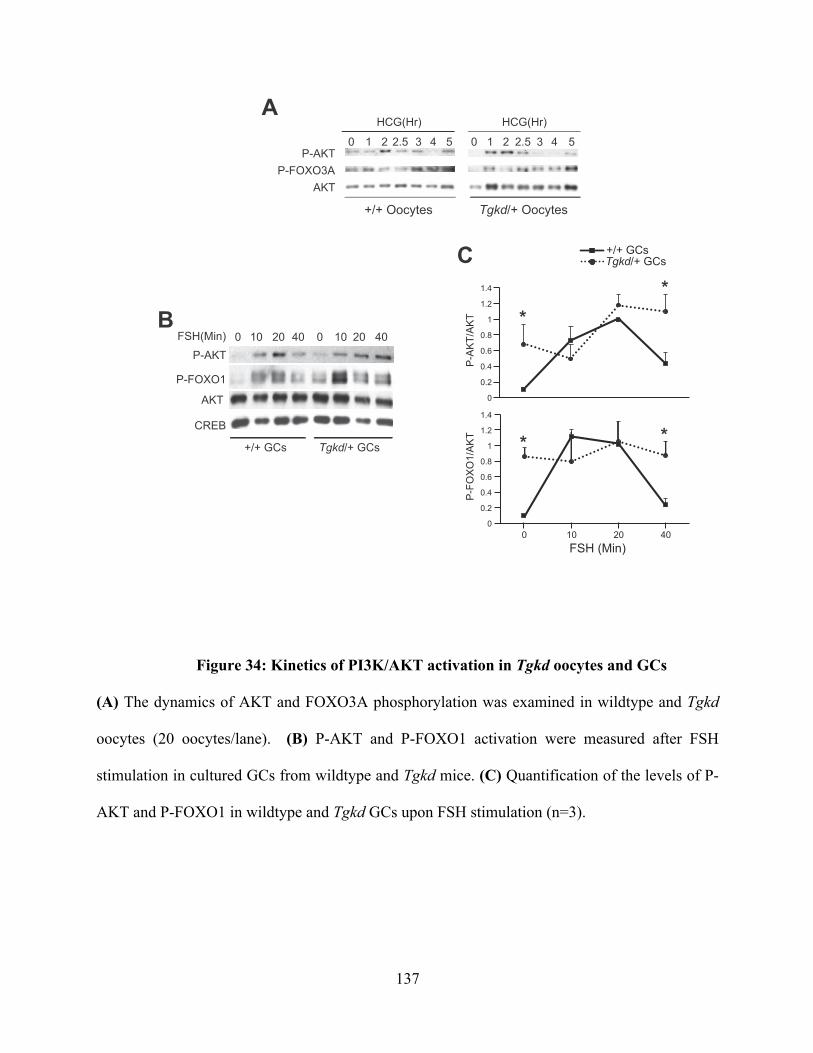
137
A
+/+ GCs Tgkd/+ GCs
P-AKT
P-FOXO1
AKT
CREB
FSH(Min) 0 10 20 40 0 10 20 40
0
0.2
0.4
0.6
0.8
1
1.2
1.4
P-A
KT/
AK
T
0
0.2
0.4
0.6
0.8
1
1.2
1.4
0 10 20 40
P-F
OX
O1/
AK
T
FSH (Min)
**
* *
+/+ GCs Tgkd/+ GCs
B
+/+ Oocytes Tgkd/+ Oocytes
P-AKTP-FOXO3A
AKT
1 2 2.5 3 4 5
HCG(Hr)
1 2 2.5 3 4 5
HCG(Hr)
00
C
Figure 34: Kinetics of PI3K/AKT activation in Tgkd oocytes and GCs
(A) The dynamics of AKT and FOXO3A phosphorylation was examined in wildtype and Tgkd
oocytes (20 oocytes/lane). (B) P-AKT and P-FOXO1 activation were measured after FSH
stimulation in cultured GCs from wildtype and Tgkd mice. (C) Quantification of the levels of P-
AKT and P-FOXO1 in wildtype and Tgkd GCs upon FSH stimulation (n=3).

138
I independently investigated this inverse relationship between INPP4B levels and AKT
pathway activation in GCs infected with lentiviruses expressing shRNAs to the mouse Inpp4b
gene. Two independent shRNA constructs were used, and expression of both constructs resulted
in 50% reduction in the levels of INPP4B compared to control uninfected wildtype GCs (Figure
35). Corresponding increases in the levels of P-AKT and P-FOXO1 were seen prior to and 40
minutes after FSH administration (Figure 35). These results confirm the inverse relationship
between INPP4B and PI3K/AKT signaling observed in Tgkd GCs. A decrease in INPP4B due to
the Tgkd insertion is associated with augmented effects on PI3K/AKT signaling in GCs
following gonadotrophin stimulation.
FSH(Min) 0 0 040 40 40INPP4B
P-AKT
P-FOXO1
AKT
CREB No Virus
shRNA-Inpp4b1
shRNA-Inpp4b2
Figure 35: shRNA-mediated downregulation of INPP4B in wildtype GCs
Lentiviral mediated shRNA downregulation of Inpp4b in wildtype GCs led to increased levels of
AKT and FOXO1 phosphorylation before and after 40 minutes of FSH stimulation similar to that
observed in Tgkd GCs (n=3).

139
7.5 FUNCTIONAL CONSEQUENCES OF HYPERACTIVATION OF PI3-
KINASE/AKT SIGNALING IN Tgkd OVARIES
The results of the previous section show that Tgkd GCs are associated with a decrease in INPP4B
levels and hyper-activated PI3K/AKT signaling. I wanted to investigate the functional
consequences of the signaling pathway alterations observed in GCs. Downstream effectors of
AKT activation have been shown to induce cell proliferation and block apoptosis [123]. There
was also a previous report, where the knockout of the mouse Pten gene specifically in GCs
caused an increase in the rate of GC proliferation and decrease in GC apoptosis [48].
Furthermore, the females with Pten-/- GCs showed defective clearance of corpora lutea causing
persistence of many non-functional corpora lutea after ovulation. Since Inpp4b is a negative
regulator of the PI3K/AKT pathway similar to Pten and the levels of P-AKT and downstream
targets FOXO1 and Cyclin D2 in the ovary were observed to be influenced by Tgkd (Figure
32&33), The rates of GC proliferation and apoptosis in preantral and antral follicles were
compared in Tgkd and wildtype female mice [48, 124]. I measured GC proliferation and
apoptosis in large preantral and antral follicles as these stages had defects in folliculogenesis in
Tgkd ovaries (Figure 8A) and these follicle stages were FSH dependent [8, 125].
The rate of GG proliferation was measured by using bromodeoxyuridine (BrdU) IHC as
proliferating cells in the S phase incorporate BrdU into the newly synthesized DNA. The number
of proliferating (BrdU+) GCs was divided by the total number of GCs in each ovarian follicle to
measure the percentage of proliferating cells in each follicle. There was a significant 1.8-fold
increase in the rate of GC proliferation in PD30 Tgkd ovaries compared to wildtype ovaries
(Figure 36).

140
I also measured apoptosis in Tgkd GCs as apoptosis plays a major role in follicular
selection and atresia, and FOXO1 is a pro-apoptotic protein that is affected in Tgkd GCs [126].
Apoptosis was measured by activated or cleaved caspase-3 (CC3 staining), which is activated in
cells during early stages of apoptosis and the number of apoptotic (CC3+) GCs was divided by
the total number of GCs per follicle to measure the percentage of apoptotic cells in each follicle.
The rate of apoptosis in Tgkd GCs was also significantly reduced to approximately 50% of the
rate seen in wildtype ovaries at 2 hours after HCG stimulation (Figure 37).
0
10
20
30
40
+/+ Tgkd/+
*B
rdU
-pos
itive
Tota
l no.
of c
ells
(%)
+/+ Tgkd/+
Figure 36: Comparison of GC proliferation in wildtype and Tgkd ovaries
Representation and quantification of rate of GC proliferation in PD30 wildtype and Tgkd
follicles measured by bromodeoxyuridine (BrdU) staining (n=25 follicles). * - p value <0.05.

141
0
5
10
15
20
+/+ Tgkd/+
*
CC
3-po
sitiv
eTo
tal n
o. o
f cel
ls(%
)
+/+ Tgkd/+
Figure 37: Comparison of apoptosis in wildtype and Tgkd ovaries
Quantification of rate of GC apoptosis in wildtype and Tgkd follicles measured by Cleaved
Caspase 3 (CC3) staining (n=25 follicles). Apoptosis was measured after hormonal stimulation
of PD23 wildtype and Tgkd mice with PMSG for 48 hours followed by HCG for 2 hours. * - p
value <0.05.
In mice with Pten-/- GCs, the ovaries showed an abundance of corpora lutea due to
defective clearance and persistence of non-functional corpora lutea, which did not express the
LH receptor [48]. To examine the lifespan of the corpora lutea in the Pten-/- GC model, the
authors injected immature PD23 mice with a superovulatory regime of PMSG for 48 hours
followed by a one-time injection of HCG to induce synchronized follicle maturation, ovulation
and corpora lutea formation. The study showed that while corpora lutea was present in both sets
of ovaries after 4 days of HCG stimulation, the corpora lutea persisted in the ovaries with Pten-/-
GCs after 7 days of HCG stimulation when corpora lutea had disappeared in wildtype ovaries

142
[48]. Since Inpp4b is a negative regulator of PI3K/AKT signaling similar to the Pten gene, I
hypothesized that the decrease in INPP4B levels in Tgkd GCs could affect the rate of corpus
luteum clearance.
To determine Tgkd effects on clearance of corpora lutea, the same superovulatory
regimen was followed by injecting PD23 immature mice with PMSG for 48 hours followed by a
single dose of HCG. On examining the ovaries of wildtype and Tgkd mice 7 days after HCG
injection, I found that both groups had regressing corpora lutea (*) of a similar small size (Figure
38). The rate of corpora lutea regression was similar in wildtype and Tgkd ovaries. The presence
of corpora lutea in wildtype FVB ovaries 7 days after HCG stimulation could be due to strain
specific differences as the mice with the Pten-/-GCs were on the B6 strain background. I
concluded from this experiment that there is no difference in the rate of corpora lutea clearance
between wildtype and Tgkd ovaries (Figure 38).
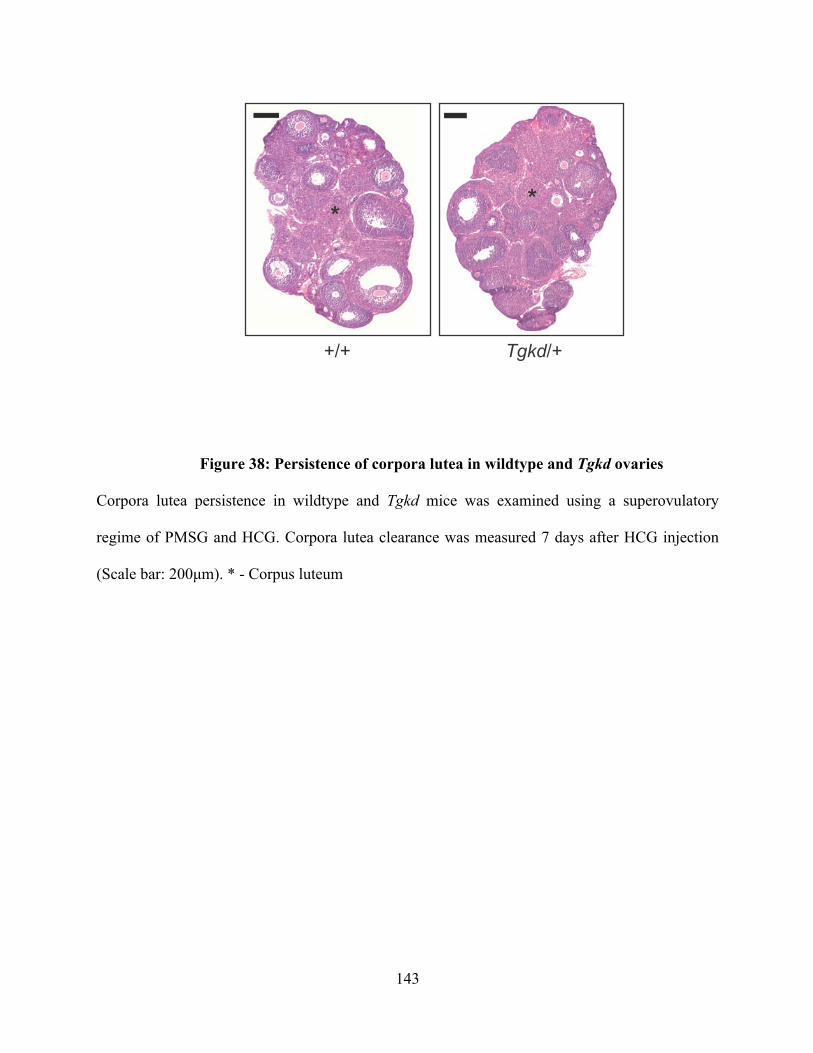
143
Tgkd/++/+
**
Figure 38: Persistence of corpora lutea in wildtype and Tgkd ovaries
Corpora lutea persistence in wildtype and Tgkd mice was examined using a superovulatory
regime of PMSG and HCG. Corpora lutea clearance was measured 7 days after HCG injection
(Scale bar: 200µm). * - Corpus luteum

144
One of the main changes observed between wildtype and Tgkd GCs in the PI3K/AKT
pathway was an increase in AKT and FOXO1 phosphorylation. FOXO1 is a pro-apoptotic
protein known to play a major role in GC apoptosis and follicle survival in the ovary [46, 48].
FOXO1 is primarily expressed in GCs of preantral and antral follicles but is undetectable in
luteal cells of fully developed corpus luteum [48, 83]. I wanted to examine whether the
alterations in FOXO1 phosphorylation and degradation in Tgkd GCs led to a mislocalization of
FOXO1 to different follicular stages than those observed in wildtype ovaries. On examining
wildtype and Tgkd postpubertal PD30 ovaries for FOXO1 expression, I found that FOXO1
localization was similar in wildtype and Tgkd PD30 ovaries. FOXO1 was localized in GCs of
preantral and antral follicles and completely absent in the luteal cells of the corpora lutea (Figure
39).
These results indicate that the hyperactivation of the PI3K/AKT pathway in Tgkd GCs
due to the decrease in INPP4B levels is associated with an increase in GC proliferation and a
decrease in GC apoptosis. The signaling changes in Tgkd GCs did not alter the rate of corpora
lutea clearance or cause mislocalization of the pro-apoptotic protein FOXO1.

145
+/+ +/+
Tgkd/+ Tgkd/+
*
Figure 39: FOXO1 localization in wildtype and Tgkd PD30 ovaries
FOXO1 localization in wildtype and Tgkd PD30 ovaries. FOXO1 is highly expressed in GCs of
preantral and antral follicles and absent in luteal cells. * - Corpus luteum with trapped oocyte.
146
7.6 CONCLUSIONS
In this chapter, I have demonstrated that Inpp4b is expressed in the GCs of the ovarian follicle
and not in the oocyte. The Tgkd transgene insertion is associated with reduced expression of
INPP4B in GCs. Tgkd ovaries depict enhanced activation of the PI3K/AKT pathway in terms of
increased phosphorylation of AKT and FOXO1, which is specific to Tgkd GCs not oocytes.
Increased activation of the PI3K/AKT pathway in Tgkd GCs is associated with an increase in
proliferation and decrease in apoptosis of GCs. Corpora lutea clearance and FOXO1 localization
was not affected in Tgkd GCs. The imbalance in the proliferation/apoptosis ration in GCs may
cause the follicular defects such as oocytes trapped within corpus lutea, which ultimately
promote ovarian teratoma formation [101].
147
8.0 DISCUSSION AND FUTURE DIRECTIONS
8.1 EFFECT OF THE Tgkd TRANSGENE ON OT DEVELOPMENT
In this study, I have established a link between PI3K/AKT signaling and OT development in
Tgkd mice by showing that lower levels of the inositol phosphatase Inpp4b in follicular GCs
leads to the development of OTs [101]. Specifically the results demonstrated that the insertion of
the Tgkd transgene 3’ of the Inpp4b gene results in a decrease in Inpp4b levels in GCs. This
decrease in INPP4B levels is associated with hyperactivation of the PI3K/AKT pathway during
gonadotrophin stimulation, which is reflected by an increase in AKT phosphorylation and
subsequent FOXO1 phosphorylation in Tgkd GCs. The hyperactivation of the PI3K/AKT
pathway is accompanied by an increase in proliferation and decrease in apoptosis in Tgkd GCs.
These changes lead to multiple defects in folliculogenesis in the ovary including an increase in
preantral follicles and premature appearance of corpora lutea in Tgkd mice. Moreover, a subset
of lutenized follicles in Tgkd ovaries contains mature oocytes trapped within them. The oocytes
of the FVB strain were found to have a high parthenogenetic activation rate, which is
independent of the Tgkd transgene. The OTs in Tgkd mice were independently verified to arise
from mature oocytes, which had completed meiosis I. These results led us to postulate that the
combination of luteinized unruptured follicles observed in the Tgkd strain resulting from Inpp4b

148
reduction in GCs and the high innate parthenogenetic activation rate of FVB oocytes predispose
Tgkd mice to OT formation.
8.2 INPP4B AND REGULATION OF PI3K/AKT PATHWAY
Inpp4b is a recently identified suppressor of the PI3K/AKT signal transduction pathway that has
not been studied previously in the ovary. Inpp4b is an inositol polyphosphate-4-phosphatase,
which was shown to catalyze the hydrolysis of the D4-position phosphate on
phosphatidylinositol PI(3,4)P2, inositol I(1,3,4)P3 and I(3,4)P2 [127, 128]. The enzyme INPP4B
was shown to have a much higher activity towards PI(3,4)P2 , which it degrades to PI(3)P [111,
129]. The lipids PI(3,4)P2 and PI(3,4,5)P3 promote activation of the PI3K/AKT pathway by
causing phosphorylation of the downstream protein AKT at the Serine-473 (Ser-473) and
Threonine-309 (Thr-309) positions respectively [130]. Therefore by decreasing the levels of
cellular PI(3,4)P2, Inpp4b acts as a negative regulator of AKT phosphorylation. A decrease in
Inpp4b has been previously shown to increase AKT phosphorylation in human mammary
epithelial cells (HMEC) and LNCaP prostate adenocarcinoma cells and Inpp4b loss has been
positively correlated with the progression of breast and prostate cancer [111, 112].
In this study I observed a decrease in Inpp4b levels in E13.5 brain and ovarian GCs from
Tgkd mice. The decrease in Tgkd E13.5 brains was higher in homozygous Tgkd/Tgkd brains and
a greater decrease of Inpp4b transcript levels was also detected in hemizygous Tgkd/+ brain by
allele specific expression studies on the chromosome 8 copy with the Tgkd transgene (Figure
16D, Figure 19). These data indicate that the effect of Tgkd on Inpp4b is a cis-acting effect. In
the ovary, Inpp4b was surprisingly not expressed in the oocytes that give rise to OTs, but was

149
expressed in follicular GCs. Inpp4b levels in wildtype GCs fluctuate during induced follicular
maturation by gonadotrophin stimulation similar to the protein PTEN, which is another well-
known suppressor of the PI3K/AKT pathway (Figure 31) [131]. The PI3K/AKT pathway plays
an extremely important role in follicular maturation. Hence, the levels of these regulators during
gonadotrophin stimulation may help orchestrate the kinetics of activation of AKT and other
downstream molecules during the different phases of follicular maturation. A decrease in Inpp4b
levels was observed in immature Tgkd GCs and this difference was more apparent in Tgkd
ovaries after PMSG stimulation. The Tgkd-induced Inpp4b decrease in ovaries may become
more evident after PMSG (FSH) gonadotrophin stimulation, as FSH induces exponential
proliferation in GCs increasing their cellular contribution to the ovary [15]. INPP4B levels in
Tgkd GCs were reduced to approximately 70% of wildtype levels (Figure 30A). This decrease
was associated with increased activation of AKT and its downstream target FOXO1 (Figure
34B). The consequence of Inpp4b downregulation was tested independently in wildtype GCs
using shRNA constructs to Inpp4b and found that a decrease in Inpp4b levels resulted in
increased AKT phosphorylation on FSH stimulation (Figure 35). These data collectively suggest
that Inpp4b is a gonadotrophin responsive gene and a decrease in Inpp4b levels alters the kinetics
of PI3K/AKT activation in Tgkd GCs.
8.3 ALTERED KINETICS OF THE PI3K/AKT PATHWAY LEADS TO OT
DEVELOPMENT
The decrease in Inpp4b is associated with enhanced activation of the PI3K/AKT pathway,
measured by increased phosphorylation of AKT and FOXO1 in Tgkd GCs. The PI3K/AKT

150
pathway is an essential signal transduction pathway in the ovary, involved in primordial follicle
recruitment and induction of many important FSH-mediated follicular maturation events
including GC proliferation, differentiation, cumulus cell expansion, and meiotic resumption of
oogenesis [15, 41-44, 120]. Studies of mouse PTEN, a better characterized suppressor of the
PI3K/AKT pathway than INPP4B, nicely illustrate the diverse cellular roles of this important
intracellular signaling pathway in the ovary. Ablation of the Pten gene in oocytes leads to
premature follicle recruitment and ovarian failure leading to infertility in early adulthood, while
loss of Pten in fully-grown oocytes has no effect on oocyte development or fertility [40, 132].
Deletion of both Pten alleles in GCs results in enhanced GC proliferation, decreased GC
apoptosis, persistence of multiple corpora lutea and unexpected increases in litter size [48].
These studies illustrate the cell and stage specific role of the PI3K/AKT pathway in the ovary.
Pten and Inpp4b suppress the PI3K/AKT pathway by degrading PI(3,4,5)P3 and PI(3,4)P2
respectively, the chief activators of AKT (Figure 31) [111, 128, 133]. Tgkd GCs with decreased
Inpp4b levels show a similar increase in proliferation and decrease in apoptosis to that observed
in GCs depleted of PTEN, but the rate of corpora lutea clearance in Tgkd ovaries was unaffected
by the decrease in Inpp4b levels (Figure 38).
Molecular events both upstream and downstream of follicular AKT activation have been
previously implicated in OT development. Forced expression of a constitutively active form of
the FSH receptor from a transgene (mFshrD580H) in GCs causes OTs in 20% of transgene carriers
and FSH receptor signaling is associated with activation of the PI3K/AKT pathway in a protein
kinase A (PKA) dependent manner [84, 134, 135]. Furthermore, a reduction in FOXO3A
activity, a downstream effect of increased AKT activation is associated with OT development
[81]. FOXO3A is primarily expressed in oocytes, not GCs and is phosphorylated by activated

151
AKT, causing its nuclear exclusion, degradation and loss of its transcriptional activation [83,
126]. Interestingly, a missense mutation in the mouse Foxo3a gene in the MommeR1 mouse
strain directly decreases its transcriptional activation, mimicking the effect of increased oocyte
PI3K/AKT pathway activity on FOXO3A, which causes one out of every six homozygous
mutant MommeR1 female mice to develop OTs [81]. In summary, the mFshrD580H and Tgkd
transgenes illustrate the relationship between hyperactivation of the GC PI3K/AKT pathway and
OT formation, while the MommeR1 strain illustrates the same relationship, but in oocytes.
8.4 EFFECT OF INPP4B LEVELS ON OT PHENOTYPE
Ovarian phenotypes appear to be exquisitely sensitive to the cell type and/or extent of
gene disruption. For example, whereas a decrease in Foxo3a activity in MommeR1 mice causes
OTs, complete loss of oocyte FOXO3A activity is associated with premature ovarian failure,
without the occurrence of OTs [81, 136]. Similarly, the level of ovarian transgene expression of
mFshrD580H correlates with the severity of the ovarian phenotype [84]. The studies in this thesis
indicate that a small decrease in GC INPP4B in Tgkd mice is sufficient to alter AKT activation
kinetics in GCs during hormonal stimulation, leading to a variety of abnormal ovarian
phenotypes including OTs. I have specifically observed that a 30% decrease in the levels of
tumor suppressor INPP4B can cause a 2-fold increase in P-AKT levels during certain time points
after PMSG stimulation. This data is in agreement with previous studies, where a 20% reduction
in the levels of tumor suppressor PTEN in mammary epithelial cells is sufficient to increase P-
AKT levels by 2-4 fold compared to Pten wildtype cells [137]. This data supports a continuum
model of tumor suppression, where small alterations in the level of tumor suppressors cause

152
larger downstream effects possibly by disturbing the homeostasis of the signaling pathway,
which causes associated secondary effects [138]. One can speculate that lesser or greater degrees
of INPP4B defects would produce a different and unique collection of abnormal ovarian
phenotypes, including ones that might preclude OT formation.
Recently an Inpp4b knockout mouse has been generated through the Cre mediated
deletion of exon 11 [139]. Adult Inpp4b-/- mice are reported to be viable and do not develop OTs
or spontaneous cancers, even though Inpp4b reduction has been previously linked to the etiology
of breast and prostate cancer [111, 112, 121]. Sustained loss of INPP4B in Inpp4b-/- mice may
have led to adaptation by other suppressors of the PI3K/AKT pathway. Further, the mechanism
by which the Tgkd transgene causes a decrease in Inpp4b levels is currently unknown. The
insertion could have disrupted an enhancer or changed local chromatin configuration, which
leads to sudden or cell-specific changes, preventing adaptation by other components of the
pathway. The insertion could have affected other genes on chromosome 8, but a preliminary
screen by allele specific expression analysis did not detect a decrease in transcript levels in genes
in a 2Mb region surrounding the Tgkd transgene. I also have not identified any sequence changes
in the body of the Tgkd-linked Inpp4b gene nor novel splice isoforms of Inpp4b mRNAs in
homozygous Tgkd E13.5 brains. I was able to correlate the decrease in Inpp4b levels with an
increase in phosphorylation of AKT, which reinforced the hypothesis that the Tgkd insertion
caused OT formation primarily by decreasing Inpp4b levels in GCs.
153
8.5 EFFECT OF Tgkd ON INPP4B IN THE ES CELL MODEL
To assess the effect of Tgkd on Inpp4b levels and on PI3K/AKT signaling, I initially developed
an ES cell model as in vitro cell culture system prior to focusing on studies in the ovary. In this
model, wide variability and no clear differences were observed in Tgkd methylation and INPP4B
levels between wildtype (+/+), hemizyogus and homozygous Tgkd ES cell lines derived on the
129 strain background (Figure 20B, Figure 21A). The kinetics of phosphorylation of AKT1 was
also not significantly different between wildtype and Tgkd ES cell lines on IGF1 stimulation
(Figure 22). This experiment led me to examine whether Inpp4b functioned as a suppressor in ES
cell lines by using shRNA-mediated downregulation of Inpp4b. Electroporation of shRNA
constructs to Inpp4b led to an increase in AKT1 phosphorylation on IGF1 stimulation, indicating
that Inpp4b acted as a PI3K/AKT pathway suppressor in ES cells (Figure 23). The absence of a
consistent effect of Tgkd on INPP4B levels and AKT phosphorylation in ES cells could be due to
a few reasons. Tgkd may not alter INPP4B levels in ES cells sufficiently to alter AKT
phosphorylation. ES cells require an activated PI3K/AKT pathway to maintain pluripotency;
hence they may compensate during the process of ES cell derivation and prevent alterations in
AKT phosphorylation [140]. The shRNA-mediated decrease in Inpp4b levels is induced in a
wildtype ES cell line after the derivation stage and is a more rapid change, which may prevent
compensatory alterations by other suppressors in the pathway. Further the shRNA experiment is
performed in a homogenous wildtype ES cell line, while innate differences among independently
derived wildtype and Tgkd ES cell lines are likely to be found. This led me to conclude that
independently derived wildtype and Tgkd ES cell lines do not serve as a good model to study the
effects of the transgene on Inpp4b and the PI3K/AKT pathway.

154
8.6 CELL AUTONOMOUS AND NON-AUTONOMOUS ORIGINS OF OTS
OT mouse models have provided a good insight into the pathways that contribute to OT
development. The genetic defects leading to OT formation could be cell autonomous confined to
the oocyte, or the OT could have a non-cell autonomous origin where the surrounding GCs in the
ovarian follicle provide an environment conducive to OT formation. The c-mos-/- and the
MommeR1 mice are considered cell autonomous models of OT, as both proteins are solely
expressed in the oocyte [82, 83]. OTs in the LT/Sv mice have been shown to have a cell
autonomous origin as oocytes in the LT/Sv related LTXBO strain show a high rate of
parthenogenetic activation in chimeric reaggregated ovaries, when LTXBO oocytes are
reaggregated with GCs from an OT non-permissive strain [141].
There are also other OT models that are considered non cell-autonomous OT models.
Constitutive signaling through FSH receptor (mFshrD580H) in GCs specifically, predispose the
oocytes towards OT formation [84]. A decrease in GC GATA4 leads to 10% of the mice
developing OTs [86]. Overexpression of anti-apoptotic protein Bcl-2 in GCs also leads to the
development of OTs [85]. These models indicate that in non-cell autonomous OT models, the
genetic modifications alter signaling pathways in the GCs, which disturb follicle maturation
driving the oocyte towards parthenogenesis and OT development.
The above results indicate that the primary defect in Tgkd ovaries is non-cell
autonomous, where a decrease in Inpp4b levels in Tgkd GCs is associated with signaling
alterations in the PI3K/AKT pathway and follicular defects such as oocytes trapped in corpora
lutea. Inpp4b is expressed only in GCs and not in oocytes, and the signaling alterations in the
PI3K/AKT pathway are confined to Tgkd GCs not oocytes. However OTs are not observed in all
mouse models with luteinized unruptured follicles [3]. A high rate of parthenogenetic activation

155
was observed in oocytes of the FVB strain, which is independent of the Tgkd insertion. Oocyte
parthenogenetic activation has been postulated to be necessary but not sufficient for OT
formation and the oocyte parthenogenesis rate of OT permissive strains such as the LT/SV strain
(18%) are reported to be higher than the OT non-permissive B6 strain (3%) [78]. The high
frequency of metaphase I arrested oocytes seen in the LT/Sv strain (90%) was not observed in
FVB (44%) or FVB-Tgkd (51%) oocytes [78]. These results indicate that the Tgkd OT model
has a non-cell autonomous component leading to trapped oocytes and a cell-autonomous
component of high oocyte parthenogenesis, both of which contribute to OT formation.
8.7 STRAIN SPECIFICITY OF THE OT PHENOTYPE
A common feature of many mouse strains developing OTs is the FVB strain background;
therefore, one must consider the possibility that these influences on OT development are
determined by FVB alleles of other genes. The Tgkd, mFshrD580H, Inhα-bcl2 and MommeR1
strains have been reported to develop OTs on the FVB background [81, 84, 85, 88]. OTs are not
observed in Tgkd females on the 129 background or in F1 (FVB-Tgkd X B6) females with the
Tgkd transgene (Table 3). Similarly, OTs have been reported to absent in MommeR1 compound
heterozygotes (FVB/129/B6) or MommeR1 mice backcrossed to the B6 strain for 10 generations
[81].
In this study, FVB oocytes were found to possess a high parthenogenetic activation rate,
which is required for OT formation (Figure 10) [78]. In this regard, an FVB-specific OT
modifier locus (Ots2) has been mapped to chromosome 6, within a region that overlaps a
previously mapped LT/Sv strain-specific OT modifier allele (Ots1) (Eicher et al., manuscript in

156
preparation, [79]. On crossing FVB-Tgkd mice to LT/Sv mice, F1 Tgkd females develop OTs at a
much higher frequency (90%) than either of the parent strains indicating that the Ots1 region and
Ots2 region may involve the same gene/genes which enhance oocyte parthenogenesis (Table 3)
[63, 88]. The effect of LT/Sv derived Ots1 appears to be much stronger than FVB Ots2 and the
frequency of the OT phenotype is further increased by Tgkd induced effects on Inpp4b on
chromosome 8. Identification of candidate genes within this region that contribute to the OT
phenotype would help better understand the multifactorial processes involved in the generation
of teratomas. The effect of the FVB strain background may also explain the lack of the OT
phenotype in the Inpp4b-/- mice, which were studied in the B6 strain background [139].
8.8 OT DEVELOPMENT IS A MULTIFACTORIAL PROCESS
OT formation has been linked to signaling defects in either oocytes or in the surrounding
follicular GCs. Other OT mouse models, particularly those with defects in GCs, share aspects of
Tgkd ovarian pathology. The intentional genetic defects in the mFshrD580H, Inhα-bcl2 and
siGata4 mouse lines are all confined to GCs [84-86]. Interestingly the mFshrD580H model shows
an increase in GC proliferation, while Inhα-bcl2 ovaries display a decrease in GC apoptosis.
Luteinized follicles containing trapped oocytes are seen in mFshrD580H mice [84]. All of these
processes are affected in female Tgkd mice, which have a high incidence of OTs, suggesting that
the collective influence of many altered follicular processes greatly enhances the likelihood of
OT formation.
Further FVB strain modifier alleles play a major role in promoting OT formation in Tgkd
mice and many other OT models [81, 84, 85, 88]. The FVB modifier locus has been mapped to a

157
region on chromosome 6 that overlaps with the previously characterized OT susceptibility locus
Ots1. This locus on chromosome 6 may promote oocyte parthenogenesis in OT susceptible
strains such as LT/Sv and FVB mice. High rates of metaphase I arrest and parthenogenetic
activation have been reported to be necessary but not sufficient for development of OTs [78].
The OT phenotype in both LT/Sv mice and Tgkd mice is clearly a polygenic trait with several
different developmental abnormalities contributing to OT development both in GCs and oocytes.
The Tgkd OT model serves as a valuable model to understand the etiology of OT development as
the insertion of the Tgkd transgene at a single site on chromosome 8 converts the OT-free FVB
females to OT-susceptible FVB-Tgkd females. Further, our studies are able to link the transgene
insertion with an effect on the nearby gene Inpp4b and the downstream PI3K/AKT pathway. I
was also able to establish a connection between altered GC proliferation and apoptosis and the
presence of luteinized unruptured follicles with OT development. In this model, hemizygous
Tgkd mice develop malignant OTs at a frequency of 15-20% by 12-22 weeks of age [88]. This
frequency may appear to be low compared to other OT mouse models such as the LT/Sv strain,
which are reported to develop OTs at a frequency of 50% by 3 months of age. However, the
LT/Sv strain is an inbred strain, which spontaneously develops OTs [63]. Several cell cycle
abnormalities have been reported in LT/Sv oocytes but the primary genetic lesions responsible
for OT formation are not known [53, 142, 143]. On the other hand, most OT models with a
defined single gene defect such as mFshrD580H, Inhα-bcl2, siGata4, MommeR1 and Tgkd mice
develop OTs a frequency between 10-20% [81, 84-86, 88].
On speculating on the mechanism of OT formation in the Tgkd strain, we can evaluate the
contribution of the cell (oocyte) and non-cell (GC) autonomous component of OT formation. The
effect of the decrease in GC INPP4B and associated increase in P-AKT levels may cause a

158
dramatic increase in the number of follicular GCs during the FSH/PMSG mediated follicular
growth phase. This increase in GC number may cause a delay or failure of antrum formation and
uncoupling of oocyte growth from ovarian follicle growth in a subset of recruited follicles.
Hence, the oocyte is unable to undergo successful ovulation from these follicles either due to the
structure of the overgrown follicle or due disruption of oocyte-GC communication. The follicle
is however competent for luteinization of GCs after the LH surge, hence forms a corpus luteum
after an unsuccessful ovulation. A subset of trapped oocytes in the FVB strain may initiate
parthenogenetic activation but may need to grow rapidly to form an OT before clearance of the
surrounding corpora lutea. Oocytes that initiate malignant OT development in the Tgkd strain
may possess this selective growth advantage and the increased activation of the PI3K/AKT
pathway may further accelerate this process.
In summary, altered regulation of the PI3K/AKT pathway caused by a decrease in
Inpp4b in Tgkd GCs during follicle maturation leads to a dramatic increase in the number of
GCs. This is associated with several follicular defects including oocytes trapped within
luteinized follicles. The trapped oocytes caused by the Tgkd transgene combined with the
parthenogenetic oocytes of the FVB strain predispose Tgkd mice to OT development (Figure 40).
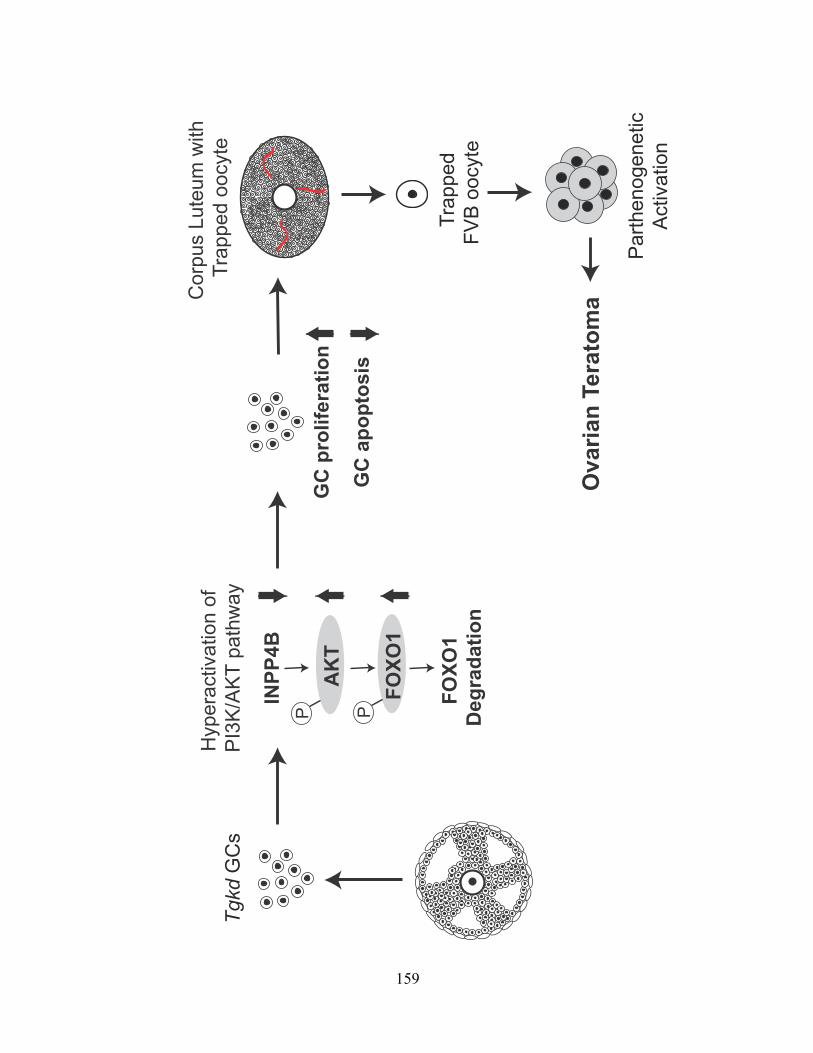
159
Co
rpu
s L
ute
um
with
Tra
pp
ed
oo
cyte
Tra
pp
ed
FV
B o
ocyte
Pa
rth
en
og
en
etic
Activa
tio
n
Ov
aria
n T
era
tom
a
Hyp
era
ctiva
tio
n o
f
PI3
K/A
KT
pa
thw
ay
FO
XO
1
P
AK
T
P
INP
P4
B
FO
XO
1
De
gra
da
tio
n
Tgkd
GC
s
GC
pro
life
ra
tio
n
GC
ap
op
tos
is

160
Figure 40: Model of Tgkd induced OT formation
OT formation is a multifactorial process in the Tgkd OT model with GCs and oocytes playing a
role in the development of OTs. The Tgkd transgene causes a decrease in INPP4B levels in Tgkd
GCs resulting in hyperactivation of the PI3K/AKT pathway. This signaling alteration is
associated increased proliferation and decreased apoptosis of Tgkd GCs and follicular defects
such as trapped oocytes in corpora lutea. The combination of trapped oocytes and high FVB
oocyte parthenogenesis may predispose the Tgkd females to OT formation.
8.9 FUTURE DIRECTIONS
In the Tgkd OT model, I have demonstrated a decrease in the levels of Inpp4b in combination
with FVB strain specific modifier alleles leads to OT formation. In future studies, we plan to
independently verify this observation using Inpp4bloxP/loxP mice, which were used to generate
Inpp4b-/- mice [139]. We have obtained Inpp4bloxP/loxP mice from Dr. Vacher, where the loxP
sites are designed to flank exon 11 of the Inpp4b gene. We plan to cross the Inpp4bloxP/loxP mice
with transgenic mice carrying Sox2 promoter-mediated Cre recombinase (Sox2-Cre mice). This
would generate Inpp4bloxP/loxP; Sox2-Cre mice similar to the Inpp4b-/- mice with loss of INPP4B
protein in the epiblast and subsequently all tissues of the embryo [144]. We would also cross the
Inpp4bloxP/loxP mice with transgenic mice carrying a granulosa cell promoter-mediated Cre
recombinase (GC-Cre) in order to generate Inpp4bloxP/loxP; GC-Cre mice with a tissue specific
161
knockout of Inpp4b in GCs to reduce the timespan for adaptation. We plan to use the cytochrome
P450, family 19 promoter (Cyp19-Cre) and anti-Müllerian hormone promoter (AMH-Cre) strains
of mice to generate GC specific knockouts of Inpp4b [48, 145]. We plan to backcross the
Inpp4bloxP/loxP; Sox2-Cre and Inpp4bloxP/loxP; GC-Cre mice into the FVB background for atleast 10
generations and then evaluate whether the females develop OTs. Since ovarian phenotypes are
sensitive to the extent of gene downregulation, we plan to also cross Inpp4bloxP/+ with transgenic
mice expressing Cre recombinase and then backcross the resulting Inpp4bloxP/+; Sox2-Cre and
Inpp4bloxP/+; GC-Cre mice into the FVB background for several generations. We would verify
the loss of INPP4B in each of these strains of mice and examine whether there are alterations in
the PI3K/AKT pathway. These experiments would help us directly address the role of Inpp4b
and the extent of downregulation required for OT formation.
We are also planning to further pursue studies on the role of the FVB background on OT
formation. Linkage analysis has already identified the FVB strain specific modifier locus in Tgkd
females, designated Ots2 to be located between 20-50cM on chromosome 6 (Eicher et al.,
manuscript in preparation). Congenic mouse strains have been generated on the B6 background,
which possess small genomic regions from the FVB strain on chromosome 6 overlapping Ots2.
One of congenic lines Line B is on the B6 strain background but contains the 20-50cM region of
chromosome 6 from the FVB strain. Line B mice with the Tgkd transgene develop OTs at a high
very frequency, when crossed to OT susceptible LT/Sv mice (Eicher et al., manuscript in
preparation). Creating a number of congenic lines with small specific subintervals of Ots2 from
the FVB background may help us specify the location of the FVB modifier gene involved in the
OT phenotype to a 1-2 cM resolution for effective positional cloning and evaluation of candidate
genes.
162
One interesting candidate in the Ots2 region is the gene inositol 1,4,5-trisphosphate
receptor 1 Itpr1 (49.74 cM), which plays a role in calcium release post fertilization. The binding
of inositol (1,4,5) triphosphate (IP3) to Itpr1 post fertilization initiates a series of calcium
oscillations, which promote egg activation involving completion of meiosis II and subsequent
mitotic cleavage [146]. Recent studies have shown an increase in ITPR1 sensitivity and levels
with oocyte maturation, which peaks after completion of meiosis I and is subsequently
downregulated after fertilization [147-149]. Calcium ionophores that increase intracellular
calcium levels in mature oocytes promote oocyte parthenogenesis [150]. Therefore, alterations in
the cDNA sequence or protein levels of ITPR1 may lower the threshold for calcium release and
alter the rate of oocyte parthenogenetic activation between OT susceptible and OT non-
permissive strains. Further, we also plan to analyze whether Tgkd alters PI3K/AKT activation
kinetics in GCs and is associated with luteinized unruptured follicles in OT non-permissive
strains. These studies would help us determine whether the strain permissiveness of the FVB
strain is limited to the modifier locus on chromosome 6 or involves many other FVB strain
specific effects on ovarian follicular maturation.

163
APPENDIX A
PERICENTRIC AND DISTAL SNPS ANALYZED IN SPLEEN AND OTS TO
DETERMINE LAST STAGE OF MEIOSIS OF OTS
SNP genotyping for spleen and teratoma, used to determine the last stage of meiosis completed
by oocyte before initiating OT formation. Single nucleotide polymorphisms (SNPs) that are
documented to be different between B6 and FVB were chosen for this analysis. One pericentric
and distal SNP were chosen per chromosome and analyzed in spleen (Spl) and OT pairs from OT
positive Tgkd females from the backcross between (FVB-Tgkd X B6) and FVB mice. The
chromosomal location of each SNP and their nucleotide status in the spleen and OT are stated in
the below figure.
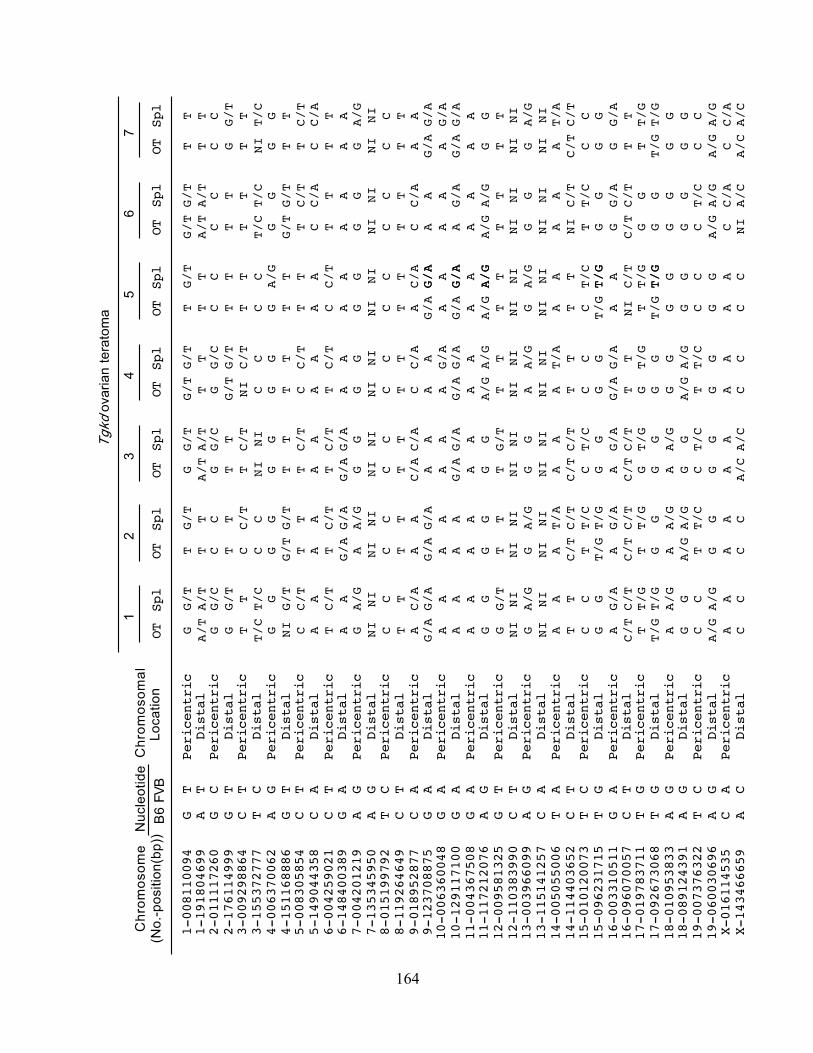
164
Tgkd
ova
rian
tera
tom
a
12
34
56
7C
hrom
osom
e(N
o.-p
ositi
on(b
p))N
ucle
otid
eB
6FV
BLo
catio
nC
hrom
osom
al
7-135345950
Distal
AG
12-110383990
Distal
CT
13-115141257
Distal
CA
1-008110094
GT
Pericentric
1-191804699
Distal
AT
2-011117260
Pericentric
GC
2-176114999
Distal
GT
3-009298864
Pericentric
CT
3-155372777
Distal
TC
4-006370062
Pericentric
AG
5-008305854
Pericentric
CT
5-149044358
Distal
CA
6-004259021
Pericentric
CT
6-148400389
Distal
GA
7-004201219
Pericentric
AG
8-015199792
Pericentric
TC
8-119264649
Distal
CT
9-018952877
Pericentric
CA
9-123708875
Distal
GA
10-006360048
Pericentric
GA
10-129117100
Distal
GA
11-004367508
Pericentric
GA
11-117212076
Distal
AG
12-009581325
Pericentric
GT
13-003966099
Pericentric
AG
14-005055006
Pericentric
TA
14-114403652
Distal
CT
15-010120073
Pericentric
TC
15-096231715
Distal
TG
16-003310511
Pericentric
GA
16-096070057
Distal
CT
17-019783711
Pericentric
TG
17-092673068
Distal
TG
18-010953833
Pericentric
AG
18-089124391
Distal
AG
19-007376322
Pericentric
TC
19-060030696
Distal
AG
X-016114535
Pericentric
CA
X-143466659
Distal
AC
4-151168886
Distal
GT
GG/
TT
G/T
GG/
TG/
TG/
TT
G/T
G/T
G/T
TT
OTSpl
Spl
Spl
Spl
Spl
Spl
Spl
OTOT
OTOT
OTOT
A/T
A/T
TT
A/TA/
TT
TT
TT
TA/
TA/
TG
G/C
CC
GG/
CG
G/C
CC
CC
CC
GG/
TT
TT
TG/
TG/
TG/
TT
TT
TG
TT
CC/
TT
C/T
C/T
TT
TT
TT
T/C
T/C
CC
CC
CC
T/C
T/C
T/C
GG
GG
GG
GG
GG
GG
GA/
GG/
TG/
TG/
TT
TT
TT
TT
TG/
TG/
TC
C/T
TT
TC/
TC
C/T
TT
TT
C/T
C/T
AA
AA
AA
AA
AA
CC
C/A
C/A
C/T
C/T
C/T
C/T
C/T
TT
TT
CT
TT
TA
AA
AA
AA
AA
AG/
AG/
AG/
AG/
AG
A/G
AA/
GG
GG
GG
GG
GG
A/G
CC
CC
CC
CC
CC
CC
CC
TT
TT
TT
TT
TT
TT
TT
A G/A
C/A
AA
C/AC/
AC/
AC
C/A
C/A
CA
AA
G/A
G/A
G/A
G/A
AA
AA
AG/
AG/
AG/
AA
AA
AA
AA
AG/
AG/
AA
AA
AA
AA
AA
G/AG/
AG/
AG/
AG/
AG/
AG/
AG/
AG/
AA
AA
AA
AA
AA
AA
AA
AA
GG
GG
GG
GG
A/G
A/G
A/G
A/G
A/G
A/G
GG/
TT
TT
TG/
TT
TT
TT
TT
GA/
GG
GA/
GA/
GG
AA/
GA/
GG
GG
G
AA
AA
T/A
AA
T/A
T/A
AA
AA
AT
TC/
TC/
TC/
TC/
TC/
TC/
TC/
TT
TT
TC
CT
T/C
T/C
CC
CC
CC
T/C
T/C
TG
GG
GG
T/G
T/G
GT/
GT/
GG
GG
GA
G/A
AG/
AA
G/A
G/A
G/A
AA
G/A
G/A
GG
C/T
C/T
C/T
C/T
C/TC/
TT
TT
TC/
TC/
TC/
TT
T/G
T/G
TT/
GT/
GG
GT
T/G
T/G
GG
TT/
GT/
GT/
GT/
GT/
GG
GG
GG
GT/
GG
GA
A/G
AA/
GA/
GA
GG
GG
GG
GG
A/G
GG
GA/
GA/
GG
GA/
GG
GG
GG
CC
TT/
CT
T/C
CT/
CT/
CC
CC
CC
A/G
A/G
GA/
GA/
GA/
GA/
GG
GG
GG
GG
AA
AA
AA
AA
CC
C/A
C/A
AA
CC
CC
A/CA/
CA/
CA/
CA/
CC
CC
C
NINI
NI
NI NINI
NINI
NINI
NINI
NINI
NINI
NINI
NINI
NINI
NINI
NINI
NINI
NINI
NINI
NINI
NINI
NINI
NINI
NINI
NINI
NINI
T/G
NI T/G
NI
G/A
A/G
G/A
NI
NI
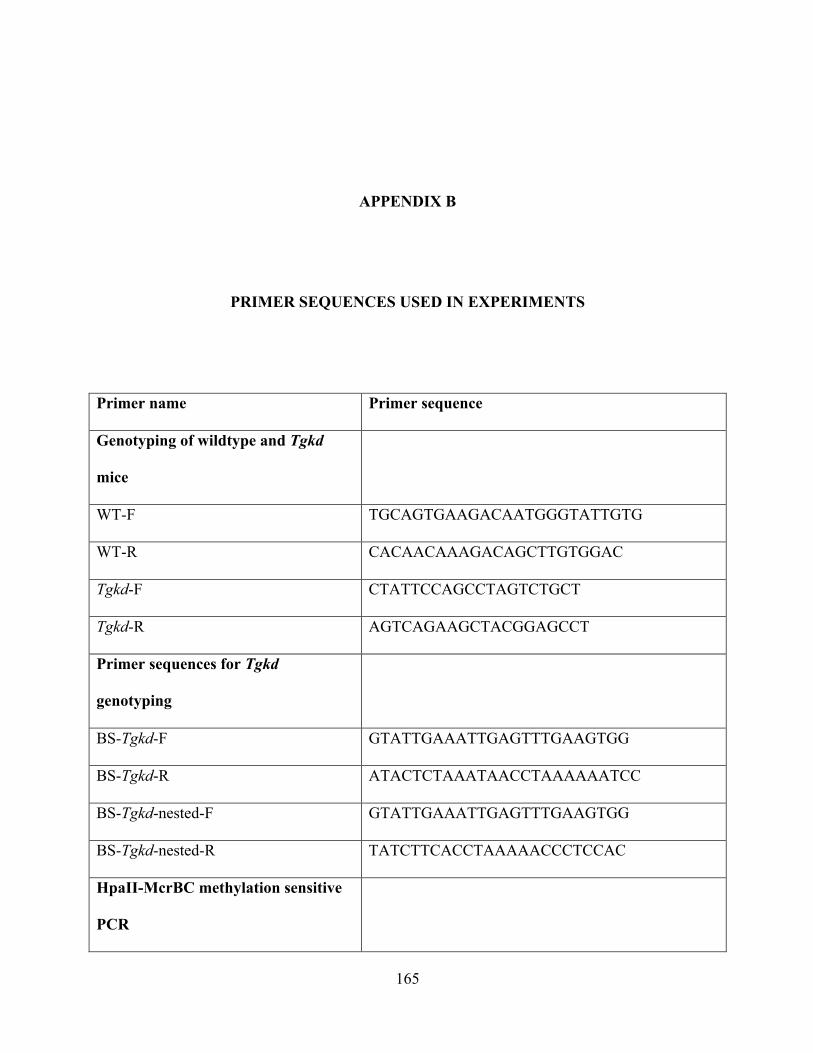
165
APPENDIX B
PRIMER SEQUENCES USED IN EXPERIMENTS
Primer name Primer sequence
Genotyping of wildtype and Tgkd
mice
WT-F TGCAGTGAAGACAATGGGTATTGTG
WT-R CACAACAAAGACAGCTTGTGGAC
Tgkd-F CTATTCCAGCCTAGTCTGCT
Tgkd-R AGTCAGAAGCTACGGAGCCT
Primer sequences for Tgkd
genotyping
BS-Tgkd-F GTATTGAAATTGAGTTTGAAGTGG
BS-Tgkd-R ATACTCTAAATAACCTAAAAAATCC
BS-Tgkd-nested-F GTATTGAAATTGAGTTTGAAGTGG
BS-Tgkd-nested-R TATCTTCACCTAAAAACCCTCCAC
HpaII-McrBC methylation sensitive
PCR

166
CpGi-1F AGGTGGTTCAACAGCGAATC
CpGi-1R ACCTTTTCCCCTCGGTGTAG
CpGi-2F CTTCTTGCGTCCACAGTTCA
CpGi-2R CCGATCGAGTTCCTCTTCAG
CpGi-3F GAGTGGTAGCCCTGCTGAAG
CpGi-3R ACCCAGGGCGACTTTTAACT
CpGi-4F GAGCTACCTTCTCACATCCT
CpGi-4R ATTCACCCATCCTCACCCTC
CpGi-5F CCAGAAGCTGTGTTGTTTTG
CpGi-5R CACCCTATTGTACTGCTGTC
CpGi-6F GATGAGGAAGGCAGAAATGG
CpGi-6R CCTGTGCAGACTAAAATCCT
CpGi-7F TGGAGTTTGTTTCCCACACA
CpGi-7R TGTGGGCTCGTCTTTCTTTT
CpGi-8F GCTGCTTTCCTTTTGTTTCG
CpGi-8R GGACTTCTCAGCCAGAGGTG
CpGi-9F TCTGGTGTTTGGACCTCCTC
CpGi-9R CAGCTTTGAAGTGTGCATCC
CpGi-10F CAGTACCTCCTCCGGATTCA
CpGi-10R TGACAAGTTTAGCGCGTGAC
Inpp4b cDNA overlapping PCR
products
Inpp4b-cDNA-1F CTGAGCTCGCCGCTATAAAT
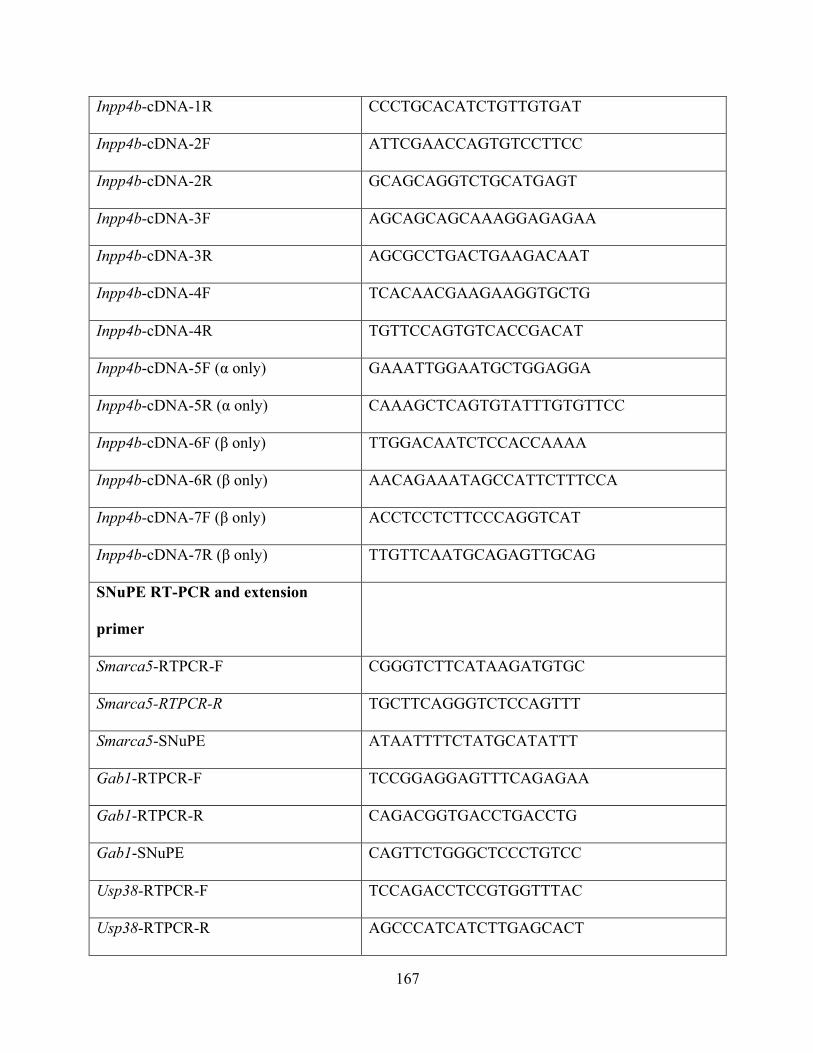
167
Inpp4b-cDNA-1R CCCTGCACATCTGTTGTGAT
Inpp4b-cDNA-2F ATTCGAACCAGTGTCCTTCC
Inpp4b-cDNA-2R GCAGCAGGTCTGCATGAGT
Inpp4b-cDNA-3F AGCAGCAGCAAAGGAGAGAA
Inpp4b-cDNA-3R AGCGCCTGACTGAAGACAAT
Inpp4b-cDNA-4F TCACAACGAAGAAGGTGCTG
Inpp4b-cDNA-4R TGTTCCAGTGTCACCGACAT
Inpp4b-cDNA-5F (α only) GAAATTGGAATGCTGGAGGA
Inpp4b-cDNA-5R (α only) CAAAGCTCAGTGTATTTGTGTTCC
Inpp4b-cDNA-6F (β only) TTGGACAATCTCCACCAAAA
Inpp4b-cDNA-6R (β only) AACAGAAATAGCCATTCTTTCCA
Inpp4b-cDNA-7F (β only) ACCTCCTCTTCCCAGGTCAT
Inpp4b-cDNA-7R (β only) TTGTTCAATGCAGAGTTGCAG
SNuPE RT-PCR and extension
primer
Smarca5-RTPCR-F CGGGTCTTCATAAGATGTGC
Smarca5-RTPCR-R TGCTTCAGGGTCTCCAGTTT
Smarca5-SNuPE ATAATTTTCTATGCATATTT
Gab1-RTPCR-F TCCGGAGGAGTTTCAGAGAA
Gab1-RTPCR-R CAGACGGTGACCTGACCTG
Gab1-SNuPE CAGTTCTGGGCTCCCTGTCC
Usp38-RTPCR-F TCCAGACCTCCGTGGTTTAC
Usp38-RTPCR-R AGCCCATCATCTTGAGCACT
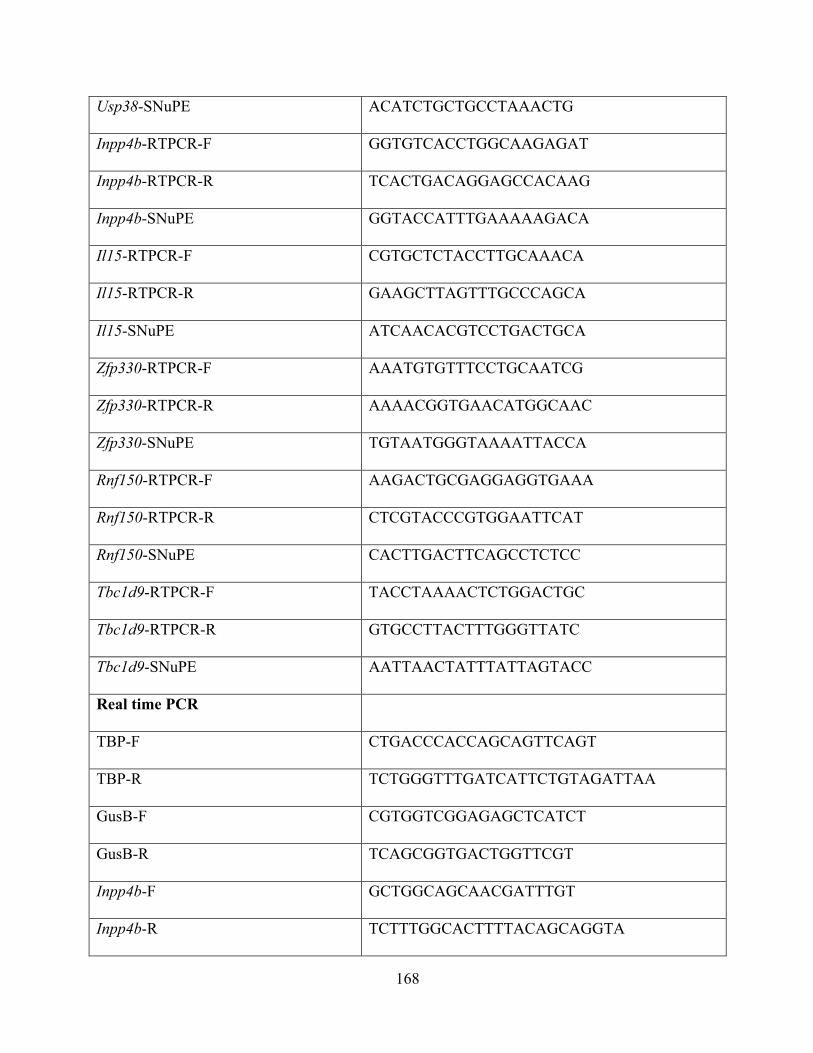
168
Usp38-SNuPE ACATCTGCTGCCTAAACTG
Inpp4b-RTPCR-F GGTGTCACCTGGCAAGAGAT
Inpp4b-RTPCR-R TCACTGACAGGAGCCACAAG
Inpp4b-SNuPE GGTACCATTTGAAAAAGACA
Il15-RTPCR-F CGTGCTCTACCTTGCAAACA
Il15-RTPCR-R GAAGCTTAGTTTGCCCAGCA
Il15-SNuPE ATCAACACGTCCTGACTGCA
Zfp330-RTPCR-F AAATGTGTTTCCTGCAATCG
Zfp330-RTPCR-R AAAACGGTGAACATGGCAAC
Zfp330-SNuPE TGTAATGGGTAAAATTACCA
Rnf150-RTPCR-F AAGACTGCGAGGAGGTGAAA
Rnf150-RTPCR-R CTCGTACCCGTGGAATTCAT
Rnf150-SNuPE CACTTGACTTCAGCCTCTCC
Tbc1d9-RTPCR-F TACCTAAAACTCTGGACTGC
Tbc1d9-RTPCR-R GTGCCTTACTTTGGGTTATC
Tbc1d9-SNuPE AATTAACTATTTATTAGTACC
Real time PCR
TBP-F CTGACCCACCAGCAGTTCAGT
TBP-R TCTGGGTTTGATCATTCTGTAGATTAA
GusB-F CGTGGTCGGAGAGCTCATCT
GusB-R TCAGCGGTGACTGGTTCGT
Inpp4b-F GCTGGCAGCAACGATTTGT
Inpp4b-R TCTTTGGCACTTTTACAGCAGGTA
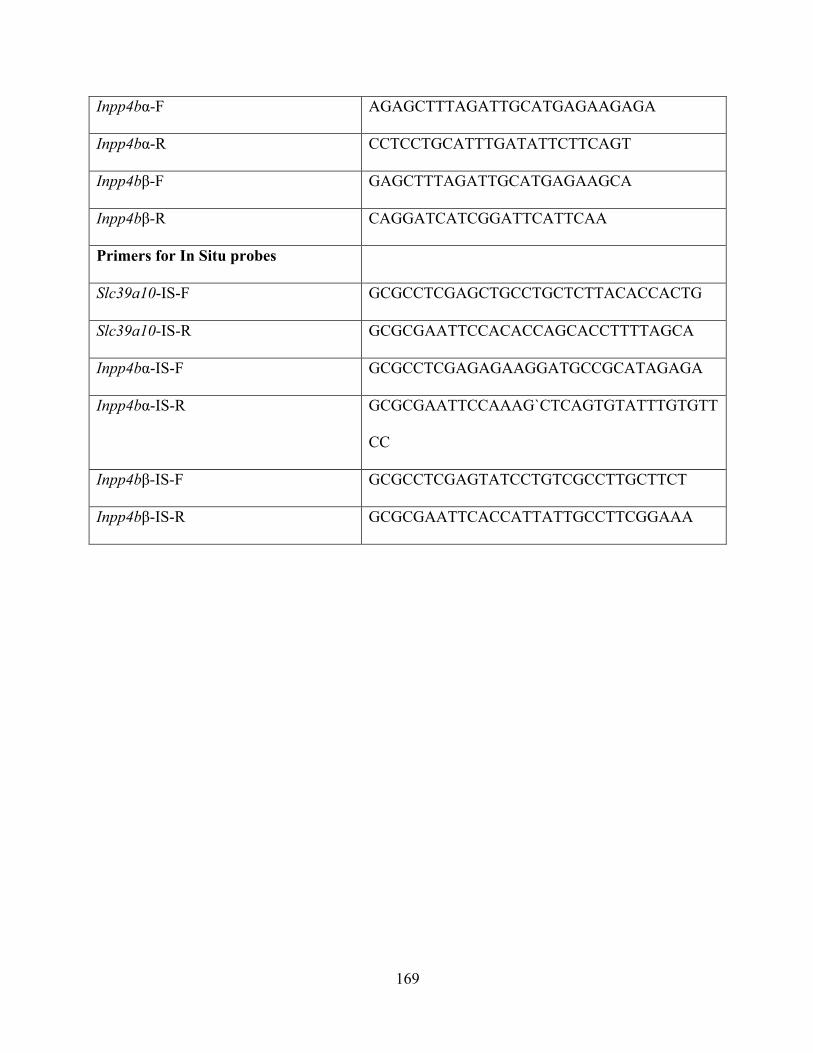
169
Inpp4bα-F AGAGCTTTAGATTGCATGAGAAGAGA
Inpp4bα-R CCTCCTGCATTTGATATTCTTCAGT
Inpp4bβ-F GAGCTTTAGATTGCATGAGAAGCA
Inpp4bβ-R CAGGATCATCGGATTCATTCAA
Primers for In Situ probes
Slc39a10-IS-F GCGCCTCGAGCTGCCTGCTCTTACACCACTG
Slc39a10-IS-R GCGCGAATTCCACACCAGCACCTTTTAGCA
Inpp4bα-IS-F GCGCCTCGAGAGAAGGATGCCGCATAGAGA
Inpp4bα-IS-R GCGCGAATTCCAAAG`CTCAGTGTATTTGTGTT
CC
Inpp4bβ-IS-F GCGCCTCGAGTATCCTGTCGCCTTGCTTCT
Inpp4bβ-IS-R GCGCGAATTCACCATTATTGCCTTCGGAAA

170
APPENDIX C
EFFICIENCY CURVES FOR REAL TIME PCR EXPERIMENTS
y = -3.4673x + 34.45
R² = 0.97681
0
10
20
30
40
0 0.5 1 1.5 2
Ct a
v
Log diln
Inpp4b
y = -3.2282x + 32.583
R² = 0.99896
0
10
20
30
40
0 0.5 1 1.5 2 2.5 3
Ct a
v
Log Diln
Inpp4bT
y = -3.2868x + 36.204
R² = 0.99774
0
10
20
30
40
0 0.5 1 1.5 2 2.5 3
Ct a
v
Log Diln
Inpp4b
TBP
y = -3.2543x + 34.758
R² = 0.9956
0
10
20
30
40
0 0.5 1 1.5 2 2.5 3
y = -3.2988x + 31.282
R² = 0.99692
0
10
20
30
40
0 0.5 1 1.5 2 2.5 3
Ct a
v
Log diln

171
BIBLIOGRAPHY
1. Williams RH, Larsen PR. Williams textbook of endocrinology. 10th ed. Philadelphia, Pa.: Saunders; 2003. xxiii, 1927.
2. Leung PCK, Adashi EY. The ovary. 2nd ed. Amsterdam ; Boston: Elsevier; 2004. xviii, 664.
3. Edson MA, Nagaraja AK, Matzuk MM. The mammalian ovary from genesis to revelation. Endocrine reviews. 2009;30(6):624-712.
4. McGee EA, Hsueh AJ. Initial and cyclic recruitment of ovarian follicles. Endocrine reviews. 2000;21(2):200-14.
5. Camp TA, Rahal JO, Mayo KE. Cellular localization and hormonal regulation of follicle-stimulating hormone and luteinizing hormone receptor messenger RNAs in the rat ovary. Mol Endocrinol. 1991;5(10):1405-17.
6. Zheng W, Magid MS, Kramer EE, Chen YT. Follicle-stimulating hormone receptor is expressed in human ovarian surface epithelium and fallopian tube. The American journal of pathology. 1996;148(1):47-53.
7. Eppig JJ, Wigglesworth K, Pendola FL. The mammalian oocyte orchestrates the rate of ovarian follicular development. Proc Natl Acad Sci U S A. 2002;99(5):2890-4.
8. Dierich A, Sairam MR, Monaco L, Fimia GM, Gansmuller A, LeMeur M, et al. Impairing follicle-stimulating hormone (FSH) signaling in vivo: targeted disruption of the FSH receptor leads to aberrant gametogenesis and hormonal imbalance. Proc Natl Acad Sci U S A. 1998;95(23):13612-7.
9. Halpin DM, Charlton HM. Effects of short-term injection of gonadotrophins on ovarian follicle development in hypogonadal (hpg) mice. Journal of reproduction and fertility. 1988;82(1):393-400.
10. Wang XN, Greenwald GS. Hypophysectomy of the cyclic mouse. I. Effects on folliculogenesis, oocyte growth, and follicle-stimulating hormone and human chorionic gonadotropin receptors. Biol Reprod. 1993;48(3):585-94.

172
11. Van Cappellen WA, Meijs-Roelofs HM, Kramer P, Van den Dungen HM. Ovarian follicle dynamics in immature rats treated with a luteinizing hormone-releasing hormone antagonist (Org. 30276). Biol Reprod. 1989;40(6):1247-56.
12. Diaz FJ, Wigglesworth K, Eppig JJ. Oocytes determine cumulus cell lineage in mouse ovarian follicles. Journal of cell science. 2007;120(Pt 8):1330-40.
13. Solc P, Schultz RM, Motlik J. Prophase I arrest and progression to metaphase I in mouse oocytes: comparison of resumption of meiosis and recovery from G2-arrest in somatic cells. Molecular human reproduction. 2010;16(9):654-64.
14. Rao MC, Midgley AR, Jr., Richards JS. Hormonal regulation of ovarian cellular proliferation. Cell. 1978;14(1):71-8.
15. Robker RL, Richards JS. Hormone-induced proliferation and differentiation of granulosa cells: a coordinated balance of the cell cycle regulators cyclin D2 and p27Kip1. Mol Endocrinol. 1998;12(7):924-40.
16. Pedersen T, Peters H. Proposal for a classification of oocytes and follicles in the mouse ovary. Journal of reproduction and fertility. 1968;17(3):555-7.
17. Achermann JC, Jameson JL. Fertility and infertility: genetic contributions from the hypothalamic-pituitary-gonadal axis. Mol Endocrinol. 1999;13(6):812-8.
18. Adashi EY, Leung PCK. The Ovary. New York: Raven Press; 1993. xv, 687.
19. Knobil E, Neill JD. Knobil and Neill's physiology of reproduction. 3rd ed. Amsterdam ; Boston: Elsevier; 2006. 2 v. (xxix, 3230).
20. Southworth MB, Matsumoto AM, Gross KM, Soules MR, Bremner WJ. The importance of signal pattern in the transmission of endocrine information: pituitary gonadotropin responses to continuous and pulsatile gonadotropin-releasing hormone. The Journal of clinical endocrinology and metabolism. 1991;72(6):1286-9.
21. Belchetz PE, Plant TM, Nakai Y, Keogh EJ, Knobil E. Hypophysial responses to continuous and intermittent delivery of hypopthalamic gonadotropin-releasing hormone. Science. 1978;202(4368):631-3.
22. Wildt L, Hausler A, Marshall G, Hutchison JS, Plant TM, Belchetz PE, et al. Frequency and amplitude of gonadotropin-releasing hormone stimulation and gonadotropin secretion in the rhesus monkey. Endocrinology. 1981;109(2):376-85.
23. Haisenleder DJ, Dalkin AC, Ortolano GA, Marshall JC, Shupnik MA. A pulsatile gonadotropin-releasing hormone stimulus is required to increase transcription of the gonadotropin subunit genes: evidence for differential regulation of transcription by pulse frequency in vivo. Endocrinology. 1991;128(1):509-17.

173
24. Zeleznik AJ, Schuler HM, Reichert LE, Jr. Gonadotropin-binding sites in the rhesus monkey ovary: role of the vasculature in the selective distribution of human chorionic gonadotropin to the preovulatory follicle. Endocrinology. 1981;109(2):356-62. Epub 1981/08/01.
25. Evans AC, Fortune JE. Selection of the dominant follicle in cattle occurs in the absence of differences in the expression of messenger ribonucleic acid for gonadotropin receptors. Endocrinology. 1997;138(7):2963-71.
26. Hillier SG, Whitelaw PF, Smyth CD. Follicular oestrogen synthesis: the 'two-cell, two-gonadotrophin' model revisited. Molecular and cellular endocrinology. 1994;100(1-2):51-4.
27. Zeleznik AJ, Hutchison JS, Schuler HM. Interference with the gonadotropin-suppressing actions of estradiol in macaques overrides the selection of a single preovulatory follicle. Endocrinology. 1985;117(3):991-9.
28. Zeleznik AJ, Midgley AR, Jr., Reichert LE, Jr. Granulosa cell maturation in the rat: increased binding of human chorionic gonadotropin following treatment with follicle-stimulating hormone in vivo. Endocrinology. 1974;95(3):818-25.
29. Xia L, Van Vugt D, Alston EJ, Luckhaus J, Ferin M. A surge of gonadotropin-releasing hormone accompanies the estradiol-induced gonadotropin surge in the rhesus monkey. Endocrinology. 1992;131(6):2812-20.
30. Fritz MA, McLachlan RI, Cohen NL, Dahl KD, Bremner WJ, Soules MR. Onset and characteristics of the midcycle surge in bioactive and immunoactive luteinizing hormone secretion in normal women: influence of physiological variations in periovulatory ovarian steroid hormone secretion. The Journal of clinical endocrinology and metabolism. 1992;75(2):489-93.
31. Stocco C, Telleria C, Gibori G. The molecular control of corpus luteum formation, function, and regression. Endocrine reviews. 2007;28(1):117-49.
32. Hawkins SM, Matzuk MM. The menstrual cycle: basic biology. Annals of the New York Academy of Sciences. 2008;1135:10-8.
33. Nillni YI, Toufexis DJ, Rohan KJ. Anxiety sensitivity, the menstrual cycle, and panic disorder: a putative neuroendocrine and psychological interaction. Clinical psychology review. 2011;31(7):1183-91.
34. Silver LM. Mouse genetics : concepts and applications. New York: Oxford University Press; 1995. xiii, 362.
35. Fowler RE, Edwards RG. Induction of superovulation and pregnancy in mature mice by gonadotrophins. The Journal of endocrinology. 1957;15(4):374-84.

174
36. Richards JS, Pangas SA. The ovary: basic biology and clinical implications. The Journal of clinical investigation. 2010;120(4):963-72.
37. Hunzicker-Dunn M, Maizels ET. FSH signaling pathways in immature granulosa cells that regulate target gene expression: branching out from protein kinase A. Cell Signal. 2006;18(9):1351-9.
38. Farini D, La Sala G, Tedesco M, De Felici M. Chemoattractant action and molecular signaling pathways of Kit ligand on mouse primordial germ cells. Dev Biol. 2007;306(2):572-83.
39. Morita Y, Manganaro TF, Tao XJ, Martimbeau S, Donahoe PK, Tilly JL. Requirement for phosphatidylinositol-3'-kinase in cytokine-mediated germ cell survival during fetal oogenesis in the mouse. Endocrinology. 1999;140(2):941-9.
40. Reddy P, Liu L, Adhikari D, Jagarlamudi K, Rajareddy S, Shen Y, et al. Oocyte-specific deletion of Pten causes premature activation of the primordial follicle pool. Science. 2008;319(5863):611-3.
41. Shimada M, Ito J, Yamashita Y, Okazaki T, Isobe N. Phosphatidylinositol 3-kinase in cumulus cells is responsible for both suppression of spontaneous maturation and induction of gonadotropin-stimulated maturation of porcine oocytes. The Journal of endocrinology. 2003;179(1):25-34.
42. Hoshino Y, Yokoo M, Yoshida N, Sasada H, Matsumoto H, Sato E. Phosphatidylinositol 3-kinase and Akt participate in the FSH-induced meiotic maturation of mouse oocytes. Mol Reprod Dev. 2004;69(1):77-86.
43. Kalous J, Solc P, Baran V, Kubelka M, Schultz RM, Motlik J. PKB/AKT is involved in resumption of meiosis in mouse oocytes. Biology of the cell / under the auspices of the European Cell Biology Organization. 2006;98(2):111-23.
44. Zeleznik AJ, Saxena D, Little-Ihrig L. Protein kinase B is obligatory for follicle-stimulating hormone-induced granulosa cell differentiation. Endocrinology. 2003;144(9):3985-94.
45. Alam H, Maizels ET, Park Y, Ghaey S, Feiger ZJ, Chandel NS, et al. Follicle-stimulating hormone activation of hypoxia-inducible factor-1 by the phosphatidylinositol 3-kinase/AKT/Ras homolog enriched in brain (Rheb)/mammalian target of rapamycin (mTOR) pathway is necessary for induction of select protein markers of follicular differentiation. J Biol Chem. 2004;279(19):19431-40.
46. Park Y, Maizels ET, Feiger ZJ, Alam H, Peters CA, Woodruff TK, et al. Induction of cyclin D2 in rat granulosa cells requires FSH-dependent relief from FOXO1 repression coupled with positive signals from Smad. J Biol Chem. 2005;280(10):9135-48.

175
47. Sicinski P, Donaher JL, Geng Y, Parker SB, Gardner H, Park MY, et al. Cyclin D2 is an FSH-responsive gene involved in gonadal cell proliferation and oncogenesis. Nature. 1996;384(6608):470-4.
48. Fan HY, Liu Z, Cahill N, Richards JS. Targeted disruption of Pten in ovarian granulosa cells enhances ovulation and extends the life span of luteal cells. Mol Endocrinol. 2008;22(9):2128-40.
49. Mehlmann LM. Stops and starts in mammalian oocytes: recent advances in understanding the regulation of meiotic arrest and oocyte maturation. Reproduction. 2005;130(6):791-9.
50. Conti M, Andersen CB, Richard F, Mehats C, Chun SY, Horner K, et al. Role of cyclic nucleotide signaling in oocyte maturation. Molecular and cellular endocrinology. 2002;187(1-2):153-9.
51. Oh JS, Han SJ, Conti M. Wee1B, Myt1, and Cdc25 function in distinct compartments of the mouse oocyte to control meiotic resumption. J Cell Biol. 2010;188(2):199-207.
52. Pirino G, Wescott MP, Donovan PJ. Protein kinase A regulates resumption of meiosis by phosphorylation of Cdc25B in mammalian oocytes. Cell Cycle. 2009;8(4):665-70.
53. Hampl A, Eppig JJ. Analysis of the mechanism(s) of metaphase I arrest in maturing mouse oocytes. Development. 1995;121(4):925-33.
54. Sagata N, Watanabe N, Vande Woude GF, Ikawa Y. The c-mos proto-oncogene product is a cytostatic factor responsible for meiotic arrest in vertebrate eggs. Nature. 1989;342(6249):512-8.
55. Madgwick S, Jones KT. How eggs arrest at metaphase II: MPF stabilisation plus APC/C inhibition equals Cytostatic Factor. Cell division. 2007;2:4.
56. Colledge WH, Carlton MB, Udy GB, Evans MJ. Disruption of c-mos causes parthenogenetic development of unfertilized mouse eggs. Nature. 1994;370(6484):65-8.
57. Hashimoto N, Watanabe N, Furuta Y, Tamemoto H, Sagata N, Yokoyama M, et al. Parthenogenetic activation of oocytes in c-mos-deficient mice. Nature. 1994;370(6484):68-71.
58. Saunders CM, Larman MG, Parrington J, Cox LJ, Royse J, Blayney LM, et al. PLC zeta: a sperm-specific trigger of Ca(2+) oscillations in eggs and embryo development. Development. 2002;129(15):3533-44.
59. Linder D, McCaw BK, Hecht F. Parthenogenic origin of benign ovarian teratomas. The New England journal of medicine. 1975;292(2):63-6.
60. Ulbright TM. Germ cell tumors of the gonads: a selective review emphasizing problems in differential diagnosis, newly appreciated, and controversial issues. Modern pathology :

176
an official journal of the United States and Canadian Academy of Pathology, Inc. 2005;18 Suppl 2:S61-79.
61. Schmid-Braz AT, Cavalli LR, Cornelio DA, Wuicik L, Ribeiro EM, Bleggi-Torres LF, et al. Comprehensive cytogenetic evaluation of a mature ovarian teratoma case. Cancer Genet Cytogenet. 2002;132(2):165-8.
62. Howlader N, Noone AM, Krapcho M, Neyman N, Aminou R, Waldron W, et al. SEER Cancer Statistics Review, 1975-20082011.
63. Stevens LC, Varnum DS. The development of teratomas from parthenogenetically activated ovarian mouse eggs. Dev Biol. 1974;37(2):369-80.
64. Surti U, Hoffner L, Chakravarti A, Ferrell RE. Genetics and biology of human ovarian teratomas. I. Cytogenetic analysis and mechanism of origin. American journal of human genetics. 1990;47(4):635-43.
65. Carritt B, Parrington JM, Welch HM, Povey S. Diverse origins of multiple ovarian teratomas in a single individual. Proc Natl Acad Sci U S A. 1982;79(23):7400-4.
66. Deka R, Chakravarti A, Surti U, Hauselman E, Reefer J, Majumder PP, et al. Genetics and biology of human ovarian teratomas. II. Molecular analysis of origin of nondisjunction and gene-centromere mapping of chromosome I markers. American journal of human genetics. 1990;47(4):644-55.
67. Muretto P, Chilosi M, Rabitti C, Tommasoni S, Colato C. Biovularity and "coalescence of primary follicles" in ovaries with mature teratomas. International journal of surgical pathology. 2001;9(2):121-5.
68. Hoffner L, Shen-Schwarz S, Deka R, Chakravarti A, Surti U. Genetics and biology of human ovarian teratomas. III. Cytogenetics and origins of malignant ovarian germ cell tumors. Cancer Genet Cytogenet. 1992;62(1):58-65.
69. Parrington JM, West LF, Povey S. The origin of ovarian teratomas. Journal of medical genetics. 1984;21(1):4-12.
70. Blake KI, Gerrard MP. Malignant germ cell tumours in two siblings. Medical and pediatric oncology. 1993;21(4):299-300.
71. Brenner SH, Wallach RC. Familial benign cystic teratomata. International journal of gynaecology and obstetrics: the official organ of the International Federation of Gynaecology and Obstetrics. 1983;21(2):167-9.
72. Indinnimeo M, Cicchini C, Larcinese A, Kanakaki S, Ricci F, Mingazzini PL. Two twins with teratoma of the ovary. An unusual association: case report. European journal of gynaecological oncology. 2003;24(2):199-201.

177
73. Plattner G, Oxorn H. Familial incidence of ovarian dermoid cysts. Canadian Medical Association journal. 1973;108(7):892-3.
74. Simon A, Ohel G, Neri A, Schenker JG. Familial occurrence of mature ovarian teratomas. Obstetrics and gynecology. 1985;66(2):278-9.
75. Stettner AR, Hartenbach EM, Schink JC, Huddart R, Becker J, Pauli R, et al. Familial ovarian germ cell cancer: report and review. American journal of medical genetics. 1999;84(1):43-6.
76. Eppig JJ, Kozak LP, Eicher EM, Stevens LC. Ovarian teratomas in mice are derived from oocytes that have completed the first meiotic division. Nature. 1977;269(5628):517-8.
77. O'Neill GT, Kaufman MH. Ovulation and fertilization of primary and secondary oocytes in LT/Sv strain mice. Gamete research. 1987;18(1):27-36.
78. Eppig JJ, Wigglesworth K, Varnum DS, Nadeau JH. Genetic regulation of traits essential for spontaneous ovarian teratocarcinogenesis in strain LT/Sv mice: aberrant meiotic cell cycle, oocyte activation, and parthenogenetic development. Cancer Res. 1996;56(21):5047-54.
79. Lee GH, Bugni JM, Obata M, Nishimori H, Ogawa K, Drinkwater NR. Genetic dissection of susceptibility to murine ovarian teratomas that originate from parthenogenetic oocytes. Cancer Res. 1997;57(4):590-3.
80. de Foy KA, Gayther SA, Colledge WH, Crockett S, Scott IV, Evans MJ, et al. Mutation analysis of the c-mos proto-oncogene in human ovarian teratomas. British journal of cancer. 1998;77(10):1642-4.
81. Youngson NA, Vickaryous N, van der Horst A, Epp T, Harten S, Fleming JS, et al. A missense mutation in the transcription factor Foxo3a causes teratomas and oocyte abnormalities in mice. Mammalian genome : official journal of the International Mammalian Genome Society. 2011;22(3-4):235-48.
82. Goldman DS, Kiessling AA, Millette CF, Cooper GM. Expression of c-mos RNA in germ cells of male and female mice. Proc Natl Acad Sci U S A. 1987;84(13):4509-13.
83. John GB, Gallardo TD, Shirley LJ, Castrillon DH. Foxo3 is a PI3K-dependent molecular switch controlling the initiation of oocyte growth. Dev Biol. 2008;321(1):197-204.
84. Peltoketo H, Strauss L, Karjalainen R, Zhang M, Stamp GW, Segaloff DL, et al. Female mice expressing constitutively active mutants of FSH receptor present with a phenotype of premature follicle depletion and estrogen excess. Endocrinology. 2010;151(4):1872-83.
85. Hsu SY, Lai RJ, Finegold M, Hsueh AJ. Targeted overexpression of Bcl-2 in ovaries of transgenic mice leads to decreased follicle apoptosis, enhanced folliculogenesis, and increased germ cell tumorigenesis. Endocrinology. 1996;137(11):4837-43.

178
86. Thurisch B, Liang SY, Sarioglu N, Schomburg L, Bungert J, Dame C. Transgenic mice expressing small interfering RNA against Gata4 point to a crucial role of Gata4 in the heart and gonads. Journal of molecular endocrinology. 2009;43(4):157-69.
87. Heikinheimo M, Ermolaeva M, Bielinska M, Rahman NA, Narita N, Huhtaniemi IT, et al. Expression and hormonal regulation of transcription factors GATA-4 and GATA-6 in the mouse ovary. Endocrinology. 1997;138(8):3505-14.
88. Fafalios MK, Olander EA, Melhem MF, Chaillet JR. Ovarian teratomas associated with the insertion of an imprinted transgene. Mammalian genome : official journal of the International Mammalian Genome Society. 1996;7(3):188-93.
89. Nagy A, Gertsenstein M, Vintersten K, Behringer R. Manipulating the Mouse Embryo: A Laboratory Manual. Third ed. Cold Spring Harbor, New York: Cold Spring Harbor Laboratory Press; 2003.
90. Escamilla-Hernandez R, Little-Ihrig L, Orwig KE, Yue J, Chandran U, Zeleznik AJ. Constitutively active protein kinase A qualitatively mimics the effects of follicle-stimulating hormone on granulosa cell differentiation. Mol Endocrinol. 2008;22(8):1842-52.
91. Clark SJ, Harrison J, Paul CL, Frommer M. High sensitivity mapping of methylated cytosines. Nucleic Acids Res. 1994;22(15):2990-7.
92. Chaillet JR, Bader DS, Leder P. Regulation of genomic imprinting by gametic and embryonic processes. Genes & development. 1995;9(10):1177-87.
93. Singer-Sam J, LeBon JM, Dai A, Riggs AD. A sensitive, quantitative assay for measurement of allele-specific transcripts differing by a single nucleotide. PCR methods and applications. 1992;1(3):160-3.
94. Pfaffl MW. A new mathematical model for relative quantification in real-time RT-PCR. Nucleic Acids Res. 2001;29(9):e45.
95. Cirio MC, Ratnam S, Ding F, Reinhart B, Navara C, Chaillet JR. Preimplantation expression of the somatic form of Dnmt1 suggests a role in the inheritance of genomic imprints. BMC developmental biology. 2008;8:9.
96. Barak Y, Nelson MC, Ong ES, Jones YZ, Ruiz-Lozano P, Chien KR, et al. PPAR gamma is required for placental, cardiac, and adipose tissue development. Molecular cell. 1999;4(4):585-95.
97. Swain JL, Stewart TA, Leder P. Parental legacy determines methylation and expression of an autosomal transgene: a molecular mechanism for parental imprinting. Cell. 1987;50(5):719-27.
179
98. Kirsch IR, Ravetch JV, Kwan SP, Max EE, Ney RL, Leder P. Multiple immunoglobulin switch region homologies outside the heavy chain constant region locus. Nature. 1981;293(5833):585-7.
99. Bourc'his D, Xu GL, Lin CS, Bollman B, Bestor TH. Dnmt3L and the establishment of maternal genomic imprints. Science (New York, NY). 2001;294(5551):2536-9.
100. Chaillet JR, Vogt TF, Beier DR, Leder P. Parental-specific methylation of an imprinted transgene is established during gametogenesis and progressively changes during embryogenesis. Cell. 1991;66(1):77-83.
101. Balakrishnan A, Chaillet JR. Role of the inositol polyphosphate-4-phosphatase type II Inpp4b in the generation of ovarian teratomas. Dev Biol. 2012. Epub 2012/10/20.
102. Kennedy MK, Glaccum M, Brown SN, Butz EA, Viney JL, Embers M, et al. Reversible defects in natural killer and memory CD8 T cell lineages in interleukin 15-deficient mice. The Journal of experimental medicine. 2000;191(5):771-80.
103. Fehniger TA, Suzuki K, Ponnappan A, VanDeusen JB, Cooper MA, Florea SM, et al. Fatal leukemia in interleukin 15 transgenic mice follows early expansions in natural killer and memory phenotype CD8+ T cells. The Journal of experimental medicine. 2001;193(2):219-31.
104. Zouridis H, Deng N, Ivanova T, Zhu Y, Wong B, Huang D, et al. Methylation subtypes and large-scale epigenetic alterations in gastric cancer. Science translational medicine. 2012;4(156):156ra40.
105. Dallosso AR, Oster B, Greenhough A, Thorsen K, Curry TJ, Owen C, et al. Long-range epigenetic silencing of chromosome 5q31 protocadherins is involved in early and late stages of colorectal tumorigenesis through modulation of oncogenic pathways. Oncogene. 2012;31(40):4409-19.
106. Ferron M, Vacher J. Characterization of the murine Inpp4b gene and identification of a novel isoform. Gene. 2006;376(1):152-61.
107. Lazzaro MA, Picketts DJ. Cloning and characterization of the murine Imitation Switch (ISWI) genes: differential expression patterns suggest distinct developmental roles for Snf2h and Snf2l. Journal of neurochemistry. 2001;77(4):1145-56.
108. Holgado-Madruga M, Emlet DR, Moscatello DK, Godwin AK, Wong AJ. A Grb2-associated docking protein in EGF- and insulin-receptor signalling. Nature. 1996;379(6565):560-4.
109. Leclercq G, Debacker V, de Smedt M, Plum J. Differential effects of interleukin-15 and interleukin-2 on differentiation of bipotential T/natural killer progenitor cells. The Journal of experimental medicine. 1996;184(2):325-36.

180
110. Bolivar J, Diaz I, Iglesias C, Valdivia MM. Molecular cloning of a zinc finger autoantigen transiently associated with interphase nucleolus and mitotic centromeres and midbodies. Orthologous proteins with nine CXXC motifs highly conserved from nematodes to humans. J Biol Chem. 1999;274(51):36456-64.
111. Gewinner C, Wang ZC, Richardson A, Teruya-Feldstein J, Etemadmoghadam D, Bowtell D, et al. Evidence that inositol polyphosphate 4-phosphatase type II is a tumor suppressor that inhibits PI3K signaling. Cancer cell. 2009;16(2):115-25.
112. Hodgson M, Shao L-J, Frolov A, Li R, Peterson L, Ayala G, et al. Decreased Expression and Androgen Regulation of the Tumor Suppressor Gene INPP4B in Prostate Cancer. Cancer research. 2011;71(2):572-82.
113. Brook FA, Gardner RL. The origin and efficient derivation of embryonic stem cells in the mouse. Proc Natl Acad Sci U S A. 1997;94(11):5709-12.
114. Li E, Bestor TH, Jaenisch R. Targeted mutation of the DNA methyltransferase gene results in embryonic lethality. Cell. 1992;69(6):915-26.
115. Sun H, Lesche R, Li DM, Liliental J, Zhang H, Gao J, et al. PTEN modulates cell cycle progression and cell survival by regulating phosphatidylinositol 3,4,5,-trisphosphate and Akt/protein kinase B signaling pathway. Proc Natl Acad Sci U S A. 1999;96(11):6199-204.
116. Stiles B, Gilman V, Khanzenzon N, Lesche R, Li A, Qiao R, et al. Essential role of AKT-1/protein kinase B alpha in PTEN-controlled tumorigenesis. Mol Cell Biol. 2002;22(11):3842-51.
117. Zhang Q, Claret FX. Phosphatases: the new brakes for cancer development? Enzyme research. 2012;2012:659649.
118. Dyson JM, Fedele CG, Davies EM, Becanovic J, Mitchell CA. Phosphoinositide phosphatases: just as important as the kinases. Sub-cellular biochemistry. 2012;58:215-79.
119. Yamada Y, Watanabe H, Miura F, Soejima H, Uchiyama M, Iwasaka T, et al. A comprehensive analysis of allelic methylation status of CpG islands on human chromosome 21q. Genome research. 2004;14(2):247-66.
120. Han SJ, Vaccari S, Nedachi T, Andersen CB, Kovacina KS, Roth RA, et al. Protein kinase B/Akt phosphorylation of PDE3A and its role in mammalian oocyte maturation. The EMBO journal. 2006;25(24):5716-25.
121. Fedele C, Ooms L, Ho M, Vieusseux J, O'Toole S, Millar E, et al. Inositol polyphosphate 4-phosphatase II regulates PI3K/Akt signaling and is lost in human basal-like breast cancers. Proceedings of the National Academy of Sciences of the United States of America. 2010;107(51):22231-6.

181
122. Richards JS, Sharma SC, Falender AE, Lo YH. Expression of FKHR, FKHRL1, and AFX genes in the rodent ovary: evidence for regulation by IGF-I, estrogen, and the gonadotropins. Mol Endocrinol. 2002;16(3):580-99.
123. Manning BD, Cantley LC. AKT/PKB signaling: navigating downstream. Cell. 2007;129(7):1261-74.
124. Fan HY, Shimada M, Liu Z, Cahill N, Noma N, Wu Y, et al. Selective expression of KrasG12D in granulosa cells of the mouse ovary causes defects in follicle development and ovulation. Development. 2008;135(12):2127-37.
125. Hsueh AJ, McGee EA, Hayashi M, Hsu SY. Hormonal regulation of early follicle development in the rat ovary. Molecular and cellular endocrinology. 2000;163(1-2):95-100.
126. Huang H, Tindall DJ. Dynamic FoxO transcription factors. Journal of cell science. 2007;120(Pt 15):2479-87.
127. Bansal VS, Caldwell KK, Majerus PW. The isolation and characterization of inositol polyphosphate 4-phosphatase. J Biol Chem. 1990;265(3):1806-11.
128. Norris FA, Atkins RC, Majerus PW. The cDNA cloning and characterization of inositol polyphosphate 4-phosphatase type II. Evidence for conserved alternative splicing in the 4-phosphatase family. J Biol Chem. 1997;272(38):23859-64.
129. Norris FA, Majerus PW. Hydrolysis of phosphatidylinositol 3,4-bisphosphate by inositol polyphosphate 4-phosphatase isolated by affinity elution chromatography. J Biol Chem. 1994;269(12):8716-20.
130. Ma K, Cheung SM, Marshall AJ, Duronio V. PI(3,4,5)P3 and PI(3,4)P2 levels correlate with PKB/akt phosphorylation at Thr308 and Ser473, respectively; PI(3,4)P2 levels determine PKB activity. Cell Signal. 2008;20(4):684-94.
131. Cannon JD, Cherian-Shaw M, Lovekamp-Swan T, Chaffin CL. Granulosa cell expression of G1/S phase cyclins and cyclin-dependent kinases in PMSG-induced follicle growth. Molecular and cellular endocrinology. 2007;264(1-2):6-15.
132. Jagarlamudi K, Liu L, Adhikari D, Reddy P, Idahl A, Ottander U, et al. Oocyte-specific deletion of Pten in mice reveals a stage-specific function of PTEN/PI3K signaling in oocytes in controlling follicular activation. PloS one. 2009;4(7):e6186.
133. Maehama T, Dixon JE. The tumor suppressor, PTEN/MMAC1, dephosphorylates the lipid second messenger, phosphatidylinositol 3,4,5-trisphosphate. J Biol Chem. 1998;273(22):13375-8.
134. Gonzalez-Robayna IJ, Falender AE, Ochsner S, Firestone GL, Richards JS. Follicle-Stimulating hormone (FSH) stimulates phosphorylation and activation of protein kinase

182
B (PKB/Akt) and serum and glucocorticoid-lnduced kinase (Sgk): evidence for A kinase-independent signaling by FSH in granulosa cells. Mol Endocrinol. 2000;14(8):1283-300.
135. Hunzicker-Dunn ME, Lopez-Biladeau B, Law NC, Fiedler SE, Carr DW, Maizels ET. PKA and GAB2 play central roles in the FSH signaling pathway to PI3K and AKT in ovarian granulosa cells. Proc Natl Acad Sci U S A. 2012.
136. Castrillon DH, Miao L, Kollipara R, Horner JW, DePinho RA. Suppression of ovarian follicle activation in mice by the transcription factor Foxo3a. Science. 2003;301(5630):215-8.
137. Alimonti A, Carracedo A, Clohessy JG, Trotman LC, Nardella C, Egia A, et al. Subtle variations in Pten dose determine cancer susceptibility. Nat Genet. 2010;42(5):454-8.
138. Berger AH, Knudson AG, Pandolfi PP. A continuum model for tumour suppression. Nature. 2011;476(7359):163-9.
139. Ferron M, Boudiffa M, Arsenault M, Rached M, Pata M, Giroux S, et al. Inositol polyphosphate 4-phosphatase B as a regulator of bone mass in mice and humans. Cell metabolism. 2011;14(4):466-77.
140. Watanabe S, Umehara H, Murayama K, Okabe M, Kimura T, Nakano T. Activation of Akt signaling is sufficient to maintain pluripotency in mouse and primate embryonic stem cells. Oncogene. 2006;25(19):2697-707.
141. Eppig JJ, Wigglesworth K, Hirao Y. Metaphase I arrest and spontaneous parthenogenetic activation of strain LTXBO oocytes: chimeric reaggregated ovaries establish primary lesion in oocytes. Dev Biol. 2000;224(1):60-8.
142. Hupalowska A, Kalaszczynska I, Hoffmann S, Tsurumi C, Kubiak JZ, Polanski Z, et al. Metaphase I arrest in LT/Sv mouse oocytes involves the spindle assembly checkpoint. Biol Reprod. 2008;79(6):1102-10.
143. Ciemerych MA, Kubiak JZ. Cytostatic activity develops during meiosis I in oocytes of LT/Sv mice. Dev Biol. 1998;200(2):198-211.
144. Hayashi S, Lewis P, Pevny L, McMahon AP. Efficient gene modulation in mouse epiblast using a Sox2Cre transgenic mouse strain. Gene expression patterns : GEP. 2002;2(1-2):93-7.
145. Lecureuil C, Fontaine I, Crepieux P, Guillou F. Sertoli and granulosa cell-specific Cre recombinase activity in transgenic mice. Genesis. 2002;33(3):114-8.
146. Miyazaki S, Shirakawa H, Nakada K, Honda Y. Essential role of the inositol 1,4,5-trisphosphate receptor/Ca2+ release channel in Ca2+ waves and Ca2+ oscillations at fertilization of mammalian eggs. Dev Biol. 1993;158(1):62-78.
183
147. Jellerette T, He CL, Wu H, Parys JB, Fissore RA. Down-regulation of the inositol 1,4,5-trisphosphate receptor in mouse eggs following fertilization or parthenogenetic activation. Dev Biol. 2000;223(2):238-50.
148. Wakai T, Vanderheyden V, Yoon SY, Cheon B, Zhang N, Parys JB, et al. Regulation of inositol 1,4,5-trisphosphate receptor function during mouse oocyte maturation. Journal of cellular physiology. 2012;227(2):705-17.
149. Mehlmann LM, Mikoshiba K, Kline D. Redistribution and increase in cortical inositol 1,4,5-trisphosphate receptors after meiotic maturation of the mouse oocyte. Dev Biol. 1996;180(2):489-98.
150. Uranga JA, Pedersen RA, Arechaga J. Parthenogenetic activation of mouse oocytes using calcium ionophores and protein kinase C stimulators. The International journal of developmental biology. 1996;40(2):515-9.