Role of Nicotinamide N methyltransferase in dorsal ... · Time spent in each chamber was measured...
13
-1- Supplementary Information 1 2 Role of Nicotinamide N-methyltransferase in dorsal striatum 3 in cocaine place preference 4 Running title: Role of NNMT in dorsal striatum in cocaine CPP 5 6 Li Luo 1, 3, # , Fei-Fei Shang 2, # , Hailei Long 1 , Linhong Jiang 1 , Ruiming Zhu 1 , Qian 7 Zhao 1 , Hui Gu 1 , Jueying Kong 1 , Wei Xu 1 , Yinglan Zhao 1 , Xiaobo Cen 1* 8 9 1 National Chengdu Center for Safety Evaluation of Drugs, State Key Laboratory of 10 Biotherapy and Cancer Center, West China Hospital, Sichuan University, and 11 Collaborative Innovation Center for Biotherapy, Chengdu 610041, P. R. China. 12 2 Institute of Life Sciences, Chongqing Medical University, Chongqing 400016, P. R. 13 China. 14 3 Chongqing Foreign Language School, Chongqing 400052, P. R. China. 15 16 * Correspondence: Dr. Xiaobo Cen, National Chengdu Center for Safety Evaluation of 17 Drugs, State Key Laboratory of Biotherapy and Cancer Center, West China Hospital of 18 Sichuan University, Gaopeng Street, Chengdu 610041, P. R. China. Tel: 19 +86-28-85178767, Fax: +86-28-85173043, E-mail: [email protected] 20 # These authors contributed equally to this work. 21 22 23
Transcript of Role of Nicotinamide N methyltransferase in dorsal ... · Time spent in each chamber was measured...
-1-
Supplementary Information 1
2
Role of Nicotinamide N-methyltransferase in dorsal striatum 3
in cocaine place preference 4
Running title: Role of NNMT in dorsal striatum in cocaine CPP 5
6
Li Luo1, 3, #, Fei-Fei Shang2, #, Hailei Long1, Linhong Jiang1, Ruiming Zhu1, Qian 7
Zhao1, Hui Gu1, Jueying Kong1, Wei Xu1, Yinglan Zhao1, Xiaobo Cen1* 8
9
1 National Chengdu Center for Safety Evaluation of Drugs, State Key Laboratory of 10
Biotherapy and Cancer Center, West China Hospital, Sichuan University, and 11
Collaborative Innovation Center for Biotherapy, Chengdu 610041, P. R. China. 12
2 Institute of Life Sciences, Chongqing Medical University, Chongqing 400016, P. R. 13
China. 14
3 Chongqing Foreign Language School, Chongqing 400052, P. R. China. 15
16
* Correspondence: Dr. Xiaobo Cen, National Chengdu Center for Safety Evaluation of 17
Drugs, State Key Laboratory of Biotherapy and Cancer Center, West China Hospital of 18
Sichuan University, Gaopeng Street, Chengdu 610041, P. R. China. Tel: 19
+86-28-85178767, Fax: +86-28-85173043, E-mail: [email protected] 20
# These authors contributed equally to this work. 21
22
23
-2-
Supplemental Figures 1
Figure S1 2
3
4
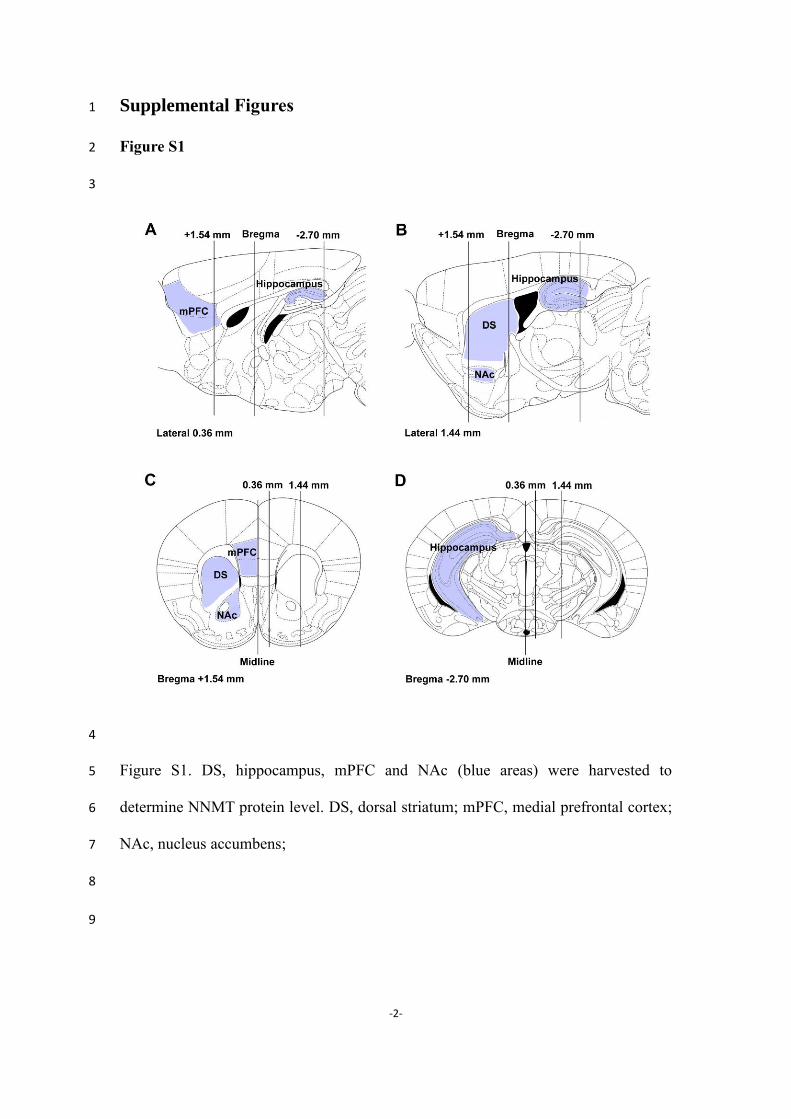
Figure S1. DS, hippocampus, mPFC and NAc (blue areas) were harvested to 5
determine NNMT protein level. DS, dorsal striatum; mPFC, medial prefrontal cortex; 6
NAc, nucleus accumbens; 7
8
9
-3-
Figure S2 1
2
3
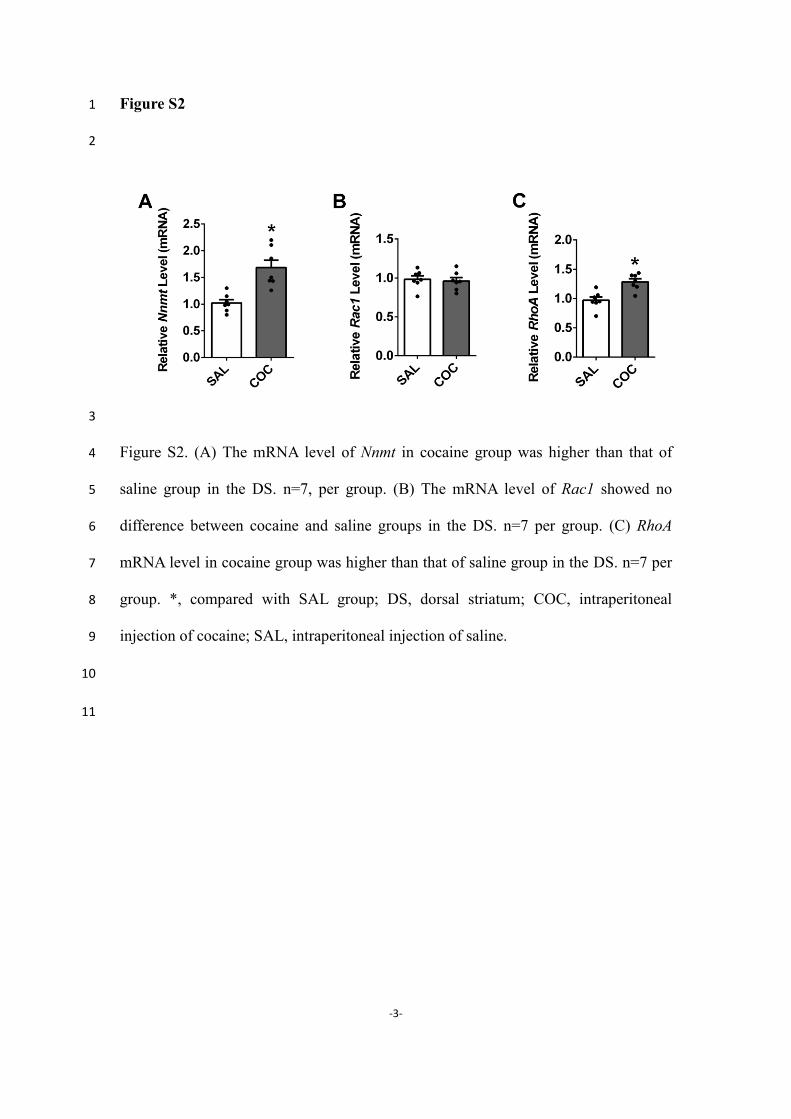
Figure S2. (A) The mRNA level of Nnmt in cocaine group was higher than that of 4
saline group in the DS. n=7, per group. (B) The mRNA level of Rac1 showed no 5
difference between cocaine and saline groups in the DS. n=7 per group. (C) RhoA 6
mRNA level in cocaine group was higher than that of saline group in the DS. n=7 per 7
group. *, compared with SAL group; DS, dorsal striatum; COC, intraperitoneal 8
injection of cocaine; SAL, intraperitoneal injection of saline. 9
10
11
-4-
Figure S3 1
2
3
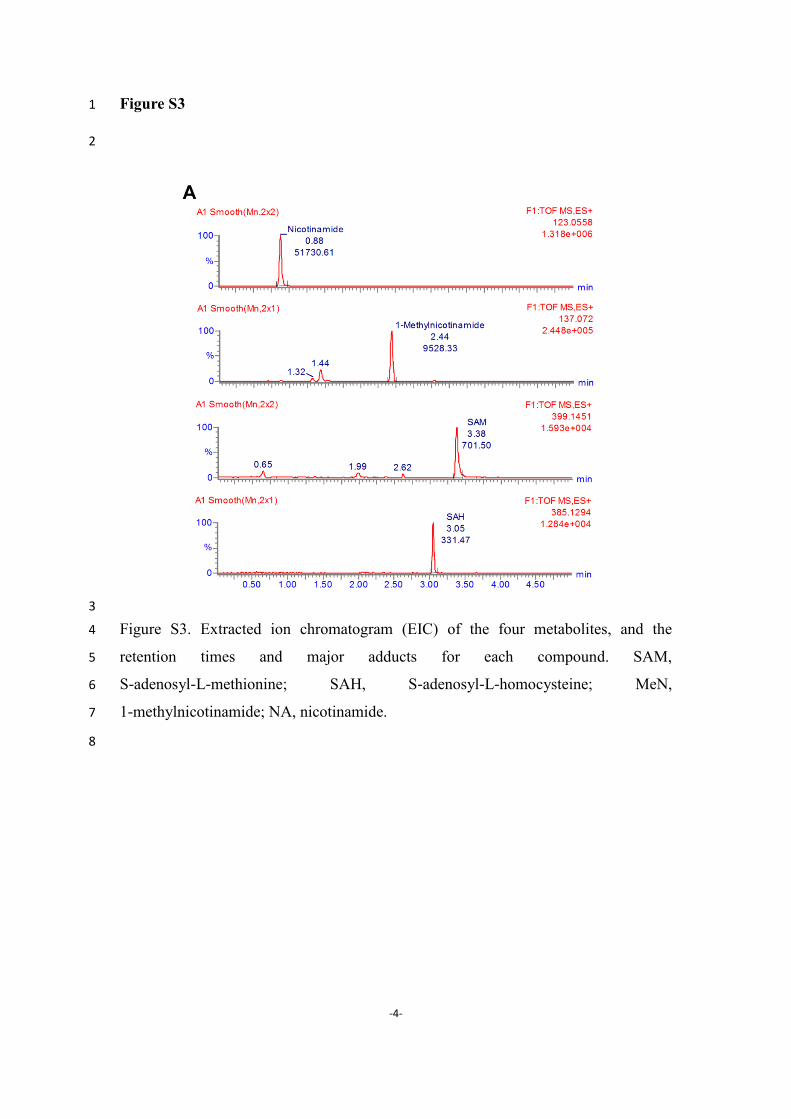
Figure S3. Extracted ion chromatogram (EIC) of the four metabolites, and the 4
retention times and major adducts for each compound. SAM, 5
S-adenosyl-L-methionine; SAH, S-adenosyl-L-homocysteine; MeN, 6
1-methylnicotinamide; NA, nicotinamide. 7
8

-5-
Figure S4 1
2
3
4
5
6
7
8
9
10
11
12
13
14
15
16
17
18
19
20
Figure S4. (A) Rac1 mRNA level showed no difference between 21
SAL+LV-NC-treated and COC+LV-NC-treated groups in the DMS. Nnmt knockdown 22
(COC+LV-Sh-Nnmt-treated group and SAL+LV-Sh-Nnmt-treated group) did not 23
modify Rac1 mRNA expression. n=7 per group. (B) RhoA mRNA level increased 24
after COC+LV-NC treatment, but decreased after LV-Sh-Nnmt treatment. n=7 per 25
group. (C) Lcmt1 mRNA level showed no difference after COC or LV-Sh-Nnmt 26
treatment in the DMS. n=7 per group. (D) LCMT1 protein level showed no difference 27
among the four groups. n=8 per group. *, compared with SAL+LV-NC group; #, 28
compared with COC+LV-NC group; DMS, dorsomedial striatum; COC, 29
intraperitoneal injection of cocaine; SAL, intraperitoneal injection of saline; LV-NC, 30
intra-DMS injection of negative control lentivirus expressing scrambled shRNA; 31
LV-Sh-Nnmt, intra-DMS injection of lentivirus expressing NNMT shRNA. 32
33

-6-
Figure S5 1
2
Figure S5. The melt peaks of primers which were used for RT-PCR test. 3
4
5
Figure S6 6
7
8
9
10
11
12
13
Figure S6. The plasmids design and construction of Nnmt-shRNA and control 14
lentivirus. 15
16
Nnmt-shRNA
The plasmid of Nnmt-shRNA lentivirus
Scrambled shRNA
The plasmid of control lentivirus
-7-
Supplemental Tables 1
Table S1 2
3
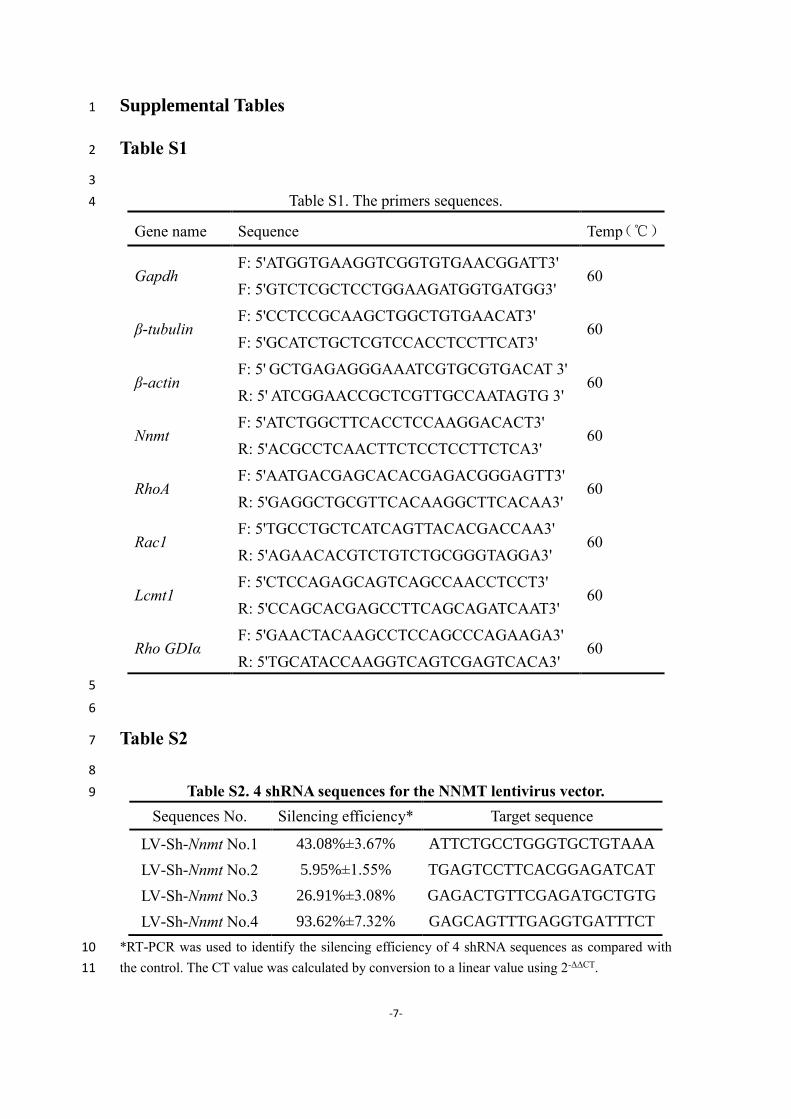
Table S1. The primers sequences. 4
Gene name Sequence Temp(℃)
Gapdh F: 5'ATGGTGAAGGTCGGTGTGAACGGATT3'
60 F: 5'GTCTCGCTCCTGGAAGATGGTGATGG3'
β-tubulin F: 5'CCTCCGCAAGCTGGCTGTGAACAT3'
60 F: 5'GCATCTGCTCGTCCACCTCCTTCAT3'
β-actin F: 5' GCTGAGAGGGAAATCGTGCGTGACAT 3'
60 R: 5' ATCGGAACCGCTCGTTGCCAATAGTG 3'
Nnmt F: 5'ATCTGGCTTCACCTCCAAGGACACT3'
60 R: 5'ACGCCTCAACTTCTCCTCCTTCTCA3'
RhoA F: 5'AATGACGAGCACACGAGACGGGAGTT3'
60 R: 5'GAGGCTGCGTTCACAAGGCTTCACAA3'
Rac1 F: 5'TGCCTGCTCATCAGTTACACGACCAA3'
60 R: 5'AGAACACGTCTGTCTGCGGGTAGGA3'
Lcmt1 F: 5'CTCCAGAGCAGTCAGCCAACCTCCT3'
60 R: 5'CCAGCACGAGCCTTCAGCAGATCAAT3'
Rho GDIα F: 5'GAACTACAAGCCTCCAGCCCAGAAGA3'
60 R: 5'TGCATACCAAGGTCAGTCGAGTCACA3'
5
6
Table S2 7
8
Table S2. 4 shRNA sequences for the NNMT lentivirus vector. 9
Sequences No. Silencing efficiency* Target sequence
LV-Sh-Nnmt No.1 43.08%±3.67% ATTCTGCCTGGGTGCTGTAAA
LV-Sh-Nnmt No.2 5.95%±1.55% TGAGTCCTTCACGGAGATCAT
LV-Sh-Nnmt No.3 26.91%±3.08% GAGACTGTTCGAGATGCTGTG
LV-Sh-Nnmt No.4 93.62%±7.32% GAGCAGTTTGAGGTGATTTCT
*RT-PCR was used to identify the silencing efficiency of 4 shRNA sequences as compared with 10
the control. The CT value was calculated by conversion to a linear value using 2-ΔΔCT. 11

-8-
Supplementary Methods 1
2
Drugs 3
Cocaine hydrochloride was purchased from the National Institute for the Control of 4
Pharmaceutical and Biological Products (Beijing, China). MeN was purchased from 5
Sigma-Aldrich (St. Louis, MO, USA). They were dissolved in 0.9% sterile saline to 6
obtain appropriate concentration for experiment. 7
8
Animals 9
Adult male C57BL/6J mice, weighing 20 to 22 g, were purchased from Vital River 10
Laboratory Animal Technology Co. Ltd (Beijing, China). The mice were housed in 11
polypropylene cages with stainless steel grids in a climate-controlled room 12
(temperature of 22 ± 2℃, relative humidity of 50 ± 5%) on a 12-hour reversed 13
light/dark cycle (lights on from 7:00 A.M. to 7:00 P.M.). The mice were acclimatized 14
to the housing conditions and handling for 7 days before experiment. Food and water 15
were freely available. All of the animal protocols were reviewed and approved by the 16
Experimental Animal Ethics Committee of Sichuan University (Chengdu, China). 17
18
Conditioned place preference (CPP) procedure 19
As described previously (Li et al, 2015), place conditioning studies were conducted 20
utilizing a shuttle box. After being acclimatized the place conditioning, each mouse 21
was placed in the neutral smaller chamber (middle) and allowed to explore freely in 22
the three chambers (left white, middle gray and right black) for 15 min to test its 23
inherent preference on day 0. Time spent in each chamber was measured by motion 24
detecting software. Time spent in black chamber minus time spent in white chamber 25
was baseline (Tb). The positive baseline meant mouse preferred black chamber; and 26
the negative baseline meant mouse preferred white chamber. Mice with a chamber 27
preference baseline greater than 250 s were excluded from studies. We used a ‘biased’ 28
CPP procedure in which mice were injected with cocaine in the initially non-preferred 29
chamber. In cocaine group, on days 1, 3 and 5, mice were injected intraperitoneally 30
with cocaine at a dose of 20 mg/kg and kept in non-preferred chamber by closing the 31
removable wall for 30 min. On days 2, 4 and 6, the mice were injected 32

-9-
intraperitoneally with 0.9% sterile saline and kept in preferred chamber for 30 min. In 1
control group, 0.9% sterile saline replaced cocaine. Other experiment conditions were 2
the same as cocaine group. On day 7, each mouse was placed in the neutral start 3
chamber and allowed to explore freely in the three chambers for 15 min and the time 4
spent in each chamber was recorded (Figure 1A). Time spent in black chamber minus 5
time spent in white chamber was the time change (Te). The CPP scores were 6
calculated as follow. If Tb was positive (mouse preferred black chamber), Tb minus Te, 7
positive scores meant reversed preference, and negative scores meant reinforce 8
preference. If Tb was negative (mouse preferred white chamber), Te minus Tb, positive 9
scores meant reversed preference, and negative scores meant reinforced preference. 10
Generally, cocaine strongly reverses preference, and shows positive CPP scores. 11
12
Protein extraction and western blot analysis 13
Mice were sacrificed by cervical dislocation. Specimens of bilateral brain regions 14
were dissected immediately, snap-frozen in liquid nitrogen, and stored at -80°C until 15
analysis. The tissues were homogenized in RIPA lysis buffer containing proteinase 16
inhibitor. After centrifugation, supernatants were collected and concentrations of 17
proteins were determined using a BCA Protein Quantification Kit (Bio-Rad). Then 18
denatured protein sample was loaded onto 15% SDS-PAGE and then transferred on 19
PVDF membranes. After being blocked with 5% non-fat milk at room temperature for 20
1.5 h, membranes were incubated with primary antibodies overnight at 4°C. The 21
primary antibodies used were as follows: mouse anti-NNMT (1:500, Abcam), mouse 22
anti-Rac1 (1:1000, Abcam), rabbit anti-RhoA (1:1000, Abcam), rabbit anti-LCMT1 23
(1:1000, Abcam), rabbit anti-Rho GDIα (1:1000, Abcam), rabbit anti-B-tubulin 24
(1:2000, ABclonal). After washing three times in TBST, the membranes were 25
incubated with respective secondary antibodies for 1.5 h at room temperature. After 26
washing the membranes were incubated in Immobilon™ Western Chemiluminescent 27
HRP Substrate for 5 min and then exposed to an X-ray film for an appropriate 28
duration. 29
30
RNA extraction and qPCR analysis 31
Brain regions were stored in RNAstore buffer (Tiangen) at -80°C until analysis. Total 32
RNA was extracted using TRIzol reagent (Life Technologies). For each sample, 2500 33
-10-
ng of RNA was reverse-transcribed to cDNA using a BestarTM qPCR RT Kit (DBI 1
Bioscience). Quantitative real-time RT-PCR (qRT-PCR) was performed using cDNA 2
as a template in a 20 µl reaction mixture containing specific primers (TsingKe Biotech, 3
China). The reaction was conducted in a CFX-96 machine (Bio-Rad) with Stormstar 4
Real time PCR Master Mix (SYBR Green) according to the following standard 5
protocol: one cycle of 95°C for 2 min, followed by 40 cycles of 95°C for 10 s, 60°C 6
for 30 s. The primers were listed in Supplementary Table S1. And the melt peaks 7
were shown in Supplementary Figure S5. Relative mRNA level of each gene was 8
calculated by normalizing to the geometric mean of 3 housekeeping genes and then to 9
a control. The relative expression levels were calculated by conversion to a linear 10
value using 2-ΔΔCT (Kurrasch et al, 2004). 11
12
Targeted hydrophilic interaction chromatography (HILIC) with mass 13
spectrometry 14
Metabolites NA, MeN, SAM, and SAH were measured using tandem mass 15
spectrometry (Sperber et al, 2015). Each sample was extracted by adding 200 µl cold 16
mixture of methanol and water (3:1). The samples were homogenized after 17
ultrasonication and centrifuged for 10 min at 14000 g. The supernatant was 18
transferred and then the supernatant was dried by nitrogen, and subsequently stored at 19
-80°C for further use. Each sample was re-suspended using 70 µl 80:20 20
acetonitrile/water, vortexed, and centrifuged for 10 min at 14000 g. Hydrophilic 21
interaction chromatography (HILIC) analysis of samples was performed using a 22
Waters Ultrahigh Pressure Liquid Chromatography stack equipped with an 23
auto-sampler (7°C) using 3 µl injections into an Acquity UPLC BEH Amide column 24
(1.7µm, 2.1×100mm, Waters). Mobile phase A consisted of 10 mM ammonium 25
formate and 0.125% formic acid in 100% LC-MS-grade water, and mobile phase B 26
was 95:5 acetonitrile/water. Metabolites were detected and quantified by an Waters 27
Xevo G2-S accurate mass quadrupole time-of-flight (QTOF) mass spectrometer with 28
a jet stream ESI source in positive ion mode. Data files were analyzed using Waters 29
Masslynx Analysis software. Retention times and major adducts for each compound 30
are as follows: MeN (m/z 137.0715) 2.44min, NA (m/z 123.0558) 0.88 min M + H, 31
SAH (m/z 385.1294) 3.05 min M + H, SAM (m/z 399.1451) 3.38 min. According to 32
the above information, peak areas from the total ion current for each metabolite were 33
-11-
integrated by using Waters Masslynx Analysis software. 1
2
Rac1 and RhoA activation assay 3
Rac1 and RhoA activation assay was performed using Rac1 and RhoA Activation 4
Assay Kit (NewEast Bioscience), respectively. Briefly, the protein was extracted by 5
RIPA lysis buffer containing proteinase inhibitor PMSF. Supernatants were collected 6
and performed active Rac1 or RhoA pull-down assay as following. Adjust the volume 7
of each sample to 1 ml with lysis buffer. Each sample was quickly added 200 µl of 8
re-suspended A/G agarose bead slurry, and incubated at 4 °C for 1 h with gentle 9
agitation. After centrifuging, the supernatant was discarded. After being washed 3 10
times with 1 ml lysis buffer, the bead was thoroughly re-suspended using 20 µl of 11
2×reducing SDS-PAGE sample buffer. The samples were denatured at 100°C for 10 12
min, and centrifuged at 5000 g for 30 s. Supernatant of each sample was used for 13
western blot analysis. Samples without active Rac1 or RhoA pull-down assay added 14
loading buffer were denatured at 100°C for 10 min, of which 15 µl used for western 15
blot analysis to detect the total -tubulin and total Rac1 or RhoA of each sample. 16
17
Lentivirus injection 18
We designed 4 shRNA sequences targeting Nnmt (ID: 18113). The psi-LVRH1GP 19
vector was used to express Nnmt interference sequence. The negative control (NC) 20
vector expressed scrambled shRNA, which was generally applied as the control and 21
theoretically had no effect on any gene. The plasmids design and construction of 22
Nnmt-shRNA and control lentivirus were shown in Supplementary Figure S6. The 23
lentivirus was packaged by viral packaging system (GeneCopoeia, China) in 293T 24
cells. NIH/3T3 cells were transfected with the lentivirus, and the silencing efficiency 25
was examined by RT-PCR. The results revealed that No.4 sequence downregulated 26
Nnmt mRNA significantly (Supplementary Table S2). The target sequence of No.4 27
was GAGCAGTTTGAGGTGATTTCT. 28
Mice were anaesthetized with 60 mg/kg ketamine and 0.25 mg/kg medetomidine (i.p.) 29
and positioned in stereotaxic apparatus. According to the mouse brain in stereotaxic 30
coordinates, the cranial surface above the DS was exposed using surgical scissors, and 31
spiral microinfusion pump was bilaterally lowered into the dorsomedial striatum 32
(DMS) to infuse 0.5 μl/one side of virus (AP +0.55 mm; ML ±1.5 mm; DV -3.3 mm) 33
-12-
(KBJ., 2012; Xu et al, 2015). Infusions were administered at a rate of 0.1 μl/min and 1
kept 5 min before removing the spiral microinfusion pump. After the wound was 2
stitched, mice were recuperated for at least 7 days. 3
4
Co-immunoprecipitation (Co-IP) analysis 5
We used the commercial co-IP assay kit (Thermo ScientificTM PierceTM Crosslink 6
Magnetic co-IP Kit) and a Rho GDIα antibody to detect the association of Rho GDIα 7
with Rac1/RhoA. Briefly, Rho GDIα primary antibody was bound to 25 µl beads for 8
15 min. After being washed three times, antibody was crosslinked to beads with DSS 9
for 30 min. Then the tissues protein was extracted in RIPA lysis buffer containing 10
proteinase inhibitor. Protein supernatants were collected and concentrations of 11
proteins were determined using a BCA Protein Quantification Kit (Bio-Rad). Each 12
ample was incubated with antibody-crosslinked beads for overnight at 4°C. Beads 13
were then washed two times with IP lysis/wash buffer and one time with ultrapure 14
water. Elution buffer eluted bound antigen. Neutralization buffer neutralized the low 15
pH. The supernatant was used for western blot analysis. 16
17
Statistical analysis 18
Statistical analysis was performed with IBM SPSS version 20.0.0. Statistical analysis 19
was performed by one-way ANOVA for data involving more than two groups. Two 20
groups were analyzed using a Student's t-test with a two-tailed p-value. Lentivirus or 21
MeN effects on CPP scores were assessed using two-way ANOVAs. All summary 22
statistics of the results are presented as Mean ± SEM. P<0.05 was considered 23
statistically significant. Most of the graphs were made by GraphPad Prism 6.0 24
(GraphPad Software Inc., San Diego). 25
26
27
References: 28
KBJ. PGF (2012). The Mouse Brain in Stereotaxic Coordinates., 4th edn. Academic, San Diego. 29
30
Kurrasch DM, Huang J, Wilkie TM, Repa JJ (2004). Quantitative real-time polymerase chain reaction 31
measurement of regulators of G-protein signaling mRNA levels in mouse tissues. Methods in 32
enzymology 389: 3-15. 33
34
-13-
Li Y, Zhu R, Wang W, Fu D, Hou J, Ji S, et al (2015). Arginine Methyltransferase 1 in the Nucleus 1
Accumbens Regulates Behavioral Effects of Cocaine. J Neurosci 35(37): 12890-12902. 2
3
Sperber H, Mathieu J, Wang Y, Ferreccio A, Hesson J, Xu Z, et al (2015). The metabolome regulates the 4
epigenetic landscape during naive-to-primed human embryonic stem cell transition. Nat Cell Biol 5
17(12): 1523-1535. 6
7
Xu M, Kobets A, Du JC, Lennington J, Li L, Banasr M, et al (2015). Targeted ablation of cholinergic 8
interneurons in the dorsolateral striatum produces behavioral manifestations of Tourette syndrome. 9
Proc Natl Acad Sci U S A 112(3): 893-898. 10
11
12