ROLE OF INFRASTRUCTURAL GROWTH FOR …internationalseminar.org/XVII_AIS/TS2_PDF/2.Indranil...
24
XVII Annual International Seminar Proceedings; January, 2016 ISBN no. 978-81-923211-8-9 http://www.internationalseminar.in/XVII_AIS/INDEX.HTM Page 246 ROLE OF INFRASTRUCTURAL GROWTH FOR ENTREPRENEURIAL DEVELOPMENT: A STUDY IN DURGAPUR Indranil Mutsuddi Assistant Professor, Department of Management Studies, Delhi School of Professional Studies & Research ABSTRACT Keeping in view with India’s vision of “Make-in-India”, entrepreneurial development has emerged as a key strategic factor for boosting economic growth and development in the nation. Policy makers and economists are of the opinion that apart from skill development at the grass root level, other factors like infrastructure development, resource mobilization and capability development would be considered to be important for achieving and sustaining such ambitious goals. Although in recent times the country had witnessed intensified infrastructural growth boosting industrial expansion and entrepreneurial growth in metropolitan cities like Bengaluru, NCR, Mumbai, Chennai, Kolkata and high profile industrial hubs like Ahmedabad, Surat etc., old industrial hubs like Durgapur, West Bengal had witnessed issues of difficulty due to lack of proper infrastructure. Taking this theme into consideration, an attempt had been in this study to understand and analyze the perception of entrepreneurs and senior employees belonging to the higher managerial grades in new ventures located in and around the city of Durgapur, West Bengal regarding the role of infrastructure and their perceptions on various infrastructure related issues considered important for entrepreneurial development in the region. With the “Make-in- India” vision looming large and leading policy makers, economic experts and industry captains to bring about re-thinking and wide scale changes in business practices across the country, the study could be considered useful considering its inclusiveness in the perspective of small and developing industrial hubs in and around the nation. Key Words: Make In India, Entrepreneurial Development, Infrastructural development, Economic Growth and Development, resource mobilization, entrepreneurs
-
Upload
phungduong -
Category
Documents
-
view
219 -
download
0
Transcript of ROLE OF INFRASTRUCTURAL GROWTH FOR …internationalseminar.org/XVII_AIS/TS2_PDF/2.Indranil...
XVII Annual International Seminar Proceedings; January, 2016
ISBN no. 978-81-923211-8-9 http://www.internationalseminar.in/XVII_AIS/INDEX.HTM Page 246
ROLE OF INFRASTRUCTURAL GROWTH FOR ENTREPRENEURIAL
DEVELOPMENT: A STUDY IN DURGAPUR
Indranil Mutsuddi
Assistant Professor,
Department of Management Studies,
Delhi School of Professional Studies & Research
ABSTRACT
Keeping in view with India’s vision of “Make-in-India”, entrepreneurial development has
emerged as a key strategic factor for boosting economic growth and development in the nation.
Policy makers and economists are of the opinion that apart from skill development at the grass
root level, other factors like infrastructure development, resource mobilization and capability
development would be considered to be important for achieving and sustaining such ambitious
goals. Although in recent times the country had witnessed intensified infrastructural growth
boosting industrial expansion and entrepreneurial growth in metropolitan cities like Bengaluru,
NCR, Mumbai, Chennai, Kolkata and high profile industrial hubs like Ahmedabad, Surat etc.,
old industrial hubs like Durgapur, West Bengal had witnessed issues of difficulty due to lack of
proper infrastructure. Taking this theme into consideration, an attempt had been in this study to
understand and analyze the perception of entrepreneurs and senior employees belonging to the
higher managerial grades in new ventures located in and around the city of Durgapur, West
Bengal regarding the role of infrastructure and their perceptions on various infrastructure related
issues considered important for entrepreneurial development in the region. With the “Make-in-
India” vision looming large and leading policy makers, economic experts and industry captains
to bring about re-thinking and wide scale changes in business practices across the country, the
study could be considered useful considering its inclusiveness in the perspective of small and
developing industrial hubs in and around the nation.
Key Words: Make In India, Entrepreneurial Development, Infrastructural development,
Economic Growth and Development, resource mobilization, entrepreneurs
XVII Annual International Seminar Proceedings; January, 2016
ISBN no. 978-81-923211-8-9 http://www.internationalseminar.in/XVII_AIS/INDEX.HTM Page 247
INTRODUCTION
Infrastructural growth had played a crucial role in the economic development of a nation. Chan
et al, (2009) had described infrastructure as a heterogeneous term which includes physical
infrastructure like roads, electricity, water, land, technology etc used by industrial units as inputs
for the production of goods and services. Infrastructure on the other hand may influence an
organization’s output in ways such as directly enhancing the productivity of the firm irrespective
of the sector to which it belongs. This in turn contributes to the GDP and also as inputs for other
industrial or organizational activities in the economy. On the indirect perspective, infrastructure
enhances total factor productivity by reducing transaction and other associated costs thereby
enhancing the cost efficiency as well as the productivity of the organization. In this perspective
several authors like Newberry (2012) had considered infrastructure as a complementary factor
for economic growth. Other authors like Ratner (1983), Aschauer (1989) and Mitsui & Inoue
(1995) had also pointed out that infrastructure has a facilitating impact on organizational
productivity and new venture creation.
Hence the role of infrastructure in terms of facilitating entrepreneurship remains easily
understood. But from the research point of view it is necessary for us to know that whether the
present state of existence in infrastructure is supportive or conducive to promote new venture
creation and development in developing towns and industrial hubs in the country. With the
nation closely harnessing the “Make-in-India” vision the importance of such a study from an
entrepreneurial point of view could be considered to be important.
RATIONALE BEHIND THE STUDY
Entrepreneurship and infrastructural development of a nation are both critical for contributing to
the socio-economic growth and development. These two could be considered as the pillars of a
nation’s future and economic sustainability. At present keeping in mind, Prime Minister
Narendra Modi’s vision of “Make-in-India”, the Government of India had proposed and initiated
a number of policy reforms to boost infrastructural development and entrepreneurial growth
across the country. As for example, in the 2015-2016 annual budget, the Government had
proposed growth in the investment on infrastructure by Rs 70,000 crores. On the other hand, in

XVII Annual International Seminar Proceedings; January, 2016
ISBN no. 978-81-923211-8-9 http://www.internationalseminar.in/XVII_AIS/INDEX.HTM Page 248
order to boost new venture creation and widespread skill development, the Government had
announced the National Skills Development Mission for implementing human resource
development. Further emphasis had been given on to revamp and boost private-public
partnership models to scale up projects and new venture initiatives across the country. Another
promising perspective of the present year budget had been the news that the MUDRA (Micro
Units Development Refinance Agency) Bank would have a corpus of Rs 20,000 crore and a
credit guarantee of Rs 3000 crore. All these initiatives indicate that the Government’s “Make-in-
India” vision has a clear cut purpose to boost the country’s infrastructure and entrepreneurial
development. Taking this perspective into consideration there is a need for researchers to have an
understanding whether infrastructural development would have any impact on entrepreneurial
growth. This issue would be particularly important for developing small towns and growing
industrial hubs like that of Durgapur, in the state of West Bengal.
OBJECTIVES OF THE STUDY
The objectives of the study were as follows:
To study the perception of entrepreneurs and employees working in senior managerial
positions in new ventures located in and around the city of Durgapur regarding the role of
infrastructural growth for entrepreneurial development in the region
To study and analyze the opinion of the entrepreneurs on infrastructure issues which
affect their operations and business in the region.
To study the interrelationship between infrastructural development and perception
regarding entrepreneurial growth in the region.
HYPOTHESIS
Infrastructural development in and around the city of Durgapur has no significant
interrelationship with entrepreneurial growth.
Infrastructure supporting operational standards and quality in entrepreneurial ventures
has no significant interrelationship with Entrepreneurial Growth & Development.
LITERATURE REVIEW

XVII Annual International Seminar Proceedings; January, 2016
ISBN no. 978-81-923211-8-9 http://www.internationalseminar.in/XVII_AIS/INDEX.HTM Page 249
The role of infrastructure on entrepreneurship and SMEs has been well researched and
documented. Infrastructure affects the ability of a region to retain and attract people as well as
businesses (OECD, 2006a).
Provision for adequate infrastructure provision and infrastructure quality had been reported to be
important drivers for laying foundation to new ventures and boosting subsequent economic
growth in a region (Nerlinger, 1996; Almus et al., 2001; Engel and Fier, 2000). Similar opinion
was given by Melissa Fry Konty, (2008) and Van de Ven, A.H. (1993). Van de Ven, A.H. (1993)
had stated that emergence of an industrial infrastructure was important for economic growth and
new venture development.
North and Smallbone (1996) in their research had given importance on the need to develop
infrastructure in order to promote entrepreneurship, which could be further boosted by fostering
ongoing training and development of human capabilities; as well as up-gradation of the physical
and social infrastructure in region; and bringing about strategies and measures which play
important role for overcoming barriers to innovation and new venture development. Reynolds et
al (2000) had also explained the importance of infrastructure for entrepreneurial development in
their famous GEM (Global Entrepreneurship Monitor) model as depicted the following Fig 1.
Fig 1: GEM Model of Reynolds et al (2000)
In a particular region growth and development of adequate infrastructural facilities in order to
promote entrepreneurship influences not only start-ups, but also facilitates the development of

XVII Annual International Seminar Proceedings; January, 2016
ISBN no. 978-81-923211-8-9 http://www.internationalseminar.in/XVII_AIS/INDEX.HTM Page 250
the entire business ecosystem in the region. However, in-depth research evidence on the role of
business environment and infrastructure supporting entrepreneurship development remains
limited (Forbes and Kirsch, 2011; Chandler and Lyon 2001; Davidsson and Wiklund 2001).
Birley and Westhead (1994) had shown that entrepreneurial pursuits are supported by a wide
range of factors like business environment (including infrastructure), wealth, desire for personal
development and the need for approval from the society.
RESEARCH METHODS
The study was based on descriptive research design. In order to fulfill the objectives of the study,
the data was collected from both the primary and secondary sources. Primary data was collected
by means of questionnaire administration. The respondents were be contacted through personal
interactions inside/outside their organizations as well as through emails. The secondary data used
in the study were collected from internet resources, journals, Magazines, etc. The population
considered for the study was infinite and included entrepreneurs and senior management
employees in and around the industrial hub of Durgapur, West Bengal. Data was be collected by
administering structured questionnaires designed using Likert scaling (with a scale of 1 to 5).
The sample consisted of about 50 respondents comprising of entrepreneurs and their senior
management employees from various entrepreneurial firms in and around Durgapur.
Convenience sampling was used to collect the opinion of the respondents. The data collected
from the study were analyzed by the use of SPSS applications.
DATA ANALYSIS
Respondent Profile
It is evident from Table 1, out of 50 people, 78% of the respondents (39) were entrepreneurs
(owners of firms) and 22% (11) were senior management employees working in entrepreneurial
firms. Out of 39 entrepreneurs, 69.2% belonged to the age group of 31-40 tears and 30.8% were
representing the age category of 41-50 years. Whereas in case of 11 senior management
employees participating in the study, 63.6% respondents belonged to the age category of 31-
40years and 36.4% were representing 41-50 years age groups.

XVII Annual International Seminar Proceedings; January, 2016
ISBN no. 978-81-923211-8-9 http://www.internationalseminar.in/XVII_AIS/INDEX.HTM Page 251
Table 1: Position * Age Crosstabulation
Age
Total 31-40yrs 41-50yrs
Position Owner Count 27 12 39
% within
Position
69.2% 30.8% 100.0%
% within Age 79.4% 75.0% 78.0%
% of Total 54.0% 24.0% 78.0%
Senior Mgt
Employee
Count 7 4 11
% within
Position
63.6% 36.4% 100.0%
% within Age 20.6% 25.0% 22.0%
% of Total 14.0% 8.0% 22.0%
Total Count 34 16 50
% within
Position
68.0% 32.0% 100.0%
% within Age 100.0% 100.0% 100.0%
% of Total 68.0% 32.0% 100.0%
Table 2, depicts the annual turnover of the entrepreneurial firms to which the respondents
belonged. 66% respondents said that their firms had an annual turnover of Rs 51 lakh/annum,
28% said that they had Rs 41-50 Lakh/annum turnover. 6% had annual turnover of Rs 31-
40Lakh/annum.
Table 2: Annual Turnover
Frequency Percent Valid Percent
Cumulative
Percent

XVII Annual International Seminar Proceedings; January, 2016
ISBN no. 978-81-923211-8-9 http://www.internationalseminar.in/XVII_AIS/INDEX.HTM Page 252
Valid 31-40 Lakh/Annum 3 6.0 6.0 6.0
41-50 Lakh/Annum 14 28.0 28.0 34.0
Above 51
Lakh/Annum
33 66.0 66.0 100.0
Total 50 100.0 100.0
Respondent opinion on various aspects of Entrepreneurial Development in the region to
which they belonged
Table 3 shows the descriptive statistics of respondent opinion regarding various issues related to
entrepreneurial development in Durgapur region.
Table 3: Descriptive Statistics
N Mean
Std.
Deviation
Steady Entrepreneurial
Development
50 3.40 0.030
Encouragement for
Entrepreneurship
50 3.24 .081
Satisfaction with
Entrepreneurial
Development in the
region
50 3.14 .048
Support for
Entrepreneurship
50 3.32 .468
Encouraging past
records of
entrepreneurial growth
50 3.24 .344

XVII Annual International Seminar Proceedings; January, 2016
ISBN no. 978-81-923211-8-9 http://www.internationalseminar.in/XVII_AIS/INDEX.HTM Page 253
Societal Support for
Entrepreneurship
50 4.00 .682
Institutional & Statutory
Support for
Entrepreneurial
Development
50 3.26 .886
Valid N (listwise) 50
Societal support received the highest mean score of 4.00, showing that the community in and
around Durgapur encouraged entrepreneurial pursuits. Steady entrepreneurial development in the
region received a moderate mean score of 3.40, followed by support for entrepreneurship
receiving a mean score of 3.32. On the contrary satisfaction with entrepreneurial development in
the region received the lowest mean score of 3.14.
Respondent opinion regarding various issues related to Infrastructure
Table 4 shows the descriptive statistics regarding the analysis of various factors or issues related
to infrastructure in and around Durgapur. It is seen that, the statement infrastructure supporting
operational standards and quality received the highest mean score of 3.64, followed by the
statement infrastructure supporting uninterrupted supply chain receiving a mean score of 3.48.
The statement region has optimal infrastructure received the least mean score of 2.98.
Table 4: Descriptive Statistics
N Mean
Std.
Deviation

XVII Annual International Seminar Proceedings; January, 2016
ISBN no. 978-81-923211-8-9 http://www.internationalseminar.in/XVII_AIS/INDEX.HTM Page 254
Region has optimal
infrastructure
50 2.98 .779
Adequacy of
Infrastructure
50 3.02 .769
Infrastructure
supporting business
needs
50 3.06 .640
Infrastructure
supporting uninterrupted
supply chain
50 3.48 .562
Infrastructure
supporting customer
needs
50 3.14 .683
Infrastructure
supporting operational
standards & quality
50 3.64 .421
Valid N (listwise) 50
Impact of infrastructure supporting operational standards and quality on Entrepreneurial
Growth & Development
Considering the favorable opinion of the respondents towards infrastructure supporting
operational standards & quality (Table 4), factor analysis was done in order to understand the
impact of infrastructure supporting operational standards and quality on entrepreneurial growth
and development.
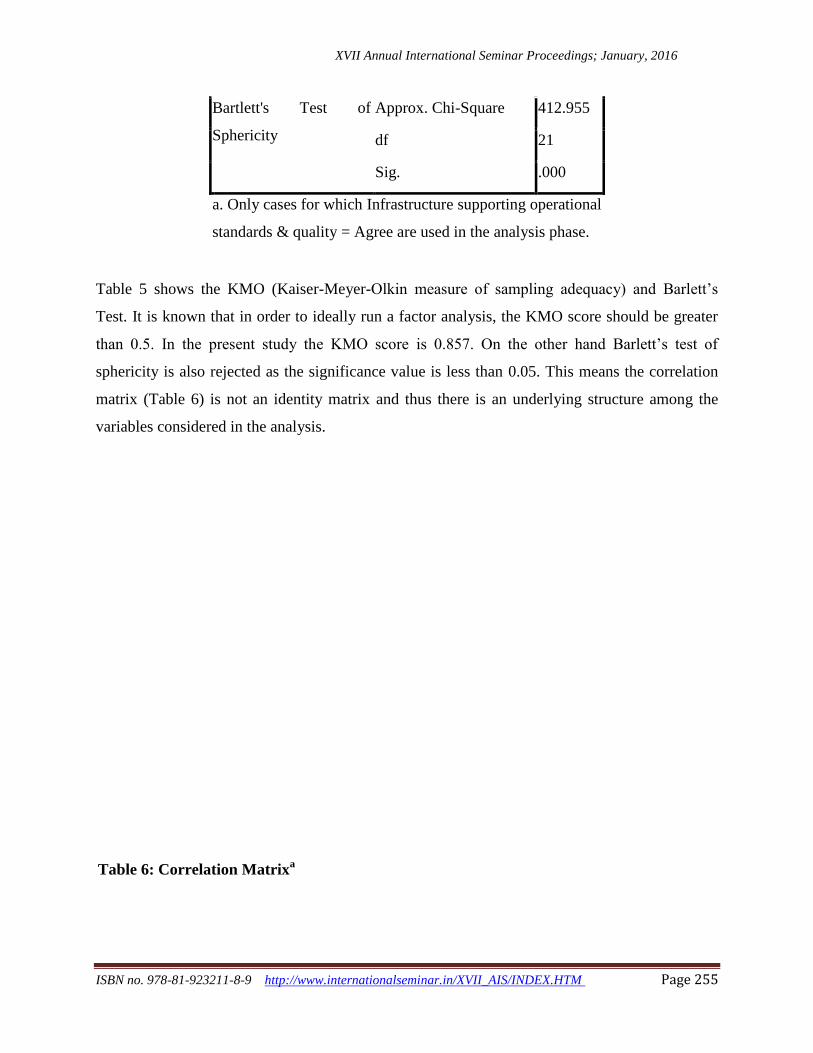
Table 5: KMO and Bartlett's Testa
Kaiser-Meyer-Olkin Measure of Sampling
Adequacy.
.857
XVII Annual International Seminar Proceedings; January, 2016
ISBN no. 978-81-923211-8-9 http://www.internationalseminar.in/XVII_AIS/INDEX.HTM Page 255
Bartlett's Test of
Sphericity
Approx. Chi-Square 412.955
df 21
Sig. .000
a. Only cases for which Infrastructure supporting operational
standards & quality = Agree are used in the analysis phase.
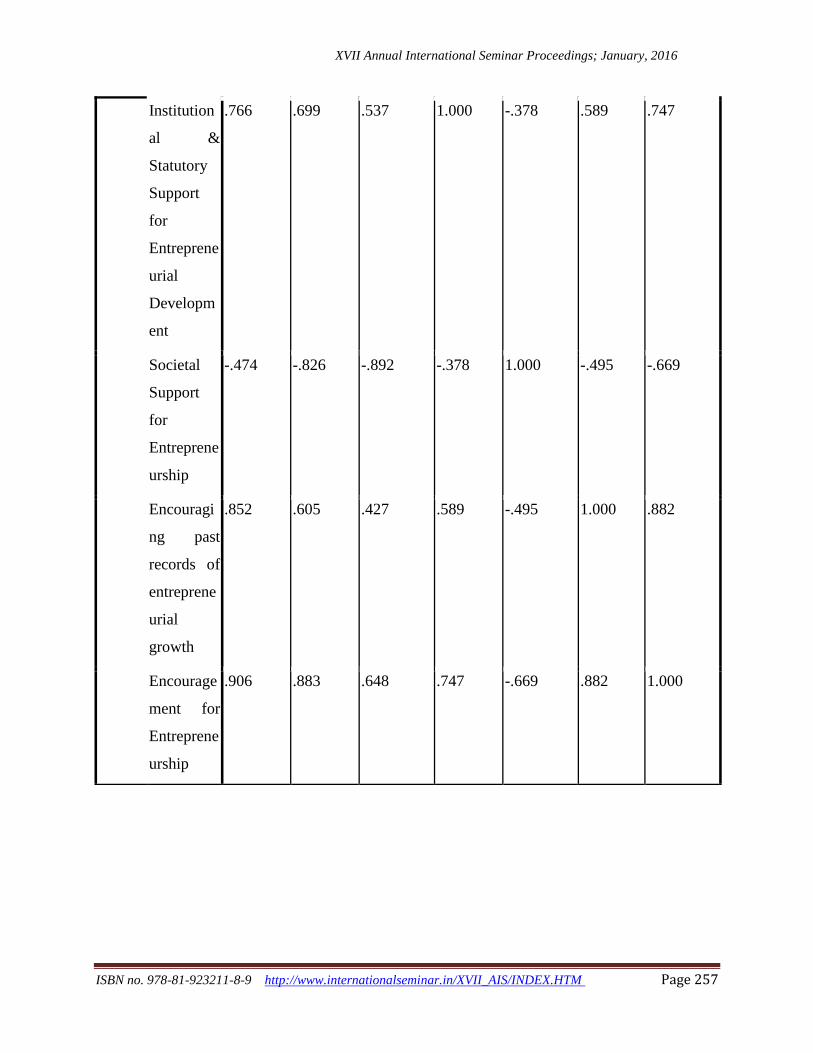
Table 5 shows the KMO (Kaiser-Meyer-Olkin measure of sampling adequacy) and Barlett’s
Test. It is known that in order to ideally run a factor analysis, the KMO score should be greater
than 0.5. In the present study the KMO score is 0.857. On the other hand Barlett’s test of
sphericity is also rejected as the significance value is less than 0.05. This means the correlation
matrix (Table 6) is not an identity matrix and thus there is an underlying structure among the
variables considered in the analysis.
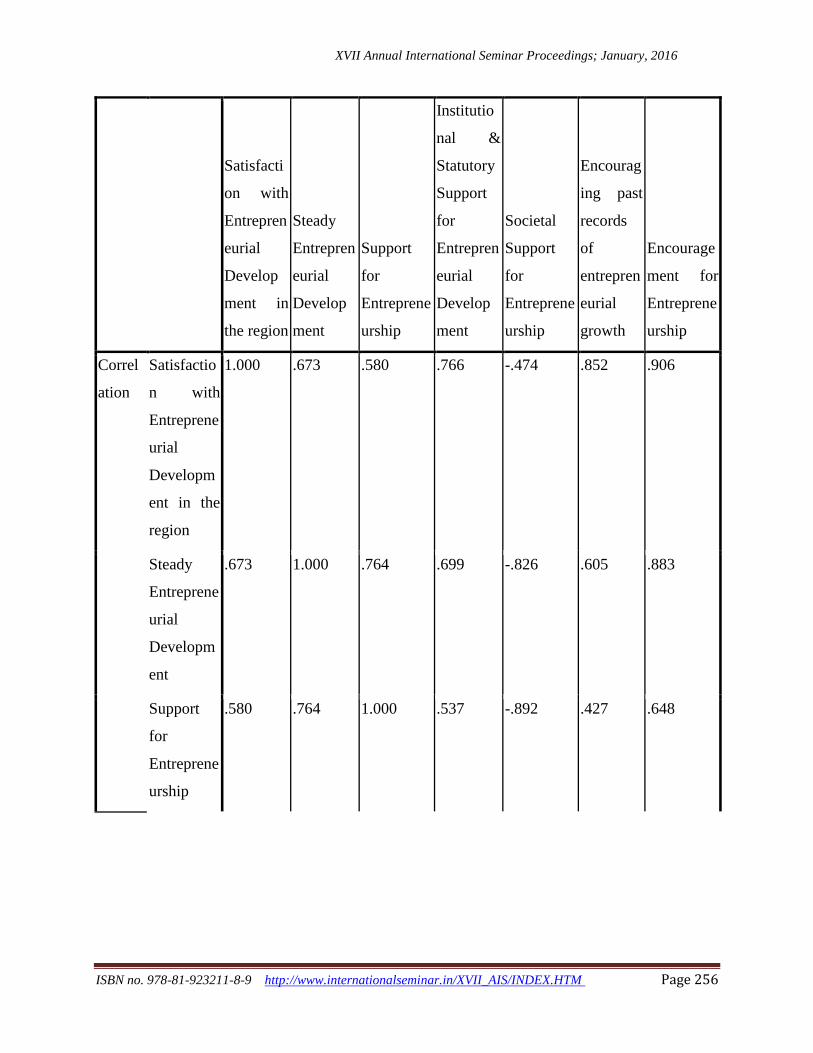
Table 6: Correlation Matrixa
XVII Annual International Seminar Proceedings; January, 2016
ISBN no. 978-81-923211-8-9 http://www.internationalseminar.in/XVII_AIS/INDEX.HTM Page 256
Satisfacti
on with
Entrepren
eurial
Develop
ment in
the region
Steady
Entrepren
eurial
Develop
ment
Support
for
Entreprene
urship
Institutio
nal &
Statutory
Support
for
Entrepren
eurial
Develop
ment
Societal
Support
for
Entreprene
urship
Encourag
ing past
records
of
entrepren
eurial
growth
Encourage
ment for
Entreprene
urship
Correl
ation
Satisfactio
n with
Entreprene
urial
Developm
ent in the
region
1.000 .673 .580 .766 -.474 .852 .906
Steady
Entreprene
urial
Developm
ent
.673 1.000 .764 .699 -.826 .605 .883
Support
for
Entreprene
urship
.580 .764 1.000 .537 -.892 .427 .648
XVII Annual International Seminar Proceedings; January, 2016
ISBN no. 978-81-923211-8-9 http://www.internationalseminar.in/XVII_AIS/INDEX.HTM Page 257
Institution
al &
Statutory
Support
for
Entreprene
urial
Developm
ent
.766 .699 .537 1.000 -.378 .589 .747
Societal
Support
for
Entreprene
urship
-.474 -.826 -.892 -.378 1.000 -.495 -.669
Encouragi
ng past
records of
entreprene
urial
growth
.852 .605 .427 .589 -.495 1.000 .882
Encourage
ment for
Entreprene
urship
.906 .883 .648 .747 -.669 .882 1.000

XVII Annual International Seminar Proceedings; January, 2016
ISBN no. 978-81-923211-8-9 http://www.internationalseminar.in/XVII_AIS/INDEX.HTM Page 258
Sig.
(1-
tailed)
Satisfactio
n with
Entreprene
urial
Developm
ent in the
region
.000 .000 .000 .003 .000 .000
Steady
Entreprene
urial
Developm
ent
.000
.000 .000 .000 .000 .000
Support
for
Entreprene
urship
.000 .000
.001 .000 .007 .000
Institution
al &
Statutory
Support
for
Entreprene
urial
Developm
ent
.000 .000 .001
.016 .000 .000
Societal
Support
for
Entreprene
urship
.003 .000 .000 .016
.002 .000
XVII Annual International Seminar Proceedings; January, 2016
ISBN no. 978-81-923211-8-9 http://www.internationalseminar.in/XVII_AIS/INDEX.HTM Page 259
Encouragi
ng past
records of
entreprene
urial
growth
.000 .000 .007 .000 .002
.000
Encourage
ment for
Entreprene
urship
.000 .000 .000 .000 .000 .000
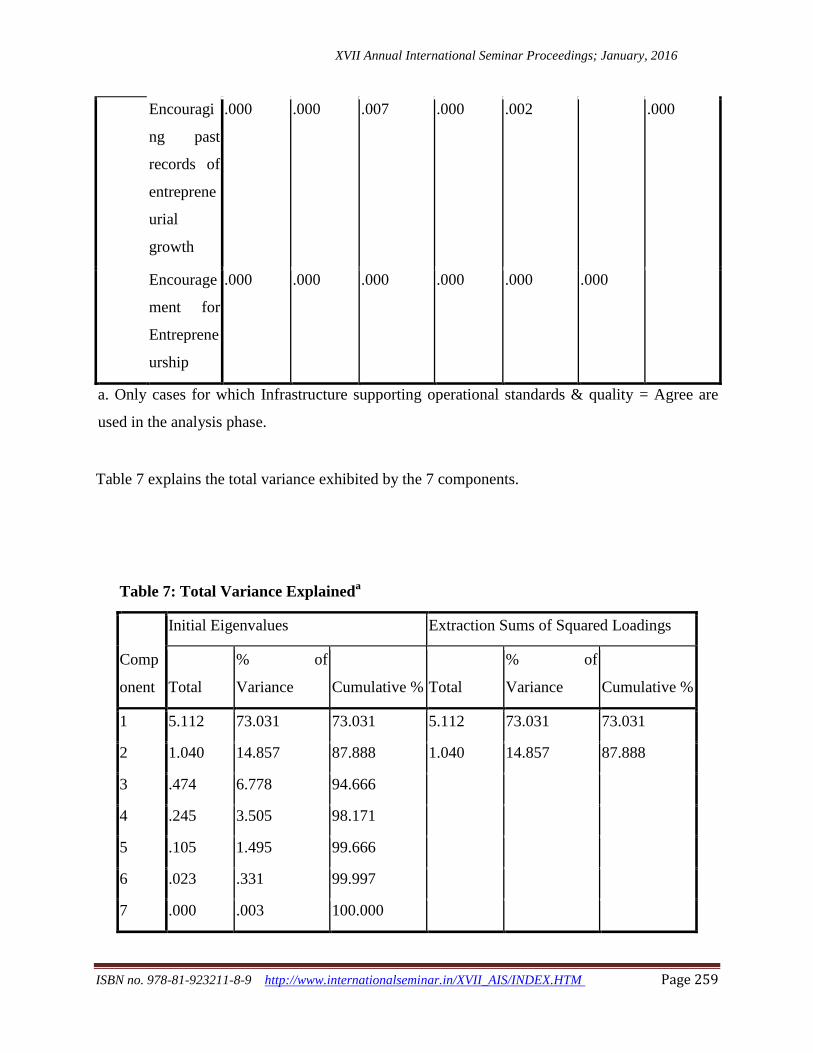
a. Only cases for which Infrastructure supporting operational standards & quality = Agree are
used in the analysis phase.
Table 7 explains the total variance exhibited by the 7 components.
Table 7: Total Variance Explaineda
Comp
onent
Initial Eigenvalues Extraction Sums of Squared Loadings
Total
% of
Variance Cumulative % Total
% of
Variance Cumulative %
1 5.112 73.031 73.031 5.112 73.031 73.031
2 1.040 14.857 87.888 1.040 14.857 87.888
3 .474 6.778 94.666
4 .245 3.505 98.171
5 .105 1.495 99.666
6 .023 .331 99.997
7 .000 .003 100.000

XVII Annual International Seminar Proceedings; January, 2016
ISBN no. 978-81-923211-8-9 http://www.internationalseminar.in/XVII_AIS/INDEX.HTM Page 260
Extraction Method: Principal Component Analysis.
a. Only cases for which Infrastructure supporting operational standards & quality = Agree
are used in the analysis phase.
Table 8 depicts the extraction of the communalities based on principal component analysis
showing the initial score of 1.000 and extracted scores for each of the 7 components. The
analysis was applicable for cases where the respondents were in agreement that infrastructure
supported their operational standards & quality.
Table 8: Communalitiesa
Initial Extraction
Satisfaction with
Entrepreneurial
Development in the
region
1.000 .918
Steady Entrepreneurial
Development
1.000 .882
Support for
Entrepreneurship
1.000 .901
Institutional & Statutory
Support for
Entrepreneurial
Development
1.000 .712
Societal Support for
Entrepreneurship
1.000 .953
Encouraging past
records of
entrepreneurial growth
1.000 .824
Encouragement for
Entrepreneurship
1.000 .962

XVII Annual International Seminar Proceedings; January, 2016
ISBN no. 978-81-923211-8-9 http://www.internationalseminar.in/XVII_AIS/INDEX.HTM Page 261
Extraction Method: Principal Component
Analysis.
a. Only cases for which Infrastructure
supporting operational standards & quality =
Agree are used in the analysis phase.
Table 9 shows the extracted component matrix based on principal component analysis. The
analysis was applicable for cases where the respondents were in agreement that infrastructure
supported their operational standards & quality.
It is clear that, the component “encouragement for entrepreneurship” the highest score of 0.965,
followed by “Steady entrepreneurial development” with a score of 0.915. Similarly “Satisfaction
with Entrepreneurial Development in the region” received a score of 0.884. This indicates that
the factors namely “encouragement for entrepreneurship”, “Steady entrepreneurial
development”, “Satisfaction with Entrepreneurial Development in the region” were the emerging
factors when infrastructure plays a role for supporting operational standards & quality in
entrepreneurial firms in Durgapur.
Table 9: Component Matrixa,b
Component
1 2
Satisfaction with
Entrepreneurial
Development in the
region
.884 .370
Steady Entrepreneurial
Development
.915 -.213
Support for
Entrepreneurship
.806 -.502

XVII Annual International Seminar Proceedings; January, 2016
ISBN no. 978-81-923211-8-9 http://www.internationalseminar.in/XVII_AIS/INDEX.HTM Page 262
Institutional & Statutory
Support for
Entrepreneurial
Development
.790 .296
Societal Support for
Entrepreneurship
-.789 .575
Encouraging past
records of
entrepreneurial growth
.817 .396
Encouragement for
Entrepreneurship
.965 .175
Extraction Method: Principal Component
Analysis.
a. 2 components extracted.
b. Only cases for which Infrastructure
supporting operational standards & quality =
Agree are used in the analysis phase.
Interrelationship between impact of infrastructure and entrepreneurial growth
In order to evaluate the interrelationships between the impact of infrastructure and
entrepreneurial growth, the composite mean score of the infrastructure parameters (namely:
Region has optimal infrastructure, Adequacy of Infrastructure, Infrastructure supporting
uninterrupted supply chain, Infrastructure supporting customer needs, and Infrastructure
supporting operational standards & quality) as well as composite mean score on perceptions
regarding entrepreneurial growth (namely: Steady Entrepreneurial Development, Encouragement
for Entrepreneurship, Satisfaction with Entrepreneurial Development in the region, Support for

XVII Annual International Seminar Proceedings; January, 2016
ISBN no. 978-81-923211-8-9 http://www.internationalseminar.in/XVII_AIS/INDEX.HTM Page 263
Entrepreneurship, Support for Entrepreneurship, Encouraging past records of entrepreneurial
growth, Societal Support for Entrepreneurship, Institutional & Statutory Support for
Entrepreneurial Development) were computed.
Table 10 shows the computation of correlation analysis between entrepreneurial growth and
impact of infrastructure.
Table 10: Correlations
Entrepreneuri
al Growth
Impact of
Infrastructure
Entrepreneurial Growth Pearson Correlation 1 .581**
Sig. (2-tailed) .000
N 50 50
Impact of Infrastructure Pearson Correlation .581**
1
Sig. (2-tailed) .000
N 50 50
**. Correlation is significant at the 0.01 level (2-tailed).
It is evident from Table 10 that, entrepreneurial growth had significant correlation (significant at
the 0.01 significance level) with impact of infrastructure.
Regression Model: Impact of Infrastructure on Perception on Entrepreneurial Growth
In order to have an in depth understanding of the impact of infrastructure on perception
regarding entrepreneurial growth, a regression model was developed as illustrated by Table 11.

XVII Annual International Seminar Proceedings; January, 2016
ISBN no. 978-81-923211-8-9 http://www.internationalseminar.in/XVII_AIS/INDEX.HTM Page 264
Table 11: Model Description
Model Name MOD_1
Dependent
Variable
1 Perception on
Entrepreneurial Growth
Equation 1 Linear
Independent Variable Impact of Infrastructure
Constant Included
Variable Whose Values Label Observations
in Plots
Unspecified
Perception on Entrepreneurial Growth: Linear Regression Model
Table 12 shows the linear regression model summary. In order to develop the model considering
impact of infrastructure as the independent variable a R value of 0.581 was computed from
which R square value of 0.337 was computed. Adjusted R square value computed was 0.323. the
standard error of the estimate was 0.530.
Table 12: Model Summary
R R Square
Adjusted R
Square
Std. Error of
the Estimate
.581 .337 .323 .530
The independent variable is Impact of
Infrastructure.

XVII Annual International Seminar Proceedings; January, 2016
ISBN no. 978-81-923211-8-9 http://www.internationalseminar.in/XVII_AIS/INDEX.HTM Page 265
Table 13: ANOVA
Sum of
Squares df Mean Square F Sig.
Regression 6.867 1 6.867 24.415 .000
Residual 13.500 48 .281
Total 20.367 49
The independent variable is Impact of Infrastructure.
Table 13 shows the analysis for ANOVA (for simple regression model), where the sum of
squares for regression and mean square were found to be 6.867 respectively. The analysis depicts
the test of significance for the regression parameters having a significance value of lesser than
0.05.
Table 14 shows the computation of the standardized as well as un-standardized coefficients
considering impact of infrastructure as the independent variable. The un-standardized coefficient
score was 0.645 whereas, for standardized coefficients Beta value was 0.581.
Table 14: Coefficients
Unstandardized
Coefficients
Standardized
Coefficients
T Sig. B Std. Error Beta
Impact of
Infrastructure
.645 .130 .581 4.941 .000
(Constant) 1.296 .427 3.036 .004
On the basis of the above data, it can be said that there is a positive association between impact
of infrastructure and “Perception on entrepreneurial growth”. The data for linear regression curve
comprising of perception on entrepreneurial growth with reference to infrastructure can be
plotted as revealed in Fig 2.

XVII Annual International Seminar Proceedings; January, 2016
ISBN no. 978-81-923211-8-9 http://www.internationalseminar.in/XVII_AIS/INDEX.HTM Page 266
Fig 2: Linear Regression curve constructed from data analysis
Fig 1 clearly indicates that higher the impact of infrastructure, it would have positive impacts on
perception towards entrepreneurial growth.
DISCUSSIONS
The study had revealed that entrepreneurial growth had significant correlation (significant at the
0.01 significance level) with impact of infrastructure in and around the city of Durgapur. This is
further established by the regression model discussed in the analysis where it has been revealed
that higher the impact of infrastructure in the region, it would have more positive (favorable)
impacts on the perception of entrepreneurs towards entrepreneurial growth. Entrepreneurs had
appreciated societal support in and around Durgapur for encouraging entrepreneurial pursuits.
Steady entrepreneurial development in the region received a moderate support on the view point.
Apart from these, the study had also revealed that variables such as “encouragement for
entrepreneurship”, “Steady entrepreneurial development”, “Satisfaction with Entrepreneurial

XVII Annual International Seminar Proceedings; January, 2016
ISBN no. 978-81-923211-8-9 http://www.internationalseminar.in/XVII_AIS/INDEX.HTM Page 267
Development in the region” were the emerging outcome factors when infrastructure contributes
to play a role for supporting operational standards & quality in entrepreneurial firms in
Durgapur.
CONCLUSION
Considering the findings of the study it can be concluded that at present the entrepreneurial
development in Durgapur region had received infrastructural support that contributed to manage
their operational standards and quality. But in order to achieve the ambitious goals set by India’s
“Make-in-India” vision, the region needs boost up and investments in infrastructure which would
be essential for nurturing more new ventures in the region. Support from statutory bodies,
financial institutions and entrepreneurship development associations or institutions would be
vital for harnessing the high growth standards set by “Make-in-India” dream. On the other hand
premier academic institutions like National Institute of Technology, private technology colleges
and business schools should play a leading role to provide the platform for entrepreneurial skill
development and handholding start-up projects. Institutional incubation and innovation centres
would play a leading role for supporting medium and small scale entrepreneurs achieving their
organizational goals and aspirations.
In the end it may be further concluded that the present study might be further extended into an
in-depth research taking into consideration all the infrastructure issues and variables so as to
have a detailed and extensive roadmap for facilitating entrepreneurial development in the region.
REFERENCES
Almus, M., Egeln, J., & Engel, D. (2001). Determinanten regionaler Unterschiede in der
Gründungshäufigkeit wissensintensiver Dienstleister. Jahrbuch für Regionalwissenschaft, 21, 25-
51.

XVII Annual International Seminar Proceedings; January, 2016
ISBN no. 978-81-923211-8-9 http://www.internationalseminar.in/XVII_AIS/INDEX.HTM Page 268
Aschaue,r David Alan (1989), Is Public expenditure productive?, Journal of Monetary
Economics, 23, 177-200.
Birley, S. and Westhead, P. (1994). Taxonomy of business start-up reasons and their impact on
firm growth and sizes, Journal of Business Venturing, Vol. 9, No. 1, pp:7-31.
Chan, C., Forwood, D., H., Roper, and C. Sayers (2009) Public infrastructure financing: An
International Perspective’, Productivity Commission Staff Working paper.
Engel, D., & Fier, A. (2000): Does R&D infrastructure attract high-tech start-ups? ZEW
Discussion Paper No. 00-30.
Nerlinger, E. (1996): Firm formation in high-tech industries: empirical results for Germany.
ZEW Discussion Paper No. 96-07.
Melissa Fry Konty, (2008), Kentucky Programs and Infrastructure to Promote Small Business
and Entrepreneurship, MACED unpublished.
Mitsui, Kiyoshi and Jun Inoue (1995), Productivity effect of infrastructure, in Mitsui, Kiyoshi
and Kiyoshi Ohta (ed.) Productivity of Infrastructure and Public Finance, Nihon-Hyoron-sya,
Chapter 3 (in Japanese).
Newberry, D., (2012), Energy and Infrastructure, Submission to the LSE Growth Commission.
North, D. and D. Smallbone (1996), “Small business development in remote rural areas: the
example of mature manufacturing firms in northern England”, Journal of Rural Studies, Vol. 12,
No. 2, Elsevier, pp. 151-167.
OECD (2006a), Reinventing Rural Policy, Policy Brief, OECD Observer, October, Paris.
Ratner, J.B., (1983), Government Capital and the Production Function for U.S. Private Output,
Economic Letters, 13, 213-217.

XVII Annual International Seminar Proceedings; January, 2016
ISBN no. 978-81-923211-8-9 http://www.internationalseminar.in/XVII_AIS/INDEX.HTM Page 269
Reynolds, Paul D., Michael Hay, William D. Bygrave, S. Michael Camp, and Erkko Autio, 2000.
Global Entrepreneurship Monitor: 2000 Executive Report (Kansas City, Kauffman Center for
Entrepreneurial Leadership), p. 6.
Van de Ven, A.H. (1993). The emergence of an industrial infrastructure for technological
innovation. Journal of Comparative Economics, 17:2.