
Role of Ganglion Cell Complex (GCC) in Evaluation of Glaucoma
18
10/8/2012 1 Role of Ganglion Cell Complex (GCC) in Evaluation of Glaucoma BY Azza Ismaiel Sedkey, M.D. Consultant of Ophthalmology Cairo University • Retinal ganglion cells encompass three layers in the retina: ▫ The retinal nerve fiber layer (NFL) Made up of the ganglion cell axons, ▫ The ganglion cell layer (GCL) Made up of the ganglion cell bodies, ▫ The inner-plexiform layer (IPL) Made up of a network of axons and dendrites from ganglion cells, bipolar cells, and amacrine cells All three layers, collectively known as the ganglion cell complex (GCC)
Transcript of Role of Ganglion Cell Complex (GCC) in Evaluation of Glaucoma

10/8/2012
1
Role of Ganglion Cell Complex
(GCC)
in Evaluation of Glaucoma
BY
Azza Ismaiel Sedkey, M.D.
Consultant of Ophthalmology
Cairo University
• Retinal ganglion cells encompass three layers in the retina:
▫ The retinal nerve fiber layer (NFL) Made up of the ganglion cell axons,
▫ The ganglion cell layer (GCL) Made up of the ganglion cell bodies,
▫ The inner-plexiform layer (IPL) Made up of a network of axons and dendrites from
ganglion cells, bipolar cells, and amacrine cells
All three layers, collectively known as the ganglion cell
complex (GCC)

10/8/2012
2
Loss of the retinal ganglion cells and their axons is known
to occur in the posterior pole, where these cells may
constitute 30% to 35% of the retinal thickness in the
macular region Zeimer et al., 1998
Approximately 50% of retinal ganglion cells are located in
the macular region 4 to 5 mm from the center of the fovea
with the peak density occurring 750 to 1100 µm from the
foveal center where the cell density may be 4 to 6 cell
bodies thick Wässle H et al., 1989
Curcio CA et al., 1990
Normal Macular Architecture

10/8/2012
3
GCC
Area of Concern …………
OCT and GCC

10/8/2012
4
OCT and GCC
OCT and GCC
1
1
2
2
3
3

10/8/2012
5
OCT and GCC
OCT and GCC

10/8/2012
6
OCT and GCC
• Focal Loss Volume %
------ Localized field defects
OCT and GCC
• Global Loss Volume %
----- Generalized Retinal
Sensitivity

10/8/2012
7
Maps obtained
The Deviation Map
• Shows the percent loss from normal as determined by the normative database
• Map is calculated by taking the actual value from a scan at each pixel location in the map, subtracting the normal
value, and then dividing that by the normal value
• The result is a percent loss value at each pixel location in the map
• The map is color coded where blue represents GCC thinning from 20-30% relative to normal. Black coloring in the
Deviation Map represent a 50% loss or greater, relative to an age-matched normal
Normal GCC Parameters
• The thickness map is color coded where thicker regions are displayed in hot colors (yellow & orange), and thinner areas are displayed in cooler colors (blue & green) • The GCC map for a normal eye shows a bright circular band surrounding the macula representing a thick GCC from healthy ganglion cells

10/8/2012
8
Affected GCC Parameters
Affected GCC Parameters

10/8/2012
9
Relation between GCC thickness
and RNFL thickness
Severe GCC damage

10/8/2012
10
Severe GCC damage
Severe GCC damage
10/8/2012
11
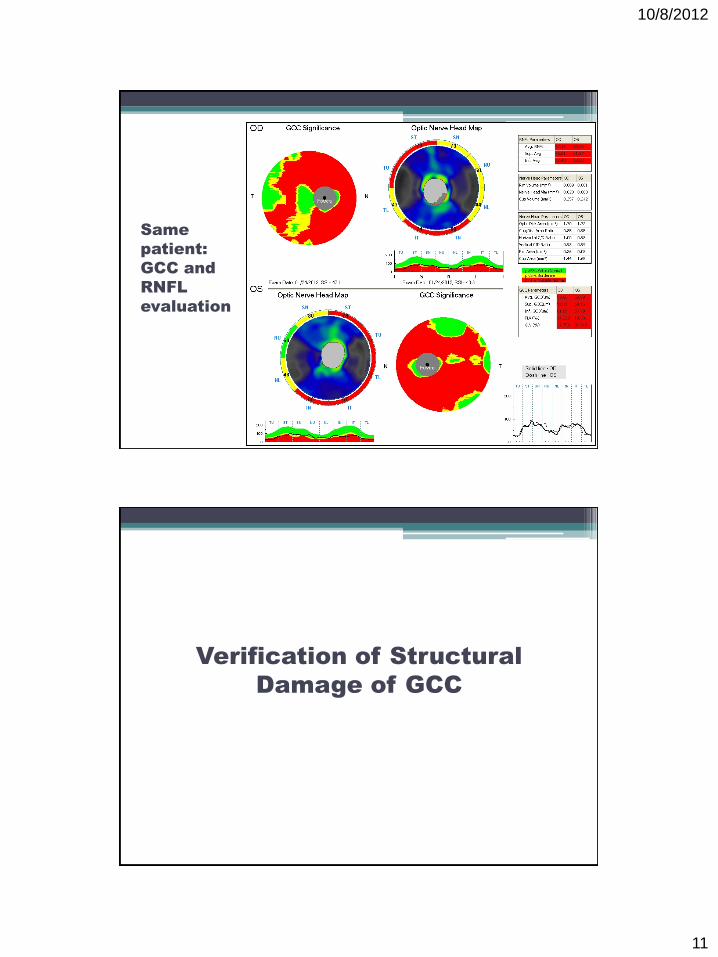
Same
patient:
GCC and
RNFL
evaluation
Verification of Structural
Damage of GCC

10/8/2012
12
24-2 Threshold Field Print-out
10-2 field
• 10-2 strategy (usually used for evaluation of macular diseases e.g.
drug toxicity, AMD):
• Maximizes detection of defects centrally & provides the ability
to follow disease progression through increasing the number of
points tested

10/8/2012
13
Thickness map
Significance map
Gray Scale (10-2)
Thickness map
Significance map
Gray Scale (10-2)

10/8/2012
14
Thickness map
Significance map
Gray Scale (10-2)
Gray Scale (10-2)
Thickness map
Significance map

10/8/2012
15
Follow-up of GCC parameters
Follow-up of GCC parameters

10/8/2012
16
Follow-up of GCC parameters

10/8/2012
17
• Ganglion Cell Complex status should be considered on
evaluation of glaucoma patients
▫ It would also explain the common complaint of the patient
of un-satisfaction with the quality of BSCVA
• A significant correlation exists between GCC
affection and RNFL findings
• The significant correlation between macular field
affection and macular GCC thickness should drive the
ophthalmologists’ attention to the hazards of
neglecting macular affection in glaucoma patients
Residual tubular field

10/8/2012
18


![Canandian Glaucoma 1.ppt [Read-Only] - · PDF file · 2010-10-02pressure anomalies. ... Buckingham BP, et al. Retinal ganglion cells downregulate gene expression and lose their axons](https://static.fdocuments.net/doc/165x107/5abafefd7f8b9a76038c2edc/canandian-glaucoma-1ppt-read-only-anomalies-buckingham-bp-et-al-retinal.jpg)

