Role of Breast Tomosynthesis in the Morphological Analysis of Breast Lesions
22
-
Upload
apollo-hospitals -
Category
Health & Medicine
-
view
543 -
download
0
Transcript of Role of Breast Tomosynthesis in the Morphological Analysis of Breast Lesions

Role of Breast Tomosynthesis in the Morphological Analysis of Breast Lesions
Page 1 of 20
Role of breast tomosynthesis in the morphological analysisof breast lesions
Poster No.: B-0453
Congress: ECR 2012
Type: Scientific Paper
Authors: B. Raghavan, M. Selvakumar, G. SIVARAMALINGAM; Chennai/IN
Keywords: Breast, Mammography, Technology assessment, Tissuecharacterisation
DOI: 10.1594/ecr2012/B-0453
Any information contained in this pdf file is automatically generated from digital materialsubmitted to EPOS by third parties in the form of scientific presentations. Referencesto any names, marks, products, or services of third parties or hypertext links to third-party sites or information are provided solely as a convenience to you and do not inany way constitute or imply ECR's endorsement, sponsorship or recommendation of thethird party, information, product or service. ECR is not responsible for the content ofthese pages and does not make any representations regarding the content or accuracyof material in this file.As per copyright regulations, any unauthorised use of the material or parts thereof aswell as commercial reproduction or multiple distribution by any traditional or electronicallybased reproduction/publication method ist strictly prohibited.You agree to defend, indemnify, and hold ECR harmless from and against any and allclaims, damages, costs, and expenses, including attorneys' fees, arising from or relatedto your use of these pages.Please note: Links to movies, ppt slideshows and any other multimedia files are notavailable in the pdf version of presentations.www.myESR.org
Page 2 of 20
Purpose
PURPOSE
1. To assess the role of Breast Tomosynthesis (by 3D Combined View) versus 2D FullField Digital Mammogram alone in the morphological analysis of breast lesions.
2. To evaluate the potential role of Tomosynthesis in BIRADS Categorisation and FinalHistopathology.
In May 2011 we migrated from an Analogue Mammogram with a dedicated MammogramCR system to a Full Field Digital System with 3D Tomosynthesis.
In India there is no official screening programme. All screening is opportunistic, self-initiated and self-funded. Most Mammograms done at our hospital , a Corporate Tertiarycare Oncology facility, are performed as Diagnostic Mammograms followed by mandatoryBreast Ultrasound and additional views , if necessary , on the same day obviating theneed for recall.
Reducing the number of cases for additional views and breast ultrasound will helpin decreasing the patient's waiting time , making reporting more efficient, withoutcompromising on the accuracy. We used BIRADS categorisation as an evaluating tooland compared the BIRADS categorisation with the final HPE.
Methods and Materials
Combined view (2 D+ Tomosynthesis in CC and MLO views) was offered to all patientsundergoing diagnostic mammogram (symptomatic patients) or who were in the high riskcategory and informed consent was got for the same after explaining the details of theprocedure including the incremental dosage during the Tomosynthesis as opposed to asimple 2-view mammogram for each breast.
Whilst the superior diagnostic capabilities of Tomosynthesis have been reported inliterature, it is an additional view/procedure with incremental dosage. Combo mode in oursystem (2D +3D) has a dose of 2.5 to 2.8mSv for a breast of average thickness.
Page 3 of 20
The 3DTomosynthesis setting can be done separately after the 2D mammogram.However the Combo view includes the acquisition of 3D Tomosynthesis in the samecompression wherein the x-ray tube moves along a limited arc from +7.5 to -7.5 degreesand takes 15 projections allowing 15 low-dose images to be acquired followed by the 2DFull Field Digital in the same CC or MLO position with the same compression in quicksuccession .The Combo View eliminates the need to reposition the breast but there is anadditional time under compression during the acquisition of the 3D images.
After acquisition, the data from the projection images were used to reconstruct between50 and 90 parallel 1-mm-thick slices (i.e., the 3D DBT data set), depending on thethickness.
Mammography was acquired with full-field digital technology (Selenia,Hologic) and theimages were read in the Secure view work-station. Breast Ultrasound was performedwith a dedicated high frequency probe (Philips IU22 or Siemens Antares ).
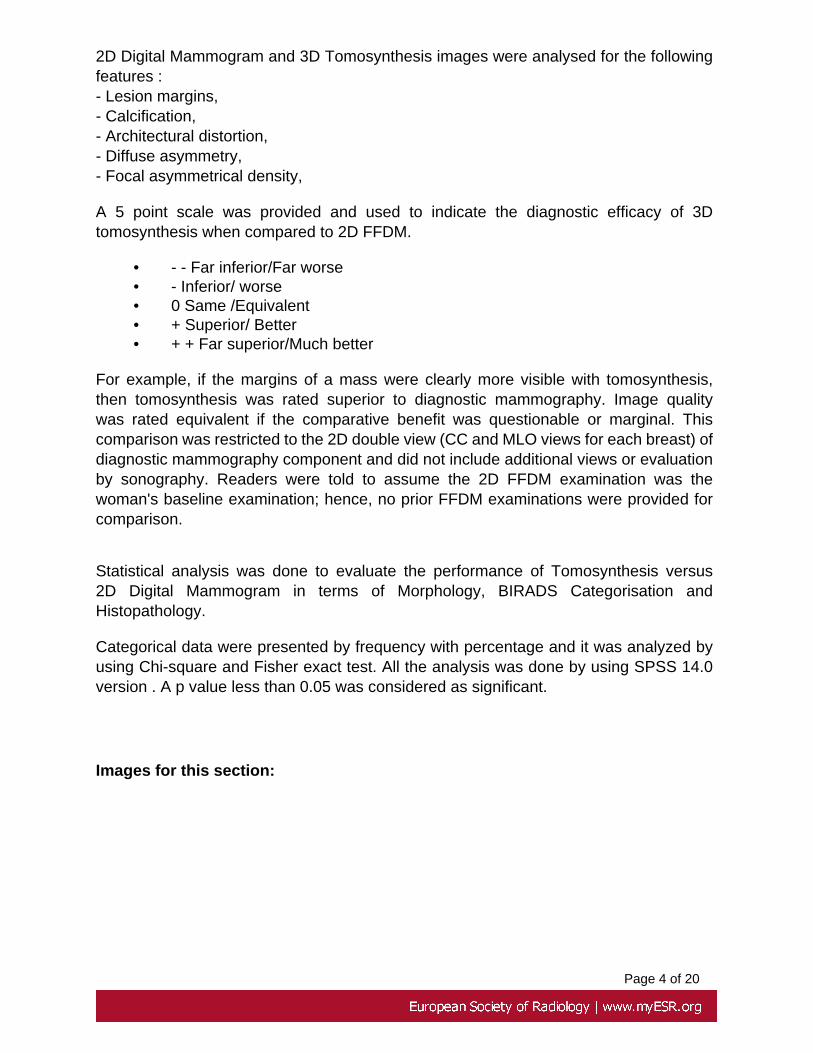
Our study consisted of a convenience sample of 100 lesions in 95 patients. 5 of ourpatients had 2 lesions, the second one was located in the opposite breast.The youngestpatient was 34 years old and the oldest was 87 years old (Fig 1) .
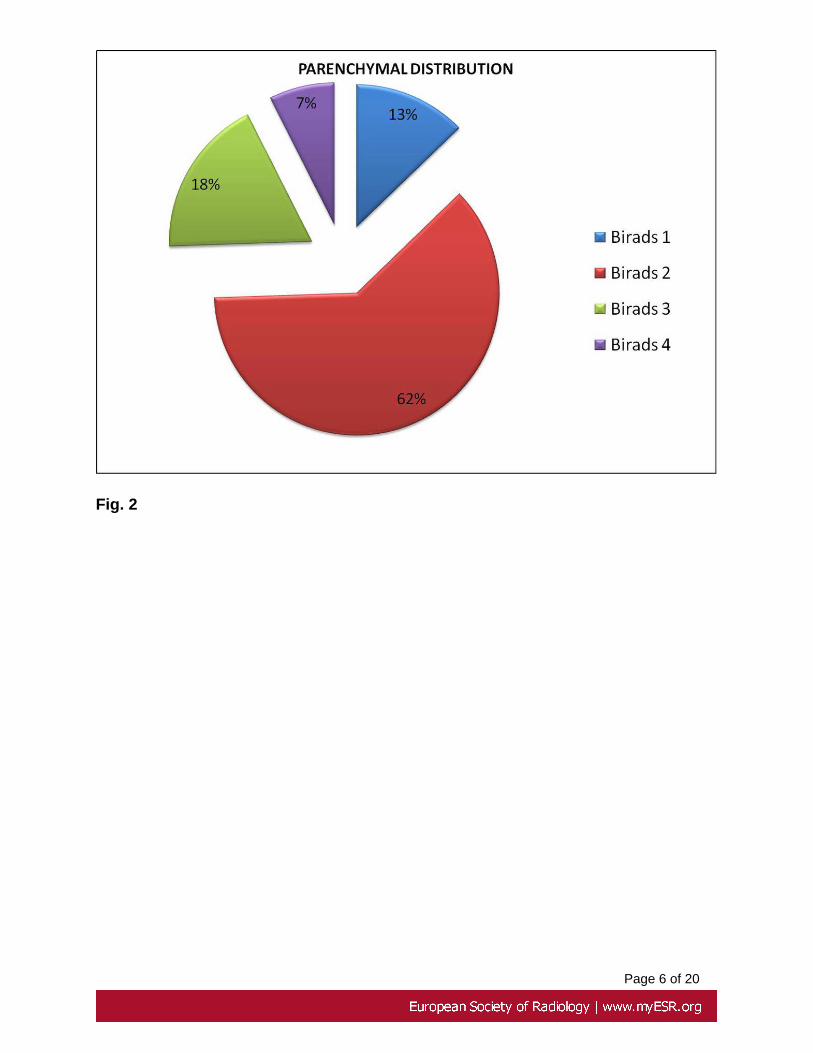
All these patients with abnormal 2D digital mammogram had corelated breast ultrasoundfollowed by Histopathological confirmation ( Fig3 ) by Image guided trucut core tissuebiopsy with a 14 / 16 gauge needle or FNAC in those lesions in whom fluid was aspirated.2D digital mammogram and 3D tomosynthesis were analysed for the following features- mass, margins, calcification, asymmetric density, focal asymmetry and architecturaldistortion.
The images were read by two Senior Radiologists with more than 7 years experiencein reading mammograms. All the images including the Tomosynthesis reconstructionswere reviewed in cine or manual scroll modes on a dedicated soft-copy mammographicworkstation. The workstation, which is PC based, includes two 5-megapixel LCD displayswith a mammography workflow keypad . The system includes tools for magnification,zoom and contrast adjustment as well as a drag-and drop image display.
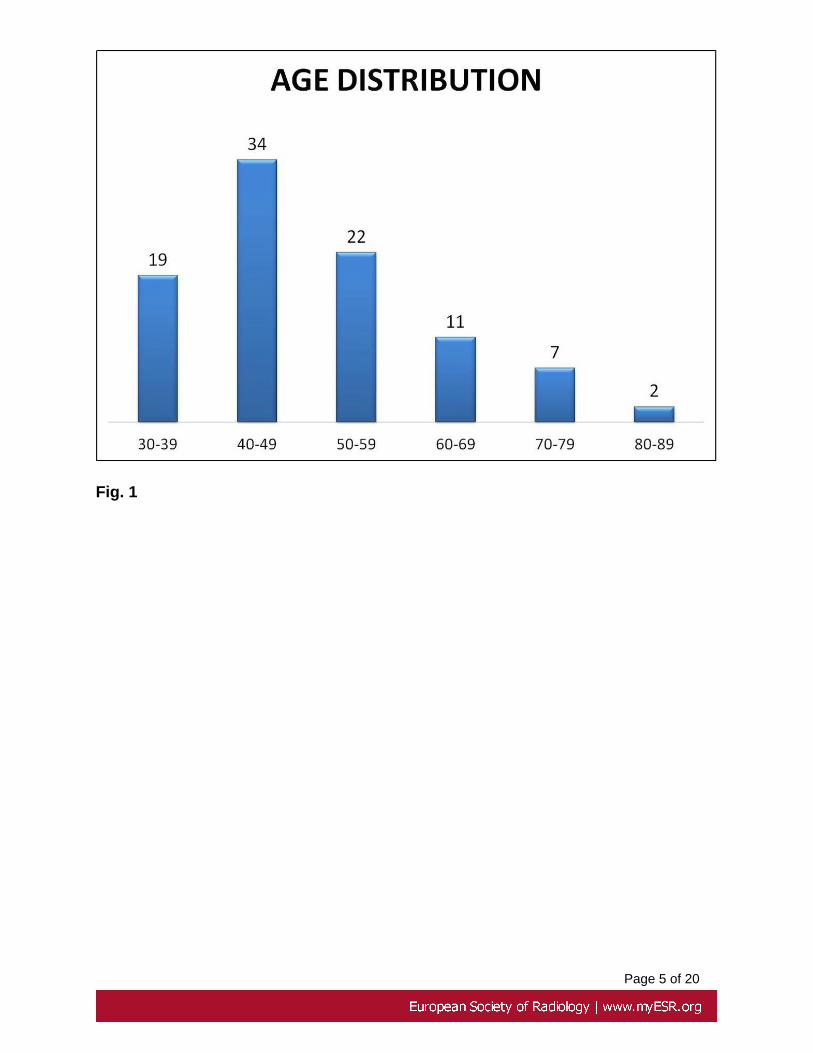
2D Full field Digital images and the Tomosynthesis images were read separately andindependently by two Senior Consultant Radiologists & they alternated the modalities ona weekly basis to eliminate bias (i.e Radiologist A would do the 2D evaluation and BUSevaluation whilst Radiologist B would independently read the 2D with Tomosynthesisimages for the week).The readings of the indexed lesions were documented and theBIRADS categorization was done independently after each modality for the lesion andthe 2D BIRADS categorisation of the breast parenchyma was noted.
Page 4 of 20
2D Digital Mammogram and 3D Tomosynthesis images were analysed for the followingfeatures :- Lesion margins,- Calcification,- Architectural distortion,- Diffuse asymmetry,- Focal asymmetrical density,
A 5 point scale was provided and used to indicate the diagnostic efficacy of 3Dtomosynthesis when compared to 2D FFDM.
• - - Far inferior/Far worse• - Inferior/ worse• 0 Same /Equivalent• + Superior/ Better• + + Far superior/Much better
For example, if the margins of a mass were clearly more visible with tomosynthesis,then tomosynthesis was rated superior to diagnostic mammography. Image qualitywas rated equivalent if the comparative benefit was questionable or marginal. Thiscomparison was restricted to the 2D double view (CC and MLO views for each breast) ofdiagnostic mammography component and did not include additional views or evaluationby sonography. Readers were told to assume the 2D FFDM examination was thewoman's baseline examination; hence, no prior FFDM examinations were provided forcomparison.
Statistical analysis was done to evaluate the performance of Tomosynthesis versus2D Digital Mammogram in terms of Morphology, BIRADS Categorisation andHistopathology.
Categorical data were presented by frequency with percentage and it was analyzed byusing Chi-square and Fisher exact test. All the analysis was done by using SPSS 14.0version . A p value less than 0.05 was considered as significant.
Images for this section:
Page 5 of 20
Fig. 1
Page 6 of 20
Fig. 2
Page 7 of 20
Fig. 3
Page 8 of 20
Results
2D vs 3D for morphological Analysis
Table 1.Frequency distribution
Much better/
Far superior
Better/
Superior
Same/ Equivalent
Margins 7 54 13
Calcification 0 36 6
Architecturaldistortion
5 43 0
Diffuse asymmetry 3 7 0
Focal asymmetry 11 5 1
Additional lesions 3 7 0
• 3D Tomosynthesis was superior for all the analysed parameters with highlysignificant p values, no case was inferior in 3D than 2D .
• In the analysis of margins of 100 abnormal findings , there were 74 masslesions, out of which in 7 cases 3D was far superior(fig 4) to 2D, in 54 cases3D was superior(fig 6) to 2D whereas in 13 cases 3D was equivalent (fig 5)to 2D.
• The pattern and distribution of calcification are better seen with 3Dtomosynthesis (Fig 5,6 ).
• Diffuse asymmetry, architectural distortion and focal asymmetry (fig 7) wereanalysed better in 3D, which could further be categorised as either mass ornormal breast parenchyma.
Table 2 .Chi-square test for Equivalence rating
Better or Muchbetter
Same P value
Margins 61 13 <0.001
Calcification 26 6 <0.001
Architecturaldistortion
40 1 <0.001
Diffuse asymmetry 10 0 -
Page 9 of 20
Focal asymmetry 16 1 <0.001
P<0.05……significant, P<0.001….Highly significant
Corelation with Final BIRADS after 2D, Ultrasound and HPE
Distribution of BIRADS in 2D, 3D and USG
0 1 2 3 4 5
2D 30 1 2 20 29 18
3D 1 - 5 39 10 45
USG - - 5 39 11 45
Final - - 5 38 12 45
Table 3.
Agreement of BIRADS in 2D,3D and USG with final BIRADS
1** 2 3 4 5
2D - 2(100%) 17(85%) 2(6.9%) 18(100%)
3D - 5(100%) 38(97.4%) 10(100%) 45(100%)
USG - 5(100%) 38(97.4%) 11(100%) 45(100%)
NB ** the agreement in BIRAD 1 could not be computed as there was no correspondingHPE .
• 3DTomo BIRADS showed better correlation with final BIRADS than 2DBIRADS For morphological analysis of lesions .
• In case of BIRADS categorisation, 3D made a major contribution in theevaluation of BIRADS 0 cases. Of the 30 cases of BIRADS 0 in 2D , after 3Dthere was only one case in 0 category
• 3D was able to correctly predict the final BIRADS in almost all the lesionswhich were categorised as Birads 0 in 2D
• 3D and Ultrasound Birads showed high agreement (Table 3) with finalBIRADS, in all BIRADS categories unlike 2D which showed very pooragreement in Birads category 4 ,with final BIRADS.
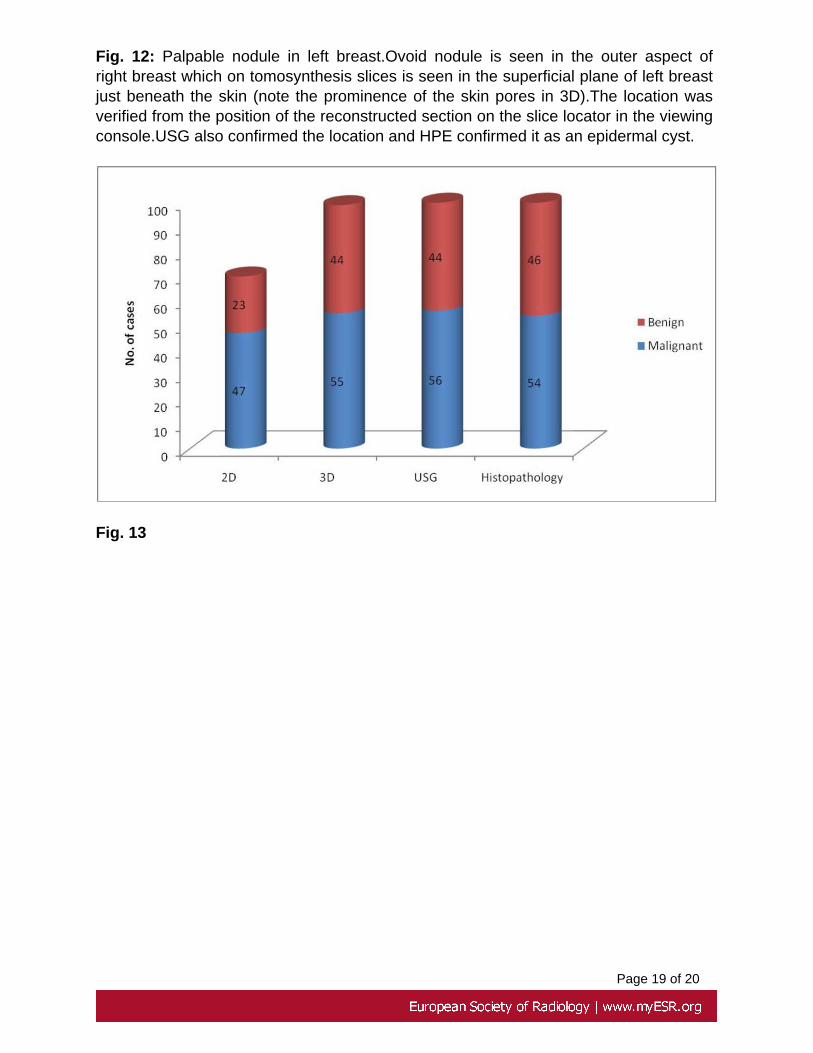
Table 4 :HPE Predictability
Malignant Benign
Page 10 of 20
2D 47 23
3D 55 44
USG 56 44
Histopathology 54 46
• 3D and US were able to categorise lesions as benign and malignant betterthan 2D.
• Only 5 patients in 3D tomo did not co-relate with final BIRADS but howeverthey corelated well with HPE (TAB.5 )
TABLE 5 :
No. 2D 3D USG FINAL HPE
1. 3 4 3 3 IDC
2. 3 2 2 3 EPIDERMALCYST
3. 4 3 3 4 CYST
4. 0 0 4 4 CARCINOMA
5. 0 3 4 4 INFLAMMATION
Images for this section:
Page 11 of 20
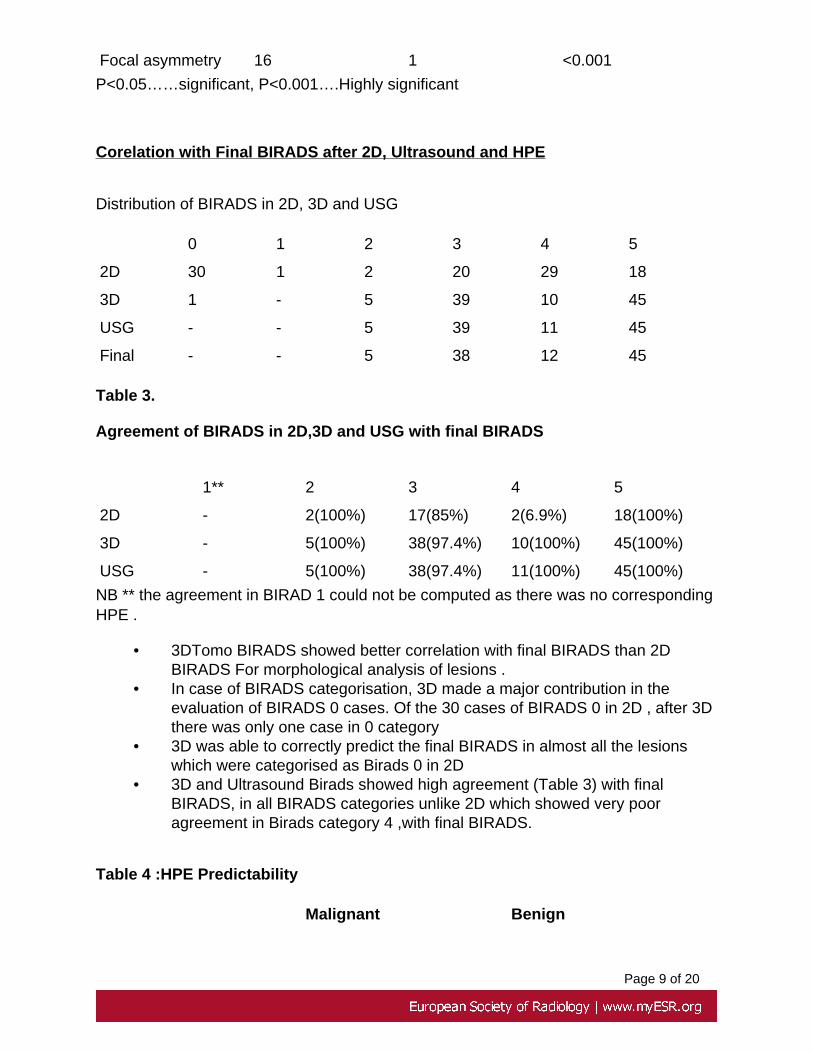
Fig. 4: The 2D image shows a lesion with rounded margins and tent sign in a densebreast .On 3D tomo the spicules are better appreciated.
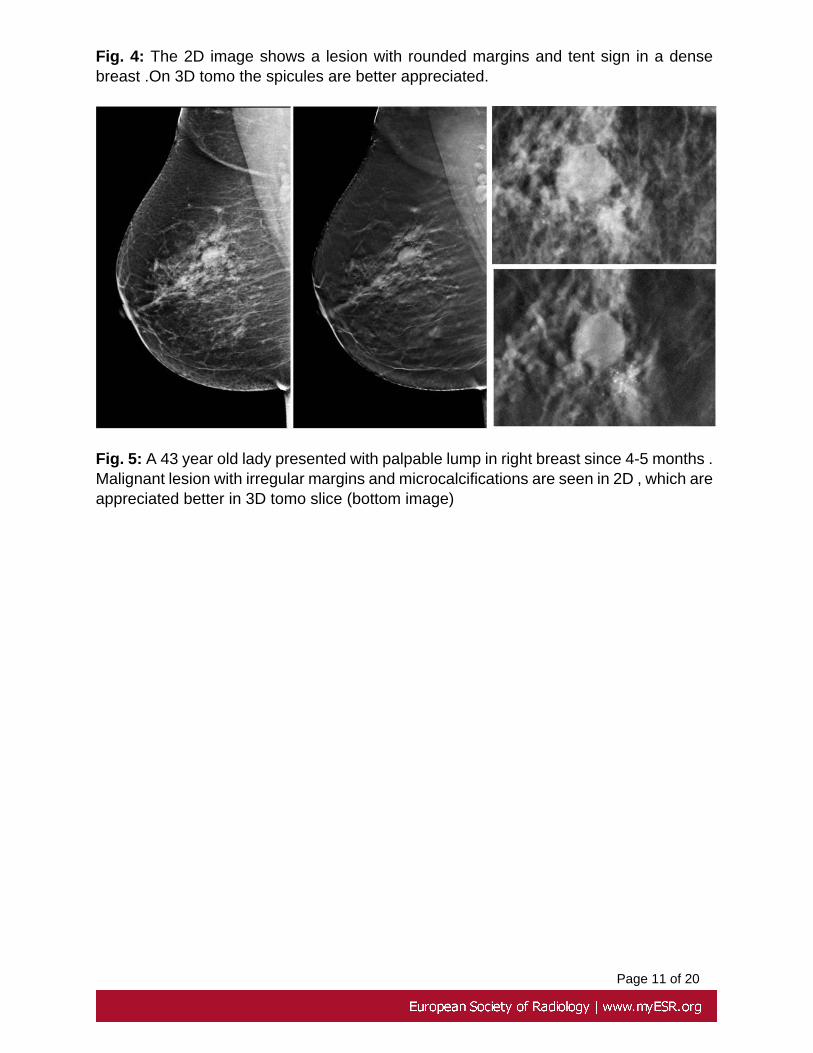
Fig. 5: A 43 year old lady presented with palpable lump in right breast since 4-5 months .Malignant lesion with irregular margins and microcalcifications are seen in 2D , which areappreciated better in 3D tomo slice (bottom image)

Page 12 of 20
Fig. 6: The two slices of tomosynthesis show the spiculation (middle image) and themicrocalcification with its branching pattern (right image) better than the 2D cc view (leftimage).The true extent and nature of the lesion can be assessed in 3D tomo.

Page 13 of 20
Fig. 7: Asymmetrical parenchymal density in the upper outer quadrant of left breast in2D remained as parenchymal density in the 3D tomo slices with no evidence of a masslesion.HPE showed Fibrocystic changes.
Page 14 of 20
Conclusion
• The primary reasons for the added benefit of tomosynthesis were lesionconspicuity, margin feature analysis, detection of additional findings.(Ref1)
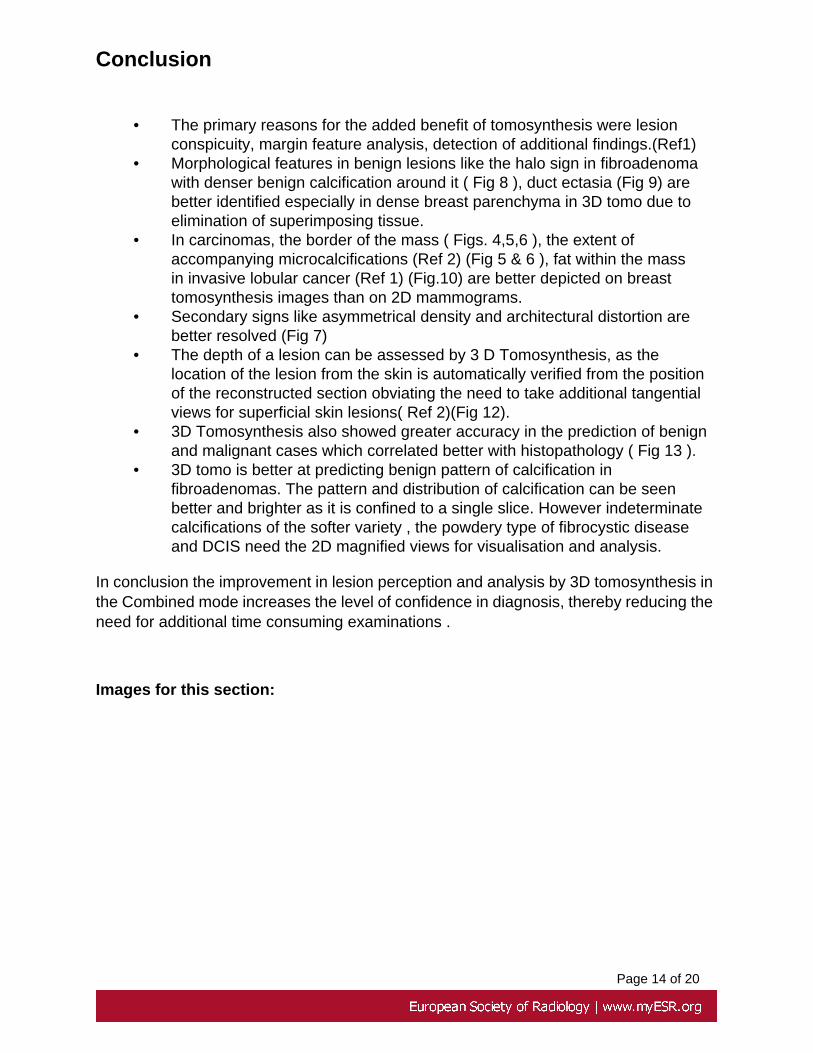
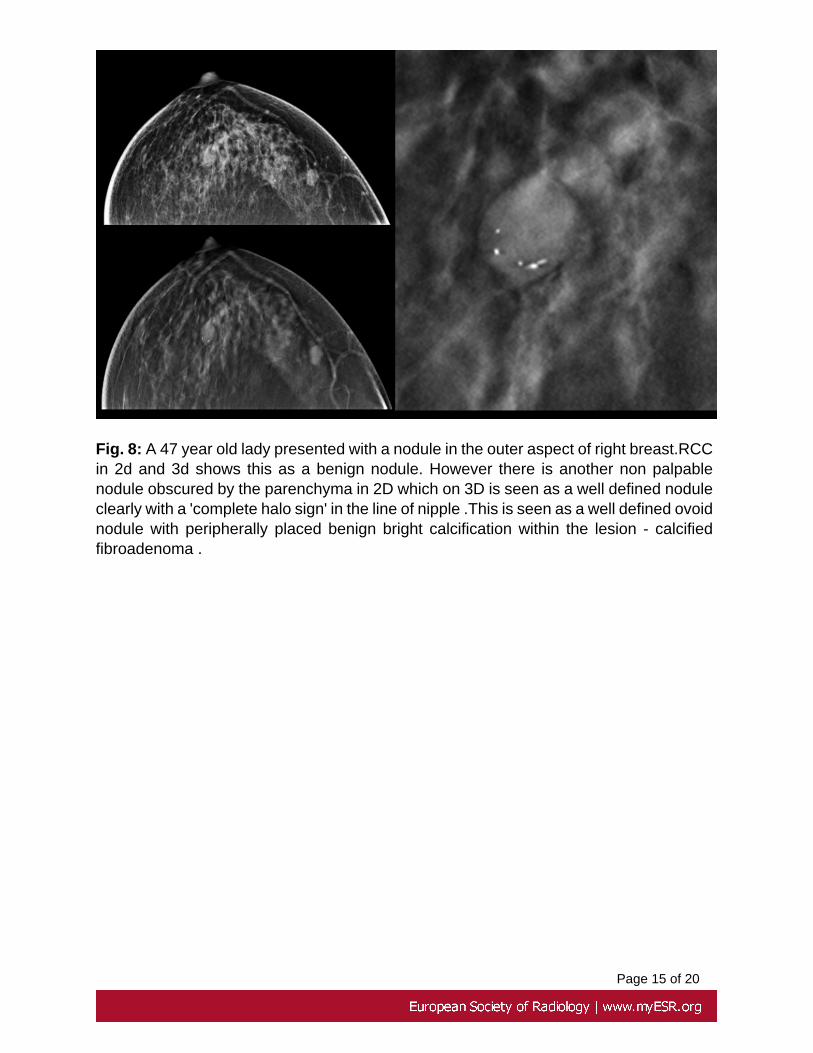
• Morphological features in benign lesions like the halo sign in fibroadenomawith denser benign calcification around it ( Fig 8 ), duct ectasia (Fig 9) arebetter identified especially in dense breast parenchyma in 3D tomo due toelimination of superimposing tissue.
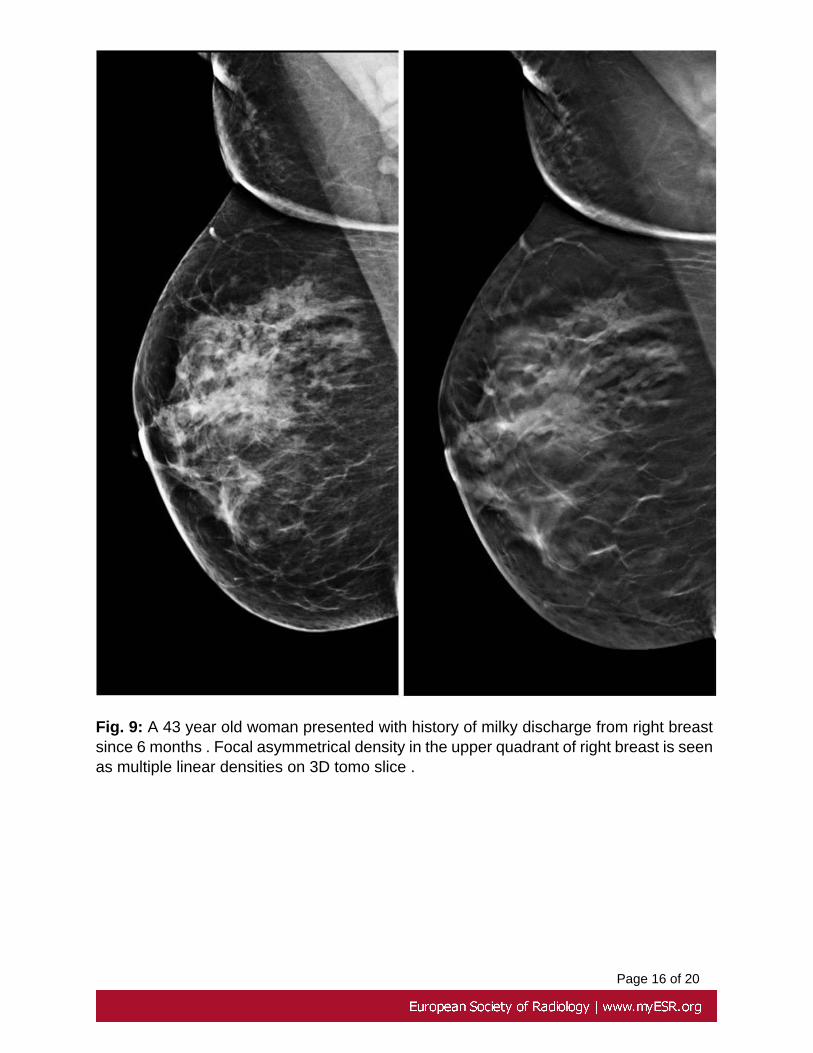
• In carcinomas, the border of the mass ( Figs. 4,5,6 ), the extent ofaccompanying microcalcifications (Ref 2) (Fig 5 & 6 ), fat within the massin invasive lobular cancer (Ref 1) (Fig.10) are better depicted on breasttomosynthesis images than on 2D mammograms.
• Secondary signs like asymmetrical density and architectural distortion arebetter resolved (Fig 7)
• The depth of a lesion can be assessed by 3 D Tomosynthesis, as thelocation of the lesion from the skin is automatically verified from the positionof the reconstructed section obviating the need to take additional tangentialviews for superficial skin lesions( Ref 2)(Fig 12).
• 3D Tomosynthesis also showed greater accuracy in the prediction of benignand malignant cases which correlated better with histopathology ( Fig 13 ).
• 3D tomo is better at predicting benign pattern of calcification infibroadenomas. The pattern and distribution of calcification can be seenbetter and brighter as it is confined to a single slice. However indeterminatecalcifications of the softer variety , the powdery type of fibrocystic diseaseand DCIS need the 2D magnified views for visualisation and analysis.
In conclusion the improvement in lesion perception and analysis by 3D tomosynthesis inthe Combined mode increases the level of confidence in diagnosis, thereby reducing theneed for additional time consuming examinations .
Images for this section:
Page 15 of 20
Fig. 8: A 47 year old lady presented with a nodule in the outer aspect of right breast.RCCin 2d and 3d shows this as a benign nodule. However there is another non palpablenodule obscured by the parenchyma in 2D which on 3D is seen as a well defined noduleclearly with a 'complete halo sign' in the line of nipple .This is seen as a well defined ovoidnodule with peripherally placed benign bright calcification within the lesion - calcifiedfibroadenoma .
Page 16 of 20
Fig. 9: A 43 year old woman presented with history of milky discharge from right breastsince 6 months . Focal asymmetrical density in the upper quadrant of right breast is seenas multiple linear densities on 3D tomo slice .
Page 17 of 20
Fig. 10: The fat within the spiculated lesion is appreciated in this lobular carcinoma inthe 3D tomo slice
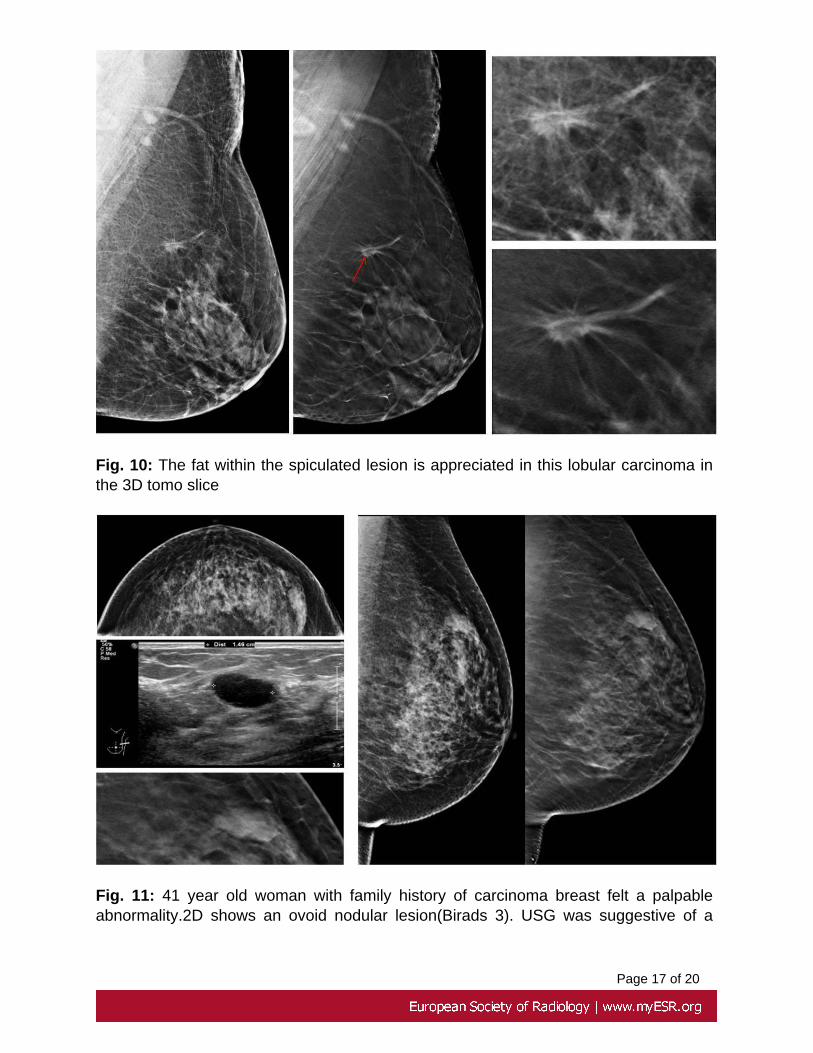
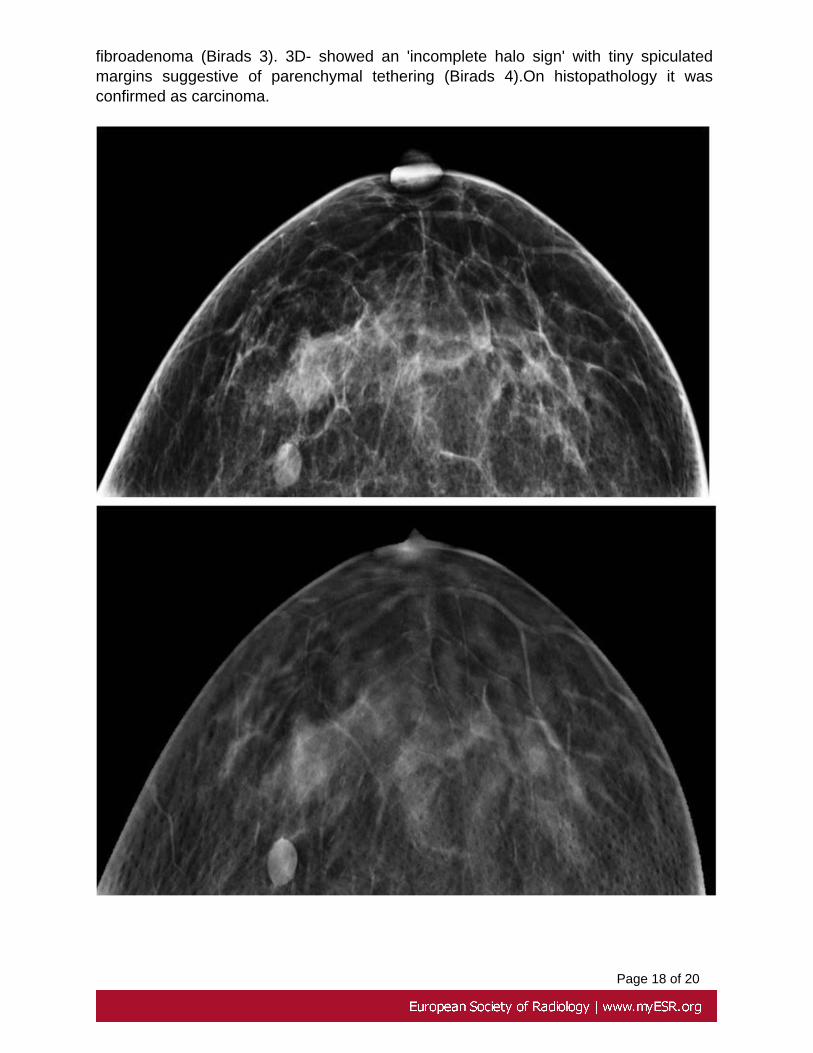
Fig. 11: 41 year old woman with family history of carcinoma breast felt a palpableabnormality.2D shows an ovoid nodular lesion(Birads 3). USG was suggestive of a
Page 18 of 20
fibroadenoma (Birads 3). 3D- showed an 'incomplete halo sign' with tiny spiculatedmargins suggestive of parenchymal tethering (Birads 4).On histopathology it wasconfirmed as carcinoma.
Page 19 of 20
Fig. 12: Palpable nodule in left breast.Ovoid nodule is seen in the outer aspect ofright breast which on tomosynthesis slices is seen in the superficial plane of left breastjust beneath the skin (note the prominence of the skin pores in 3D).The location wasverified from the position of the reconstructed section on the slice locator in the viewingconsole.USG also confirmed the location and HPE confirmed it as an epidermal cyst.
Fig. 13
Page 20 of 20
References
1. Steven P. Poplack et al :Digital Breast tomosynthesis:Initial Experience in 98Women with Abnormal Digital Screening Mammography, American Journalof Radiology, 189,September 2007,616-623
2. Jeong Mi Park et al : Breast Tomosynthesis:Present Considerations andFuture Applications, RadioGraphics 27, 2007, S231-S24
3. David Gur et al : Localized Detection and Classification of Abnormalities onFFDM and Tomosynthesis Examinations Rated Under an FROC Paradigm,American Journal of Radiology,196, March 2011,737-741.
4. Christiane M. Hakim et al :Digital Breast Tomosynthesis in theDiagnostic Environment: A Subjective Side-by-Side Review , AmericanJournal of Radiology,195, August 2010,172-176.
5. David Gur et al : Digital Breast Tomosynthesis: ObserverPerformanceStudy ,American Journal of Radiology,193, August2009,586-591.
6. Walter F. Good et al :Digital Breast Tomosynthesis:A Pilot ObserverStudy,American Journal of Radiology,190, April 2008, 865-869.
7. Loren T. Niklason et al :Digital Tomosynthesis In Breast ImagingRadiology, 205 1997, 399-406.
8. M. Lee Spangler et al :Detection and Classification of Calcifications onDigital Breast Tomosynthesis and 2D Digital Mammography: A Comparison,American Journal of Radiology,196, February 2011 , 320-324
9. Tomosynthesis and 2D Digital Mammography:A Comparison , AmericanJournal of Radiology,196, February 2011 , 320-324.
Personal Information

Apollo hospitals: http://www.apollohospitals.com/Twitter: https://twitter.com/HospitalsApolloYoutube: http://www.youtube.com/apollohospitalsindiaFacebook: http://www.facebook.com/TheApolloHospitalsSlideshare: http://www.slideshare.net/Apollo_HospitalsLinkedin: http://www.linkedin.com/company/apollo-hospitalsBlog:Blog: http://www.letstalkhealth.in/