
Role of atmospheric aerosol concentration on deep convective
16
Role of atmospheric aerosol concentration on deep convective precipitation: Cloud-resolving model simulations Wei-Kuo Tao, 1 Xiaowen Li, 1,2 Alexander Khain, 3 Toshihisa Matsui, 1,2 Stephen Lang, 4 and Joanne Simpson 1 Received 30 March 2007; revised 28 September 2007; accepted 22 October 2007; published 22 December 2007. [1] A two-dimensional cloud-resolving model with detailed spectral bin microphysics is used to examine the effect of aerosols on three different deep convective cloud systems that developed in different geographic locations: south Florida, Oklahoma, and the central Pacific. A pair of model simulations, one with an idealized low cloud condensation nuclei (CCN) (clean) and one with an idealized high CCN (dirty environment), is conducted for each case. In all three cases, rain reaches the ground earlier for the low-CCN case. Rain suppression is also evident in all three cases with high CCN. However, this suppression only occurs during the early stages of the simulations. During the mature stages of the simulations the effects of increasing aerosol concentration range from rain suppression in the Oklahoma case to almost no effect in the Florida case to rain enhancement in the Pacific case. The model results suggest that evaporative cooling in the lower troposphere is a key process in determining whether high CCN reduces or enhances precipitation. Stronger evaporative cooling can produce a stronger cold pool and thus stronger low-level convergence through interactions with the low-level wind shear. Consequently, precipitation processes can be more vigorous. For example, the evaporative cooling is more than two times stronger in the lower troposphere with high CCN for the Pacific case. Sensitivity tests also suggest that ice processes are crucial for suppressing precipitation in the Oklahoma case with high CCN. A comparison and review of other modeling studies are also presented. Citation: Tao, W.-K., X. Li, A. Khain, T. Matsui, S. Lang, and J. Simpson (2007), Role of atmospheric aerosol concentration on deep convective precipitation: Cloud-resolving model simulations, J. Geophys. Res., 112, D24S18, doi:10.1029/2007JD008728. 1. Introduction [2] Aerosols and especially their effect on clouds are one of the key components of the climate system and the hydrological cycle [Ramanathan et al., 2001]. Yet, the aerosol effect on clouds remains largely unknown and the processes involved not well understood. A recent report published by the National Academy of Science states ‘‘The greatest uncertainty about the aerosol climate forcing—indeed, the largest of all the uncertainties about global climate forcing—is probably the indirect effect of aerosols on clouds’’ [National Research Council, 2005, p. 29]. The aerosol effect on clouds is often categorized into the traditional ‘‘first indirect (i.e., Twomey)’’ effect on the cloud droplet sizes for a constant liquid water path [Twomey , 1977] and the ‘‘semidirect’’ effect on cloud coverage [e.g., Ackerman et al., 2000]. Enhanced aerosol concentrations can also suppress warm rain processes by producing a narrow droplet spectrum that inhibits collision and coalescence processes [e.g., Squires and Twomey , 1960; Warner and Twomey , 1967; Warner, 1968; Rosenfeld, 1999]. [3] The aerosol effect on precipitation processes, also known as the second type of aerosol indirect effect [Albrecht, 1989], is even more complex, especially for mixed-phase convective clouds. A combination of cloud top temperature and effective droplet sizes, estimated from the Advanced Very High Resolution Radiometer (AVHRR), has been used to infer the suppression of coalescence and precipitation processes for smoke [Rosenfeld and Lensky , 1998] and desert dust [Rosenfeld et al., 2001]. Multisensor (passive/active microwave and visible and infrared sensors) satellite observations from the Tropical Rainfall Measuring Mission (TRMM) have been used to infer the presence of nonprecipitating supercooled liquid water near the cloud top due to overseeding from both smoke over Indonesia [Rosenfeld, 1999] and urban pollution over Australia [Rosenfeld, 2000]. In addition, aircraft measurements have provided evidence of sustained supercooled liquid JOURNAL OF GEOPHYSICAL RESEARCH, VOL. 112, D24S18, doi:10.1029/2007JD008728, 2007 Click Here for Full Articl e 1 Laboratory for Atmospheres, NASA Goddard Space Flight Center, Greenbelt, Maryland, USA. 2 Goddard Earth Sciences and Technology Center, University of Maryland, Baltimore County, Baltimore, Maryland, USA. 3 Department of Atmospheric Science, Hebrew University of Jerusalem, Jerusalem, Israel. 4 Science Systems and Applications, Inc., Lanham, Maryland, USA. Copyright 2007 by the American Geophysical Union. 0148-0227/07/2007JD008728$09.00 D24S18 1 of 16
Transcript of Role of atmospheric aerosol concentration on deep convective

Role of atmospheric aerosol concentration
on deep convective precipitation:
Cloud-resolving model simulations
Wei-Kuo Tao,1 Xiaowen Li,1,2 Alexander Khain,3 Toshihisa Matsui,1,2 Stephen Lang,4
and Joanne Simpson1
Received 30 March 2007; revised 28 September 2007; accepted 22 October 2007; published 22 December 2007.
[1] A two-dimensional cloud-resolving model with detailed spectral bin microphysics isused to examine the effect of aerosols on three different deep convective cloud systemsthat developed in different geographic locations: south Florida, Oklahoma, and thecentral Pacific. A pair of model simulations, one with an idealized low cloud condensationnuclei (CCN) (clean) and one with an idealized high CCN (dirty environment), isconducted for each case. In all three cases, rain reaches the ground earlier for the low-CCNcase. Rain suppression is also evident in all three cases with high CCN. However, thissuppression only occurs during the early stages of the simulations. During the maturestages of the simulations the effects of increasing aerosol concentration range from rainsuppression in the Oklahoma case to almost no effect in the Florida case to rainenhancement in the Pacific case. The model results suggest that evaporative cooling in thelower troposphere is a key process in determining whether high CCN reduces or enhancesprecipitation. Stronger evaporative cooling can produce a stronger cold pool and thusstronger low-level convergence through interactions with the low-level wind shear.Consequently, precipitation processes can be more vigorous. For example, the evaporativecooling is more than two times stronger in the lower troposphere with high CCN for thePacific case. Sensitivity tests also suggest that ice processes are crucial for suppressingprecipitation in the Oklahoma case with high CCN. A comparison and review of othermodeling studies are also presented.
Citation: Tao, W.-K., X. Li, A. Khain, T. Matsui, S. Lang, and J. Simpson (2007), Role of atmospheric aerosol concentration on deep
convective precipitation: Cloud-resolving model simulations, J. Geophys. Res., 112, D24S18, doi:10.1029/2007JD008728.
1. Introduction
[2] Aerosols and especially their effect on clouds are oneof the key components of the climate system and thehydrological cycle [Ramanathan et al., 2001]. Yet, theaerosol effect on clouds remains largely unknown andthe processes involved not well understood. A recentreport published by the National Academy of Sciencestates ‘‘The greatest uncertainty about the aerosol climateforcing—indeed, the largest of all the uncertainties aboutglobal climate forcing—is probably the indirect effect ofaerosols on clouds’’ [National Research Council, 2005,p. 29]. The aerosol effect on clouds is often categorizedinto the traditional ‘‘first indirect (i.e., Twomey)’’ effecton the cloud droplet sizes for a constant liquid water
path [Twomey, 1977] and the ‘‘semidirect’’ effect oncloud coverage [e.g., Ackerman et al., 2000]. Enhancedaerosol concentrations can also suppress warm rainprocesses by producing a narrow droplet spectrum thatinhibits collision and coalescence processes [e.g., Squiresand Twomey, 1960; Warner and Twomey, 1967; Warner,1968; Rosenfeld, 1999].[3] The aerosol effect on precipitation processes, also
known as the second type of aerosol indirect effect[Albrecht, 1989], is even more complex, especially formixed-phase convective clouds. A combination of cloudtop temperature and effective droplet sizes, estimated fromthe Advanced Very High Resolution Radiometer (AVHRR),has been used to infer the suppression of coalescence andprecipitation processes for smoke [Rosenfeld and Lensky,1998] and desert dust [Rosenfeld et al., 2001]. Multisensor(passive/active microwave and visible and infrared sensors)satellite observations from the Tropical Rainfall MeasuringMission (TRMM) have been used to infer the presence ofnonprecipitating supercooled liquid water near the cloud topdue to overseeding from both smoke over Indonesia[Rosenfeld, 1999] and urban pollution over Australia[Rosenfeld, 2000]. In addition, aircraft measurementshave provided evidence of sustained supercooled liquid
JOURNAL OF GEOPHYSICAL RESEARCH, VOL. 112, D24S18, doi:10.1029/2007JD008728, 2007ClickHere
for
FullArticle
1Laboratory for Atmospheres, NASA Goddard Space Flight Center,Greenbelt, Maryland, USA.
2Goddard Earth Sciences and Technology Center, University ofMaryland, Baltimore County, Baltimore, Maryland, USA.
3Department of Atmospheric Science, Hebrew University of Jerusalem,Jerusalem, Israel.
4Science Systems and Applications, Inc., Lanham, Maryland, USA.
Copyright 2007 by the American Geophysical Union.0148-0227/07/2007JD008728$09.00
D24S18 1 of 16

water down to �37.5�C in continental mixed-phaseconvective clouds [Rosenfeld and Woodley, 2000]. Thesefindings further suggest that continental aerosols reducethe mean size of cloud droplets, suppressing coalescenceand warm rain processes, permitting more freezing ofcloud droplets and associated latent heat release abovethe 0�C isotherm, and enhancing the growth of large hailand cold rain processes [Rosenfeld and Woodley, 2000].Andreae et al. [2004] analyzed in situ observation duringLBA-SMOCC (the Large-Scale Biosphere-AtmosphereExperiment in Amazonia-Smoke, Aerosols, Clouds, Rain-fall, and Climate) campaign and found that increases insmoke and surface heat due to biomass burning tend tolead to higher cloud top heights and the enhancement ofcold rain processes over the Amazon basin. Lin et al.[2006] examined multiplatform satellite data over theAmazon basin and found that high biomass burning-derived aerosols are correlated with the high cloud topheights, large anvils, and more rainfall. Koren et al.[2005] examined cloud properties derived from theModerate Resolution Imaging Spectroradiometer(MODIS) and found strong evidence that aerosols frompollution, desert dust and biomass burning systematicallyinvigorate convective clouds over the Atlantic Ocean.Using long-term integrated TRMM-derived precipitationdata, Bell et al. [2007] found a significant midweekincrease in summertime afternoon thunderstorms over thesoutheast U.S., which coincides with a midweek increasein ground-measured aerosol concentration. These findingsare consistent with the notion that aerosols have a majorimpact on the dynamics, microphysics, and electrificationproperties of continental mixed-phase convective clouds[Rosenfeld and Woodley, 2000; Orville et al., 2001;Williams et al., 2002]. In addition, high aerosol concen-trations in urban environments could affect precipitationvariability by providing an enhanced source of cloud con-densation nuclei (CCN). Hypotheses have been developedto explain the effect of urban regions on convection andprecipitation [van den Heever and Cotton, 2007; Shepherd,2005].[4] Table 1 summarizes the key observational studies
identifying the microphysical properties, cloud character-istics, thermodynamics and dynamics associated with cloudsystems from high-aerosol continental environments. Forexample, atmospheric aerosol concentrations can influencecloud droplet size distributions, warm rain process, cold rainprocess, cloud top height, the depth of the mixed phase
region, and occurrence of lightning. These observationalstudies are useful for validating modeling studies.[5] Recently, cloud-resolving models (CRMs) have been
used to examine the role of aerosols on mixed-phaseconvective clouds (see Table 2). These modeling studieshad many differences in terms of model configuration (two-dimensional (2-D) or 3-D), domain size, grid spacing (150–3000 m), microphysics (i.e., two-moment bulk, simple orsophisticated spectral bin), turbulence (first- or 1.5-orderTKE), radiation, lateral boundary conditions (i.e., closed,radiative open and cyclic), cases (isolated convection,tropical/midlatitude squall lines) and model integration time(e.g., 2.5 to 48 h). Almost all of the model results indicatedthat aerosol concentration had a significant impact onprecipitation processes. For example, Khain and Pokrovsky[2004] and Khain et al. [2004, 2005] found that an increasein aerosol concentration (or CCN) reduced precipitationprocesses (and rainfall) for both an East Atlantic squall lineand a Texas convective cloud. They also found that anincrease in CCN enhanced precipitation for an Oklahomasquall line. Khain et al. [2004, 2005] found that aerosoleffects on precipitation for deep convective clouds stronglydepend on relative humidity and the environmental con-ditions, so that an increase in aerosol concentration formaritime tropical convection can lead to an increase inprecipitation amount. In addition, they reported that aero-sols could affect the dynamics of convection via the strengthof convective updrafts and downdrafts [Khain et al., 2004],fostering the formation of secondary clouds in squall linesand thus increasing precipitation. On the other hand, Wang[2005] found that precipitation could either be enhanced orreduced by increasing the CCN for a squall line thatdeveloped in the ITCZ (Intertropical Convergence Zone).Fan et al. [2007] found that ice microphysics, clouds andprecipitation changed considerably with aerosol chemicalproperties for a convective event in Houston, Texas. Fridlindet al. [2004] found midtropospheric aerosols were importantas subtropical anvil nuclei for an isolated cloud, but Khainand Pokrovsky [2004] and van denHeever and Cotton [2007]indicated that lower tropospheric aerosols (penetrating cloudbase and below 4 km) dominated for deep convective clouds.These differences could be due to model physics, cases and/or setups (e.g., domain size, lateral boundary conditions).Teller and Levin [2006] showed that high CCN concentra-tions reduced precipitation in mixed-phase convective cloudsduring the first hour of model integration.
Table 1. Key Observational Studies Identifying the Differences in the Microphysical Properties, Cloud Characteristics,
Thermodynamics, and Dynamics Associated With Clouds and Cloud Systems Developed in Dirty and Clean Environments
Properties High CCN (Dirty) Low CCN (Clean) References (Observations)
Cloud droplet sizedistribution
narrower broader Rosenfeld and Lensky [1998], Rosenfeld [1999, 2000],Rosenfeld et al. [2001], Rosenfeld and Woodley [2000],
Andreae et al. [2004], Koren et al. [2005],Warm-rain process suppressed enhanced Rosenfeld [1999, 2000], Rosenfeld and Woodley [2000],
Rosenfeld and Ulbrich [2003], Andreae et al. [2004], Lin et al. [2006]Cold-rain process enhanced suppressed Rosenfeld and Woodley [2000], Orville et al. [2001],
Williams et al. [2002], Andreae et al. [2004], Lin et al. [2006],Bell et al. [2007]
Mixed phase region deeper shallower Rosenfeld and Lensky [1998], Williams et al. [2002], Lin et al. [2006]Cloud top height higher lower Andreae et al. [2004], Koren et al. [2006], Lin et al. [2006]Lightning enhanced (downwind
side)/higher max flashless and lowermax flash
Williams et al. [2002], Orville et al. [2001]
D24S18 TAO ET AL.: AEROSOL EFFECT ON DEEP CONVECTION
2 of 16
D24S18

Table
2.Key
PapersUsingCRMsto
StudytheIm
pactofAerosolsonPrecipitationa
Dim
ensions
Microphysics
Turbulence
Radiation
Domain
GridSizeand
Tim
eStep
Lateral
Boundary
Conditions
Cases
Integration
Khain
etal.
[2004]
2-D
spectral
bin
(33bin);
6types
ofice
firstorder
no
64�
16km
dx=250m,
dz=125m,
dt=5s
closed
squalllines
(E.Atlantic)
andaconvective
cloud(Texas)
�2h
Khain
and
Pokrovsky
[2004]
2-D
spectral
bin
(33bin);
6types
ofice
firstorder
no
64�
16km
dx=250m,
dz=125m,
dt=5s
closed
aconvective
cloud(Texas)
2.5
h
Khain
etal.
[2005]
2-D
spectral
bin
(33bin);
6types
ofice
firstorder
no
128�
16km
dx=250m,
dz=125m,
dt=5s
closed
twosqualllines
(E.Atlanticand
Oklahoma)
anda
convectivecloud
(Texas)
2and
4h
Fridlindet
al.[2004]
3-D
spectral
bin
(16bins);
1typeofice
firstorder
no
48�
48
�24km
dx=dy=500m,
dz=375m,
dt=5s
closed
aconvectivecloud
(Florida)
3h
Wang
[2005]
3-D
two-m
omentbulk
schem
efirstorder
6broadbandsfor
solarand12forIR;
four-stream
discrete-ordinate
scattering,
k-distribution
400�
200
�25km
dx=dy=2000m,
dz=500m,
dt=5s
cyclic
asquallline
(ITCZ)
4h
vanden
Heeveret
al.[2006]
3-D
two-m
omentbulk
schem
efirstorder
abroadband
two-stream
forsolarandan
emissivityforIR
145�
145
�20km
dx=dy=500m,
dz=stretched,
dt=1s
radiative
open
thunderstorm
(CRYSTAL-
FACE)
12h
Chenget
al.[2007]
3-D
two-m
omentbulk
schem
e(w
arm
rain
only)
firstorder
asimple
broadband
solarand
emissivity(IR)
810�
810km
�100Pa
dx=dy=3000m,
dz=stretched,
dt=5s
radiative
open
ashallow
Stratus
(ARM-SGP)
72h
Lynnet
al.
[2005a,
2005b]
3-D
spectral
bin
(33bin);
3types
ofice
andbulk
schem
e
TKE
Abroadband
two-stream
forsolarandan
emissivityforIR
400�
199
�25km
dx=dy=1000m,
dz=stretched,
dt=9s
radiative
open
asquallline
(Florida)
13h
Fanet
al.
[2007]
2-D
spectral
bin
(33bin);
6types
ofice
TKE
no
512�
22km
dx=500m,
dz=stretched
(250–1260m),
dt=6s
radiative
open
aseabreeze–
induced
convectiveevent
(Houston,Tx)
3h
Tellerand
Levin
[2006]
2-D
spectral
bin
(33bin);
3types
ofice
firstorder
no
30�
8km
dx=300m,
dz=300m,
dt=2s
closed
winterconvective
cloudeastern
Mediterranean
80min
vanden
Heever
andCotton
[2007]
3-D
two-m
omentbulk
schem
efirstorder
abroadband
two-stream
for
solarandan
emissivityforIR
228�
228
�22km
dx=dy=1500m,
dz=stretched,
dt=2s
radiative
open
thunderstorm
(St.Louis)
26h
aModeldim
ensionality(2-D
or3-D
),microphysicalschem
es(spectralbin
ortwo-m
omentbulk),turbulence
param
eterization(first-or1.5-order
TKE),radiation(w
ithorwithout),domainsize
(km),resolution(m
),timestep
(s),lateralboundarycondition(closed,cyclic,orradiativeopen),andcase
andintegrationtime(h)arealllisted.
D24S18 TAO ET AL.: AEROSOL EFFECT ON DEEP CONVECTION
3 of 16
D24S18

[6] Regional-scale models with fine resolution have alsobeen used to study the impact of aerosols on precipitation[i.e., van den Heever et al. 2006; van den Heever and Cotton,2007; Lynn et al., 2005a, 2005b; Cheng et al., 2007]. Forexample, Lynn et al. [2005b] found a ‘‘continental’’ aerosolconcentration produces a larger earlier maximum rainfall rateand more accumulated rainfall than does a ‘‘maritime’’aerosol concentration for a squall line; however, time accu-mulated rain is slightly larger with a maritime aerosolconcentration over the whole model domain. Cheng et al.[2007] found that increasing aerosols inhibited precipitationfor an Oklahoma warm cloud system. van den Heever et al.[2006] found that high-GCCN (giant CCN) and –IN (icenuclei) cases initially enhance the surface precipitation dur-ing the first 6 h of integration because of initial broadening ofthe cloud droplet spectra, whereas high CCN reduce totalaccumulated precipitation. van den Heever and Cotton[2007] found that the response of convective rainfall tourban-enhanced aerosols becomes stronger when the back-ground aerosol concentrations are low.[7] In almost all cases, idealized aerosol concentrations
were used in the model simulations. Aerosol concentrationsobserved/measured from a previous day were used byFridlind et al. [2004]. Vertical profiles of CCN, GCCN,and ice forming nuclei (IFN) obtained on ‘‘dirty’’ and‘‘clean’’ days during the CRYSTAL-FACE (Cirrus RegionalStudy of Tropical Anvils and Cirrus Layers–Florida AreaCumulus Experiment) were used by van den Heever et al.[2006] and van den Heever and Cotton [2007] as bench-marks for their model sensitivity tests. Furthermore, almostnone of these CRM studies compared the model results withobserved cloud structures, organization, radar reflectivityand rainfall. Some of the CRM domains were too small toresolve the observed clouds or precipitation systems (thedomain size has to be at least twice as large as the simulatedfeatures).[8] This paper will investigate the effect of atmospheric
aerosols on precipitation processes using a 2-D CRM withdetailed spectral bin microphysics. Three different cloudsystems with very different environmental conditions willbe simulated. Sensitivity tests will be conducted to examinethe precipitation processes associated with dirty and cleanenvironments. The model and three cases will be describedin section 2. The results and comparison with previousmodeling studies will be discussed in sections 3 and 4,respectively. In section 5, the summary and future work willbe presented.
2. Model and Cases
2.1. Model Description
[9] The model used in this study is the 2-D version of theGoddard Cumulus Ensemble (GCE) model. The GCEmodel was originally developed by Soong and Ogura[1980] and Soong and Tao [1980]. The equations thatgovern the cloud-scale motion are anelastic by filteringout sound waves. The subgrid-scale turbulence used in themodel is based on work by Klemp and Wilhelmson [1978].In their approach, one prognostic equation is solved forsubgrid kinetic energy, which is then used to specify theeddy coefficients. The effect of condensation on the gener-ation of subgrid-scale kinetic energy is also incorporated to
the model [Soong and Ogura, 1980]. The model includesinteractive solar [Chou et al., 1998] and thermal infrared[Chou and Suarez, 1994] radiation parameterizationschemes. All scalar variables (potential temperature, mixingratio of water vapor, turbulence coefficients, and all hydro-meteor classes) use forward time differencing and a positivedefinite advection scheme with a nonoscillatory option[Smolarkiewicz and Grabowski, 1990]. The dynamic vari-ables, u and w, use a fourth-order accurate advectionscheme and leapfrog time integration. Details of the GCEmodel description and improvements can be found in workby Tao and Simpson [1993] and Tao et al. [2003a].[10] The spectral bin microphysics used in the GCE
model were developed by Khain et al. [2000], Khain etal. [2004], and Khain et al. [2005]. The formulation is basedon solving stochastic kinetic equations for the size distribu-tion functions of water droplets (cloud droplets and rain-drops), and six types of ice particles: pristine ice crystals(columnar and plate-like), snow (dendrites and aggregates),graupel, and frozen drops/hail. Each type is described by asize distribution using 33 categories (mass bins). Sizespectra of atmospheric aerosols are also described using33 bins.[11] The spectral bin microphysics includes the following
processes: (1) nucleation of droplets and ice particles[Pruppacher and Klett, 1997; Meyers et al., 1992], (2)immersion freezing [Vali, 1994], (3) ice multiplication[Hallett and Mossop, 1974; Mossop and Hallett, 1974],(4) detailed melting [Khain et al., 2004], (5) condensation/evaporation of liquid drops [Pruppacher and Klett, 1997;Khain et al., 2000], (6) deposition/sublimation of ice par-ticles [Pruppacher and Klett, 1997; Khain et al., 2000],(7) drop/drop, drop/ice, and ice/ice collision/coalescence[Pruppacher and Klett, 1997; Pinsky et al., 2001], (8) tur-bulence effects on liquid drop collisions [Pinsky et al.,2000], and (9) collisional breakup [Seifert et al., 2005]. Inthe first process, both condensation-freezing and homoge-neous nucleation are considered. The Meyers’ formula isapplied in a semi-Lagranigan approach [see Khain et al.,2000]. The concentration of newly nucleated ice crystals ateach time step is calculated by the increase in the value ofsupersaturation. Sedimentation of liquid and ice particles isalso considered. This model is specially designed to take intoaccount the effect of atmospheric aerosols on cloud devel-opment and precipitation formation. The activation of aero-sols in each size bin are explicitly calculated in this scheme[Khain et al., 2000].[12] The initial aerosol size distribution is calculated with
an empirical formula: N = N0Swk [Pruppacher and Klett,
1997], where Sw is the supersaturation with respect to waterand N0 and k are constants. The formula gives the sizedistribution of the initial CCN spectrum. In this study, thebaseline simulations (clean scenarios) use N0 = 100 cm
�3 andk = 0.42 for the clean maritime (TOGA COARE) case,and N0 = 600 cm�3 and k = 0.3 for the clean conti-nental (PRESTORM and CRYSTAL) cases [Twomey andWojciechowski, 1969]. The dirty scenarios for all threecases assume N0 = 2500 cm�3 and k = 0.3. In continentalcases, aerosols with diameters larger than 0.8 mm areremoved [Cooper et al., 1997]. The oceanic aerosols haveplenty of large size aerosols generated from sea spray, butthey do not have very fine particles [Hudson, 1984, 1993].
D24S18 TAO ET AL.: AEROSOL EFFECT ON DEEP CONVECTION
4 of 16
D24S18
Therefore small CCN, which can only be activated whenthe ambient super saturation exceeds 1.1%, are eliminatedfrom the maritime aerosol spectra.[13] Radiative open lateral boundary conditions are used
[Klemp and Wilhelmson, 1978]. A large horizontal domainis used in this study to simulate the large convective systemand minimize the reflection of convectively generatedgravity waves at the lateral boundaries [see Fovell andOgura, 1988]. At the top of the model, a free-slip conditionis used for horizontal wind, temperature, and specifichumidity, and zero vertical velocity is applied. There are1024 horizontal grid points with a resolution of 1 km in thecenter 720 points and stretched grids on either side. Use ofthe stretched horizontal grid makes the model less sensitiveto the choice of gravity wave speed associated with the openlateral boundary conditions [Fovell and Ogura, 1988]. Forthe present study, a stretched vertical coordinate with 33levels is used. The model has finer resolution (about 80 m)in the boundary layer and coarser resolution (about 1000 m)in the upper levels. The model time step is 5 s.
2.2. Cases
[14] Three cases, a tropical oceanic squall system ob-served during TOGA COARE (Tropical Ocean and GlobalAtmosphere Coupled Ocean-Atmosphere Response Exper-iment, which occurred over the Pacific Ocean warm poolfrom November 1992 to February 1993), a midlatitudecontinental squall system observed during PRESTORM(Preliminary Regional Experiment for STORM-Central,which occurred in Kansas and Oklahoma during May–June1985), and a midafternoon convection observed duringCRYSTAL-FACE (Cirrus Regional Study of TropicalAnvils and Cirrus Layers–Florida Area Cumulus Experi-ment, which occurred in Florida during July 2002), will beused to examine the impact of aerosols on deep, precipitat-ing systems. The 10–11 June 1985 PRESTORM case hasbeen well studied [e.g., Johnson and Hamilton, 1988;Rutledge et al., 1988; Tao et al., 1995, 1996; Yang andHouze, 1995; Lang et al., 2003]. The PRESTORM envi-ronment is fairly unstable and relatively dry. The model isinitialized with a single sounding taken at 2330 UTC fromPratt, KS, which is ahead of the squall line. The soundinghas a lifted index of �5.37 and a convective availablepotential energy (CAPE) of 2300 J/kg. Radiation is includedbut not surface fluxes. The convective system is initiatedusing a low-level cold pool.[15] The 22 February 1993 TOGA COARE squall line
has also been well studied [Jorgensen et al., 1997;
Redelsperger et al., 2000; Trier et al., 1996, 1997; Wanget al., 1996, 2003]. The sounding used to initialize themodel is from LeMone et al. [1994]. It is a composite ofaircraft data below 6 km and an average of the 1800 and2400 UTC Honiara soundings above 6 km. The CAPE andlifted index are moderately unstable, 1776 J/kg and �3.2,respectively. Surface fluxes are included in the model forthis case using the TOGA COARE flux algorithm [Fairallet al., 1996; Wang et al., 1996]. The vertical grids aresimilar to the PRESTORM setup, but with the first grid of40 m to accommodate the TOGA COARE flux algorithm.The horizontal grids follow that of PRESTORM, but withan inner resolution of 750 m. Radiation is included, and alow-level cold pool is used to start the system. Low-levelmesoscale lifting is also applied. It has a peak value of3.4 cm/s near 1 km and is applied over the first 2 h. Notethat the mesoscale model simulations [van den Heever etal., 2006; van den Heever and Cotton, 2007; Lynn et al.,2005a, 2005b] can explicitly represent mesoscale forcing/lifting (e.g., sea breeze convergence and urban heat islandconvergence).[16] Both the TOGA COARE and PRESTORM cases are
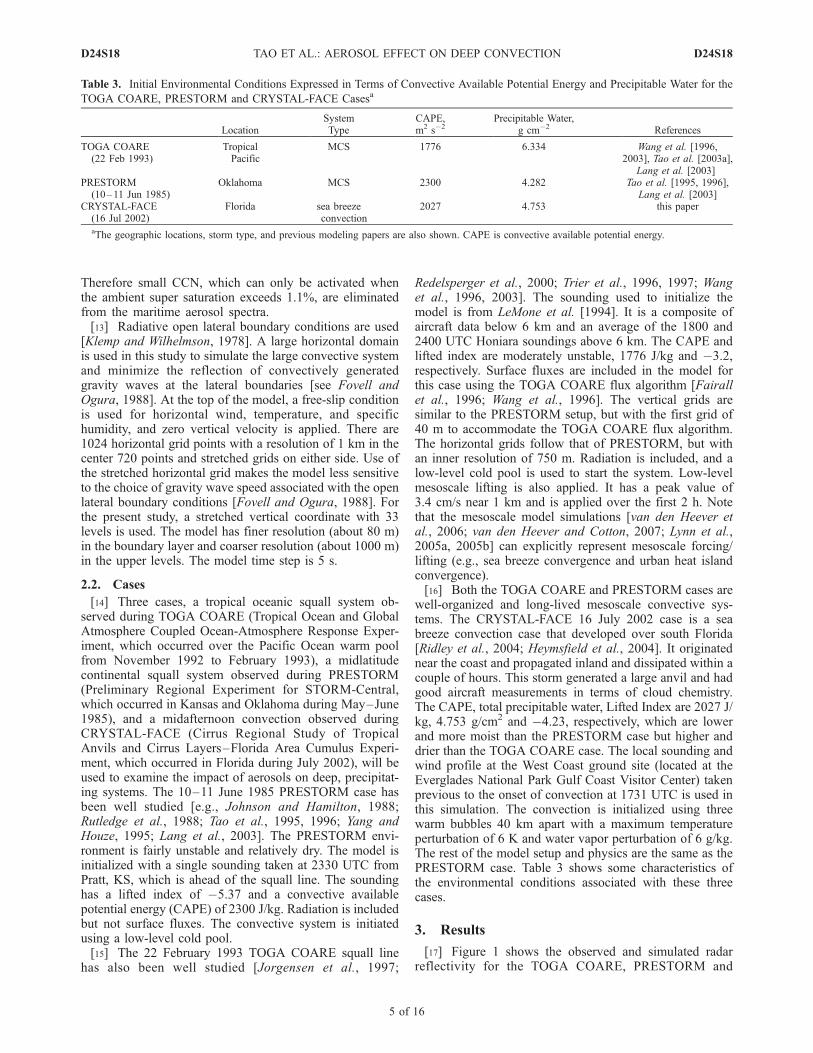
well-organized and long-lived mesoscale convective sys-tems. The CRYSTAL-FACE 16 July 2002 case is a seabreeze convection case that developed over south Florida[Ridley et al., 2004; Heymsfield et al., 2004]. It originatednear the coast and propagated inland and dissipated within acouple of hours. This storm generated a large anvil and hadgood aircraft measurements in terms of cloud chemistry.The CAPE, total precipitable water, Lifted Index are 2027 J/kg, 4.753 g/cm2 and �4.23, respectively, which are lowerand more moist than the PRESTORM case but higher anddrier than the TOGA COARE case. The local sounding andwind profile at the West Coast ground site (located at theEverglades National Park Gulf Coast Visitor Center) takenprevious to the onset of convection at 1731 UTC is used inthis simulation. The convection is initialized using threewarm bubbles 40 km apart with a maximum temperatureperturbation of 6 K and water vapor perturbation of 6 g/kg.The rest of the model setup and physics are the same as thePRESTORM case. Table 3 shows some characteristics ofthe environmental conditions associated with these threecases.
3. Results
[17] Figure 1 shows the observed and simulated radarreflectivity for the TOGA COARE, PRESTORM and
Table 3. Initial Environmental Conditions Expressed in Terms of Convective Available Potential Energy and Precipitable Water for the
TOGA COARE, PRESTORM and CRYSTAL-FACE Casesa
LocationSystemType
CAPE,m2 s�2
Precipitable Water,g cm�2 References
TOGA COARE(22 Feb 1993)
TropicalPacific
MCS 1776 6.334 Wang et al. [1996,2003], Tao et al. [2003a],
Lang et al. [2003]PRESTORM(10–11 Jun 1985)
Oklahoma MCS 2300 4.282 Tao et al. [1995, 1996],Lang et al. [2003]
CRYSTAL-FACE(16 Jul 2002)
Florida sea breezeconvection
2027 4.753 this paper
aThe geographic locations, storm type, and previous modeling papers are also shown. CAPE is convective available potential energy.
D24S18 TAO ET AL.: AEROSOL EFFECT ON DEEP CONVECTION
5 of 16
D24S18

CRYSTAL-FACE cases with dirty and clean conditions.The model simulations capture the various storm sizes andstructures in the different environmental conditions quitewell. For example, the leading convection and the extensivetrailing stratiform rain area compare well with the radarreflectivity observed during the mature stage of the conti-nental PRESTORM case [Rutledge et al., 1988]. Cleancases (i.e., the control experiments) generally agree betterwith the observations. In terms of radar reflectivity magni-tudes, the agreement between the simulations and observa-tions is better at lower levels where only liquid phase cloud/rainwater exists. The simulated radar reflectivity tends to behigher at upper levels and in the anvil area where ice phaseparticles dominate. This is partly due to the simplifiedassumption of uniform snow densities in this calculation.The melting band signal is also amplified by assuming thatall of the melting particles are coated by a layer of water ontheir surfaces.[18] Figure 2 shows time sequences of the GCE model-
estimated domain mean surface rainfall rate for the PRES-TORM, TOGA COARE and CRYSTAL cases. Rain sup-pression in the high CCN concentration (i.e., dirtyenvironment) runs is evident in all three case studies butonly during the first hour of the simulations. Rain reachesthe ground early in all the clean cases. This is in goodagreement with observations [e.g., Rosenfeld, 1999, 2000].During the mature stage of the simulations, the effect of
increasing the CCN concentration ranges from rain sup-pression in the PRESTORM case to little effect in theCRYSTAL-FACE case to rain enhancement in the TOGACOARE case. These results suggest that model simula-tions of the whole life cycle of convective system areneeded in order to assess the impact of aerosols onprecipitation processes associated with mesoscale convec-tive systems and thunderstorms. These results also showthe complexity of aerosol-cloud-precipitation interactionwithin deep convection.[19] Table 4 shows the domain-averaged surface rainfall
amounts, stratiform percentages, precipitation efficiencies,and ice water path ratios (ice water path divided by the sumof the liquid and ice water paths) for the TOGA COARE,PRESTORM and CRYSTAL-FACE cases under clean anddirty conditions. The precipitation is divided into convectiveand stratiform components [Tao et al., 1993; Lang et al.,2003]. The convective region includes areas with strongvertical velocities (over 3–5 m s�1) and/or heavy surfacerainfall. The stratiform region is simply nonconvective. Forthe PRESTORM case, the dirty scenario produces morestratiform (light) precipitation than does the clean case. It isexpected that a high CCN concentration allows for moresmall cloud droplets and ice particles to form. The lowercollection coefficient for smaller cloud and ice particlesallows for a larger amount of ice phase particles to betransported into the trailing stratiform region, producing a
Figure 1. Observed and simulated radar reflectivity for the PRESTORM, TOGA COARE, andCRYSTAL-FACE cases under dirty and clean conditions: (a) PRESTORM clean, (b) PRESTORM dirty,(c) PRESTORM observed (adapted from Rutledge et al. [1988]), (d) TOGA COARE clean, (e) TOGACOARE dirty, (f) TOGA COARE observed (courtesy of D. Jorgensen from NOAA National SevereStorms Laboratory), (g) CRYSTAL clean, (h) CRYSTAL dirty, and (i) CRYSTAL observed (courtesy ofJ. Heymsfield from NASA Goddard Space Flight Center).
D24S18 TAO ET AL.: AEROSOL EFFECT ON DEEP CONVECTION
6 of 16
D24S18

higher stratiform rain percentage in the dirty case. Aerosolsdo not have much impact on the stratiform percentage forthe CRYSTAL-FACE case because of its short life span.The reduction in stratiform rain (or light rain) in the dirtyenvironment for the TOGA COARE case is due to itsenhanced convective activity (stronger updrafts).[20] Precipitation efficiency (PE) is an important physical
parameter for measuring the interaction between convectionand its environment. Its definition varies [e.g., Ferrier et al.,1996; Sui et al., 2007]. In this study, the precipitationefficiency is defined as PE = (P � L)/P, where P is thetotal mass of condensates formed in clouds by diffusionalgrowth, and L is the loss of condensate mass due to dropevaporation and ice sublimation. The same precipitationefficiency was used by Khain et al. [2005]. When totalevaporation and sublimation are very small, PE will be
close to 1. Smaller PE generally indicates more evaporation/sublimation (i.e., during the decaying or less active stage ofclouds/cloud systems). The PEs of cloud systems in drierenvironments (e.g., PRESTORM and CRYSTAL-FACE)are generally smaller than those in moist environments(e.g., TOGA COARE). In addition, the simulations with adirty environment have a smaller PE than their counterpartsfor all three cases. This is because the smaller clouddroplets/ice particles simulated in the dirty cases result inlarger evaporation/sublimation. Even for the TOGACOARE case, where increasing the aerosols enhanced totalsurface rain, the relative increase of evaporation in the dirtyscenario still outweighs the relative enhancement of diffu-sional growth, resulting in a decrease in precipitation effi-
ciency. For example, in the definition dPE / dP
P� dL
L,
domain averagedP
P= 0.45 while
dL
L= 0.66, indicating a
higher sensitivity of evaporation to increasing aerosol con-centrations compared with the total condensation in this rainenhanced case. Table 4 also shows higher ice water pathratios for the continental cloud systems (i.e., PRESTORMand CRYSTAL-FACE). The larger CAPE and strongerconvective updrafts in the PRESTORM and CRYSTAL-FACE produce more ice particles than in the TOGA COAREcase.[21] For the PRESTORM and CRYSTAL-FACE cases,
the PE in the dirty run is only 7% and 5% smaller,respectively, than in the clean run. The strengths of theconvective updrafts vary little between the dirty and cleanscenarios for both cases (Figure 3). This could be the reasonfor the small changes in PE between the dirty and clean runsand could also account for the similarity in their ice waterpaths. The PE is reduced by 13% in the dirty scenario forthe TOGA COARE case. The much stronger convectiveactivity simulated in the dirty case produces a wider anddeeper anvil and more ice sublimation. This may be thecause of smaller PE in the dirty case. This also shows thatthe dirty environment leads to more ice formation forTOGA COARE.[22] Figure 3 shows time sequences of GCE model-
simulated maximum vertical velocity for PRESTORM,TOGA COARE and CRYSTAL-FACE. The maximumvertical velocity is stronger in PRESTORM than in bothTOGA COARE and CRYSTAL because PRESTORM hasthe largest CAPE. Williams et al. [2002] suggested thatupdraft strength would be stronger in a dirty environment.For both PRESTORM and CRYSTAL, the maximum ver-
Figure 2. Time series of GCE model-estimated domainmean surface rainfall rate (mm h�1) for the (a) PRE-STORM, (b) TOGA COARE, and (c) CRYSTAL cases. Thesolid (dashed) line represents clean (dirty) conditions.
Table 4. Domain-Averaged Surface Rainfall Amount, Stratiform Percentage, Precipitation Efficiency, and Ice Water Path Ratio for the
TOGA COARE, PRESTORM, and CRYSTAL-FACE Cases Under Dirty and Clean Conditionsa
TOGACOARE Clean
(100)
TOGACOARE Dirty
(2500)PRESTORMClean (600)
PRESTORMDirty (2500)
CRYSTALClean (600)
CRYSTALDirty (2500)
Averaged rain (mm/d/grid),mm d�1
18.0 28.4 38.3 29.1 12.6 11.0
Stratiform, % 50 17 43 70 43 40Precipitation efficiency, % 65 52 33 26 33 28Ice water path ratiob .52 .65 .86 .88 .75 .79
aNote there are 9 h in the PRESTORM and TOGA COARE simulations and 5 h in the CRYSTAL-FACE simulation.bIce water path ratio is ice water path divided by the total liquid and ice water path.
D24S18 TAO ET AL.: AEROSOL EFFECT ON DEEP CONVECTION
7 of 16
D24S18

tical velocity for the dirty scenario is slightly stronger thanthe clean environment during the early stages of stormdevelopment. However, aerosols do not have a majorinfluence on the maximum vertical velocities in these two
continental cases. Note that the updrafts (both maximumand domain averaged) are slightly stronger as the aerosolconcentrations are increased for the 28 July 2002 (CRYS-TAL –FACE) case as simulated by van den Heever et al.[2006]. The differences in initialization between the presentstudy and van den Heever et al. [2006] could be one of themajor reasons for the difference in cloud updraft strength.Other reasons could be the dimensionalities (3-D versus2-D) and environmental conditions. The TOGA COAREcase, on the other hand, shows much stronger maximumvertical velocities with a high CCN concentration (dirtyenvironment). This is consistent with the increase in simu-lated surface precipitation. The maximum vertical velocitiesdo not vary between the dirty and clean runs in the earlystages of the TOGA COARE case.[23] Figure 4 shows probability distribution functions
(PDFs) of rainfall intensity for the PRESTORM, TOGACOARE and CRYSTAL cases during the first hour ofsimulation. All three cases produce more light rain in thedirty environment. However, over the entire 9-h simulation,only the PRESTORM case maintains this characteristic. InTOGA COARE, more light precipitation was simulated inthe clean case, contrary to the first hour results, becausesimulated vertical velocities are weaker with a low CCN(see Figure 3b). The cumulated surface rainfall PDFs for theclean and dirty scenarios do not differ significantly over the5-h storm duration in CRYSTAL.[24] Rosenfeld and Lensky [1998] suggested that a deeper
mixed-phase layer may exist in dirty environments (highCCN). Williams et al. [2002] and Andreae et al. [2004] alsosuggested that higher maximum lightning flash rates asso-ciated with more mixed phase processes would occur fordirty environments. In this study, additional model sensitiv-ity experiments were performed by turning off the iceprocesses to examine the impact of ice microphysics onthe aerosol-precipitation interactions. In these sensitivity
Figure 3. Time series of GCE model-simulated maximumvertical velocity (m s�1) for the (a) PRESTORM, (b) TOGACOARE, and (c) CRYSTAL cases. The solid (dashed) linerepresents clean (dirty) conditions.
Figure 4. Probability distribution function of rainfall intensity for the (a) PRESTORM, (b) TOGACOARE, and (c) CRYSTAL cases. The gray and black bars represent clean and dirty conditions,respectively.
D24S18 TAO ET AL.: AEROSOL EFFECT ON DEEP CONVECTION
8 of 16
D24S18

tests, the following microphysical processes are included:(1) condensation/evaporation of liquid drops, (2) drop/dropcollision/coalescence, (3) turbulence effects on liquid dropcollisions, (4) collisional breakup, and (5) sedimentation ofliquid. These warm rain only sensitivity tests still allowcondensation to occur above the freezing level, replacingthe deposition. Therefore the differences between the pair ofcontrol runs (clean versus dirty) and the warm rain only runscan assess and examine the role of ice microphysics inproducing the sensitivities between the clean and dirtyenvironment.[25] Figure 5 shows time sequences of GCE model-
estimated domain mean surface rainfall rate without iceprocesses (warm rain only). For the PRESTORM case, themean surface rainfall under both clean and dirty conditionsis quite similar. The model-simulated maximum updraftvelocity under clean and dirty conditions was also quitesimilar (Figure 6). The establishment of steady rain is alsomuch faster compared with the full ice runs. This suggeststhat the ice processes are crucial in suppressing surfaceprecipitation and increasing the portion of light rain in adirty environment. For TOGA COARE, rain suppressiondue to high CCN is again only evident during the first hourof the simulations. For the entire period, increasing CCNstill enhances rainfall; the same as with the full ice run. Themaximum updraft velocity for the TOGA COARE casewithout ice processes (Figure 6) is also stronger in the dirtyenvironment as with the ice case (Figure 3). These resultssuggest that ice processes do not have a major impact on theaerosol-precipitation interactions for the TOGA COARE
case, because the majority of surface rainfall in this casecomes from warm rain. Evaporative cooling and thestrength of the cold pool, which affect cell regeneration inconvective systems, are determined mainly by warm rainprocesses for the TOGA COARE case. (In spectral binmicrophysics, water drops and their interactions with oneanother span the whole size spectrum. There is no cleardistinction between cloud droplets and raindrops, and thusevaporative cooling comes from the entire size spectrum(i.e., from small cloud droplets to large precipitating raindrops).) Therefore the ice processes can only play a sec-ondary role in terms of aerosol-precipitation interactions forthe TOGA COARE case. For the CRYSTAL case, rainfall isenhanced with a high CCN. This enhancement is mainlyassociated with a relatively strong new cell generated ataround t = 2.5 h. This may be caused by the enhancedevaporative cooling associated with the dirty case. Thesesensitivity tests also show the complexity of aerosol-precipitation interactions in mixed-phase, deep convection.[26] Figure 7 shows the integrated total water and ice
paths averaged every hour for clean and dirty conditions.The portions due to cloud water and pristine ice content areshown in hatched lines. For the PRESTORM case, the icepath is much larger than the liquid water path. More iceparticles are produced by this convective system when ahigh CCN is assumed. The liquid water path is generallyreduced with high CCN because smaller cloud particleshave less chance of being collected compared to low-CCNconditions. Instead, more of them are transported abovethe freezing level and subsequently become ice particlesin the dirty scenario. This is also why less rainfall reachesthe ground for the high-CCN scenario in PRESTORM. For
Figure 5. Same as Figure 2 except for sensitivity testswithout ice processes (warm rain only): (a) PRESTORM,(b) TOGA COARE, and (c) CRYSTAL.
Figure 6. Same as Figure 3 except for sensitivity testswithout ice processes (warm rain only): (a) PRESTORM,(b) TOGA COARE, and (c) CRYSTAL.
D24S18 TAO ET AL.: AEROSOL EFFECT ON DEEP CONVECTION
9 of 16
D24S18

the TOGA COARE case, both liquid water path and icewater path increase when a high CCN is assumed. This isconsistent with the more vigorous convection simulated inthe dirty run. The ice path is still much smaller in this casethan in the PRESTORM case. This is why the TOGACOARE case is less sensitive to ice processes comparedwith the PRESTORM case. More ice particles are alsoproduced when a high CCN is assumed for the CRYS-TAL-FACE case, but the differences are relatively small. Aswith the TOGA COARE case, the ice paths in CRYSTAL-FACE are much smaller than in the PRESTORM case.However, ice is produced at a very early stage in CRYS-TAL-FACE as compared to TOGA COARE. This is whythe CRYSTAL case is sensitive to ice processes.[27] During the initial stages of cloud formation (the first
and second hour), cloud water dominates the total liquidwater path for the dirty runs, in contrast to the considerableamounts of rainwater in the clean runs. This again shows
that rain formation is suppressed by increasing aerosols.However, this suppression becomes less obvious once theprecipitation is well established, especially for the long-lived squall systems in PRESTORM and TOGA COARE.[28] Figure 8 shows a schematic diagram of the physical
processes that cause either enhancement (TOGA COARE)or suppression (PRESTORM) of precipitation in a dirtyenvironment. In the early developing stages, small clouddroplets are produced in both the TOGA COARE and thePRESTORM cases with high CCN. Both cases also shownarrower cloud drop size spectra for high CCN (not shown).This result is in good agreement with observations [i.e.,Twomey et al., 1984; Albrecht, 1989; Rosenfeld, 1999]. Inthis early stage, rain is suppressed for both cases with highCCN, which is also in good agreement with observations[e.g., Rosenfeld, 1999, 2000]. The suppression of precipi-tation in dirty conditions is mainly due to microphysicalprocesses only. Smaller cloud droplets collide/coalesce less
Figure 7. Integrated total water and ice path (kg m�2) averaged every hour for clean (white) and dirty(gray) conditions: (a) PRESTORM water, (b) PRESTORM ice, (c) TOGA COARE water, (d) TOGACOARE ice, (e) CRYSTAL water, and (f) CRYSTAL ice. The hatched portion of each bar represents thecloud water and pristine ice content.
D24S18 TAO ET AL.: AEROSOL EFFECT ON DEEP CONVECTION
10 of 16
D24S18

efficiently, delaying raindrop formation. These microphys-ical processes are very important especially in the early/developing stage of a cloud system.[29] The model results also indicated that the low-level
evaporative cooling is quite different between the clean anddirty case. Stronger evaporative cooling could enhance thenear surface cold pool strength. When the cold poolinteracts with the lower-level wind shear, the convergencecould become stronger, producing stronger convection forthe dirty cases. This can lead to more vigorous precipitationprocesses and therefore enhanced surface precipitation(positive feedback). Note that the enhanced precipitationcan cause enhanced evaporation that in turn has a positivefeedback on the rainfall amounts by triggering additionalconvection. These processes seem to be occurring in theTOGA COARE case, as shown in Figure 9a. In this case,evaporative cooling is more than twice as strong in thelower troposphere for the dirty scenario compared to theclean scenario. More rain reaches the surface after 30 min ofmodel integration in the dirty case as compared to the cleancase (Figure 2b). During this period, more evaporativecooling in the dirty case is already evident from the modelresults.
[30] On the other hand, evaporative cooling is stronger atlower levels in the clean scenario for the PRESTORM case(Figure 9b). This could be related to the early onset ofrainfall in that run and because rain evaporation dominatesthe lower levels for this case. For the TOGA COARE case,the moist environment could inhibit evaporation of rain thatforms early in the clean case. At higher levels in thePRESTORM case, cloud evaporation is still stronger forthe dirty case as shown in Figure 9b. Note that thedifference in the evaporative cooling between the dirtyand clean runs in the PRESTORM case is smaller than thatin the TOGA COARE case. The difference in the rainfallbetween the dirty and clean experiments in the PRESTORMcase is also smaller than it is in the TOGA COARE case(Table 5).[31] One main concern is the possibility of a cause-and-
effect issue: namely, enhanced precipitation may enhanceevaporation, which in turn can have a positive feedback onthe rainfall amounts by triggering additional convection.Examination of the time series of evaporation rate in theTOGA COARE case shows that strong low-level evapora-tive cooling exists in the initial half hour for both the cleanand dirty scenarios. The low-level evaporation is stronger in
Figure 8. Schematic diagram showing the physical processes that lead to either enhancement (TOGACOARE case) or suppression (PRESTORM case) of precipitation in a dirty environment.
D24S18 TAO ET AL.: AEROSOL EFFECT ON DEEP CONVECTION
11 of 16
D24S18

the dirty case. The onset of surface rainfall comes after theinitial half hour in the dirty case (see Figure 2) and clearlysuggests that strong low-level evaporation precedes theonset of rainfall onset in the dirty case, which supportsthe schematic diagram (Figure 8).[32] For all three cases, the dirty scenarios produce
smaller cloud droplets with narrower spectrum, a delayedonset of rainfall, increased duration of diffusional dropletgrowth, increased latent heat release above the freezinglevel, and stronger vertical velocities at higher altitudes. Thehigher cloud tops, stronger updrafts, and deeper mixed-phase regions simulated in the dirty runs are in goodagreement with observations (Table 1). The simulations allshow that when the air is polluted, convection producesmore ice particles, which is also in good agreement withobservations. van den Heever et al. [2006] and Carrio et al.
[2007] also found that smaller cloud droplets with a narrowspectrum delay the onset of rainfall, increase diffusionalgrowth of droplets and enhance ice processes under dirtyconditions (in agreement with the present study). This ispotentially important for the formation and maintenance ofhigh-altitude ice clouds in the anvil area, which in turn mayplay an important role in the Earth’s radiation budget.
4. Comparison With Previous Modeling Studies
[33] Previous modeling studies have examined the role ofaerosols on mixed-phase convective clouds for particularcases with different sets of model configurations andmicrophysics schemes (see Table 2). Although most of themodel settings in those studies are not technically equiva-lent to this study, it is yet worthwhile to compare and reviewthe different results. A simple metric, changes in time-integrated precipitation (dP = 100 * (Pdirty � Pclean)/Pclean)as a result of increases in the number concentration of CCN(dN0 = Ndirty � Nclean), is used to examine the differentstudies (Table 5).[34] Phillips et al. [2002] is one of the earliest studies that
applied an explicit microphysics module with a 2-D CRMto examine the influence of aerosol concentrations on asummertime cumulus cloud over New Mexico. The cou-pling is one way (i.e., the CRM provides dynamic input tothe microphysics module). For a shallow cumulus (about5 km cloud top), Phillips et al. [2002] found that withincreased CCN, the precipitation rate, warm rain produc-tion, and secondary ice production are reduced. Althoughthe sensitivity of ice microphysics to the aerosol numberconcentration appeared to be much less for the deepconvective scenario than for the shallow convective cases,increasing the CCN from clean, unpolluted continental(N0 = 800) to control (N0 = 2750) and supercontinental
Figure 9. Domain average evaporation rate (d�1) profilesduring the first 2 h of model integration for the (a) TOGACOARE and (b) PRESTORM cases. The solid (dashed) linerepresents the dirty (clean) scenario.
Table 5. Summary of Precipitation Sensitivity (dP) to Increases in the Number of CCN (dN0) for Different
Studiesa
Reference Case dN0(Nclean), cm�3 dP, %
This study TOGA COARE 2400 (100) +58.PRESTORM 1900 (600) �24.CRYSTAL 1900 (600) �13.
Phillips et al. [2002] New Mexico 1950 (800) �14.4200 (800) �30.
Khain et al. [2004] GATE 1160 (100) �3.Khain and Pokrovsky [2004] Texas 40 (10) �16.
90 (10) �19.290 (10) �53.1250 (10) �88.
Khain et al. [2005] PRESTORM 1160 (100) +258.Teller and Levin [2006] Wintertime eastern Mediterranean 210 (100) �27.
510 (100) �55.810 (100) �73.1260 (100) �93.
Wang [2005] ITCZ 400(100) +180.800 (100) +340.1200(100) +540.1500 (100) +700.
Lynn et al. [2005a] Florida 1250 (10) �5.van den Heever et al. [2006] CRYSTAL 350 (300) �22.
aNote that van den Heever et al. [2006] used a linear CCN concentration profile that ranged from 300 cm�3 at 4 km aboveground level to 1000 cm�3 near the surface; GCCN and IN effects from van den Heever et al. [2006] and Teller and Levin[2006] are excluded from the table; only five of the total 30 cases from Wang [2005] are displayed in the table.
D24S18 TAO ET AL.: AEROSOL EFFECT ON DEEP CONVECTION
12 of 16
D24S18

(N0 = 5000) scenarios decreased the accumulated precip-itation by 14% and 30%, respectively. In addition, theonset of precipitation is delayed by about 5 and 15 min,respectively, for the high-CCN scenarios in comparisonwith the low-CCN scenario.[35] Khain and Pokrovsky [2004] and Khain et al. [2005]
used a 2-D CRM with spectral microphysics (the samemicrophysics as used in this paper) to examine the aerosolimpact on three deep convective clouds: an Atlantic squallline, an Oklahoma squall line (the same PRESTORM casein this paper), and a Texas convective cloud. Their resultsindicated that high CCN concentrations enhanced the pre-cipitation processes for the Atlantic and Oklahoma squallline cases, but suppressed them for the Texas convectivecloud. The results from Khain and Pokrovsky [2004] andKhain et al. [2005] also showed that high CCN could delaythe warm rain process and enhance cold rain processes forall three cases. These features are also simulated in thepresent study. Khain et al. [2005] was the first modelingstudy to compute latent heat budget to examine the impactof aerosols on precipitation processes. For example, theyfound that for cases having suppressed precipitation withhigh CCN (the Texas convective cloud), a higher sublima-tion of ice and evaporation of drops (evaporative cooling)resulted in a higher loss of precipitation mass. ThePRESTORM case simulated in this present paper alsoshowed larger evaporative cooling aloft (5 km level orhigher) with higher CCN. For cases having enhancedprecipitation with high CCN (the Atlantic and Oklahomasquall lines), stronger updrafts/downdrafts and strongerconvergence in the boundary layer may have enhancedthe triggering of secondary clouds and produced a longerlifetime for the convective system. Stronger updrafts anddowndrafts as well as more precipitation are also simulatedin the current TOGA COARE case with high CCN.However, there is a significant difference between theirstudy and this one for the PRESTORM case. With highCCN, Khain et al. [2005] were able to simulate a squallline for their PRESTORM case; with low CCN, theysimulated a short-lived convective system rather than theobserved squall line. The initial clouds (prior to theformation of secondary clouds or a squall line) producedmore precipitation in the low-CCN case, in good agree-ment with the present study. The enhanced precipitation(dP = 258%) in the high-CCN case is due to the formationof the squall line during the 4 h of model integration time.The model dynamics (i.e., advection scheme and subgrid-scale turbulence) and setup (i.e., domain size, grid spacing,convective triggering) and lateral boundary condition usedby Khain et al. [2005] and the present study are quitedifferent. Some of these differences could explain theopposite impact of aerosol concentration on the PRES-TORM squall line simulations. A pair of numerical experi-ments with higher horizontal spacing (500 m) for thePRESTORM case under clean and dirty conditions showedthat increased aerosols suppressed precipitation [dP(%)] =�26% using 500 m resolution compared to �24% using1000 m resolution.[36] Teller and Levin [2006] used a 2-D CRM with
spectral microphysics [Reisin et al., 1998] to examine theaerosol impact on a winter convective cloud in the easternMediterranean region. Their results also showed that high
CCN could delay rainfall and enhance cold rain processes.Their results also showed that larger number concentrationsof CCN can decrease accumulated precipitation by 27% �93% over 80-min model integration. These features are alsosimulated in the present PRESTORM and CRYSTAL cases,though their simulation period is much shorter than thisstudy. They also found that an increase in IN could reducethe total amount of precipitation but GCCN could enhancetotal precipitation in polluted clouds.[37] Wang [2005] used a 3-D CRM with a two-moment
bulk microphysical scheme to examine the aerosol impacton a convective system that developed in the ITCZ. Hisresults showed that a high initial CCN concentration couldproduce stronger convection, more condensed cloud watermass, enhanced microphysical conversions, and more sur-face rainfall. Wang [2005] indicated that there are threeprocesses by which precipitation is increased in tropicaldeep convection because of high CCN: (1) enhancedconvective strength due to stronger and more latent heatrelease; (2) the dominant role of ice phase microphysics inrain production; and (3) greatly increased total water contentin small liquid particles. The current tropical oceanic case(TOGA COARE) also produces stronger updrafts throughmore latent heat release aloft. However, ice processes arenot the dominant rain-producing processes in this currenttropical oceanic case (see the sensitivity test shown inFigure 5b). Differing dimensionalities, microphysicalschemes, lateral boundary conditions (cyclic versus radia-tive open), and tropical cases (initial conditions) couldexplain the differences between the model results.[38] Lynn et al. [2005a, 2005b] used spectral bin micro-
physics (a simplified version of Khain’s scheme [Khain etal., 2004]) and the fifth-generation Pennsylvania StateUniversity–National Center for Atmospheric Research(Penn State–NCAR) Mesoscale Model (MM5) to simulatea cloud that approached the west coast of Florida, prior tothe sea breeze development on 27 July 1991. The use of acontinental CCN concentration led to a delay in the growthof rainfall (in agreement with the present modeling study).The increase in CCN concentration led to convectiveinvigoration and the formation of stronger secondary clouds[Lynn et al., 2005b]. Simulations of rain events over thewhole peninsula for this day showed significant invigora-tion of squall lines. There was an increase in precipitationrate and precipitation amount for a squall line that formed inthe vicinity of the east coast of Florida. At the same time,continental CCN concentrations resulted in a 5% reductionin precipitation over the whole computational domain(containing a significant fraction of Florida) versus mari-time values.[39] van den Heever et al. [2006] used the Regional
Atmospheric Modeling System (RAMS) and a two-momentbulk microphysical scheme [Meyers et al., 1997; Saleebyand Cotton, 2004] to examine the aerosol effect on theformation of a thunderstorm over the peninsula of Florida(28 July 2002 during CRYSTAL-FACE). Note that the two-moment bulk scheme used by van den Heever et al. [2006]emulates a bin scheme by including explicit activation ofaerosols [Saleeby and Cotton, 2004]. Sensitivity studiesshow that different combinations of CCN, GCCN, and INresult in different amounts and temporal patterns of cloudwater/ice contents and rainfall. Their study showed that high
D24S18 TAO ET AL.: AEROSOL EFFECT ON DEEP CONVECTION
13 of 16
D24S18

CCN reduce cumulative precipitation by 22% compared tolow CCN. In addition, high GCCN and IN enhanced surfaceprecipitation for the first 6 h of integration because of theinitial broadening of the cloud droplet spectra. However, thetotal (12-h integration) accumulated precipitation was great-est for the clean (low CCN, GCCN, and IN) case. Thiscould be explained by a rapid wet deposition of GCCN forthe first 6 h of integration. All their experiments involvinghigh CCN resulted in high cloud water content and weaksurface precipitation. Using a similar modeling configura-tion, van den Heever and Cotton [2007] examine thesensitivity of urban-induced convective clouds over anddownwind of St. Louis, MO. Their results indicate thatdownwind convergence (dynamic processes) induced byurban land cover appears to be the dominant factor indetermining whether or not moist convection actuallydevelops downwind of St, Louis. Once moist convectionis initiated, urban-enhanced aerosols play a major role indetermining the microphysical and dynamical character-istics of convective storms, particularly when backgroundaerosol concentrations are low. Complicated relationshipsand feedbacks between microphysical and dynamical pro-cesses obscure generalized understandings (i.e., a linearrelationship) of urban-enhanced aerosol effects on precipi-tation. Note that van den Heever et al. [2006] and van denHeever and Cotton [2007] explicitly represented mesoscaleforcing (i.e., sea breeze convergence and urban heat islandconvergence). This is important because cold pools caninteract with those circulations, introducing another level ofdynamic complexity. For example, if the cold pools outrunthose mesoscale convergence fields, precipitation is reducedwhereas when they remain coupled precipitation is enhanced.[40] Among these previous studies, the most striking
difference is that cumulative precipitation can either in-crease or decrease in response to higher concentrations ofCCN. Khain and Pokrovsky [2004] and Teller and Levin[2006] changed the number concentrations of CCN gradu-ally and found robust decreases in cumulative precipitationfor higher concentrations of CCN (Table 5). This is com-pletely opposite from the result in Wang [2005]. Under-standing these discrepancies is a necessary next step inresolving aerosol effects on cloud microphysics, dynamicsand precipitation within climate systems.
5. Summary and Future Work
[41] A 2-D CRM with detailed spectral bin microphysicsis used to examine the aerosol impact on deep convectiveclouds. Three cases are simulated using idealized initialaerosol concentrations: a case of sea breeze convection inFlorida during CRYSTAL-FACE, a tropical mesosocaleconvective system during TOGA COARE, and a summer-time midlatitude squall line during PRESTORM. Compar-isons between the model simulations and in situ radarreflectivity observations show good agreements. A pair ofmodel simulations, an experiment with low (clean) and anexperiment with high CCN (dirty environment), is con-ducted for each case. The major highlights are as follows:[42] 1. For all three cases, higher CCN produces smaller
cloud droplets and a narrower spectrum. Dirty conditionsdelay rain formation, increase latent heat release above thefreezing level, and enhance vertical velocities at higher
altitude for all cases. Stronger updrafts, deeper mixed-phaseregions, and more ice particles are simulated with higherCCN in good agreement with observations.[43] 2. In all cases, rain reaches the ground early with
lower CCN. Rain suppression is also evident in all threecases with high CCN in good agreement with observations(Rosenfeld, 1999, 2000 and others). Rain suppression,however, only occurs during the first hour of simulation.This result suggests that microphysical processes dominatethe impact of aerosols on precipitation in the early stage ofprecipitation development.[44] 3. During the mature stage of the simulations, the
effect of increasing aerosol concentration ranges from rainsuppression in the PRESTORM case to little effect onsurface rainfall in the CRYSTAL-FACE case to rain en-hancement in the TOGA COARE case.[45] 4. The model results suggest that evaporative cooling
is a key process in determining whether higher CCNreduces or enhances precipitation. Cold pool strength canbe enhanced by stronger evaporation. When cold poolinteracts with the near surface wind shear, the low-levelconvergence can be stronger, facilitating secondary cloudformation and more vigorous precipitation processes. Evap-orative cooling is more than two times stronger at low levelswith higher CCN for the TOGA COARE case during theearly stages of precipitation development. However, evap-orative cooling is slightly stronger at lower levels withlower CCN for the PRESTORM case. The early formationof rain in the clean environment could allow for theformation of an earlier and stronger cold pool comparedto a dirty environment. PRESTORM has a very dry envi-ronment and both large and small raindroplets can evapo-rate. Consequently, the cold pool is relatively weaker, andthe system is relatively less intense with higher CCN.[46] 5. Sensitivity tests are conducted to determine the
impact of ice processes on aerosol-precipitation interaction.The results suggested that ice processes are crucial forsuppressing precipitation because of high CCN for thePRESTORM case. More and smaller ice particles aregenerated in the dirty case and transported to the trailingstratiform region. This reduces the heavy convective rainand contributes to the weakening of the cold pool. Warmrain processes dominate the TOGA COARE case. Thereforeice processes only play a secondary role in terms of aerosol-precipitation interaction.[47] 6. Two of the three cloud systems presented in this
paper formed a line structure (squall system). A 2-Dsimulation therefore gives a good approximation to such aline of convective clouds. Since the real atmosphere is 3-D,further 3-D cloud-resolving simulations are needed toaddress aerosol-precipitation interactions.[48] Most previous modeling results found that high CCN
concentrations could suppress precipitation processes [i.e.,Khain et al., 2004, 2005; Cheng et al., 2007, Lynn et al.,2005b; van den Heever et al., 2006; Teller and Levin, 2006;van den Heever and Cotton, 2007]. However, high CCNconcentrations could also enhance precipitation processes[Wang, 2005; Khain et al., 2005]. These results show thecomplexity of aerosol interactions with convection. Morecase studies are required to further investigate the aerosolimpact on rain events. In almost all previous cloud-resolving modeling studies (including the present study),
D24S18 TAO ET AL.: AEROSOL EFFECT ON DEEP CONVECTION
14 of 16
D24S18

idealized or composite [i.e., van den Heever et al., 2006]CCN concentrations were used in the model simulations.A horizontally uniform distribution of CCN was also usedin the mesoscale modeling studies. A nonhomogeneousCCN distribution, consistent with the nonhomogeneousinitial meteorological conditions, will be required to assessaerosol-precipitation interactions using regional-scale mod-els in the future. In addition to IN and GCCN, thechemistry of CCN needs to be considered in futuremodeling of aerosol-precipitation interactions. For exam-ple, Fan et al. [2007] and Ekman et al. [2004, 2006] foundthat aerosol chemical composition and aerosol physicscould affect precipitation processes.[49] Many previous CRM studies did not compare model
results with observed cloud structures, organization, radarreflectivity and rainfall. Some of the CRM domains weretoo small to resolve the observed clouds or precipitationsystems (the domain size has to be at least twice as large asthe simulated features). It may require major field cam-paigns to gather the data necessary to both initialize (withmeteorological and aerosol) and validate (i.e., in situ cloudproperty observations, radar, lidar, and microwave remotesensing) the models. Although CRM-simulated results canprovide valuable quantitative estimates of the indirecteffects of aerosols, CRMs are neither regional nor globalmodels and can only simulate clouds and cloud systemsover a relatively small domain. Close collaboration betweenthe global and CRM communities is needed in order toexpand the CRM results to a regional and global perspective[Tao et al., 2003b].
[50] Acknowledgments. The GCE model is mainly supported by theNASA Headquarters Atmospheric Dynamics and Thermodynamics Pro-gram and the NASA Tropical Rainfall Measuring Mission (TRMM). Theauthors are grateful to R. Kakar at NASA headquarters for his support ofthis research. A. Khain was supported by the European ‘‘ANTISTORM’’project. We also thank W. Cotton, C. Wang, and D. Rosenfeld for theirconstructive comments that improved this paper significantly. The researchwas also supported by the Office of Science (BER), U.S. Department ofEnergy/Atmospheric Radiation Measurement (DOE/ARM) InteragencyAgreement DE-AI02-04ER63755. The authors are grateful to Kiran Ala-paty at DOE/ARM for his support of this research. The authors acknowl-edge NASA Goddard Space Flight Center for computer time used in thisresearch.
ReferencesAckerman, A. S., O. B. Toon, D. E. Stevens, A. J. Heymsfield,V. Ramanathan, and E. J. Welton (2000), Reduction of tropical cloudinessby soot, Science, 288, 1042–1047.
Albrecht, B. A. (1989), Aerosols, cloud microphysics and fractional cloudi-ness, Science, 245, 1227–1230.
Andreae, M. O., D. Rosenfeld, P. Artaxo, A. A. Costa, G. P. Frank, K. M.Longo, and M. A. F. Silva-Dias (2004), Smoking rain clouds over theAmazon, Science, 303, 1337–1342.
Bell, T. L., D. Rosenfeld, K.-M. Kim, J.-M. Yoo, M.-I. Lee, and M.Hahnenberger (2007), Midweek increase in U.S. summer rain and stormheights suggests air pollution invigorates rainstorms, J. Geophys. Res.,doi:10.1029/2007JD008623, in press.
Carrio, G. G., S. C. van den Heever, and W. R. Cotton (2007), Impact ofnucleating aerosol on anvil-cirrus clouds: A modeling study, Atmos. Res.,84, 111–131.
Cheng, C.-T., W.-C. Wang, and J.-P. Chen (2007), A modeling study ofaerosol impacts on cloud microphysics and radiative properties, Q. J. R.Meteorol. Soc., 133, 283–297.
Chou, M.-D. and M. J. Suarez (1994), An efficient thermal infrared radia-tion parameterization for use in general circulation models, NASA Tech.Memo., 104606, 85 pp.
Chou, M.-D., M. J. Suarez, C.-H. Ho, M.-H. Yan, and K.-T. Lee (1998),Parameterizations for cloud overlapping and shortwave single-scattering
properties for use in general circulation and cloud ensemble models,J. Clim., 11, 202–214.
Cooper, W. A., R. Bruintjes, and G. Mather (1997), Calculations pertainingto hygroscopic seeding with flares, J. Appl. Meteorol., 36, 1449–1469.
Ekman, A., C. Wang, J. Wilson, and J. Strom (2004), Explicit simulation ofaerosol physics in a cloud-resolving model: A sensitivity study based onan observed convective cloud, Atmos. Chem. Phys., 4, 773–791.
Ekman, A., C. Wang, J. Storm, and R. Kreici (2006), Explicit simulation ofaerosol physics in a cloud-resolving model: Aerosol transport and proces-sing in the free troposphere, J. Atmos. Sci., 63, 682–696.
Fairall, C. W., E. F. Bradley, D. P. Rogers, J. B. Edson, and G. S. Young(1996), Bulk parameterization of air-sea fluxes for Tropical Ocean-GlobalAtmosphere Coupled Ocean-Atmosphere Response Experiment, J. Geo-phys. Res., 101, 915–929.
Fan, J., R. Zhang, G. Li, W.-K. Tao, and X. Li (2007), Simulations ofcumulus clouds using a spectral microphysics cloud-resolving model,J. Geophys. Res., 112, D04201, doi:10.1029/2006JD007688.
Ferrier, B. S., J. Simpson, and W.-K. Tao (1996), Factors responsible forprecipitation efficiencies in midlatitude and tropical squall simulations,Mon. Weather Rev., 124, 2100–2125.
Fovell, R. G., and Y. Ogura (1988), Numerical simulation of a midlatitudesquall line in two dimensions, J. Atmos. Sci., 45, 3846–3879.
Fridlind, A. M., et al. (2004), Evidence for the predominance of mid-tropospheric aerosols as subtropical anvil cloud nuclei, Science, 304,718–722.
Hallett, J., and S. C. Mossop (1974), Production of secondary ice crystalsduring the riming process, Nature, 249, 26–28.
Heymsfield, G. M., A. J. Heymsfield, and L. Belcher (2004), Observationsof Florida convective storms using dual wavelength airborne radar, paperpresented at International Conference on Clouds and Precipitations, Inst.of Atmos. Sci. and Clim., Bologna, Italy, 18–23 July.
Hudson, J. G. (1984), Cloud condensation nuclei measurements withinclouds, J. Clim. Appl. Meteorol., 23, 42–51.
Hudson, J. G. (1993), Cloud condensation nuclei near marine cumulus,J. Geophys. Res., 98, 2693–2701.
Johnson, R. H., and P. J. Hamilton (1988), The relationship of surfacepressure features to the precipitation and airflow structure of an intensemidlatitude squall line, Mon. Weather Rev., 116, 1444–1472.
Jorgensen, D. P., M. A. LeMone, and S. B. Trier (1997), Structure andevolution of the 22 February 1993 TOGA COARE squall line: Aircraftobservations of precipitation, circulation, and surface fluxes, J. Atmos.Sci., 54, 1961–1985.
Khain, A., and A. Pokrovsky (2004), Simulation of effects of atmosphericaerosols on deep turbulent convective clouds using a spectral microphy-sics mixed-phase cumulus cloud model. part II: Sensitivity study,J. Atmos. Sci., 61, 2963–2982.
Khain, A., M. Ovtchinnikov, M. Pinsky, A. Podrovsky, and H. Krugliak(2000), Notes on the state-of-art numerical modeling of cloud microphy-sics, Atmos. Res., 55, 159–224.
Khain, A., A. Pokrovsky, M. Pinsky, A. Seigert, and V. Phillips (2004),Simulation of effects of atmospheric aerosols on deep turbulent convec-tive clouds using a spectral microphysics mixed-phase cumulus cloudmodel. part I: Model description and possible applications, J. Atmos.Sci., 61, 2983–3001.
Khain, A., D. Rosenfeld, and A. Pokrovsky (2005), Aerosol impact on thedynamics and microphysics of deep convective clouds, Q. J. R. Meteorol.Soc., 131, 1–25.
Klemp, J. B., and R. B. Wilhelmson (1978), The simulation of three-dimensional convective storm dynamics, J. Atmos. Sci., 35, 1070–1096.
Koren, I., Y. J. Kaufman, D. Rosenfeld, L. A. Remer, and Y. Rudich (2005),Aerosol invigoration and restructuring of Atlantic convective clouds,Geophys. Res. Lett., 32, L14828, doi:10.1029/2005GL023187.
Lang, S., W.-K. Tao, J. Simpson, and B. Ferrier (2003), Modeling of con-vective-stratiform precipitation processes: Sensitivity to partitioningmethods, J. Appl. Meteorol., 42, 505–527.
LeMone, M. A., D. P. Jorgensen, and B. F. Smull (1994), The impact of twoconvective systems of sea surface stresses in COARE, paper presented atSixth Conference on Mesoscale Processes, Am. Meteorol. Soc., Portland,Oreg.
Lin, J. C., T. Matsui, R. A. Pielke Sr., and C. Kummerow (2006), Effects ofbiomass-burning-derived aerosols on precipitation and clouds in theAmazon Basin: a satellite-based empirical study, J. Geophys. Res., 111,D19204, doi:10.1029/2005JD006884.
Lynn, B. H., A. Khain, J. Dudhia, D. Rosenfeld, A. Pokrovsky, and A. Seifert(2005a), Spectral (bin) microphysics coupled with a mesoscale model(MM5) part I: Model description and first results, Mon. Weather Rev.,133, 44–58.
Lynn, B. H., A. Khain, J. Dudhia, D. Rosenfeld, A. Pokrovsky, andA. Seifert (2005b), Spectral (bin) microphysics coupled with a mesoscale
D24S18 TAO ET AL.: AEROSOL EFFECT ON DEEP CONVECTION
15 of 16
D24S18

model (MM5) part II: Simulation of a CaPE rain event with a squall line,Mon. Weather Rev., 133, 59–71.
Meyers, M. P., P. J. DeMott, and W. R. Cotton (1992), New primary ice-nucleation parameterization in an explicit cloud model, J. Appl. Meteorol.,31, 708–721.
Meyers, M. P., R. L. Walko, J. Y. Harrington, and W. R. Cotton (1997),New RAMS cloud microphysics parameterization. part II: The two-moment scheme, Atmos. Res., 45, 3–39.
Mossop, S. C., and J. Hallett (1974), Ice crystal concentration in cumulusclouds: Influence of the drop spectrum, Science, 186, 632–634.
National Research Council (2005), Radiative Forcing of Climate Change:Expanding the Concept and Addressing Uncertainties, Natl. Acad.,Washington, D. C.
Orville, R. E., R. Zhang, J. N. Gammon, D. Collins, B. Ely, and S. Steiger(2001), Enhancement of cloud-to-ground lightening over Houston, Texas,Geophys. Res. Lett., 28, 2597–2600.
Phillips, V. T. J., T. W. Choularton, A. M. Blyth, and J. Latham (2002), Theinfluence of aerosol concentrations on the glaciation and precipitation ofa cumulus cloud, Q. J. R. Meteorol. Soc., 128, 951–971.
Pinsky, M., A. P. Khain, and M. Shapiro (2000), Stochastic effect on clouddroplet hydrodynamic interaction in a turbulent flow, Atmos. Res., 53,131–169.
Pinsky, M., A. P. Khain, and M. Shapiro (2001), Collision efficiency ofdrops in a wide range of Reynolds numbers: Effects of pressure onspectrum evolution, J. Atmos. Sci., 58, 742–764.
Pruppacher, H. R. and J. D. Klett (1997), Microphysics of Clouds andPrecipitation, 2nd ed., 914 pp., Oxford Univ. Press, New York.
Ramanathan, V., P. J. Crutzen, J. T. Kiehl, and D. Rosenfeld (2001), Aero-sols, climate, and the hydrological cycle, Science, 294, 2119–2124.
Redelsperger, J.-L., et al. (2000), A GCSS model intercomparison for atropical squall line observed during TOGA-COARE. part I: Cloud-resolving models, Q. J. R. Meteorol. Soc., 126, 823–863.
Reisin, T. G., Y. Yin, Z. Levin, and S. Tzivion (1998), Development ofgiant drops and high reflectivity cores in Hawaiian clouds: Numericalsimulation using a kinematic model with detailed microphysics, Atmos.Res., 45, 275–297.
Ridley, B., et al. (2004), Florida thunderstorms: A faucet of reactive nitro-gen to the upper troposphere, J. Geophys. Res., 109, D17305,doi:10.1029/2004JD004769.
Rosenfeld, D. (1999), TRMM observed first direct evidence of smoke fromforest fires inhibiting rainfall, Geophys. Res. Lett., 26, 3105–3108.
Rosenfeld, D. (2000), Suppression of rain and snow by urban and industrialair pollution, Science, 287, 1793–1796.
Rosenfeld, D., and I. Lensky (1998), Satellite-based insights into precipita-tion formation processes in continental and maritime convective clouds,Bull. Am. Meteorol. Soc., 79, 2457–2476.
Rosenfeld, D. and C. W. Ulbrich (2003), Cloud microphysical properties,processes, and rainfall estimation opportunities, in Radar and Atmo-spheric Science: A Collection of Essays in Honor of David Atlas, editedby Roger M. Wakimoto and Ramesh Srivastava, Meteorol. Monogr., 52,237–258.
Rosenfeld, D., and W. L. Woodley (2000), Convective clouds with sus-tained highly supercooled liquid water down to �37�C, Nature, 405,440–442.
Rosenfeld, D., Y. Rudich, and R. Lahav (2001), Desert dust suppressing: Apossible desertification feedback loop, Proc. Natl. Acad. Sci. U.S.A., 98,5975–5980.
Rutledge, S. A., R. A. Houze Jr., and M. I. Biggerstaff (1988), The Okla-homa-Kansas mesoscale convective system of 10–11 June 1985: Preci-pitation structure and single-Doppler radar analysis, Mon. Weather Rev.,116, 1409–1430.
Saleeby, S. M., and W. R. Cotton (2004), A large-droplet mode and prog-nostic number concentration of cloud droplets in the Colorado State Univ.Regional Atmospheric Modeling System (RAMS). part I: Module de-scriptions and supercell test simulations, J. Appl. Meteorol., 43, 182–195.
Seifert, A., A. Khain, U. Blahak, and K. D. Beheng (2005), Possible effectsof collisional breakup on mixed-phase deep convection simulated by aspectral (bin) cloud model, J. Atmos. Sci., 62, 1917–1931.
Shepherd, J. M. (2005), A review of current investigations of urban-inducedrainfall and recommendations for the future, Earth Interactions, 9, 1–27.
Smolarkiewicz, P. K., and W. W. Grabowski (1990), The multidimensionalpositive advection transport algorithm: Nonoscillatory option, J. Comput.Phys., 86, 355–375.
Soong, S.-T., and Y. Ogura (1980), Response of trade wind cumuli to large-scale processes, J. Atmos. Sci., 37, 2035–2050.
Soong, S.-T., and W.-K. Tao (1980), Response of deep tropical clouds tomesoscale processes, J. Atmos. Sci., 37, 2016–2034.
Squires, P. and T. Twomey (1960), The relation between cloud drop num-bers and the spectrum of cloud nuclei, in Physics of Precipitation, Geo-phys. Monogr. Ser., vol. 5, edited by H. Weickmann, pp. 211–219, AGU,Washington, D. C.
Sui, C.-S., X. Li, and M.-J. Yang (2007), On the definition of precipitationefficiency, J. Atmos. Sci., in press.
Tao, W.-K., and J. Simpson (1993), Goddard cumulus ensemble model. partI: Model description, Terr. Atmos. Oceanic Sci., 4, 35–72.
Tao, W.-K., J. Simpson, C.-H. Sui, B. Ferrier, S. Lang, J. Scala, M.-D.Chou, and K. Pickering (1993), Heating, moisture and water budgetsof tropical and midlatitude squall lines: Comparisons and sensitivity tolongwave radiation, J. Atmos. Sci., 50, 673–690.
Tao, W.-K., J. Scala, and J. Simpson (1995), The effects of melting pro-cesses on the development of a tropical and a midlatitude squall line,J. Atmos. Sci., 52, 1934–1948.
Tao, W.-K., S. Lang, J. Simpson, C.-H. Sui, B. Ferrier, and M.-D. Chou(1996), Mechanisms of cloud-radiation interaction in the tropics andmidlatitudes, J. Atmos. Sci., 53, 2624–2651.
Tao, W.-K., et al. (2003a), Microphysics, radiation and surface processes inthe Goddard cumulus ensemble (GCE) model, Meteorol. Atmos. Phys.,82, 97–137.
Tao, W.-K., D. Starr, A. Hou, P. Newman, and Y. Sud (2003b), A cumulusparameterization workshop, Bull. Am. Meteorol. Soc, 84, 1055–1062.
Teller, A., and Z. Levin (2006), The effects of aerosols on precipitation anddimensions of subtropical clouds: A sensitivity study using a numericalcloud model, Atmos. Chem. Phys., 6, 67–80.
Trier, S. B., W. C. Skamarock, M. A. LeMone, D. B. Parsons, and D. P.Jorgensen (1996), Structure and evolution of the 22 February 1993TOGA COARE squall line: Numerical simulations, J. Atmos. Sci., 53,2861–2886.
Trier, S. B., W. C. Skamarock, and M. A. LeMone (1997), Structure andevolution of the 22 February 1993 TOGA COARE squall line: Organiza-tion mechanisms inferred from numerical simulation, J. Atmos. Sci., 54,386–407.
Twomey, S. A. (1977), The influence of pollution on the shortwave albedoof clouds, J. Atmos. Sci., 34, 1149–1152.
Twomey, S., and T. A. Wojciechowski (1969), Observations of the geogra-phical variation of cloud nuclei, J. Atmos. Sci., 26, 684–688.
Twomey, S. A., M. Piepgrass, and T. L. Wolfe (1984), An assessment of theimpact of pollution on global cloud albedo, Tellus, Ser. B, 36, 356–366.
Vali, G. (1994), Freezing rate due to heterogeneous nucleation, J. Atmos.Sci., 51, 1843–1856.
van den Heever, S. C., and W. R. Cotton (2007), Urban aerosol impacts ondownwind convective storms, J. Appl. Meteorol. Clim., 46, 828–850.
van den Heever, S. C., G. G. Carrio, W. R. Cotton, P. J. DeMott, and A. J.Prenni (2006), Impact of nucleating aerosol on Florida storms. part 1:Mesoscale simulations, J. Atmos. Sci., 63, 1752–1775.
Wang, C. (2005), A modeling study of the response of tropical deep con-vection to the increase of cloud condensation nuclei concentration: 1.Dynamics and microphysics, J. Geophys. Res., 110, D21211,doi:10.1029/2004JD005720.
Wang, Y., W.-K. Tao, and J. Simpson (1996), The impact of a surface layeron a TOGA COARE cloud system development, Mon. Weather Rev.,124, 2753–2763.
Wang, Y., W.-K. Tao, J. Simpson, and S. Lang (2003), The sensitivity oftropical squall lines to surface fluxes: Three-dimensional cloud resolvingmodel simulations, Q. J. R. Meteorol. Soc., 129, 987–1006.
Warner, J. (1968), A reduction in rainfall associated with smoke from sugar-cane fires: An inadvertent weather modification?, J. Appl. Meteorol., 7,247–251.
Warner, J., and S. Twomey (1967), The production of cloud nuclei by canefires and the effects on cloud droplet concentration, J. Atmos. Sci., 24,704–706.
Williams, E., et al. (2002), Contrasting convective regimes over the Ama-zon: Implications for cloud electrification, J. Geophys. Res., 107(D20),8082, doi:10.1029/2001JD000380.
Yang, M.-J., and R. A. Houze Jr. (1995), Multicell squall-line structure as amanifestation of vertically trapped gravity waves, Mon. Weather Rev.,123, 641–661.
�����������������������A. Khain, Department of Atmospheric Science, Hebrew University of
Jerusalem, Jerusalem 91904, Israel.S. Lang, Science Systems and Applications, Inc., Lanham, MD 20706,
USA.X. Li, T. Matsui, J. Simpson, and W.-K. Tao, Laboratory for Atmospheres,
NASA Goddard Space Flight Center, Greenbelt, MD 20771, USA.([email protected])
D24S18 TAO ET AL.: AEROSOL EFFECT ON DEEP CONVECTION
16 of 16
D24S18


