Role of Alloying Additions in the Solidification Kinetics ...€¦ · Role of Alloying Additions in...
33
Metals 2015, 5, 256-288; doi:10.3390/met5010256 metals ISSN 2075-4701 www.mdpi.com/journal/metals/ Article Role of Alloying Additions in the Solidification Kinetics and Resultant Chilling Tendency and Chill of Cast Iron Edward Fraś 1,† , Hugo F. Lopez 2, *, Magdalena Kawalec 1 and Marcin Gorny 1 1 Foundry Institute, AGH University of Science and Technology, Reymonta 23, Cracow 30-059, Poland; E-Mails: [email protected] (M.K.); [email protected] (M.G.) 2 Department of Materials Science and Engineering, University of Wisconsin Milwaukee, 3200 N. Cramer Street, Milwaukee, WI 53211, USA † Edward Fras recently passed away on 15 January 2013. * Author to whom correspondence should be addressed; E-Mail: [email protected]; Tel.: +1-414-229-6005. Academic Editor: Anders E. W. Jarfors Received: 10 January 2015 / Accepted: 25 February 2015 / Published: 4 March 2015 Abstract: The present work describes the effect of the solidification processing and alloy chemistry on the chilling tendency index, CT, and the chill, w, of wedge-shaped castings made of cast iron. In this work, theoretical predictions were experimentally verified for the role of elements, such as C, Si, Mn, P and S, on the cast iron CT. In addition, inoculation and fading effects were considered in the experimental outcome. Accordingly, the graphite nucleation coefficients, Ns, b, the eutectic cell growth coefficient, μ, and the critical cooling rate, Qcr, for the development of eutectic cementite (chill) were all determined as a function of the cast iron chemistry and time after inoculation. In particular, it was found that increasing the Mn and S contents, as well as the time after inoculation lowers the critical cooling rate, thus increasing the chilling tendency of the cast iron. In contrast, C, Si and P increase the critical cooling rate, and as a result, they reduce the cast iron CT and chill. Keywords: chill; chilling tendency; gray cast iron; role of C; Si; Mn; P; Mn; inoculation effects OPEN ACCESS
Transcript of Role of Alloying Additions in the Solidification Kinetics ...€¦ · Role of Alloying Additions in...

Metals 2015, 5, 256-288; doi:10.3390/met5010256
metals ISSN 2075-4701
www.mdpi.com/journal/metals/
Article
Role of Alloying Additions in the Solidification Kinetics and
Resultant Chilling Tendency and Chill of Cast Iron
Edward Fraś 1,†, Hugo F. Lopez 2,*, Magdalena Kawalec 1 and Marcin Gorny 1
1 Foundry Institute, AGH University of Science and Technology, Reymonta 23, Cracow 30-059, Poland;
E-Mails: [email protected] (M.K.); [email protected] (M.G.) 2 Department of Materials Science and Engineering, University of Wisconsin Milwaukee,
3200 N. Cramer Street, Milwaukee, WI 53211, USA
† Edward Fras recently passed away on 15 January 2013.
* Author to whom correspondence should be addressed; E-Mail: [email protected];
Tel.: +1-414-229-6005.
Academic Editor: Anders E. W. Jarfors
Received: 10 January 2015 / Accepted: 25 February 2015 / Published: 4 March 2015
Abstract: The present work describes the effect of the solidification processing and alloy
chemistry on the chilling tendency index, CT, and the chill, w, of wedge-shaped castings
made of cast iron. In this work, theoretical predictions were experimentally verified for the
role of elements, such as C, Si, Mn, P and S, on the cast iron CT. In addition, inoculation
and fading effects were considered in the experimental outcome. Accordingly, the graphite
nucleation coefficients, Ns, b, the eutectic cell growth coefficient, μ, and the critical
cooling rate, Qcr, for the development of eutectic cementite (chill) were all determined as a
function of the cast iron chemistry and time after inoculation. In particular, it was found
that increasing the Mn and S contents, as well as the time after inoculation lowers the
critical cooling rate, thus increasing the chilling tendency of the cast iron. In contrast, C, Si
and P increase the critical cooling rate, and as a result, they reduce the cast iron CT
and chill.
Keywords: chill; chilling tendency; gray cast iron; role of C; Si; Mn; P; Mn;
inoculation effects
OPEN ACCESS
Metals 2015, 5 257
1. Introduction
One of the important indices that accounts for the quality of cast iron is its chilling tendency, that is
its tendency to solidify according to the Fe-C-X metastable system. The chilling tendency, CT,
depends on the physical-chemical state of the liquid iron, while the chill (the fraction of eutectic
cementite in the casting) formation depends additionally on the casting cooling rate. In foundry
practice, the CT for the various types of cast iron is determined from comparisons of the exhibited
fraction of eutectic cementite (chill) in castings solidified under similar cooling rates. Based only on
these comparisons, the difference in the chilling tendency for various cast irons can be established,
but the absolute CT values for given irons cannot be disclosed [1].
It is well known that the chilling tendency of cast irons determines their subsequent performance in
diverse applications. In particular, cast irons possessing a high CT tend to develop zones of white or
mottled iron. Considering that these regions can be extremely hard, their machinability can be severely
impaired. Alternatively, if white iron is the desired structure, a relatively small chilling tendency will
favor the formation of gray iron. This, in turn, leads to low hardness and poor wear properties in
as-cast components. Hence, considerable efforts [1–7] have been made to correlate the inoculation
practice, iron composition, pouring temperature, etc., with the cast iron CT.
In the published literature, there are only a few attempts aimed at elucidating the mechanisms
responsible for the chill of cast iron [3,8–11]. Besides, none of the proposed hypotheses take into
account the complexity of the solidification process. In most cases, the proposed theories assume that
a single factor is the determinant in establishing the final solidification structure, while the remaining
factors are ignored. In addition, various numerical models have been proposed [12,13] to predict
whether a given casting or a part of it will solidify according to the stable or metastable Fe-C-X system.
Yet, their application is tedious due to extensive numerical calculations. Accordingly, in this work,
a simple analytical model is employed to account for the mechanism or mechanisms responsible for
the CT of cast iron and, hence, the exhibited chill.
1.1. Analysis
During cast iron solidification, two processes become relevant: (a) nucleation; and (b) growth of
eutectic cells, which have a direct effect on the final microstructure.
(a) Nucleation of eutectic cells
In liquid-solid transformations, nucleation is heterogeneous in nature. Accordingly, a simple model
for heterogeneous nucleation of graphite in cast iron has recently been proposed [14], which describes
the nucleation of eutectic cells, N, by the following expression:
s
m
expb
N NT
(1)
and
∆Tm = Ts − Tm (2)
Metals 2015, 5 258
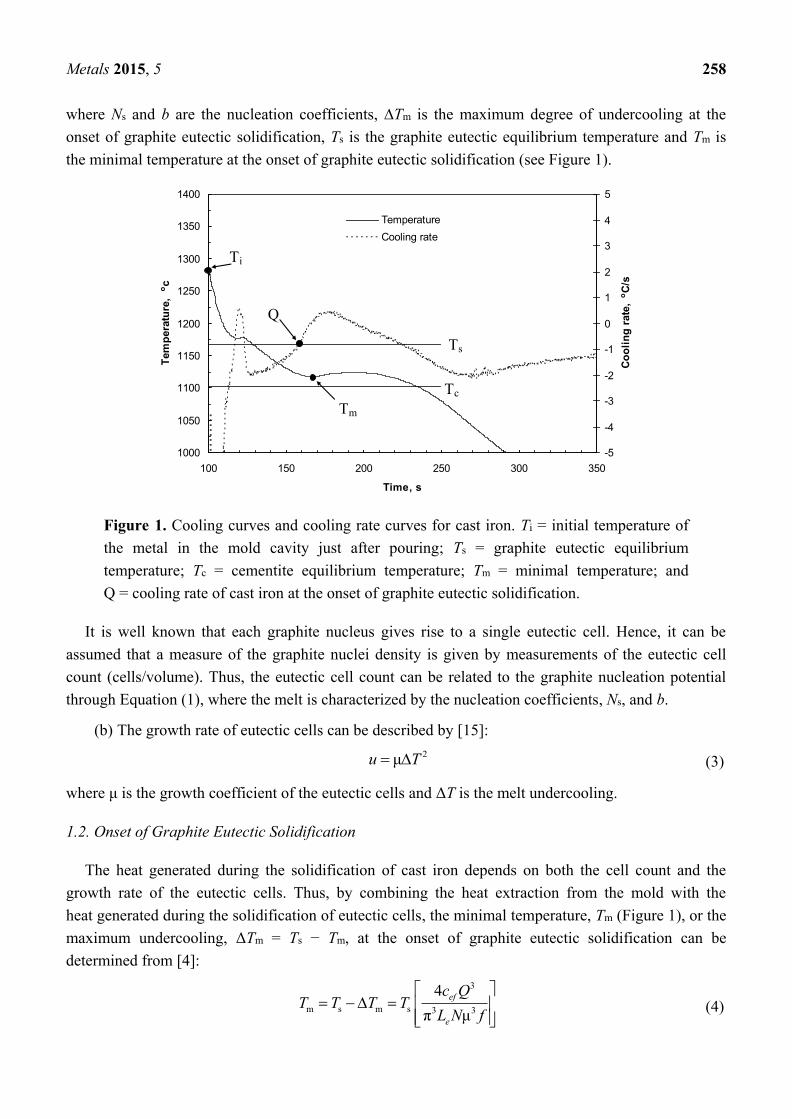
where Ns and b are the nucleation coefficients, ∆Tm is the maximum degree of undercooling at the
onset of graphite eutectic solidification, Ts is the graphite eutectic equilibrium temperature and Tm is
the minimal temperature at the onset of graphite eutectic solidification (see Figure 1).
Figure 1. Cooling curves and cooling rate curves for cast iron. Ti = initial temperature of
the metal in the mold cavity just after pouring; Ts = graphite eutectic equilibrium
temperature; Tc = cementite equilibrium temperature; Tm = minimal temperature; and
Q = cooling rate of cast iron at the onset of graphite eutectic solidification.
It is well known that each graphite nucleus gives rise to a single eutectic cell. Hence, it can be
assumed that a measure of the graphite nuclei density is given by measurements of the eutectic cell
count (cells/volume). Thus, the eutectic cell count can be related to the graphite nucleation potential
through Equation (1), where the melt is characterized by the nucleation coefficients, Ns, and b.
(b) The growth rate of eutectic cells can be described by [15]:
2μu T (3)
where μ is the growth coefficient of the eutectic cells and ΔT is the melt undercooling.
1.2. Onset of Graphite Eutectic Solidification
The heat generated during the solidification of cast iron depends on both the cell count and the
growth rate of the eutectic cells. Thus, by combining the heat extraction from the mold with the
heat generated during the solidification of eutectic cells, the minimal temperature, Tm (Figure 1), or the
maximum undercooling, ΔTm = Ts − Tm, at the onset of graphite eutectic solidification can be
determined from [4]:
3
m s m s 3 3
4
π μ
ef
e
c QT T T T
L N f
(4)
1000
1050
1100
1150
1200
1250
1300
1350
1400
100 150 200 250 300 350
Time, s
Tem
pera
ture
, oc
-5
-4
-3
-2
-1
0
1
2
3
4
5
Co
oli
ng
rate
, oC
/s
Temperature
Cooling rate
Ti
Q
Tm
Ts
Tc
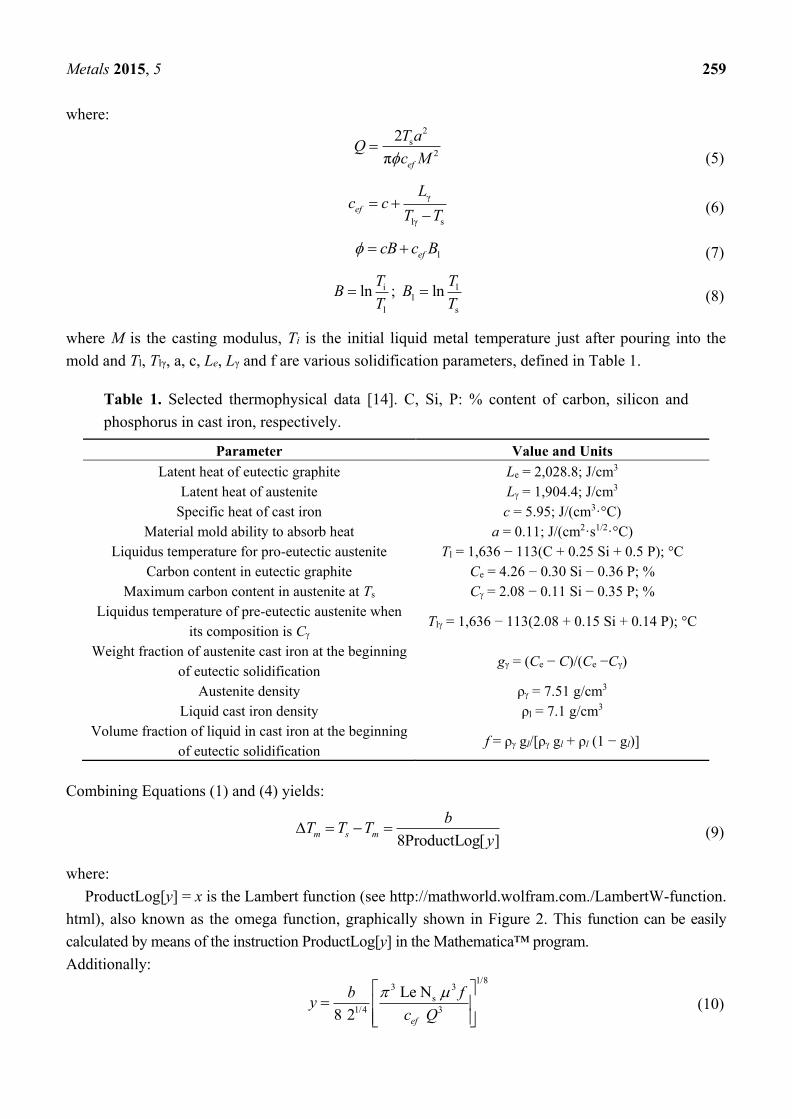
Metals 2015, 5 259
where: 2
s
2
2
π ef
T aQ
c M
(5)
γ
lγ s
ef
Lc c
T T
(6)
1efcB c B (7)
i
l
lnT
BT
; l1
s
lnT
BT
(8)
where M is the casting modulus, Ti is the initial liquid metal temperature just after pouring into the
mold and Tl, Tlγ, a, c, Le, Lγ and f are various solidification parameters, defined in Table 1.
Table 1. Selected thermophysical data [14]. C, Si, P: % content of carbon, silicon and
phosphorus in cast iron, respectively.
Parameter Value and Units
Latent heat of eutectic graphite Le = 2,028.8; J/cm3
Latent heat of austenite L = 1,904.4; J/cm3
Specific heat of cast iron c = 5.95; J/(cm3·°C)
Material mold ability to absorb heat a = 0.11; J/(cm2·s1/2·°C)
Liquidus temperature for pro-eutectic austenite Tl = 1,636 − 113(C + 0.25 Si + 0.5 P); °C
Carbon content in eutectic graphite Ce = 4.26 − 0.30 Si − 0.36 P; %
Maximum carbon content in austenite at Ts C = 2.08 − 0.11 Si − 0.35 P; %
Liquidus temperature of pre-eutectic austenite when
its composition is C Tl = 1,636 − 113(2.08 + 0.15 Si + 0.14 P); °C
Weight fraction of austenite cast iron at the beginning
of eutectic solidification gγ = (Ce − C)/(Ce −Cγ)
Austenite density ρ = 7.51 g/cm3
Liquid cast iron density ρl = 7.1 g/cm3
Volume fraction of liquid in cast iron at the beginning
of eutectic solidification f = ρ gl/[ρ gl + ρl (1 − gl)]
Combining Equations (1) and (4) yields:
8ProductLog[ ]m s m
bT T T
y (9)
where:
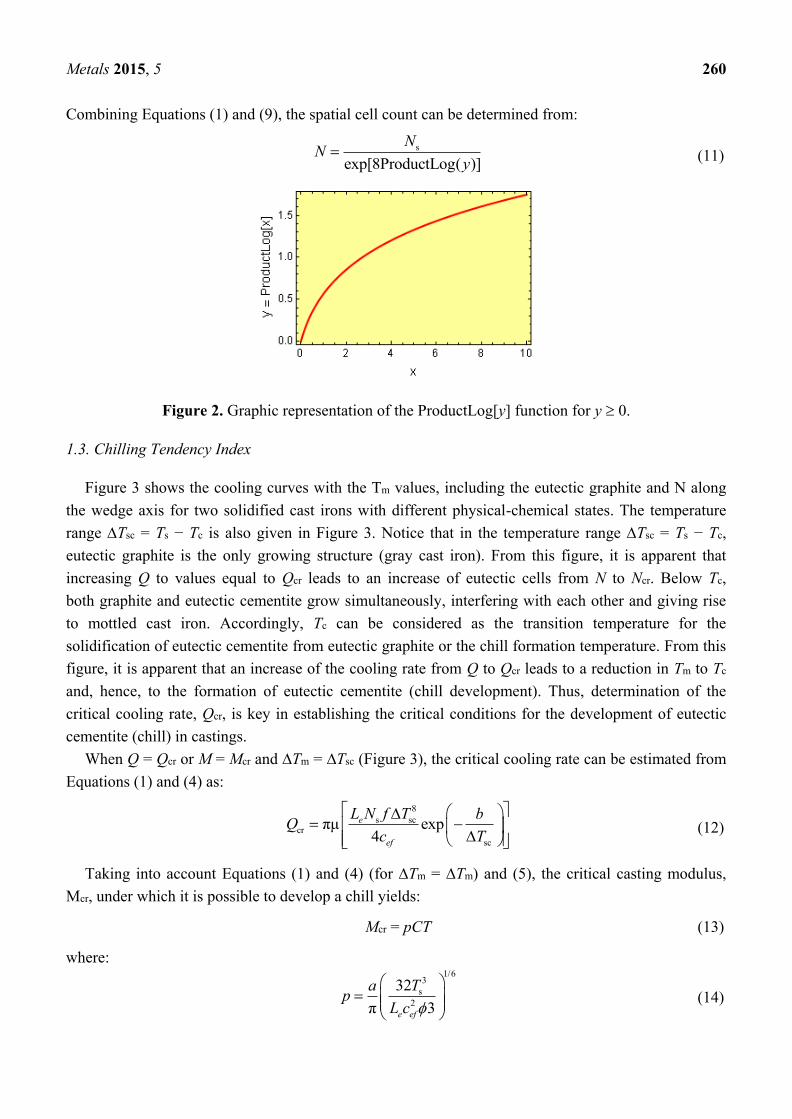
ProductLog[y] = x is the Lambert function (see http://mathworld.wolfram.com./LambertW-function.
html), also known as the omega function, graphically shown in Figure 2. This function can be easily
calculated by means of the instruction ProductLog[y] in the Mathematica™ program.
Additionally: 1/8
3 3
s
1/4 3
Le N
8 2 ef
fby
c Q
(10)
Metals 2015, 5 260
Combining Equations (1) and (9), the spatial cell count can be determined from:
s
exp[8ProductLog( )]
NN
y (11)
Figure 2. Graphic representation of the ProductLog[y] function for y 0.
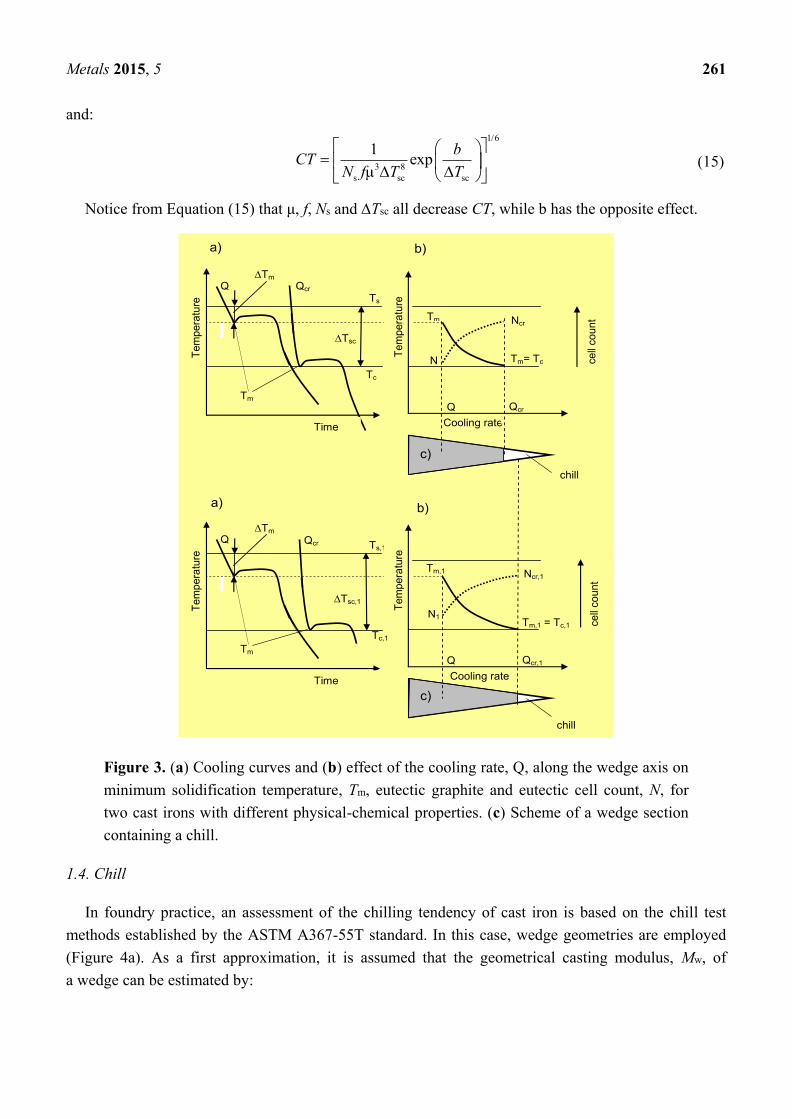
1.3. Chilling Tendency Index
Figure 3 shows the cooling curves with the Tm values, including the eutectic graphite and N along
the wedge axis for two solidified cast irons with different physical-chemical states. The temperature
range Tsc = Ts − Tc is also given in Figure 3. Notice that in the temperature range Tsc = Ts − Tc,
eutectic graphite is the only growing structure (gray cast iron). From this figure, it is apparent that
increasing Q to values equal to Qcr leads to an increase of eutectic cells from N to Ncr. Below Tc,
both graphite and eutectic cementite grow simultaneously, interfering with each other and giving rise
to mottled cast iron. Accordingly, Tc can be considered as the transition temperature for the
solidification of eutectic cementite from eutectic graphite or the chill formation temperature. From this
figure, it is apparent that an increase of the cooling rate from Q to Qcr leads to a reduction in Tm to Tc
and, hence, to the formation of eutectic cementite (chill development). Thus, determination of the
critical cooling rate, Qcr, is key in establishing the critical conditions for the development of eutectic
cementite (chill) in castings.
When Q = Qcr or M = Mcr and ∆Tm = ∆Tsc (Figure 3), the critical cooling rate can be estimated from
Equations (1) and (4) as:
8
s sccr
sc
πμ exp4
e
ef
L N f T bQ
c T
(12)
Taking into account Equations (1) and (4) (for ∆Tm = ∆Tm) and (5), the critical casting modulus,
Mcr, under which it is possible to develop a chill yields:
Mcr = pCT (13)
where: 1/6
3
s
2
32
π 3e ef
Tap
L c
(14)
Metals 2015, 5 261
and:
1/6
3 8
s sc sc
1exp
μ
bCT
N f T T
(15)
Notice from Equation (15) that μ, f, Ns and Tsc all decrease CT, while b has the opposite effect.
Te
mp
era
ture
Tm
b)
Time
a)
Qcr Q
Tm
Tc
Ts
Tsc
N
Ncr
ce
ll co
unt
Cooling rate
Te
mp
era
ture
chill
Q
Qcr
Tm
Tm= Tc
c)
Te
mp
era
ture
Tm
Time
Qcr Q
Tm,1
Tc,1
Ts,1
Tsc,1
N1
Ncr,1
ce
ll co
unt
Cooling rate
Te
mp
era
ture
chill
Q
Qcr,1
Tm
Tm,1 = Tc,1
a)
b)
c)
Figure 3. (a) Cooling curves and (b) effect of the cooling rate, Q, along the wedge axis on
minimum solidification temperature, Tm, eutectic graphite and eutectic cell count, N, for
two cast irons with different physical-chemical properties. (c) Scheme of a wedge section
containing a chill.
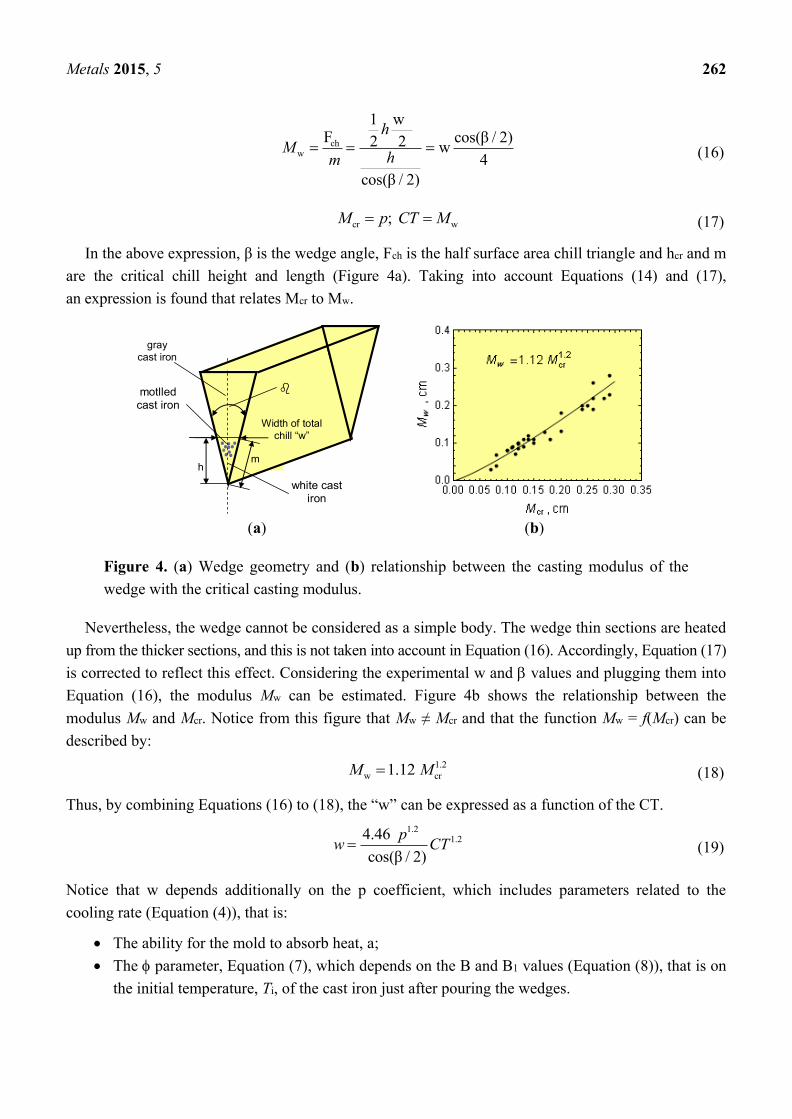
1.4. Chill
In foundry practice, an assessment of the chilling tendency of cast iron is based on the chill test
methods established by the ASTM A367-55T standard. In this case, wedge geometries are employed
(Figure 4a). As a first approximation, it is assumed that the geometrical casting modulus, Mw, of
a wedge can be estimated by:
Metals 2015, 5 262
chw
w1F cos(β / 2)2 2 w 4
cos(β / 2)
h
Mhm
(16)
cr w; M p CT M (17)
In the above expression, β is the wedge angle, Fch is the half surface area chill triangle and hcr and m
are the critical chill height and length (Figure 4a). Taking into account Equations (14) and (17),
an expression is found that relates Mcr to Mw.
gray
cast iron
Width of total
chill “w”
m h
motlled cast iron
white cast iron
(a) (b)
Figure 4. (a) Wedge geometry and (b) relationship between the casting modulus of the
wedge with the critical casting modulus.
Nevertheless, the wedge cannot be considered as a simple body. The wedge thin sections are heated
up from the thicker sections, and this is not taken into account in Equation (16). Accordingly, Equation (17)
is corrected to reflect this effect. Considering the experimental w and values and plugging them into
Equation (16), the modulus Mw can be estimated. Figure 4b shows the relationship between the
modulus Mw and Mcr. Notice from this figure that Mw ≠ Mcr and that the function Mw = f(Mcr) can be
described by:
1.2
w cr1.12 M M (18)
Thus, by combining Equations (16) to (18), the “w” can be expressed as a function of the CT.
1.21.24.46
cos(β / 2)
pw CT
(19)
Notice that w depends additionally on the p coefficient, which includes parameters related to the
cooling rate (Equation (4)), that is:
The ability for the mold to absorb heat, a;
The parameter, Equation (7), which depends on the B and B1 values (Equation (8)), that is on
the initial temperature, Ti, of the cast iron just after pouring the wedges.
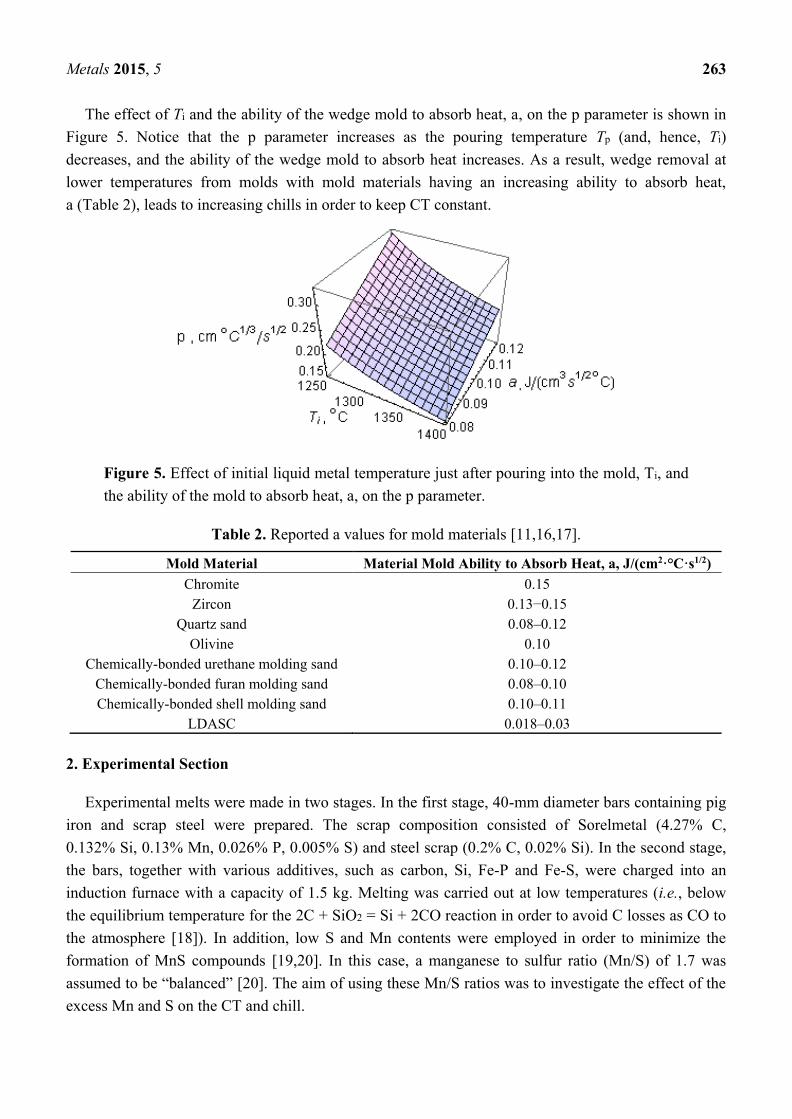
Metals 2015, 5 263
The effect of Ti and the ability of the wedge mold to absorb heat, a, on the p parameter is shown in
Figure 5. Notice that the p parameter increases as the pouring temperature Tp (and, hence, Ti)
decreases, and the ability of the wedge mold to absorb heat increases. As a result, wedge removal at
lower temperatures from molds with mold materials having an increasing ability to absorb heat,
a (Table 2), leads to increasing chills in order to keep CT constant.
Figure 5. Effect of initial liquid metal temperature just after pouring into the mold, Ti, and
the ability of the mold to absorb heat, a, on the p parameter.
Table 2. Reported a values for mold materials [11,16,17].
Mold Material Material Mold Ability to Absorb Heat, a, J/(cm2·°C·s1/2)
Chromite 0.15
Zircon 0.13−0.15
Quartz sand 0.08–0.12
Olivine 0.10
Chemically-bonded urethane molding sand 0.10–0.12
Chemically-bonded furan molding sand 0.08–0.10
Chemically-bonded shell molding sand 0.10–0.11
LDASC 0.018–0.03
2. Experimental Section
Experimental melts were made in two stages. In the first stage, 40-mm diameter bars containing pig
iron and scrap steel were prepared. The scrap composition consisted of Sorelmetal (4.27% C,
0.132% Si, 0.13% Mn, 0.026% P, 0.005% S) and steel scrap (0.2% C, 0.02% Si). In the second stage,
the bars, together with various additives, such as carbon, Si, Fe-P and Fe-S, were charged into an
induction furnace with a capacity of 1.5 kg. Melting was carried out at low temperatures (i.e., below
the equilibrium temperature for the 2C + SiO2 = Si + 2CO reaction in order to avoid C losses as CO to
the atmosphere [18]). In addition, low S and Mn contents were employed in order to minimize the
formation of MnS compounds [19,20]. In this case, a manganese to sulfur ratio (Mn/S) of 1.7 was
assumed to be “balanced” [20]. The aim of using these Mn/S ratios was to investigate the effect of the
excess Mn and S on the CT and chill.
Metals 2015, 5 264
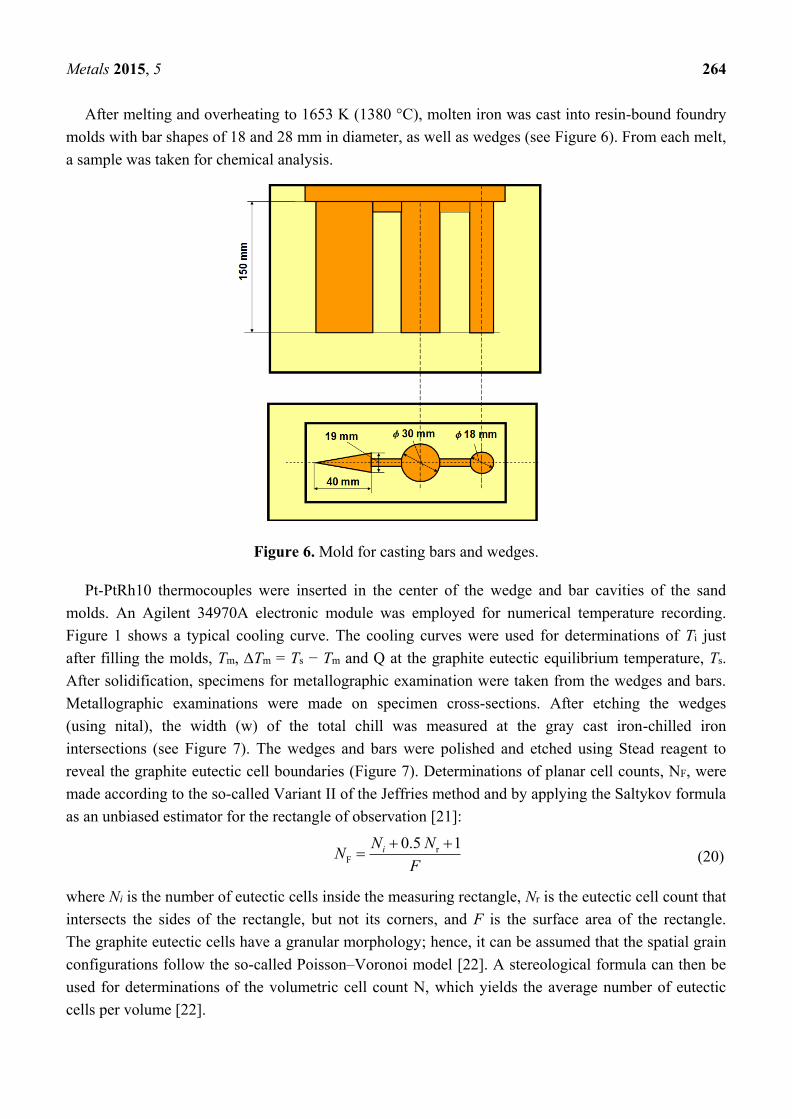
After melting and overheating to 1653 K (1380 °C), molten iron was cast into resin-bound foundry
molds with bar shapes of 18 and 28 mm in diameter, as well as wedges (see Figure 6). From each melt,
a sample was taken for chemical analysis.
Figure 6. Mold for casting bars and wedges.
Pt-PtRh10 thermocouples were inserted in the center of the wedge and bar cavities of the sand
molds. An Agilent 34970A electronic module was employed for numerical temperature recording.
Figure 1 shows a typical cooling curve. The cooling curves were used for determinations of Ti just
after filling the molds, Tm, Tm = Ts − Tm and Q at the graphite eutectic equilibrium temperature, Ts.
After solidification, specimens for metallographic examination were taken from the wedges and bars.
Metallographic examinations were made on specimen cross-sections. After etching the wedges
(using nital), the width (w) of the total chill was measured at the gray cast iron-chilled iron
intersections (see Figure 7). The wedges and bars were polished and etched using Stead reagent to
reveal the graphite eutectic cell boundaries (Figure 7). Determinations of planar cell counts, NF, were
made according to the so-called Variant II of the Jeffries method and by applying the Saltykov formula
as an unbiased estimator for the rectangle of observation [21]:
rF
0.5 1iN NN
F
(20)
where Ni is the number of eutectic cells inside the measuring rectangle, Nr is the eutectic cell count that
intersects the sides of the rectangle, but not its corners, and F is the surface area of the rectangle.
The graphite eutectic cells have a granular morphology; hence, it can be assumed that the spatial grain
configurations follow the so-called Poisson–Voronoi model [22]. A stereological formula can then be
used for determinations of the volumetric cell count N, which yields the average number of eutectic
cells per volume [22].
Metals 2015, 5 265
3/2
F0.568 ( )N N (21)
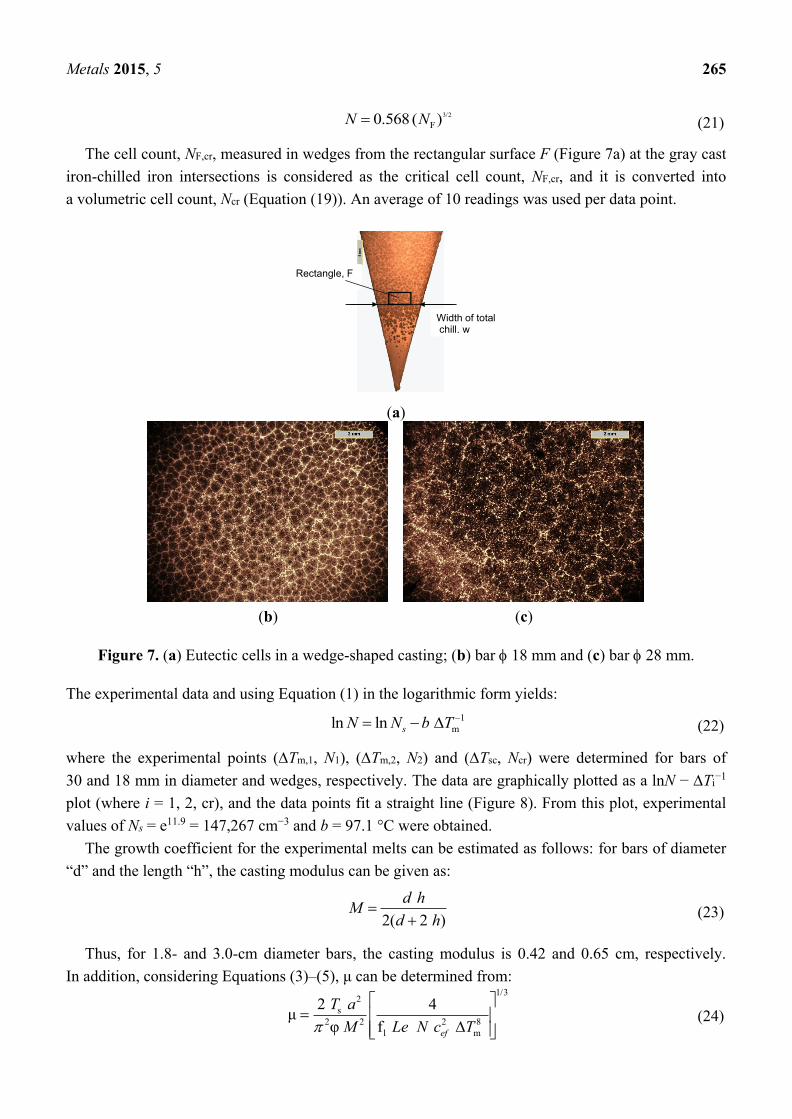
The cell count, NF,cr, measured in wedges from the rectangular surface F (Figure 7a) at the gray cast
iron-chilled iron intersections is considered as the critical cell count, NF,cr, and it is converted into
a volumetric cell count, Ncr (Equation (19)). An average of 10 readings was used per data point.
Width of total chill, w
Rectangle, F
(a)
(b) (c)
Figure 7. (a) Eutectic cells in a wedge-shaped casting; (b) bar 18 mm and (c) bar 28 mm.
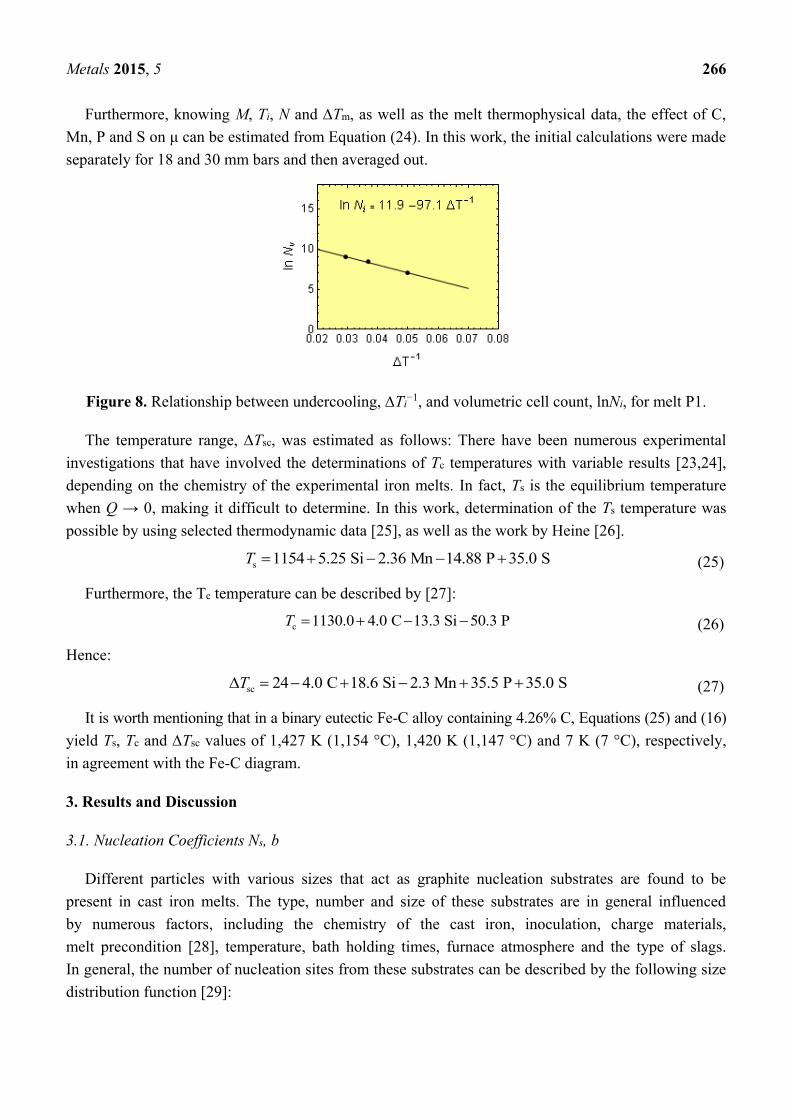
The experimental data and using Equation (1) in the logarithmic form yields:
1
mln ln sN N b T (22)
where the experimental points (Tm,1, N1), (Tm,2, N2) and (Tsc, Ncr) were determined for bars of
30 and 18 mm in diameter and wedges, respectively. The data are graphically plotted as a lnN − Ti−1
plot (where i = 1, 2, cr), and the data points fit a straight line (Figure 8). From this plot, experimental
values of Ns = e11.9 = 147,267 cm−3 and b = 97.1 °C were obtained.
The growth coefficient for the experimental melts can be estimated as follows: for bars of diameter
“d” and the length “h”, the casting modulus can be given as:
2( 2 )
d hM
d h
(23)
Thus, for 1.8- and 3.0-cm diameter bars, the casting modulus is 0.42 and 0.65 cm, respectively.
In addition, considering Equations (3)–(5), μ can be determined from: 1/3
2
s
2 2 2 8
l m
2 4μ
φ f ef
T a
M Le N c T
(24)
Metals 2015, 5 266
Furthermore, knowing M, Ti, N and Tm, as well as the melt thermophysical data, the effect of C,
Mn, P and S on μ can be estimated from Equation (24). In this work, the initial calculations were made
separately for 18 and 30 mm bars and then averaged out.
Figure 8. Relationship between undercooling, Ti−1, and volumetric cell count, lnNi, for melt P1.
The temperature range, Tsc, was estimated as follows: There have been numerous experimental
investigations that have involved the determinations of Tc temperatures with variable results [23,24],
depending on the chemistry of the experimental iron melts. In fact, Ts is the equilibrium temperature
when Q → 0, making it difficult to determine. In this work, determination of the Ts temperature was
possible by using selected thermodynamic data [25], as well as the work by Heine [26].
s 1154 5.25 Si 2.36 Mn 14.88 P 35.0 ST (25)
Furthermore, the Tc temperature can be described by [27]:
c 1130.0 4.0 C 13.3 Si 50.3 PT (26)
Hence:
sc 24 4.0 C 18.6 Si 2.3 Mn 35.5 P 35.0 ST (27)
It is worth mentioning that in a binary eutectic Fe-C alloy containing 4.26% C, Equations (25) and (16)
yield Ts, Tc and Tsc values of 1,427 K (1,154 °C), 1,420 K (1,147 °C) and 7 K (7 °C), respectively,
in agreement with the Fe-C diagram.
3. Results and Discussion
3.1. Nucleation Coefficients Ns, b
Different particles with various sizes that act as graphite nucleation substrates are found to be
present in cast iron melts. The type, number and size of these substrates are in general influenced
by numerous factors, including the chemistry of the cast iron, inoculation, charge materials,
melt precondition [28], temperature, bath holding times, furnace atmosphere and the type of slags.
In general, the number of nucleation sites from these substrates can be described by the following size
distribution function [29]:
Metals 2015, 5 267
s
a a
( ) expN l
n ll l
(28)
where Ns and la are the number of all of the potential graphite nucleation sites in the melt and the
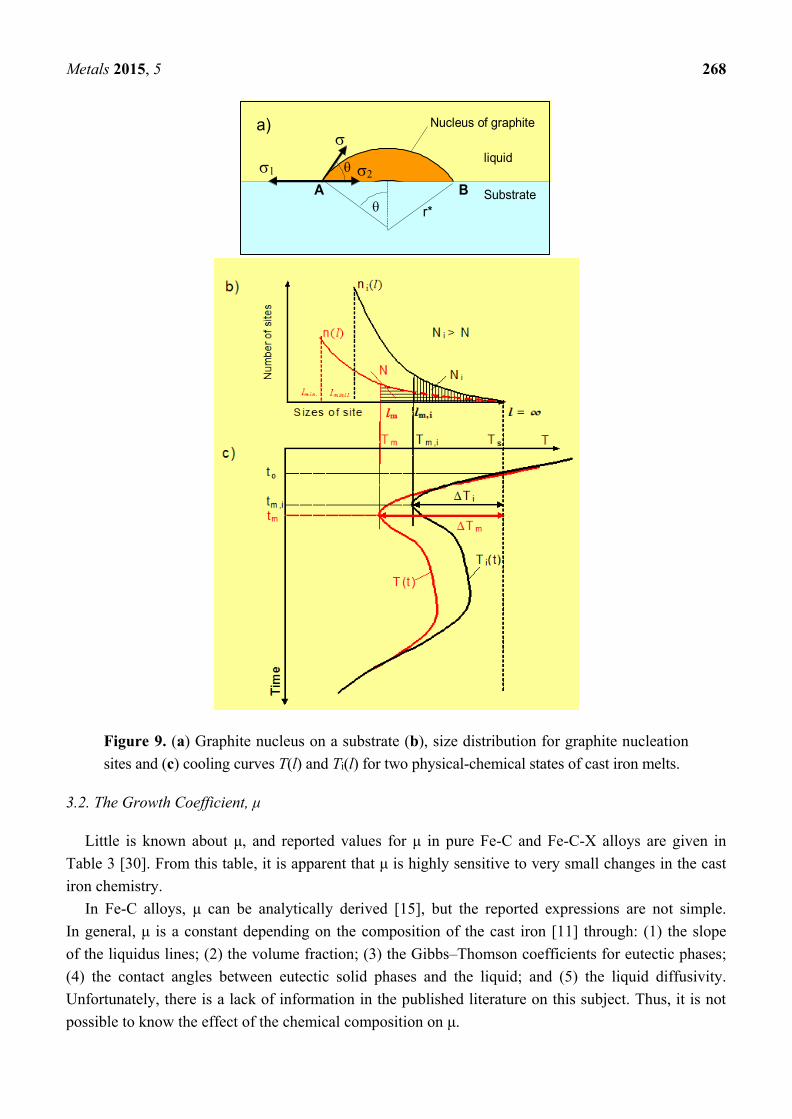
average site size, respectively; l is the size of the nucleation sites (Figure 9a). This function is
schematically shown for two melt states n(l) and ni(l) (see Figure 9b). The number of all of the graphite
nucleation sites in the melt is determined by the nucleation coefficient, Ns (i.e., the area under the n(l)
and ni(l) curves for the lmin, lmin,1 to range (Figure 9b)). However, not all of the substrate sites take
an active role in the nucleation process. The substrate site size, l, from which a nucleus of graphite can
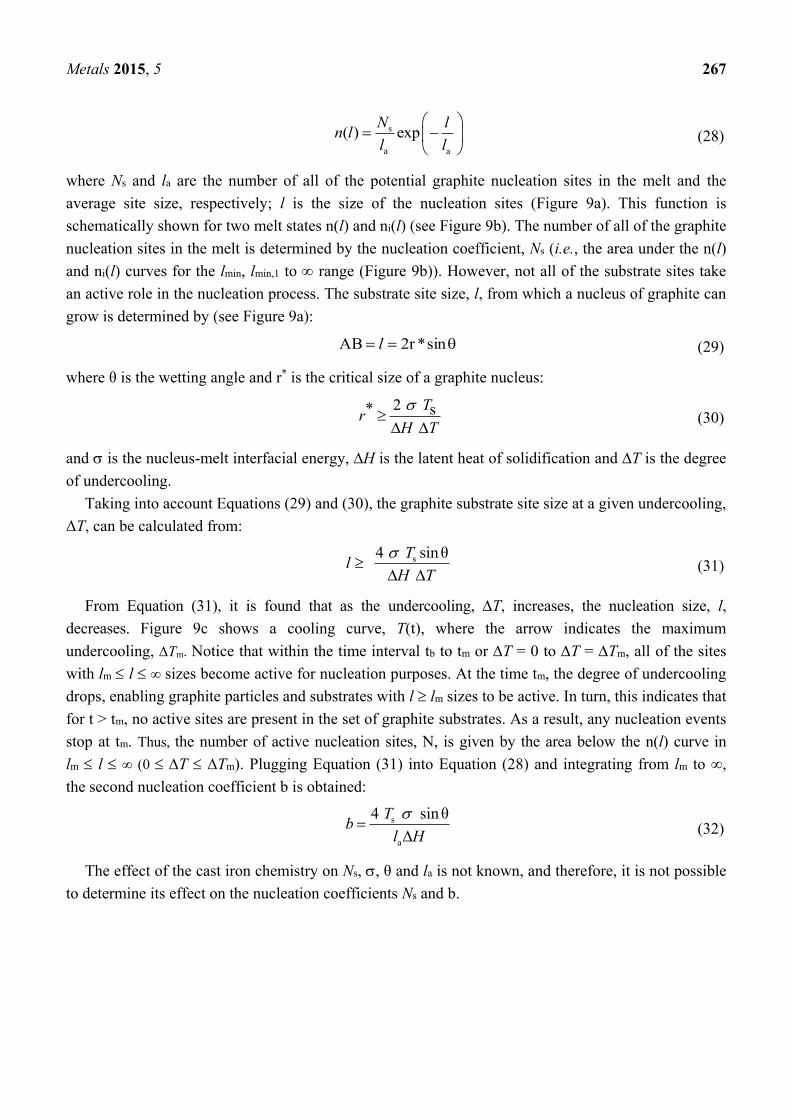
grow is determined by (see Figure 9a):
sin*r2BA l (29)
where θ is the wetting angle and r* is the critical size of a graphite nucleus:
2 * s
Tr
H T
(30)
and is the nucleus-melt interfacial energy, ∆H is the latent heat of solidification and ∆T is the degree
of undercooling.
Taking into account Equations (29) and (30), the graphite substrate site size at a given undercooling,
ΔΤ, can be calculated from:
s4 sinθ
Tl
H T
(31)
From Equation (31), it is found that as the undercooling, T, increases, the nucleation size, l,
decreases. Figure 9c shows a cooling curve, T(t), where the arrow indicates the maximum
undercooling, Tm. Notice that within the time interval tb to tm or T = 0 to T = Tm, all of the sites
with lm l sizes become active for nucleation purposes. At the time tm, the degree of undercooling
drops, enabling graphite particles and substrates with l lm sizes to be active. In turn, this indicates that
for t > tm, no active sites are present in the set of graphite substrates. As a result, any nucleation events
stop at tm. Thus, the number of active nucleation sites, N, is given by the area below the n(l) curve in
lm l (0 T Tm). Plugging Equation (31) into Equation (28) and integrating from lm to ∞,
the second nucleation coefficient b is obtained:
s
a
4 sinθTb
l H
(32)
The effect of the cast iron chemistry on Ns, , θ and la is not known, and therefore, it is not possible
to determine its effect on the nucleation coefficients Ns and b.
Metals 2015, 5 268
Nucleus of graphite
liquid 1
r*
B A
2
Substrate
a)
Figure 9. (a) Graphite nucleus on a substrate (b), size distribution for graphite nucleation
sites and (c) cooling curves T(l) and Ti(l) for two physical-chemical states of cast iron melts.
3.2. The Growth Coefficient, μ
Little is known about μ, and reported values for μ in pure Fe-C and Fe-C-X alloys are given in
Table 3 [30]. From this table, it is apparent that μ is highly sensitive to very small changes in the cast
iron chemistry.
In Fe-C alloys, μ can be analytically derived [15], but the reported expressions are not simple.
In general, μ is a constant depending on the composition of the cast iron [11] through: (1) the slope
of the liquidus lines; (2) the volume fraction; (3) the Gibbs–Thomson coefficients for eutectic phases;
(4) the contact angles between eutectic solid phases and the liquid; and (5) the liquid diffusivity.
Unfortunately, there is a lack of information in the published literature on this subject. Thus, it is not
possible to know the effect of the chemical composition on μ.
Metals 2015, 5 269
Table 3. Reported values for the eutectic growth coefficient, μ [30].
Alloy Eutectic Growth Coefficient, cm/(°C2·s)
Fe-C 9.18 × 10⁻⁶
Fe-C-0.1% Si 7.30 × 10⁻⁶
Fe-C-0.5% Si 5.94 × 10⁻⁶
Fe-C-0.01% P 8.16 × 10⁻⁶
Fe-C-0.1% P 6.94 × 10⁻⁵
Fe-C-0.1% Mn 9.76 × 10⁻⁶
Fe-C-0.6% Mn 1.47 × 10⁻⁵
Fe-C-0.005% S 7.30 × 10⁻⁶
Fe-C-0.01% S 5.94 × 10⁻⁶
3.3. Effect of Carbon
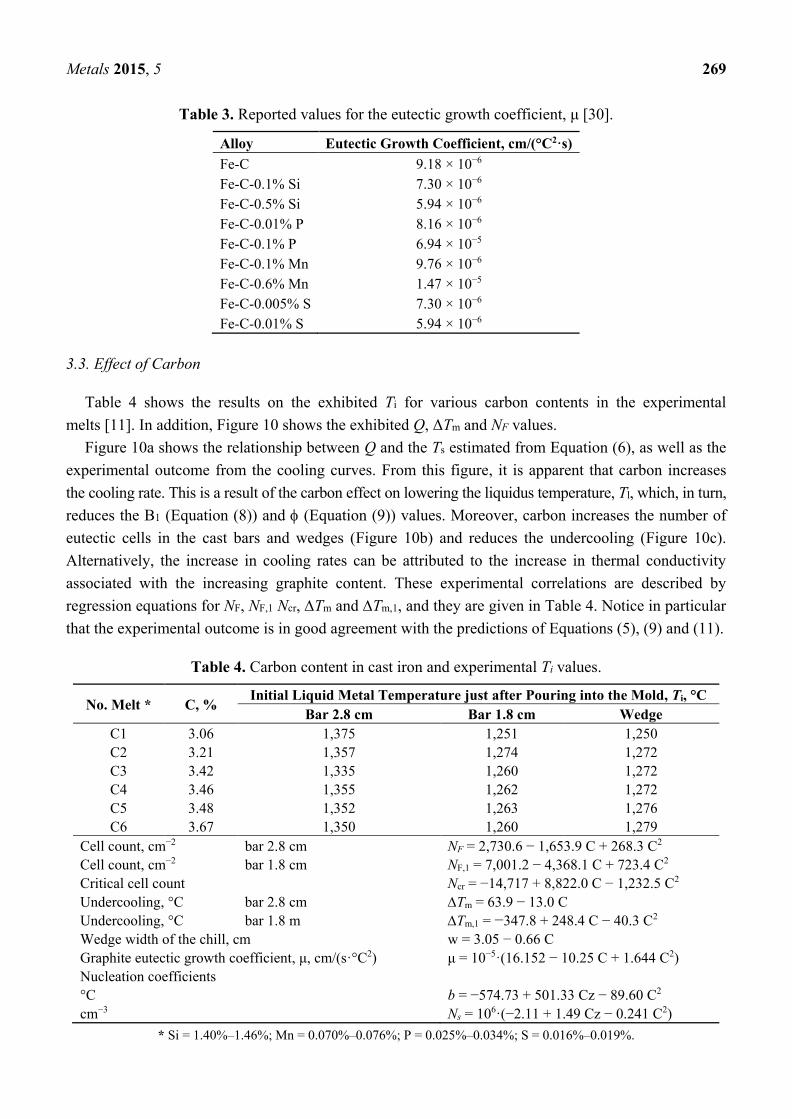
Table 4 shows the results on the exhibited Ti for various carbon contents in the experimental
melts [11]. In addition, Figure 10 shows the exhibited Q, ΔTm and NF values.
Figure 10a shows the relationship between Q and the Ts estimated from Equation (6), as well as the
experimental outcome from the cooling curves. From this figure, it is apparent that carbon increases
the cooling rate. This is a result of the carbon effect on lowering the liquidus temperature, Tl, which, in turn,
reduces the B1 (Equation (8)) and (Equation (9)) values. Moreover, carbon increases the number of
eutectic cells in the cast bars and wedges (Figure 10b) and reduces the undercooling (Figure 10c).
Alternatively, the increase in cooling rates can be attributed to the increase in thermal conductivity
associated with the increasing graphite content. These experimental correlations are described by
regression equations for NF, NF,1 Ncr, Tm and Tm,1, and they are given in Table 4. Notice in particular
that the experimental outcome is in good agreement with the predictions of Equations (5), (9) and (11).
Table 4. Carbon content in cast iron and experimental Ti values.
No. Melt * C, % Initial Liquid Metal Temperature just after Pouring into the Mold, Ti, °C
Bar 2.8 cm Bar 1.8 cm Wedge
C1 3.06 1,375 1,251 1,250
C2 3.21 1,357 1,274 1,272
C3 3.42 1,335 1,260 1,272
C4 3.46 1,355 1,262 1,272
C5 3.48 1,352 1,263 1,276
C6 3.67 1,350 1,260 1,279
Cell count, cm−2 bar 2.8 cm NF = 2,730.6 − 1,653.9 C + 268.3 C2
Cell count, cm−2 bar 1.8 cm NF,1 = 7,001.2 − 4,368.1 C + 723.4 C2
Critical cell count Ncr = −14,717 + 8,822.0 C − 1,232.5 C2
Undercooling, °C bar 2.8 cm Tm = 63.9 − 13.0 C
Undercooling, °C bar 1.8 m Tm,1 = −347.8 + 248.4 C − 40.3 C2
Wedge width of the chill, cm w = 3.05 − 0.66 C
Graphite eutectic growth coefficient, μ, cm/(s·°C2) μ = 10−5·(16.152 − 10.25 C + 1.644 C2)
Nucleation coefficients
°C b = −574.73 + 501.33 Cz − 89.60 C2
cm−3 Ns = 106·(−2.11 + 1.49 Cz − 0.241 C2)
* Si = 1.40%–1.46%; Mn = 0.070%–0.076%; P = 0.025%–0.034%; S = 0.016%–0.019%.
Metals 2015, 5 270
(a)
(b) (c)
Figure 10. Effect of carbon on (a) the cooling rate, Q, of cast iron at the onset of solidification,
(b) cell count and (c) undercooling.
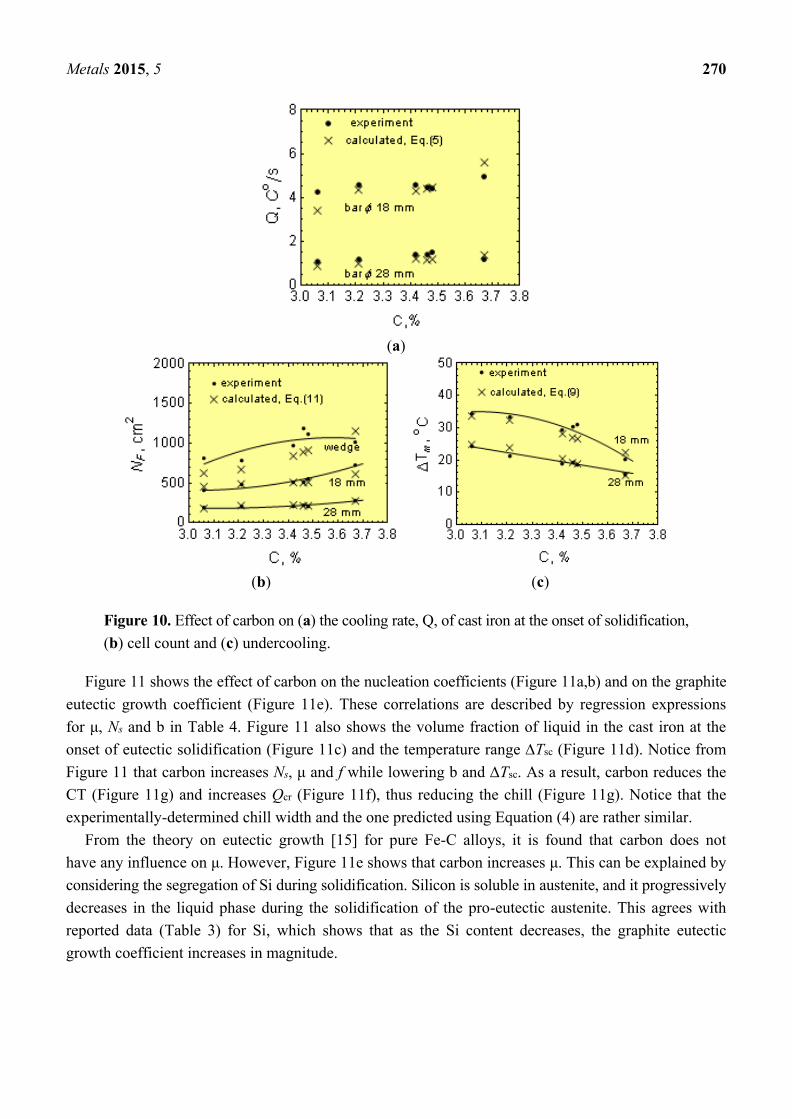
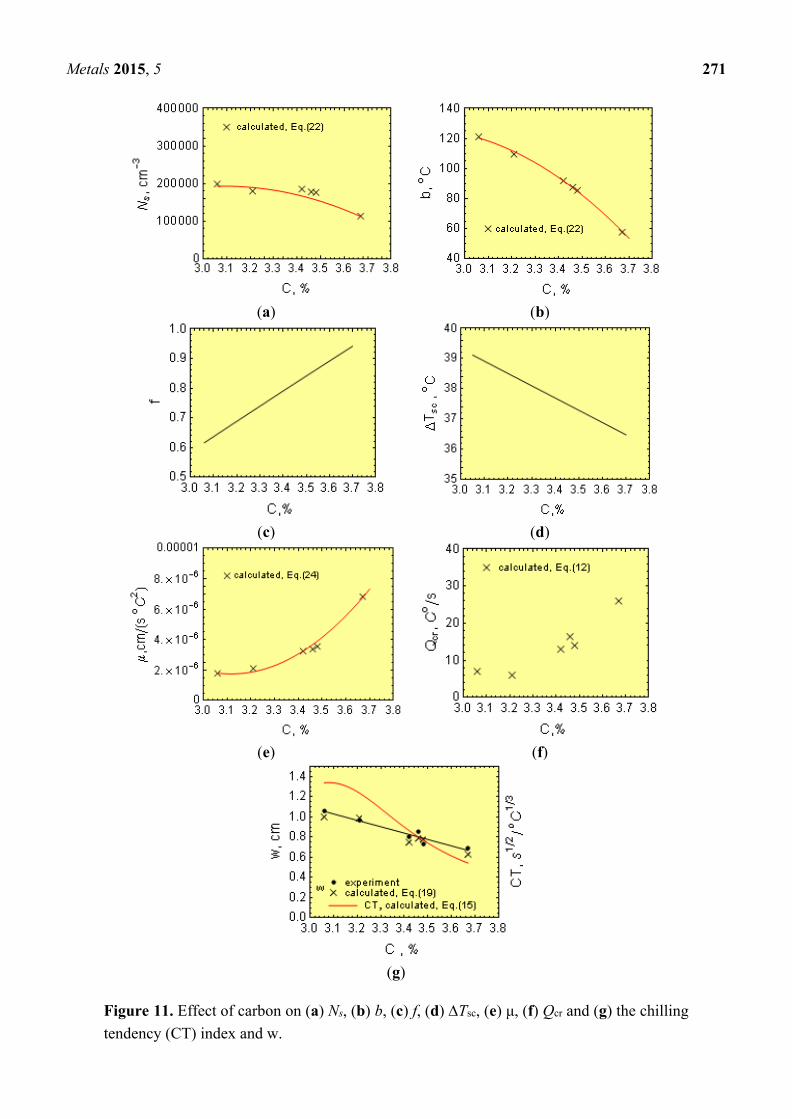
Figure 11 shows the effect of carbon on the nucleation coefficients (Figure 11a,b) and on the graphite
eutectic growth coefficient (Figure 11e). These correlations are described by regression expressions
for μ, Ns and b in Table 4. Figure 11 also shows the volume fraction of liquid in the cast iron at the
onset of eutectic solidification (Figure 11c) and the temperature range Tsc (Figure 11d). Notice from
Figure 11 that carbon increases Ns, μ and f while lowering b and Tsc. As a result, carbon reduces the
CT (Figure 11g) and increases Qcr (Figure 11f), thus reducing the chill (Figure 11g). Notice that the
experimentally-determined chill width and the one predicted using Equation (4) are rather similar.
From the theory on eutectic growth [15] for pure Fe-C alloys, it is found that carbon does not
have any influence on μ. However, Figure 11e shows that carbon increases μ. This can be explained by
considering the segregation of Si during solidification. Silicon is soluble in austenite, and it progressively
decreases in the liquid phase during the solidification of the pro-eutectic austenite. This agrees with
reported data (Table 3) for Si, which shows that as the Si content decreases, the graphite eutectic
growth coefficient increases in magnitude.
Metals 2015, 5 271
(a) (b)
(c) (d)
(e) (f)
(g)
Figure 11. Effect of carbon on (a) Ns, (b) b, (c) f, (d) Tsc, (e) μ, (f) Qcr and (g) the chilling
tendency (CT) index and w.
Metals 2015, 5 272
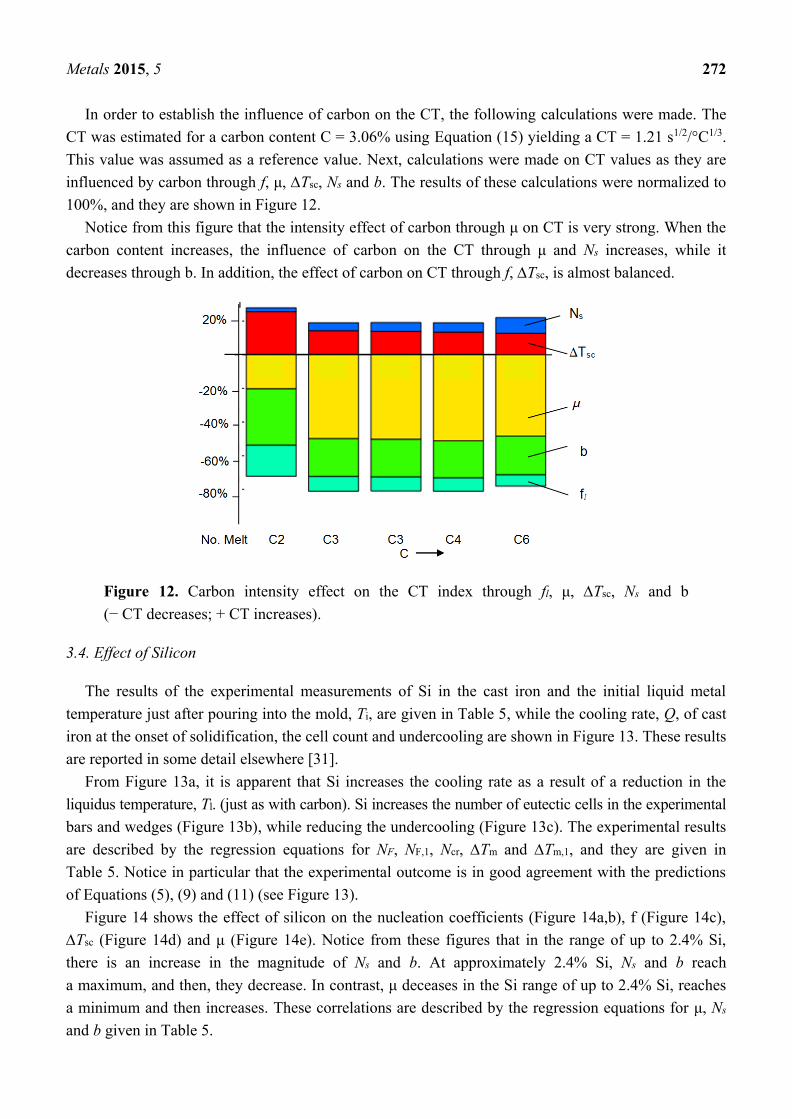
In order to establish the influence of carbon on the CT, the following calculations were made. The
CT was estimated for a carbon content C = 3.06% using Equation (15) yielding a CT = 1.21 s1/2/°C1/3.
This value was assumed as a reference value. Next, calculations were made on CT values as they are
influenced by carbon through f, μ, Tsc, Ns and b. The results of these calculations were normalized to
100%, and they are shown in Figure 12.
Notice from this figure that the intensity effect of carbon through μ on CT is very strong. When the
carbon content increases, the influence of carbon on the CT through μ and Ns increases, while it
decreases through b. In addition, the effect of carbon on CT through f, Tsc, is almost balanced.
Figure 12. Carbon intensity effect on the CT index through fl, μ, Tsc, Ns and b
(− CT decreases; + CT increases).
3.4. Effect of Silicon
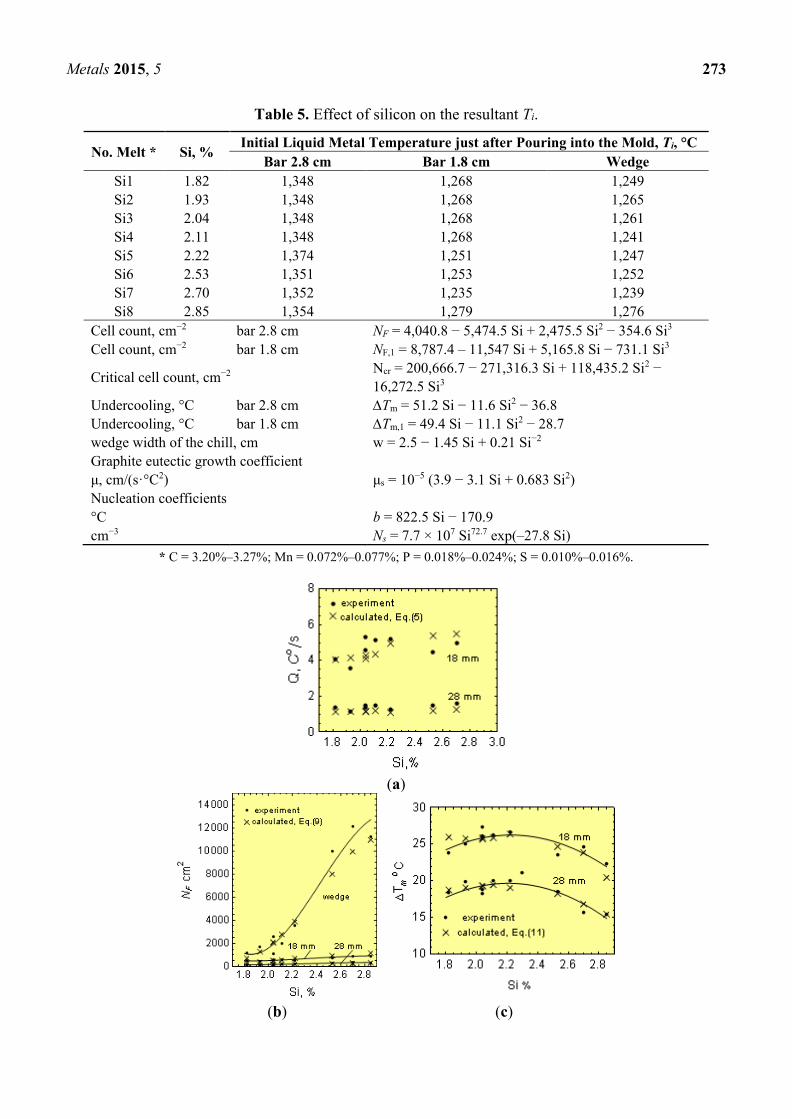
The results of the experimental measurements of Si in the cast iron and the initial liquid metal
temperature just after pouring into the mold, Ti, are given in Table 5, while the cooling rate, Q, of cast
iron at the onset of solidification, the cell count and undercooling are shown in Figure 13. These results
are reported in some detail elsewhere [31].
From Figure 13a, it is apparent that Si increases the cooling rate as a result of a reduction in the
liquidus temperature, Tl. (just as with carbon). Si increases the number of eutectic cells in the experimental
bars and wedges (Figure 13b), while reducing the undercooling (Figure 13c). The experimental results
are described by the regression equations for NF, NF,1, Ncr, Tm and Tm,1, and they are given in
Table 5. Notice in particular that the experimental outcome is in good agreement with the predictions
of Equations (5), (9) and (11) (see Figure 13).
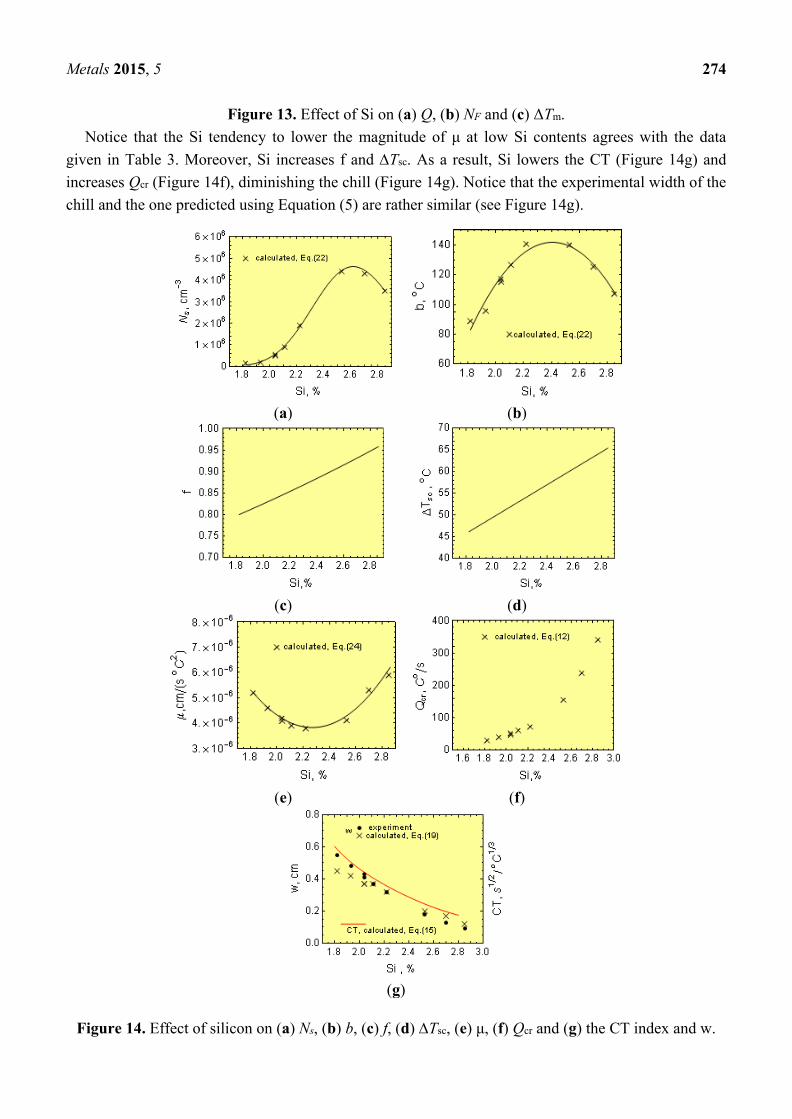
Figure 14 shows the effect of silicon on the nucleation coefficients (Figure 14a,b), f (Figure 14c),
Tsc (Figure 14d) and μ (Figure 14e). Notice from these figures that in the range of up to 2.4% Si,
there is an increase in the magnitude of Ns and b. At approximately 2.4% Si, Ns and b reach
a maximum, and then, they decrease. In contrast, μ deceases in the Si range of up to 2.4% Si, reaches
a minimum and then increases. These correlations are described by the regression equations for μ, Ns
and b given in Table 5.
Metals 2015, 5 273
Table 5. Effect of silicon on the resultant Ti.
No. Melt * Si, % Initial Liquid Metal Temperature just after Pouring into the Mold, Ti, °C
Bar 2.8 cm Bar 1.8 cm Wedge
Si1 1.82 1,348 1,268 1,249
Si2 1.93 1,348 1,268 1,265
Si3 2.04 1,348 1,268 1,261
Si4 2.11 1,348 1,268 1,241
Si5 2.22 1,374 1,251 1,247
Si6 2.53 1,351 1,253 1,252
Si7 2.70 1,352 1,235 1,239
Si8 2.85 1,354 1,279 1,276
Cell count, cm−2 bar 2.8 cm NF = 4,040.8 − 5,474.5 Si + 2,475.5 Si2 − 354.6 Si3
Cell count, cm−2 bar 1.8 cm NF,1 = 8,787.4 – 11,547 Si + 5,165.8 Si − 731.1 Si3
Critical cell count, cm−2 Ncr = 200,666.7 − 271,316.3 Si + 118,435.2 Si2 −
16,272.5 Si3
Undercooling, °C bar 2.8 cm Tm = 51.2 Si − 11.6 Si2 − 36.8
Undercooling, °C bar 1.8 cm Tm,1 = 49.4 Si − 11.1 Si2 − 28.7
wedge width of the chill, cm w = 2.5 − 1.45 Si + 0.21 Si−2
Graphite eutectic growth coefficient
μ, cm/(s·°C2) μs = 10−5 (3.9 − 3.1 Si + 0.683 Si2)
Nucleation coefficients
°C b = 822.5 Si − 170.9
cm−3 Ns = 7.7 × 10⁷ Si72.7 exp(–27.8 Si)
* C = 3.20%–3.27%; Mn = 0.072%–0.077%; P = 0.018%–0.024%; S = 0.010%–0.016%.
(a)
(b) (c)
Metals 2015, 5 274
Figure 13. Effect of Si on (a) Q, (b) NF and (c) ΔTm.
Notice that the Si tendency to lower the magnitude of μ at low Si contents agrees with the data
given in Table 3. Moreover, Si increases f and Tsc. As a result, Si lowers the CT (Figure 14g) and
increases Qcr (Figure 14f), diminishing the chill (Figure 14g). Notice that the experimental width of the
chill and the one predicted using Equation (5) are rather similar (see Figure 14g).
(a) (b)
(c) (d)
(e) (f)
(g)
Figure 14. Effect of silicon on (a) Ns, (b) b, (c) f, (d) Tsc, (e) μ, (f) Qcr and (g) the CT index and w.
Metals 2015, 5 275
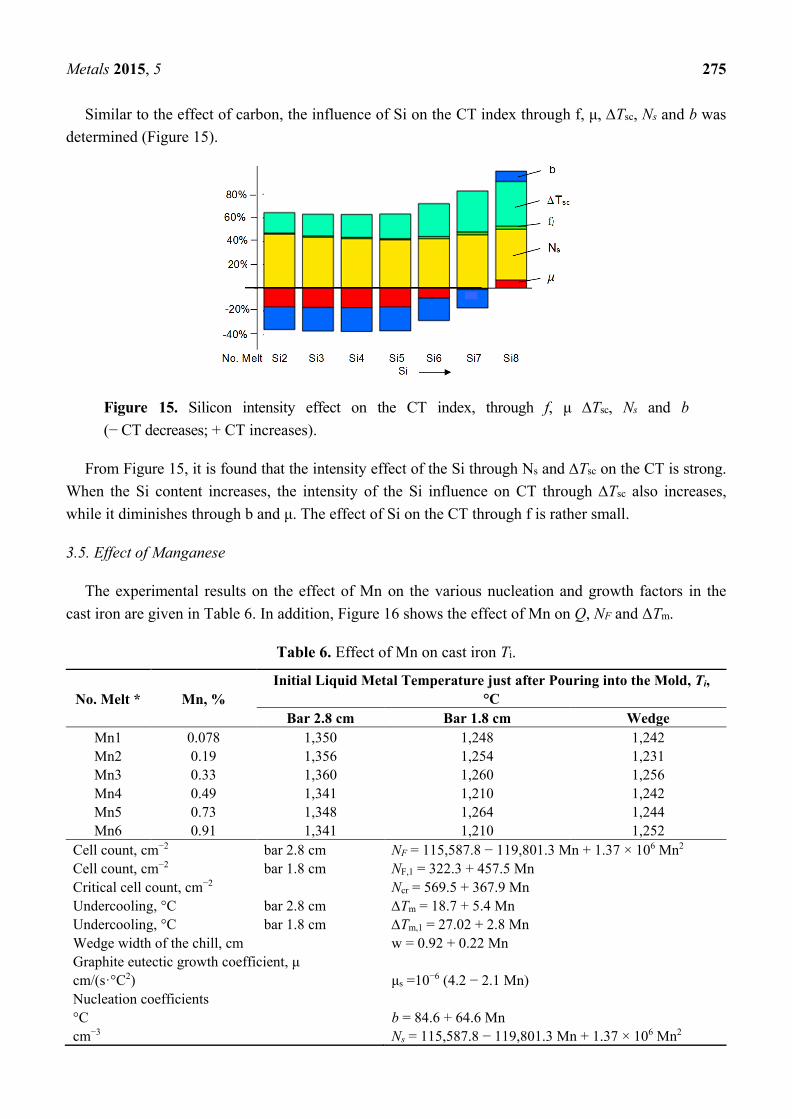
Similar to the effect of carbon, the influence of Si on the CT index through f, μ, Tsc, Ns and b was
determined (Figure 15).
Figure 15. Silicon intensity effect on the CT index, through f, μ Tsc, Ns and b
(− CT decreases; + CT increases).
From Figure 15, it is found that the intensity effect of the Si through Ns and Tsc on the CT is strong.
When the Si content increases, the intensity of the Si influence on CT through Tsc also increases,
while it diminishes through b and μ. The effect of Si on the CT through f is rather small.
3.5. Effect of Manganese
The experimental results on the effect of Mn on the various nucleation and growth factors in the
cast iron are given in Table 6. In addition, Figure 16 shows the effect of Mn on Q, NF and ΔTm.
Table 6. Effect of Mn on cast iron Ti.
No. Melt * Mn, %
Initial Liquid Metal Temperature just after Pouring into the Mold, Ti,
°C
Bar 2.8 cm Bar 1.8 cm Wedge
Mn1 0.078 1,350 1,248 1,242
Mn2 0.19 1,356 1,254 1,231
Mn3 0.33 1,360 1,260 1,256
Mn4 0.49 1,341 1,210 1,242
Mn5 0.73 1,348 1,264 1,244
Mn6 0.91 1,341 1,210 1,252
Cell count, cm−2 bar 2.8 cm NF = 115,587.8 − 119,801.3 Mn + 1.37 × 10⁶ Mn2
Cell count, cm−2 bar 1.8 cm NF,1 = 322.3 + 457.5 Mn
Critical cell count, cm−2 Ncr = 569.5 + 367.9 Mn
Undercooling, °C bar 2.8 cm Tm = 18.7 + 5.4 Mn
Undercooling, °C bar 1.8 cm Tm,1 = 27.02 + 2.8 Mn
Wedge width of the chill, cm w = 0.92 + 0.22 Mn
Graphite eutectic growth coefficient, μ
cm/(s·°C2) μs =10−6 (4.2 − 2.1 Mn)
Nucleation coefficients
°C b = 84.6 + 64.6 Mn
cm−3 Ns = 115,587.8 − 119,801.3 Mn + 1.37 × 10⁶ Mn2
Metals 2015, 5 276
* C = 3.29%–3.37%; Si = 1.21%–1.29%; P = 0.020%–0.03%; S = 0.01%–0.02%.
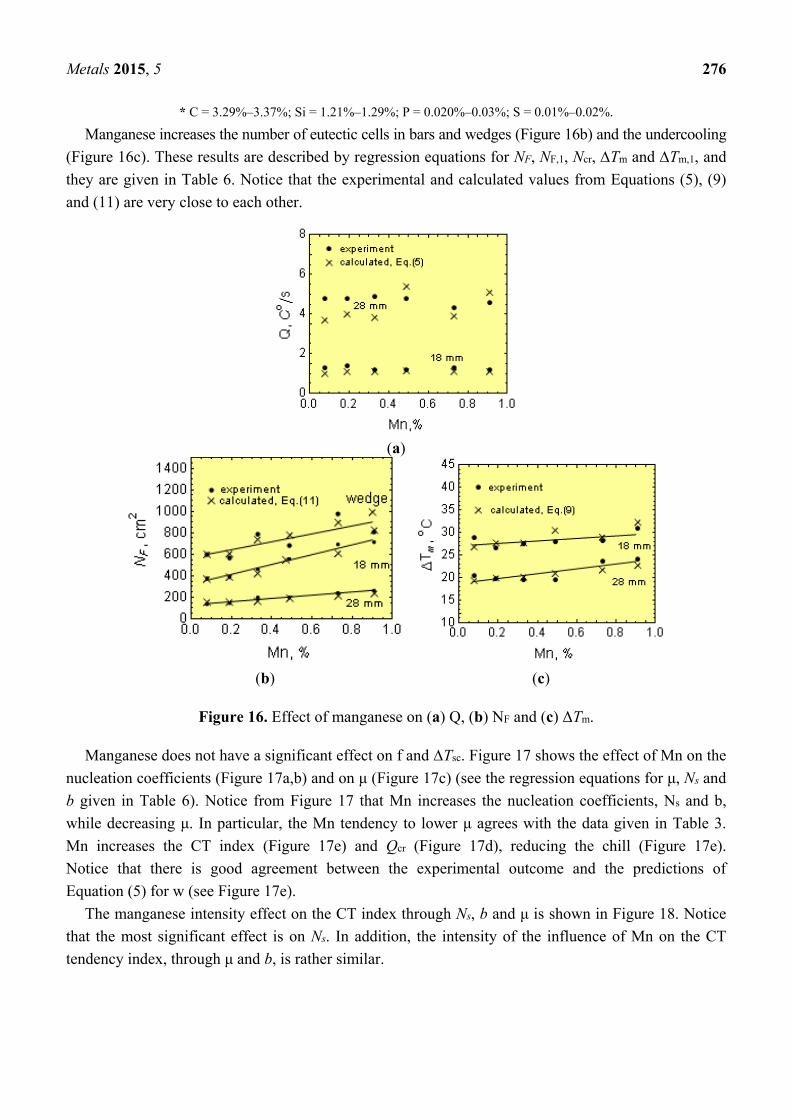
Manganese increases the number of eutectic cells in bars and wedges (Figure 16b) and the undercooling
(Figure 16c). These results are described by regression equations for NF, NF,1, Ncr, Tm and Tm,1, and
they are given in Table 6. Notice that the experimental and calculated values from Equations (5), (9)
and (11) are very close to each other.
(a)
(b) (c)
Figure 16. Effect of manganese on (a) Q, (b) NF and (c) ΔTm.
Manganese does not have a significant effect on f and Tsc. Figure 17 shows the effect of Mn on the
nucleation coefficients (Figure 17a,b) and on μ (Figure 17c) (see the regression equations for μ, Ns and
b given in Table 6). Notice from Figure 17 that Mn increases the nucleation coefficients, Ns and b,
while decreasing μ. In particular, the Mn tendency to lower μ agrees with the data given in Table 3.
Mn increases the CT index (Figure 17e) and Qcr (Figure 17d), reducing the chill (Figure 17e).
Notice that there is good agreement between the experimental outcome and the predictions of
Equation (5) for w (see Figure 17e).
The manganese intensity effect on the CT index through Ns, b and μ is shown in Figure 18. Notice
that the most significant effect is on Ns. In addition, the intensity of the influence of Mn on the CT
tendency index, through μ and b, is rather similar.

Metals 2015, 5 277
(a) (b)
(c) (d)
(e)
Figure 17. Effect of manganese on (a) Ns, (b) b, (c) μ, (d) CT index and (e) w.
Figure 18. Manganese intensity effect on the CT index through μ, Ns and b
(− CT decreases; + CT increases).
Metals 2015, 5 278
3.6. Effect of Phosphorous
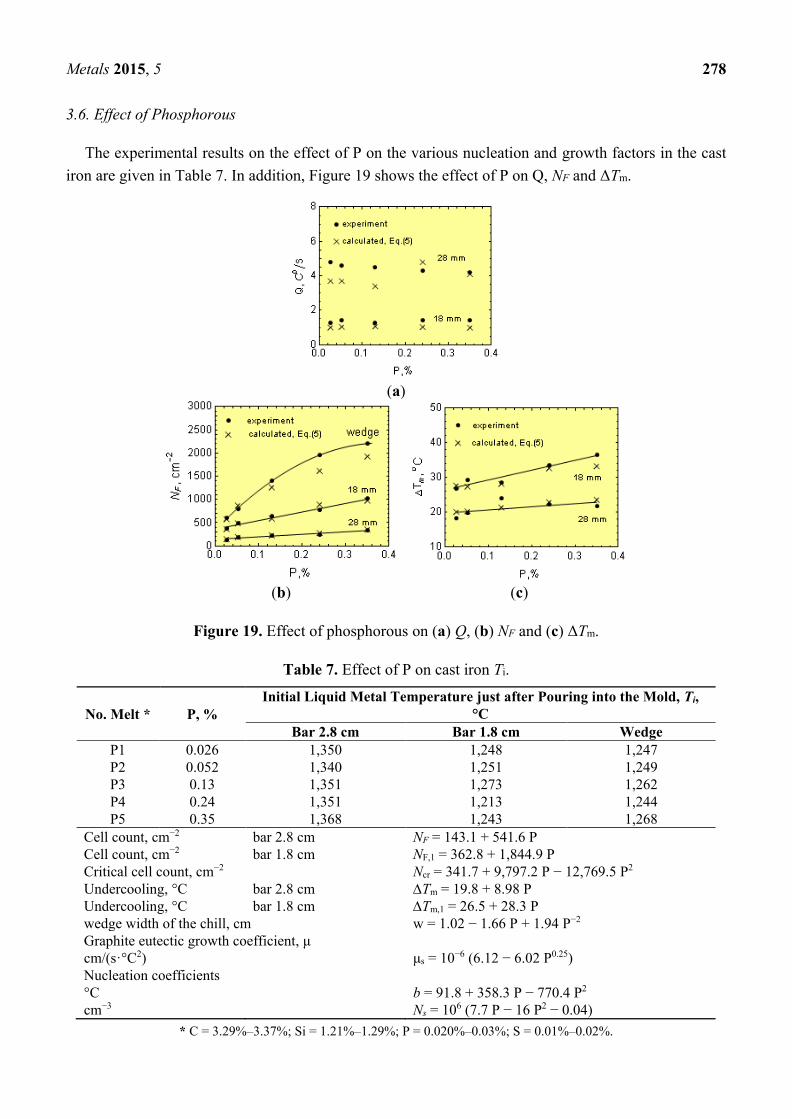
The experimental results on the effect of P on the various nucleation and growth factors in the cast
iron are given in Table 7. In addition, Figure 19 shows the effect of P on Q, NF and ΔTm.
(a)
(b) (c)
Figure 19. Effect of phosphorous on (a) Q, (b) NF and (c) ΔTm.
Table 7. Effect of P on cast iron Ti.
No. Melt * P, %
Initial Liquid Metal Temperature just after Pouring into the Mold, Ti,
°C
Bar 2.8 cm Bar 1.8 cm Wedge
P1 0.026 1,350 1,248 1,247
P2 0.052 1,340 1,251 1,249
P3 0.13 1,351 1,273 1,262
P4 0.24 1,351 1,213 1,244
P5 0.35 1,368 1,243 1,268
Cell count, cm−2 bar 2.8 cm NF = 143.1 + 541.6 P
Cell count, cm−2 bar 1.8 cm NF,1 = 362.8 + 1,844.9 P
Critical cell count, cm−2 Ncr = 341.7 + 9,797.2 P − 12,769.5 P2
Undercooling, °C bar 2.8 cm Tm = 19.8 + 8.98 P
Undercooling, °C bar 1.8 cm Tm,1 = 26.5 + 28.3 P
wedge width of the chill, cm w = 1.02 − 1.66 P + 1.94 P−2
Graphite eutectic growth coefficient, μ
cm/(s·°C2) μs = 10−6 (6.12 − 6.02 P0.25)
Nucleation coefficients
°C b = 91.8 + 358.3 P − 770.4 P2
cm−3 Ns = 106 (7.7 P − 16 P2 − 0.04)
* C = 3.29%–3.37%; Si = 1.21%–1.29%; P = 0.020%–0.03%; S = 0.01%–0.02%.
Metals 2015, 5 279
Phosphorous increases the number of eutectic cells in in the experimental bars and wedges
(Figure 19b) and the undercooling (Figure 19c). These results are described by regression equations for
NF, NF,1, Ncr, Tm and Tm,1, and they are given in Table 7. Notice that the experimental and calculated
values from Equations (5), (9) and (11) are rather similar.
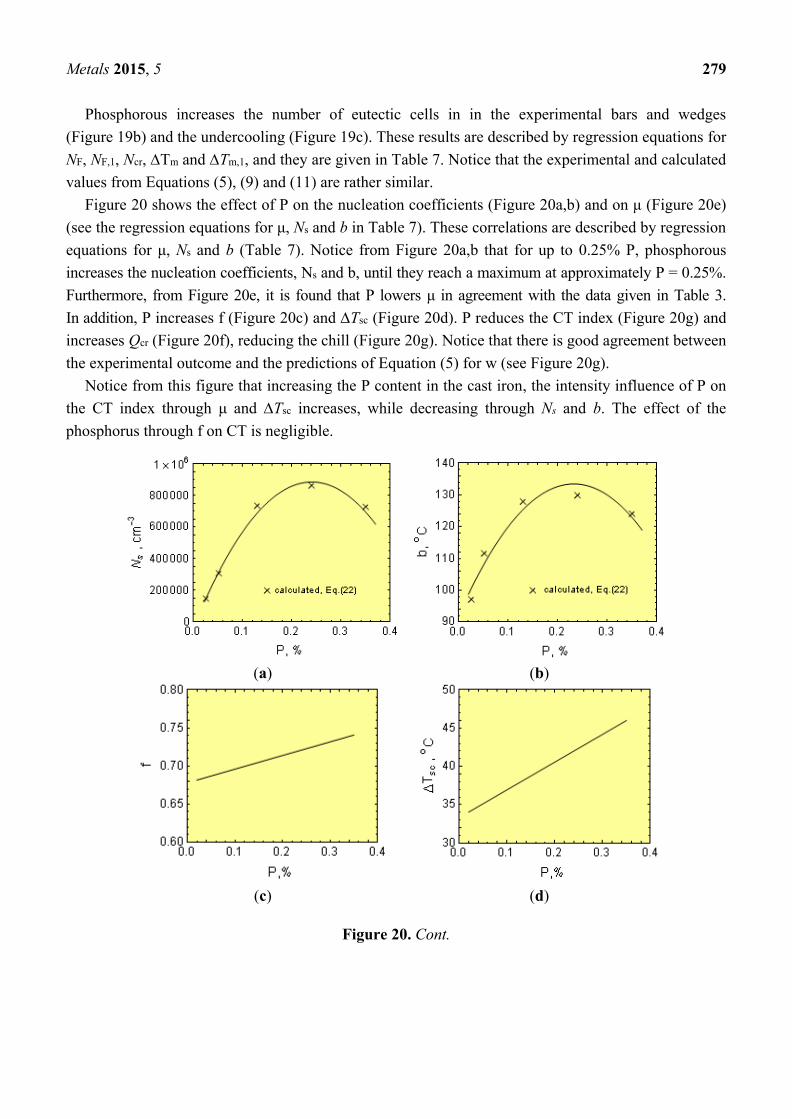
Figure 20 shows the effect of P on the nucleation coefficients (Figure 20a,b) and on μ (Figure 20e)
(see the regression equations for μ, Ns and b in Table 7). These correlations are described by regression
equations for μ, Ns and b (Table 7). Notice from Figure 20a,b that for up to 0.25% P, phosphorous
increases the nucleation coefficients, Ns and b, until they reach a maximum at approximately P = 0.25%.
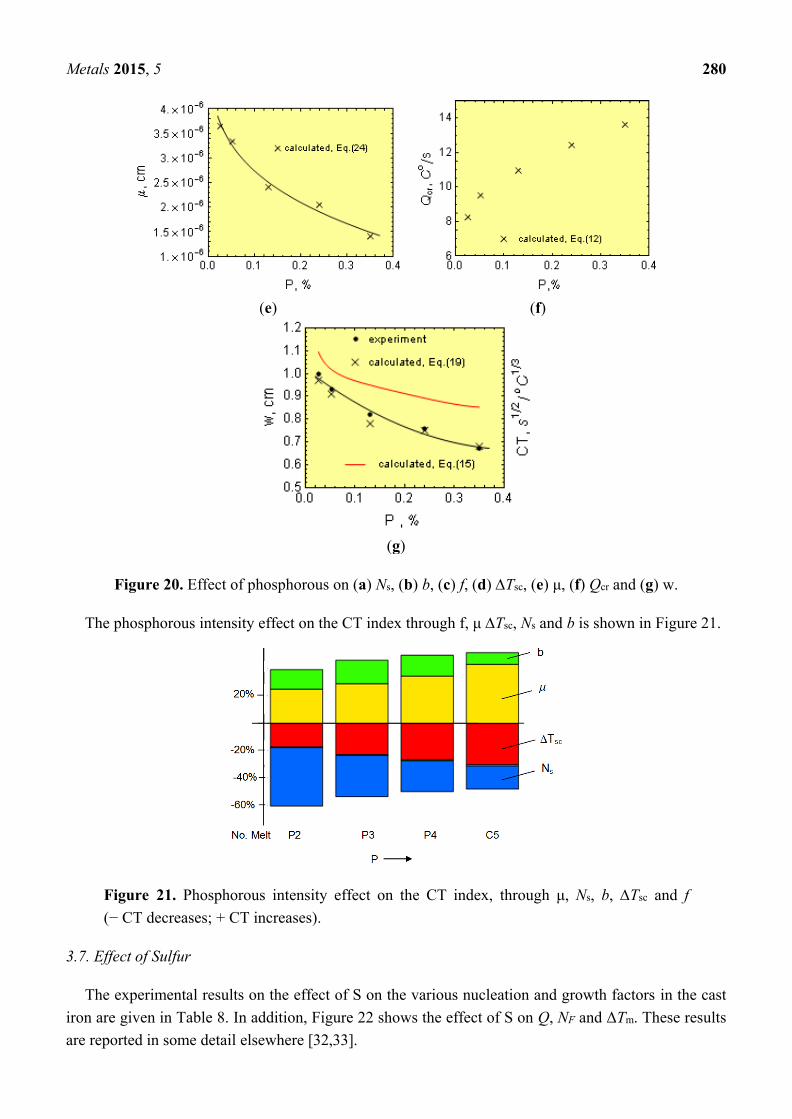
Furthermore, from Figure 20e, it is found that P lowers μ in agreement with the data given in Table 3.
In addition, P increases f (Figure 20c) and Tsc (Figure 20d). P reduces the CT index (Figure 20g) and
increases Qcr (Figure 20f), reducing the chill (Figure 20g). Notice that there is good agreement between
the experimental outcome and the predictions of Equation (5) for w (see Figure 20g).
Notice from this figure that increasing the P content in the cast iron, the intensity influence of P on
the CT index through μ and Tsc increases, while decreasing through Ns and b. The effect of the
phosphorus through f on CT is negligible.
(a) (b)
(c) (d)
Figure 20. Cont.
Metals 2015, 5 280
(e) (f)
(g)
Figure 20. Effect of phosphorous on (a) Ns, (b) b, (c) f, (d) Tsc, (e) μ, (f) Qcr and (g) w.
The phosphorous intensity effect on the CT index through f, μ Tsc, Ns and b is shown in Figure 21.
Figure 21. Phosphorous intensity effect on the CT index, through μ, Ns, b, Tsc and f
(− CT decreases; + CT increases).
3.7. Effect of Sulfur
The experimental results on the effect of S on the various nucleation and growth factors in the cast
iron are given in Table 8. In addition, Figure 22 shows the effect of S on Q, NF and ΔTm. These results
are reported in some detail elsewhere [32,33].
Metals 2015, 5 281
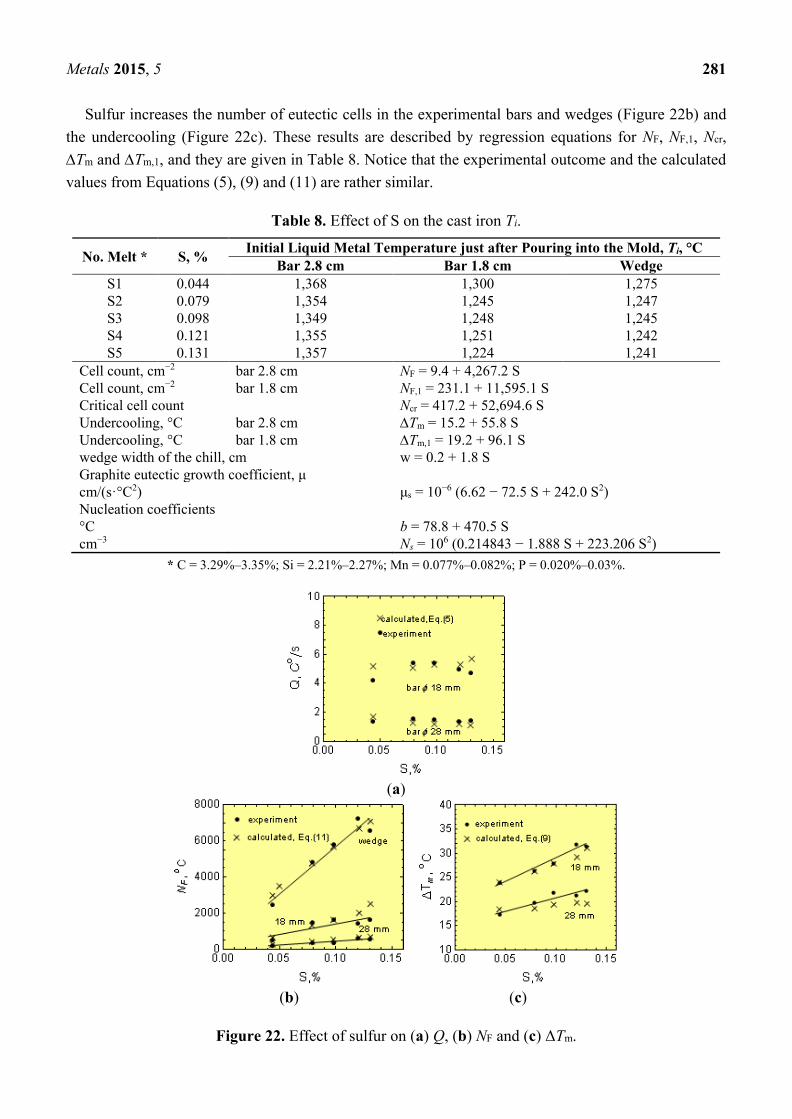
Sulfur increases the number of eutectic cells in the experimental bars and wedges (Figure 22b) and
the undercooling (Figure 22c). These results are described by regression equations for NF, NF,1, Ncr,
Tm and Tm,1, and they are given in Table 8. Notice that the experimental outcome and the calculated
values from Equations (5), (9) and (11) are rather similar.
Table 8. Effect of S on the cast iron Ti.
No. Melt * S, % Initial Liquid Metal Temperature just after Pouring into the Mold, Ti, °C
Bar 2.8 cm Bar 1.8 cm Wedge
S1 0.044 1,368 1,300 1,275
S2 0.079 1,354 1,245 1,247
S3 0.098 1,349 1,248 1,245
S4 0.121 1,355 1,251 1,242
S5 0.131 1,357 1,224 1,241
Cell count, cm−2 bar 2.8 cm NF = 9.4 + 4,267.2 S
Cell count, cm−2 bar 1.8 cm NF,1 = 231.1 + 11,595.1 S
Critical cell count Ncr = 417.2 + 52,694.6 S
Undercooling, °C bar 2.8 cm Tm = 15.2 + 55.8 S
Undercooling, °C bar 1.8 cm Tm,1 = 19.2 + 96.1 S
wedge width of the chill, cm w = 0.2 + 1.8 S
Graphite eutectic growth coefficient, μ
cm/(s·°C2) μs = 10−6 (6.62 − 72.5 S + 242.0 S2)
Nucleation coefficients
°C b = 78.8 + 470.5 S
cm−3 Ns = 106 (0.214843 − 1.888 S + 223.206 S2)
* C = 3.29%–3.35%; Si = 2.21%–2.27%; Mn = 0.077%–0.082%; P = 0.020%–0.03%.
(a)
(b) (c)
Figure 22. Effect of sulfur on (a) Q, (b) NF and (c) ΔTm.
Metals 2015, 5 282
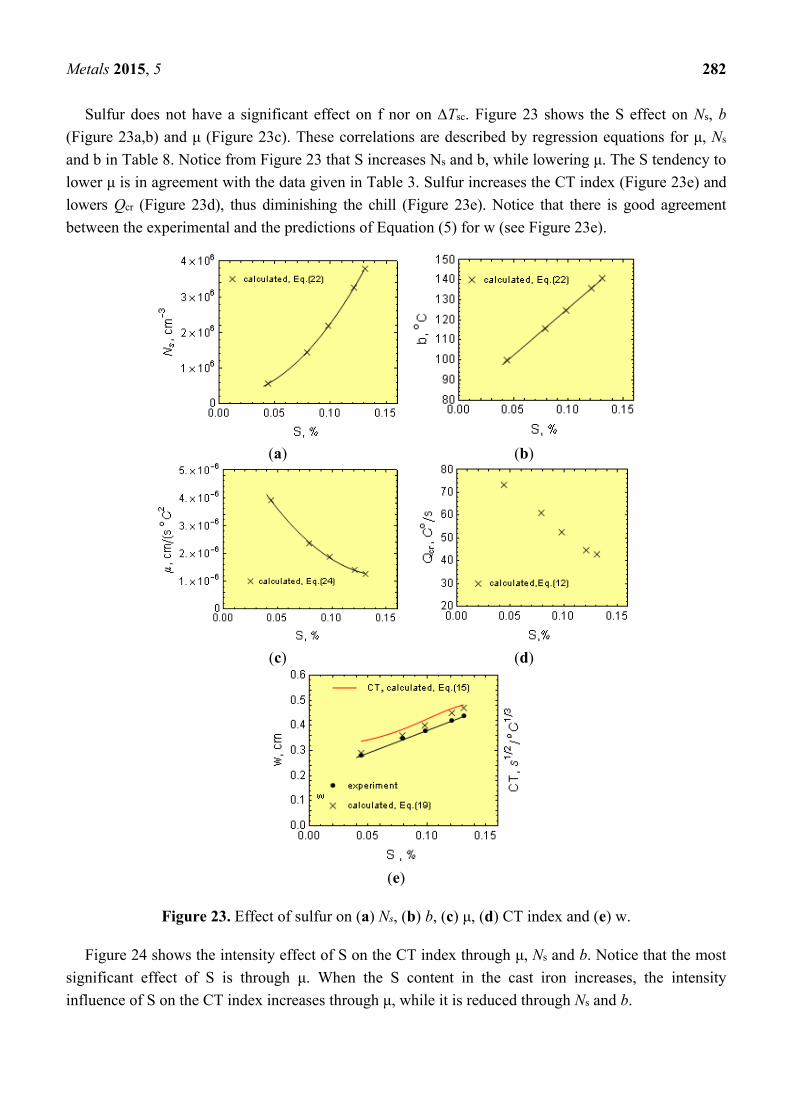
Sulfur does not have a significant effect on f nor on Tsc. Figure 23 shows the S effect on Ns, b
(Figure 23a,b) and μ (Figure 23c). These correlations are described by regression equations for μ, Ns
and b in Table 8. Notice from Figure 23 that S increases Ns and b, while lowering μ. The S tendency to
lower μ is in agreement with the data given in Table 3. Sulfur increases the CT index (Figure 23e) and
lowers Qcr (Figure 23d), thus diminishing the chill (Figure 23e). Notice that there is good agreement
between the experimental and the predictions of Equation (5) for w (see Figure 23e).
(a) (b)
(c) (d)
(e)
Figure 23. Effect of sulfur on (a) Ns, (b) b, (c) μ, (d) CT index and (e) w.
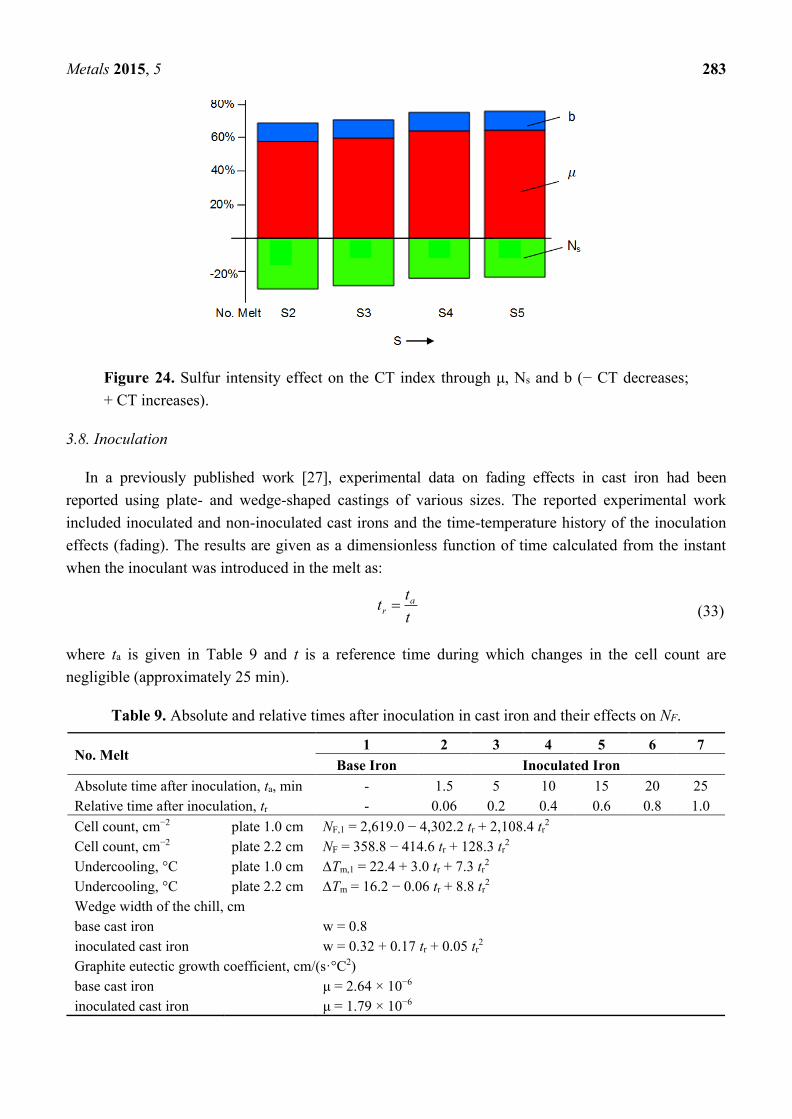
Figure 24 shows the intensity effect of S on the CT index through μ, Ns and b. Notice that the most
significant effect of S is through μ. When the S content in the cast iron increases, the intensity
influence of S on the CT index increases through μ, while it is reduced through Ns and b.
Metals 2015, 5 283
Figure 24. Sulfur intensity effect on the CT index through μ, Ns and b (− CT decreases;
+ CT increases).
3.8. Inoculation
In a previously published work [27], experimental data on fading effects in cast iron had been
reported using plate- and wedge-shaped castings of various sizes. The reported experimental work
included inoculated and non-inoculated cast irons and the time-temperature history of the inoculation
effects (fading). The results are given as a dimensionless function of time calculated from the instant
when the inoculant was introduced in the melt as:
t
tt a
r (33)
where ta is given in Table 9 and t is a reference time during which changes in the cell count are
negligible (approximately 25 min).
Table 9. Absolute and relative times after inoculation in cast iron and their effects on NF.
No. Melt 1 2 3 4 5 6 7
Base Iron Inoculated Iron
Absolute time after inoculation, ta, min - 1.5 5 10 15 20 25
Relative time after inoculation, tr - 0.06 0.2 0.4 0.6 0.8 1.0
Cell count, cm−2 plate 1.0 cm NF,1 = 2,619.0 − 4,302.2 tr + 2,108.4 tr2
Cell count, cm−2 plate 2.2 cm NF = 358.8 − 414.6 tr + 128.3 tr2
Undercooling, °C plate 1.0 cm Tm,1 = 22.4 + 3.0 tr + 7.3 tr2
Undercooling, °C plate 2.2 cm Tm = 16.2 − 0.06 tr + 8.8 tr2
Wedge width of the chill, cm
base cast iron w = 0.8
inoculated cast iron w = 0.32 + 0.17 tr + 0.05 tr2
Graphite eutectic growth coefficient, cm/(s·°C2)
base cast iron μ = 2.64 × 10⁻⁶
inoculated cast iron μ = 1.79 × 10⁻⁶
Metals 2015, 5 284
Table 9. Cont.
No. Melt 1 2 3 4 5 6 7
Base Iron Inoculated Iron
Nucleation coefficients
base cast iron b = 76.8, °C
Ns = 1.6 × 10⁶, cm−3
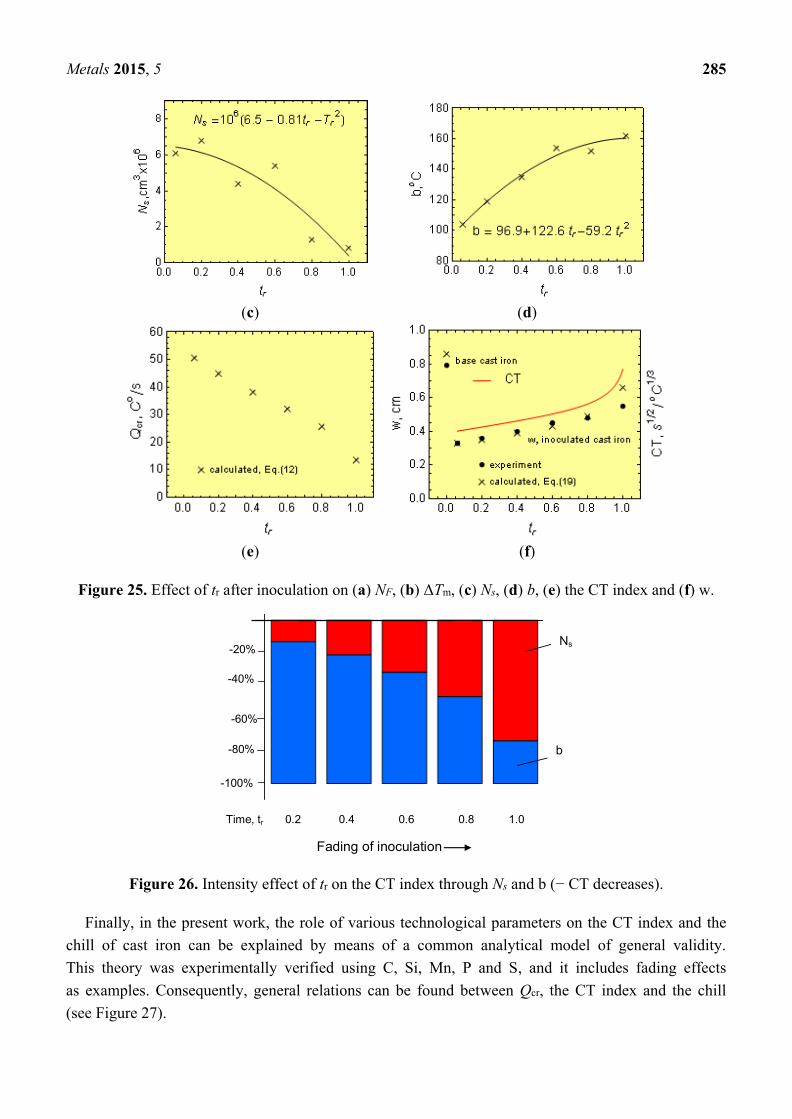
inoculated cast iron b = 96.9 + 122.6 tr – 59.2 tr2, °C
Ns = 106·[6.5–0.8 tr – 5.3 tr2], cm−3
Chemistry
base cast iron C = 3.25%; Si = 1.17%; Mn = 0.13%; P = 0.08%; S = 0.047%
inoculated cast iron C = 3.18%; Si = 1.91%; Mn = 0.13%; P = 0.09%; S = 0.064%
inoculant Si = 73%–75%; Al = 0.75%; Ca = 0.75%–1.25%; Ba = 0.75%–1.25%
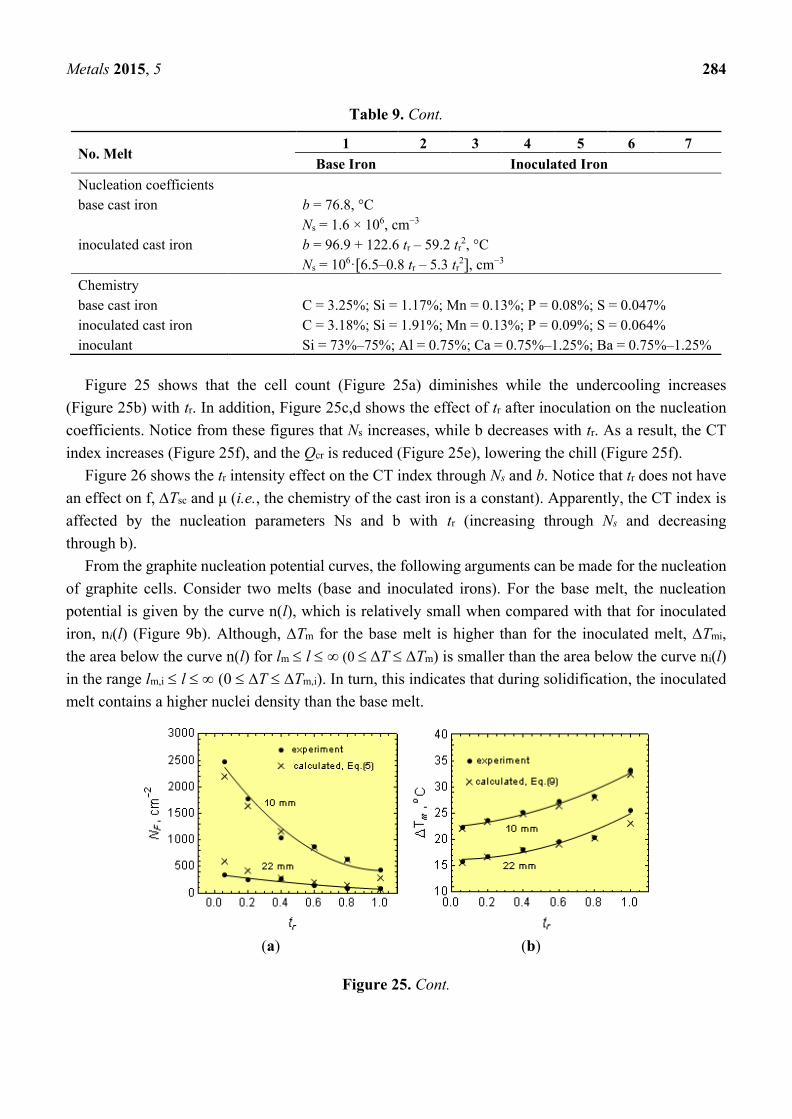
Figure 25 shows that the cell count (Figure 25a) diminishes while the undercooling increases
(Figure 25b) with tr. In addition, Figure 25c,d shows the effect of tr after inoculation on the nucleation
coefficients. Notice from these figures that Ns increases, while b decreases with tr. As a result, the CT
index increases (Figure 25f), and the Qcr is reduced (Figure 25e), lowering the chill (Figure 25f).
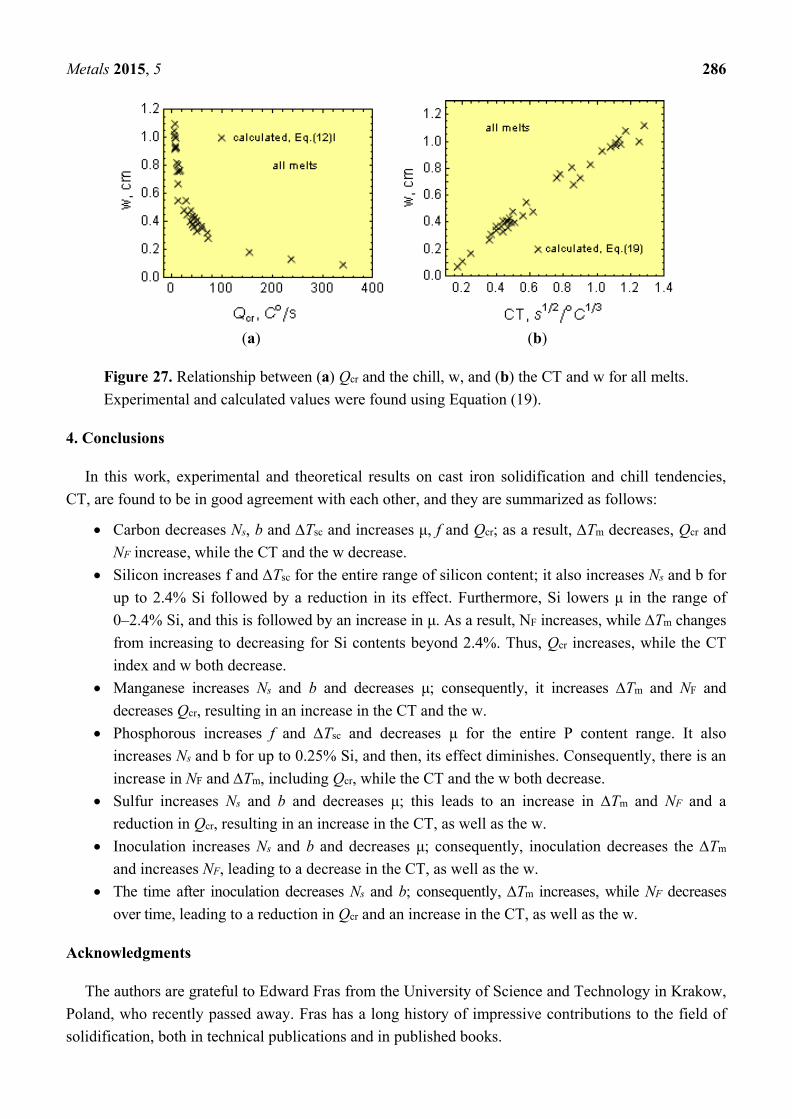
Figure 26 shows the tr intensity effect on the CT index through Ns and b. Notice that tr does not have
an effect on f, Tsc and μ (i.e., the chemistry of the cast iron is a constant). Apparently, the CT index is
affected by the nucleation parameters Ns and b with tr (increasing through Ns and decreasing
through b).
From the graphite nucleation potential curves, the following arguments can be made for the nucleation
of graphite cells. Consider two melts (base and inoculated irons). For the base melt, the nucleation
potential is given by the curve n(l), which is relatively small when compared with that for inoculated
iron, ni(l) (Figure 9b). Although, ∆Tm for the base melt is higher than for the inoculated melt, ∆Tmi,
the area below the curve n(l) for lm l ∞ (0 T Tm) is smaller than the area below the curve ni(l)
in the range lm,i l (0 T Tm,i). In turn, this indicates that during solidification, the inoculated
melt contains a higher nuclei density than the base melt.
(a) (b)
Figure 25. Cont.
Metals 2015, 5 285
(c) (d)
(e) (f)
Figure 25. Effect of tr after inoculation on (a) NF, (b) ΔTm, (c) Ns, (d) b, (e) the CT index and (f) w.
-100%
-40%
-60%
-80%
-20%
b
Time, tr 0.2 0.4 0.6 0.8 1.0
Fading of inoculation
Ns
Figure 26. Intensity effect of tr on the CT index through Ns and b (− CT decreases).
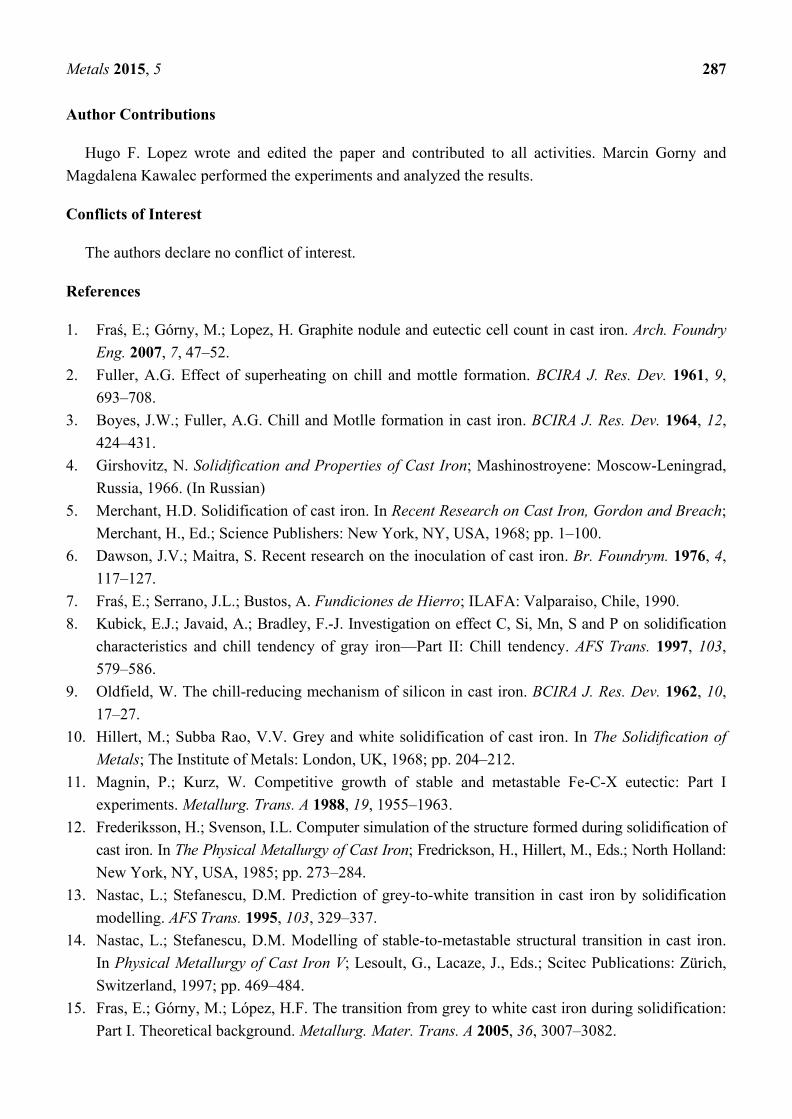
Finally, in the present work, the role of various technological parameters on the CT index and the
chill of cast iron can be explained by means of a common analytical model of general validity.
This theory was experimentally verified using C, Si, Mn, P and S, and it includes fading effects
as examples. Consequently, general relations can be found between Qcr, the CT index and the chill
(see Figure 27).
Metals 2015, 5 286
(a) (b)
Figure 27. Relationship between (a) Qcr and the chill, w, and (b) the CT and w for all melts.
Experimental and calculated values were found using Equation (19).
4. Conclusions
In this work, experimental and theoretical results on cast iron solidification and chill tendencies,
CT, are found to be in good agreement with each other, and they are summarized as follows:
Carbon decreases Ns, b and Tsc and increases μ, f and Qcr; as a result, Tm decreases, Qcr and
NF increase, while the CT and the w decrease.
Silicon increases f and Tsc for the entire range of silicon content; it also increases Ns and b for
up to 2.4% Si followed by a reduction in its effect. Furthermore, Si lowers μ in the range of
0–2.4% Si, and this is followed by an increase in μ. As a result, NF increases, while Tm changes
from increasing to decreasing for Si contents beyond 2.4%. Thus, Qcr increases, while the CT
index and w both decrease.
Manganese increases Ns and b and decreases μ; consequently, it increases Tm and NF and
decreases Qcr, resulting in an increase in the CT and the w.
Phosphorous increases f and Tsc and decreases μ for the entire P content range. It also
increases Ns and b for up to 0.25% Si, and then, its effect diminishes. Consequently, there is an
increase in NF and Tm, including Qcr, while the CT and the w both decrease.
Sulfur increases Ns and b and decreases μ; this leads to an increase in Tm and NF and a
reduction in Qcr, resulting in an increase in the CT, as well as the w.
Inoculation increases Ns and b and decreases μ; consequently, inoculation decreases the Tm
and increases NF, leading to a decrease in the CT, as well as the w.
The time after inoculation decreases Ns and b; consequently, Tm increases, while NF decreases
over time, leading to a reduction in Qcr and an increase in the CT, as well as the w.
Acknowledgments
The authors are grateful to Edward Fras from the University of Science and Technology in Krakow,
Poland, who recently passed away. Fras has a long history of impressive contributions to the field of
solidification, both in technical publications and in published books.
Metals 2015, 5 287
Author Contributions
Hugo F. Lopez wrote and edited the paper and contributed to all activities. Marcin Gorny and
Magdalena Kawalec performed the experiments and analyzed the results.
Conflicts of Interest
The authors declare no conflict of interest.
References
1. Fraś, E.; Górny, M.; Lopez, H. Graphite nodule and eutectic cell count in cast iron. Arch. Foundry
Eng. 2007, 7, 47–52.
2. Fuller, A.G. Effect of superheating on chill and mottle formation. BCIRA J. Res. Dev. 1961, 9,
693–708.
3. Boyes, J.W.; Fuller, A.G. Chill and Motlle formation in cast iron. BCIRA J. Res. Dev. 1964, 12,
424–431.
4. Girshovitz, N. Solidification and Properties of Cast Iron; Mashinostroyene: Moscow-Leningrad,
Russia, 1966. (In Russian)
5. Merchant, H.D. Solidification of cast iron. In Recent Research on Cast Iron, Gordon and Breach;
Merchant, H., Ed.; Science Publishers: New York, NY, USA, 1968; pp. 1–100.
6. Dawson, J.V.; Maitra, S. Recent research on the inoculation of cast iron. Br. Foundrym. 1976, 4,
117–127.
7. Fraś, E.; Serrano, J.L.; Bustos, A. Fundiciones de Hierro; ILAFA: Valparaiso, Chile, 1990.
8. Kubick, E.J.; Javaid, A.; Bradley, F.-J. Investigation on effect C, Si, Mn, S and P on solidification
characteristics and chill tendency of gray iron—Part II: Chill tendency. AFS Trans. 1997, 103,
579–586.
9. Oldfield, W. The chill-reducing mechanism of silicon in cast iron. BCIRA J. Res. Dev. 1962, 10,
17–27.
10. Hillert, M.; Subba Rao, V.V. Grey and white solidification of cast iron. In The Solidification of
Metals; The Institute of Metals: London, UK, 1968; pp. 204–212.
11. Magnin, P.; Kurz, W. Competitive growth of stable and metastable Fe-C-X eutectic: Part I
experiments. Metallurg. Trans. A 1988, 19, 1955–1963.
12. Frederiksson, H.; Svenson, I.L. Computer simulation of the structure formed during solidification of
cast iron. In The Physical Metallurgy of Cast Iron; Fredrickson, H., Hillert, M., Eds.; North Holland:
New York, NY, USA, 1985; pp. 273–284.
13. Nastac, L.; Stefanescu, D.M. Prediction of grey-to-white transition in cast iron by solidification
modelling. AFS Trans. 1995, 103, 329–337.
14. Nastac, L.; Stefanescu, D.M. Modelling of stable-to-metastable structural transition in cast iron.
In Physical Metallurgy of Cast Iron V; Lesoult, G., Lacaze, J., Eds.; Scitec Publications: Zürich,
Switzerland, 1997; pp. 469–484.
15. Fras, E.; Górny, M.; López, H.F. The transition from grey to white cast iron during solidification:
Part I. Theoretical background. Metallurg. Mater. Trans. A 2005, 36, 3007–3082.
Metals 2015, 5 288
16. Magnin, P.; Kurz, W. An analytical model of irregukar eutectic growth and its application to Fe-C.
Acta Metallurg. 1987, 35, 1119–1128.
17. Showman, R.E.; Aufderheide, R.C. A process for thin-wall sand castings. AFS Trans. 2003, 111,
567–578.
18. Midea, T.; Shah, J.V. Mold material thermophysical data. AFS Trans. 2002, 110, 121–136.
19. Popescu, M.; Thompson, J.; Zavadil, R.; Sahoo, M. Summary of AFS Research project on restoring
techniques iron-phase I. AFS Trans. 2002, 110, 1047–1065.
20. Sommerfeld, A.; Tonn, B. Nucleation in cast iron. In Proceedings of the 5th Decennial International
Conference on Solidification Processing, Sheffield, UK, 23–25 July 2007; pp. 467–471.
21. Goodrich, G.M.; Oakwood, T.G.; Gundlach, R.B. Manganese, sulfur and manganese-sulfur ratio
effects in gray cast iron. AFS Trans. 2003, 111, 783–812.
22. Rys, J. Stereology of Materials; Fotobit: Krakow, Poland, 1995.
23. Osher, J.; Lorz, U. Quantitative Gefuengenanalysie; DVG Leipzig-Stuttgard: Frankfurt, Germany,
1994.
24. Doepp, R.; Schwenkel, S. Contribution to the influence of chemical composition and cooling
conditions on the eutectic solidification of Fe-C-X melts. Mater. Sci. Eng. A 2005, 413, 334–338.
25. Kanno, T.; Kikuchi, T.; Kang, I.; Nakae, H. Effect of alloying elements on the eutectic temperature in
cast iron. AFS Trans. 2005, 113, 825–833.
26. Neuman, F. The influence of additional elements on the physic-chemical behaviour of carbon in
saturated molten iron. In Recent Research on Cast Iron; Gordon and Breach: New York, NY,
USA, 1998; pp. 659–705.
27. Heine, R. The carbon equivalent Fe-C-Si diagram and its application to cast iron. AFS Cast Iron
Res. J. 1971, 79, 49–54.
28. Fras, E.; Górny, M.; López, H.F. The transition from grey to white cast iron during solidification:
Part II. Experimental verification. Metallurg. Mater. Trans. A 2005, 36, 3083–3092.
29. Juretzko, F.R.; Dix, L.P.; Ruxanda, R.; Stefanescu, D.M. Precondition of ductile iron melts for
light weight casting: Effect on mechanical properties and microstructure. AFS Trans. 2004, 112,
773–785.
30. Fras, E.; Wiencek, K.; Górny, M.; López, H.F. Graphite nodule and eutectic count in cast iron,
Theoretical model based on Weibull statistic and experimental verification. Metallurg. Mater.
Trans. A 2007, 38, 385–394.
31. Fraś, E.; Górny, M.; López, H.F. Mechanism of carbon on the transition from graphite to eutectic
cementite in cast iron. Metallurg. Mater. Trans. A 2014, 45, 5601–5612.
32. Fraś, E.; Górny, M.; López, H.F. Mechanism for the role of silicon on the transition from graphite
to eutectic cementite in cast iron. Metallurg. Mater. Trans. A 2012, 43, 4204–4218.
33. Fraś, E.; Górny, M.; López, H.F. Role of Sulfur on the Transition from Graphite to Eutectic
cementite in Cast Iron. Metallurg. Mater. Trans. A 2013, 44, 2512–2522.
© 2015 by the authors; licensee MDPI, Basel, Switzerland. This article is an open access article
distributed under the terms and conditions of the Creative Commons Attribution license
(http://creativecommons.org/licenses/by/4.0/).