Role of air changes per hour (ACH) in possible ...
14
Indoor/Outdoor Airflow and Air Quality Research Article BUILD SIMUL (2012) 5: 15 – 28 DOI 10.1007/s12273-011-0053-4 Role of air changes per hour (ACH) in possible transmission of airborne infections Farhad Memarzadeh (), Weiran Xu Department of Health and Human Services, National Institutes of Health, 9000 Rockville Pike, Bethesda, MD 20892, USA Abstract The cost of nosocomial infections in the United States is estimated to be $4 billion to $5 billion annually. Applying a scientifically based analysis to disease transmission and performing a site specific risk analysis to determine the design of the ventilation system can provide real and long term cost savings. Using a scientific approach and convincing data, this paper hypothetically illustrates how a ventilation system design can be optimized to potentially reduce infection risk to occupants in an isolation room based on a thorough risk assessment without necessarily increasing ventilation airflow rate. A computational fluid dynamics (CFD) analysis was performed to examine the transport mechanism, particle path and a suggested control strategy for reducing airborne infectious disease agents. Most studies on the transmission of infectious disease particles have concentrated primarily on air changes per hour (ACH) and how ACH provides a dilution factor for possible infectious agents. Although increasing ventilation airflow rate does dilute concentrations better when the contaminant source is constant, it does not increase ventilation effectiveness. Furthermore, an extensive literature review indicates that not every exposure to an infectious agent will necessarily cause a recipient infection. The results of this study suggest a hypothesis that in an enclosed and mechanically ventilated room (e.g., an isolation room), the dominant factor that affects the transmission and control of contaminants is the path between the contaminant source and exhaust. Contaminants are better controlled when this path is uninterrupted by an air stream. This study illustrates that the ventilation system design ,i.e., when it conforms with the hypothesized path principle, may be a more important factor than flow rate (i.e., ACH). A secondary factor includes the distance from the contaminant source. This study provides evidence and supports previous studies that moving away from the patient generally reduces the infection risk in a transient (coughing) situation, although the effect is more pronounced under higher flow rate. It is noted that future research is needed to determine the exact mode of transmission for most recently identified organisms. Keywords infection transmission and control, risk assessment, air change rate (ACH), computational fluid dynamics (CFD), patient room, ventilation system design Article History Received: 6 September 2011 Revised: 14 October 2011 Accepted: 3 November 2011 © Tsinghua University Press and Springer-Verlag Berlin Heidelberg 2011 1 Introduction The role that airborne transmission plays in nosocomial or hospital acquired infections (NI/HAI) has been highly debated for well over 40 years. Although transmission of nosocomial pathogens from people via an airborne route in the hospital setting is well established, it is a common misconception that most hospital acquired infections (HAI) are spread by aerosol transmission and that the number of air changes per hour (ACH) used to ventilate the occupied space directly impacts the transmission. Many studies on the transmission of infectious disease particles suggest that ventilation is one of the major methods for reduction and control of the spread of pathogens via the airborne route in hospitals (Streifel 1999; Kaushal et al. 2004; Beggs et al. 2008). ASHRAE 170 2008 and the CDC guidelines 2005 recommend ventilation rates of minimum 12 ACH for hospital insulation rooms. Although increasing ventilation airflow rate does dilute con- centrations better when the contaminant source is constant, it does not increase ventilation effectiveness. Li et al. (2005, 2007) discuss the role that ventilation systems play in cross infection between people. They conclude E-mail: fm30c@nih.gov
Transcript of Role of air changes per hour (ACH) in possible ...
Ind
oo
r/Outd
oo
r Airflo
w
an
d A
ir Qu
ality
R
ese
arch
Artic
le
BUILD SIMUL (2012) 5: 15 – 28
DOI 10.1007/s12273-011-0053-4
Role of air changes per hour (ACH) in possible transmission of airborne infections
Farhad Memarzadeh (), Weiran Xu
Department of Health and Human Services, National Institutes of Health, 9000 Rockville Pike, Bethesda, MD 20892, USA
Abstract
The cost of nosocomial infections in the United States is estimated to be $4 billion to $5 billion
annually. Applying a scientifically based analysis to disease transmission and performing a site
specific risk analysis to determine the design of the ventilation system can provide real and long
term cost savings. Using a scientific approach and convincing data, this paper hypothetically
illustrates how a ventilation system design can be optimized to potentially reduce infection risk to
occupants in an isolation room based on a thorough risk assessment without necessarily increasing
ventilation airflow rate. A computational fluid dynamics (CFD) analysis was performed to examine
the transport mechanism, particle path and a suggested control strategy for reducing airborne
infectious disease agents. Most studies on the transmission of infectious disease particles have
concentrated primarily on air changes per hour (ACH) and how ACH provides a dilution factor for
possible infectious agents. Although increasing ventilation airflow rate does dilute concentrations
better when the contaminant source is constant, it does not increase ventilation effectiveness.
Furthermore, an extensive literature review indicates that not every exposure to an infectious
agent will necessarily cause a recipient infection. The results of this study suggest a hypothesis that
in an enclosed and mechanically ventilated room (e.g., an isolation room), the dominant factor
that affects the transmission and control of contaminants is the path between the contaminant
source and exhaust. Contaminants are better controlled when this path is uninterrupted by an air
stream. This study illustrates that the ventilation system design ,i.e., when it conforms with the
hypothesized path principle, may be a more important factor than flow rate (i.e., ACH). A secondary
factor includes the distance from the contaminant source. This study provides evidence and
supports previous studies that moving away from the patient generally reduces the infection risk
in a transient (coughing) situation, although the effect is more pronounced under higher flow rate.
It is noted that future research is needed to determine the exact mode of transmission for most
recently identified organisms.
Keywords
infection transmission and control,
risk assessment,
air change rate (ACH),
computational fluid dynamics (CFD),
patient room,
ventilation system design
Article History
Received: 6 September 2011
Revised: 14 October 2011
Accepted: 3 November 2011
© Tsinghua University Press and
Springer-Verlag Berlin Heidelberg
2011
1 Introduction
The role that airborne transmission plays in nosocomial or
hospital acquired infections (NI/HAI) has been highly debated
for well over 40 years. Although transmission of nosocomial
pathogens from people via an airborne route in the hospital
setting is well established, it is a common misconception
that most hospital acquired infections (HAI) are spread by
aerosol transmission and that the number of air changes per
hour (ACH) used to ventilate the occupied space directly
impacts the transmission. Many studies on the transmission
of infectious disease particles suggest that ventilation is one
of the major methods for reduction and control of the spread
of pathogens via the airborne route in hospitals (Streifel
1999; Kaushal et al. 2004; Beggs et al. 2008). ASHRAE 170
2008 and the CDC guidelines 2005 recommend ventilation
rates of minimum 12 ACH for hospital insulation rooms.
Although increasing ventilation airflow rate does dilute con-
centrations better when the contaminant source is constant,
it does not increase ventilation effectiveness.
Li et al. (2005, 2007) discuss the role that ventilation
systems play in cross infection between people. They conclude
E-mail: [email protected]

16 Memarzadeh and Xu / Building Simulation / Vol. 5, No. 1
that there is a close connection between the ventilation
systems and the infectious transmission in the air. Recently,
engineers have begun to examine the effect that physical
factors such as location of supply and exhaust vents, surfaces,
object placement and composition and thermodynamic
factors such as temperature, humidity and air currents have
on aerosol transmission and particle migration. For health
care facilities, the studies specifically examine infectious
particle transmission. However, these studies rarely take
into account length of exposure time and particle virulence.
Furthermore, an extensive literature review (Memarzadeh
2011a) indicates that not every exposure to an infectious
agent will necessarily cause a recipient infection. Individual
risk factors exist that make one person more vulnerable to
contracting a disease than another. Risk factors for HAIs
are factors that are not a direct cause of the disease, but
appear to be associated in some way with infection. Risk
factors may be inherent in an individual due to genetics,
health status, or gender. Risk factors may also be present in
the local environment. Examples of environmental risk factors
include the age and operational status of the ventilation
equipment, temperature and humidity. Risk factors are also
related to behaviors such as compliance to use of standard
operating procedures (SOP) involving personal protective
equipment (PPE), decontamination or control of isolation
procedures for example. Although the existence of a risk
factor for an HAI increases the chances of contracting an
illness, it does not always lead to a HAI, whereas the absence
of any single risk factor or the existence of a protective
factor, does not necessarily guard against getting a HAI
(Memarzadeh 2011b). Fisk (2000) estimates that changes
in building characteristics and ventilation could reduce
indices of respiratory illness by 15% to 76%. The estimated
productivity gains by reducing respiratory illness, utilizing
1996 data are 16 to 37 million avoided cases of common cold
or influenza, with a potential of $6 to $14 billion in 1996
dollars (Fisk 2000).
There is sufficient evidence to support the truly “airborne”
mode of transmission for tuberculosis (TB) caused by
Mycobacterium tuberculosis and M. africanum, measles
(rubeola virus) and chickenpox (varicella zoster virus) (Wells
et al. 1942; Riley et al. 1978; Langmuir 1980). Noting that
each of these are physiologically dissimilar, never-the-less
they are all vaccine-preventable diseases. There is further
evidence that mumps (Habel 1945) bacterial meningitis
(American College Health Association) and pertussis may
also be transmitted via the airborne route. Couch (1981)
notes that the prevailing concept, although unsupported by
objective evidence, is that other respiratory viruses are
transmitted primarily by direct and indirect droplet contact.
The WHO states that “Human Influenza is transmitted by
inhalation of infectious droplets and droplet nuclei, by direct
contact and perhaps by indirect (fomite) contact … the
relative efficiency of the different routes of transmission
has not been defined” (Beigel et al. 2005). Other pathogens
spread via multiple modes of transmission include smallpox,
Methicillin Resistant Staphylococcus Aureus (MRSA),
Legionnaire’s disease, Pseudomonas aeruginosa, environmental
sources of Aspergillus spp., Serratia marcescens, and some
Clostridium difficile infections. It is a generally accepted
fact that the remainder of HAIs are caused by potentially
infectious particles that are transmitted via direct and indirect
contact with droplet nuclei through a fomite, a surface, or
some other intermediary (Couch 1981) and that these particles
may be affected by local environmental conditions.
At the 1970 International Conference on Nosocomial
Infection held at the Centers for Disease Control (CDC)
in Atlanta, Georgia, Brachman (1971) reviewed modes of
transmission of nosocomial infections and concluded that
although airborne transmission certainly accounted for
some nosocomial infections, the exact impact of the aerosol
mode of transmission was unknown. Based largely on data
available from the National Nosocomial Infections Study
(NNIS), he estimated that airborne transmission accounted
for 10% to 20% of all endemic nosocomial infections or about
a one percent incidence of infection among hospitalized
patients.
Maki et al. (1982) did extensive environmental
microbiological sampling of a new university hospital in
Madison, Wisconsin before and after it was put into use.
The rate of nosocomial infections in the new hospital was no
different from the rate in the old hospital, thus suggesting
that organisms in the inanimate environment contributed
little if at all to endemic nosocomial infections. Schaal (1991)
estimated that the relative incidence of airborne infections
is about 10% of the whole of endemic nosocomial infection.
However, Kowalski (2007) estimated that more than a
third of all nosocomial infections possibly involve airborne
transmission at some point. He stated that “various sources
estimate that between 2 million and 4 million nosocomial
infections occur annually, resulting in 20 000 to 80 000
fatalities.” The increase from 10% to 33% or greater may
be indicative of the identification of new pathogenic
microorganisms such as SARS CoV and other mutated forms
of influenza virus. After many empirical and observational
studies, the jury is still out on the exact mode of transmission
for most of the recently identified diseases.
The evidence clearly shows that no single factor is
responsible for the spread of infectious disease, regardless of
the offending microorganism. A combination of many factors
and variables influence the modes of particle transmission.
These include but are not necessarily limited to:
aerosol and droplet transmission dynamics,
the nature of the dust levels,
17 Memarzadeh and Xu / Building Simulation / Vol. 5, No. 1
the health and condition of individuals naso-pharyngeal
mucosal linings,
population density,
ventilation rate,
air distribution pattern,
humidity and temperature,
number of susceptibles,
length of exposure,
number of infected people producing contaminated
aerosols,
infectious particle settling rate,
lipid or non-lipid viral envelope or microorganism cell
wall,
surrounding organic material,
UV light or antiviral chemical exposure,
vitamin A and D levels,
microorganism resistance to antibiotic or antiviral therapy,
type and degree of invasive procedures,
spatial considerations,
contact with a carrier,
persistence of pathogens within hosts,
immuno-epidemiology,
transmission of resistance and role of host genetic factors.
The mucociliary clearance apparatus also affects infectivity
and is an important defense mechanism for clearing the lung
of foreign particulate matter. Bennett (2002) notes that
secretory cells that line airway passages produce mucus and
afford protection from disease etc. Pollutant exposure and
viral or bacterial infections may cause disruption of muco-
ciliary clearance and likewise affect the natural rheological
properties such as adhesiveness of nasal mucus and/or
slowing of ciliary beating according to Salah et al. (1988)
and Waffaa et al. (2006).
Again, not every exposure to an infectious agent leads to
infection nor is there evidence that virulence of a particular
strain causes the same intensity of illness in all individuals.
Detection alone does not necessarily imply infectivity. For
example, other factors such as host response, receipt of vaccine
against the strain of influenza in circulation, use of respiratory
hygiene practices and avoiding crowded environments by
the individual with acute infection all influence any one
person’s risk of infection following exposure. (Memarzadeh
2011a).
It is important to understand the interaction and the role
that particle size and particle transmission dynamics play in
infectious disease transmission. It is generally accepted in
the current mechanical engineering and medical community
that particles with an aerodynamic diameter of 5 μm or less
are aerosols, whereas particles of 20 μm are large droplets.
There is substantial literature on cough droplet size
distribution (Duguid 1945; Fairchild and Stamper 1987;
Papineni and Rosenthal 1997; Fennelly et al. 2004;
Morawska et al. 2009) and exhaled air temperature (Hoppe
1981). Infectious diseases are transmitted by several
mechanisms. One such mechanism is by direct contact and
fomites, which are inanimate objects that transport infectious
organisms from one individual to another. A second
mechanism is by large droplets generally with a mass median
aerodynamic diameter (MMAD) of >10 micrometers (μm)
and particles with MMAD <10 μm sometimes termed droplet
nuclei. Recent work by Xie and colleagues (2007) indicate
that large droplets are those larger than 5—100 μm at the
original time of release. Nicas and colleagues (2005) show
by modeling that emitted large droplets will evaporate to
50% of their initial value (under varying temperature and
humidity conditions) and that if the initial diameter is
< 20 μm this process will happen instantaneously.
Particle size is a consequence of the process that led to
its generation, and thus it is also dependent on the source.
The content of an infectious agent expelled by an infected
person depends, among other factors, on the location within
the respiratory tract from where the droplets originate.
Pathogenic organisms usually reside in the tonsil and the
larynx and seldom at the front of the mouth. Thus to assess
the potential for infection via airborne droplet route, it is
important to develop an understanding about the localities
from which droplets originate during various expiratory
activities, and the numbers of droplets arising from each site
(Morawska 2006).
The distance droplets travel depends on the velocity
and mechanism by which respiratory droplets are propelled
from the source, the density of respiratory secretions,
environmental factors such as temperature and humidity,
and the ability of the pathogen to maintain infectivity over
that distance. Pathogen-laden droplets are expelled into air
by an infected person by coughing, sneezing, breathing or
talking (Duguid 1945). Zhu et al. (2006) indicated the peak
cough velocity varied from 6 to 22 m/s with an average of
11.2 m/s or about 2000 fpm. Variations in this velocity depend
on gender, individual size and relative health status.
The pathogen-laden droplets dry out and produce droplet
nuclei that may be transmitted over a wide area. Cole and
Cook (1998) and Wells (1955) report that sneezing can
introduce as many as 40 000 droplets which can evaporate to
produce droplets of 0.5 to 12 μm. Fitzgerald and Haas (2005)
report that a cough can generate about 3000 droplet nuclei,
the same number as talking for 5 minutes. Duguid (1945)
notes that a single cough typically produces about 1% of this
amount, but coughs occur about ten times more frequently
than sneezes. Normal breathing actually generates more
bio-aerosols than a cough or sneeze. The particles making up
aerosol in normal exhalation are less than 1 micron in size and
these smallest particles are primary vectors of contagion.
It is equally important to take into account the physical
18 Memarzadeh and Xu / Building Simulation / Vol. 5, No. 1
position of occupants in the room. Studies have shown that
the position of the “coughing” patient and the “staff ” have
a pronounced effect on the “staff ” exposure to potentially
infective particles (Kierat 2010). The evidence from these
studies suggest that the recommendations in the Standard
for 12 h–1 in hospital isolation rooms with mixing ventilation
does not reduce the risk of airborne cross infection due to
coughing. The posture of the coughing infected patient has
great impact on the exposure of medical staff and other
patient (Kierat 2010). Exposure of the doctor is a result of
the interaction of several factors: the airflow pattern in the
space, the distance between the exposed person and the
sick patient, the posture of the doctor etc. (Bolashikov
2010). Kierat (2010) suggests that for a patient coughing
upwards (towards the ceiling exhaust vent) contaminants
were successfully exhausted whereas the total volume (TV)
ventilation did not have as significant impact on the
exposure level as in the studied case when the patient
coughed sideways towards the face of the doctor. Kierat
suggests that a good contaminant control solution in hospital
rooms is to position the TV exhaust as close as possible to
the polluting source: the sick coughing patient in this case.
Similar arrangement has been suggested by others (Cheong
and Phua 2006; Noakes et al. 2009; Tung et al. 2009a, b). The
results of our computational fluid dynamics (CFD) analysis
leads us to the same conclusion.
If the disease-causing microorganisms are inhaled by or
come to rest on or near a susceptible person, infection may
occur. Short-range airborne infection routes between
individuals are less than approximately 1-m apart and long-
range routes are greater than approximately 1-m apart. True
long-range aerosol transmission becomes possible when
the droplets of infectious material are sufficiently small to
remain almost indefinitely airborne and to be transmitted
over long distances. Such is the case for TB, measles and
chickenpox. Larger droplets are influenced more by gravity
than by airflows and fall to the ground more quickly (Wan
and Chao 2007; Chen et al. 2009). There is so much inertial
force in the large particles that they have to be forced to the
recipient whereas, when small particles enter the air, air
creates enough resistance so that they cannot easily reach
the recipient and these particles follow air flow (Couch 1981).
Large droplets released in short range aerosols (e.g., sneezing)
are sometimes confused with airborne droplets, but such
released particles do not typically transmit over long distances.
Respiratory droplets carrying infectious pathogens transmit
infection when they travel directly from the respiratory tract
of the infectious individual to susceptible mucosal surfaces
of the recipient.
The evidence suggests that very few respiratory viruses
are exclusively transmitted via one route. There is no exact
particle size cut-off at which pathogen transmission changes
from exclusively droplet to airborne or vice versa. Preventing
droplet and contact transmission would require very different
control measures. It is important to re-emphasize that
numerous factors influence the transmission of infectious
disease. Not every exposure to an infectious virus leads to
infection nor is there evidence that virulence of a particular
strain causes the same intensity of illness in all individuals.
1.1 Importance of performing a risk analysis
Increasing or decreasing ventilation rate by as little as one
air change per hour can result in a difference of $150–$250
per year in heating and cooling costs. This is a significant
expenditure that is often overlooked but that can be
managed through proper ventilation system design. We are
not suggesting here that the ACH should be indiscriminately
increased or decreased to save money. What we are suggesting
is that “good” versus “poor” design based on an initial and
on-going risk assessment can help determine the optimal
ACH for the proposed use of the space, thereby selecting an
ACH that is both cost effective and efficient.
Other costs associated with infectious disease include
absence from work for health care workers (HCW) and
productivity of any single individual due to illness acquired
as an HAI. Therefore, determining the appropriate ACH
for a facility, whether it is for the whole building or a
specialized section of the building such as an emergency
room, operating room, or isolation unit requires a careful
risk analysis early in the design process or when there is a
change of use. The current evidence strongly suggests that
no single physical, environmental or epidemiologic variable
can be unilaterally altered to make accommodations for
the function of that designated space. A thorough risk
assessment to optimize design options may result in higher
first costs but provide long term savings in a variety of
healthcare facilities.
ASHRAE (2003) defines risk assessment and management
as “a systematic approach to the discovery and treatment of
risks facing an organization or facility.” There are certain
general principles that should be considered for any risk
assessment (ASHRAE 2003):
(1) identifying the risk,
(2) estimating the level of exposure,
(3) estimating the probability of risk occurrence,
(4) determining the value of the loss,
(5) ranking risks,
(6) identifying vulnerabilities.
The risk assessment approach outlined in the Facilities
Guideline Institute’s “Design and Construction of Health
Care Facilities” considers both the susceptibility of the patients
and health care worker versus the degree of environmental
contamination. This infection control risk assessment or
19 Memarzadeh and Xu / Building Simulation / Vol. 5, No. 1
“ICRA” supports communication between clinical and
facility staff and includes both design and remediation
issues to protect patients and staff both long and short term.
Risk assessment design strategies for infection prevention
and control include consideration of the patient population
served, range and complexity of services provided, and
settings in which care is provided. Other variables include
status (e.g., infectious or susceptible), the area under
consideration (e.g., isolation or protective), the type of
filtration, ventilation and pressurization and the operations
and maintenance procedures and management that are in
place. Risk assessment design strategies for environmental
controls include the use of PPE for the HCW, the type of
isolation necessary (e.g., protective or containment) and
the ventilation standards that apply to the type of facility
being assessed. (Kosar 2002)
Involvement of professionals from the medical and
building sciences including architects, engineers, epidemio-
logists, and industrial hygienists and infection preventionists
is required to provide effective indoor air quality (IAQ)
practices in healthcare facilities. Acceptable IAQ can be
achieved by using ventilation in conjunction with air filtration
on recirculated and fresh air, mechanical arrestance media
to clean air of microbial and other particulate matter;
and irradiation in targeted applications, using ultra violet
germicidal irradiation (UVGI) to alter airborne and surface
borne microbes and limit the proliferation of the infectious
agents.
The role that environmental factors, such as air tem-
perature and relative humidity (RH) play in surface survival
is important for risk assessment and the development of
control measures. In an attempt to control environmental
factors in the healthcare environment, we must find a
balance between reducing infectious disease transmissibility
while maintaining occupant comfort.
1.2 Experimental (empirical) and numerical approaches
To study various factors that affect airborne infectious disease
transmission, engineers and researchers have employed
experimental and numerical methods. Carefully conducted
experiments replicate reality in a controlled environment
and provide most reliable information.
Olmedo et al. (2011) performed an empirical study that
examined exhalation flow in order to create a description of
the velocity distribution and the concentration distribution
flow might provoke a high exposure to other persons situated
in the same room. The level of exposure was measured for
different positions and separation distances between the
manikins, and for three ventilation strategies: displacement
ventilation, mixing ventilation and non-mechanical
ventilation in a room with otherwise similar conditions.
A preliminary report that focused on the displacement
ventilation conditions was published (Nielsen et al. 2011).
Continuing this work, Olmedo provided a more thorough
analysis, considering three different ventilation modes in
further details.
However, often times the cost and time required limit
the amount of experimental data. Interferences from
environment and instruments, equipment and human
error can also reduce the accuracy of experimental results.
Numerical analysis, commonly known as computational
fluid dynamics (CFD), on the other hand, is a very cost
effective tool and does not suffer from these interferences.
With the development of computer technology and ever
increasing computing power, a numerical approach has
become increasingly more popular. A numerical approach
is frequently used to confirm or disprove an empirical
approach. Care has to be taken to deal with model building,
mesh creation, turbulence model selection and results analysis
etc. The best approach is to combine the two methods to
some extent. The study presented in this paper mainly
employs a numerical approach to analyze the transmission
and control of airborne contaminants, with references to the
experimental results in similar situations.
2 Methodology
Building ventilation systems help prevent building-associated
illness by providing dilution and removal of unknown
airborne microbial and some viral contaminants. The
movement of airborne contaminants is closely linked to
the movement of air in built environments. When the
contaminant particle size is less than a few microns, it can
be safely considered as a “gas” that obeys transport equations
of continuum (Yin et al. 2009). When solved using CFD
technique, the transport equation of contaminant con-
centration, along with transport equations of mass,
momentum and energy gives detailed information on the
mechanism of air movement and contaminant transmission.
The generalized transport equation can be written as
around the person. The measurements were made in a
room with three different air distribution systems creating
different environments around the person in which the
exhalation flow of a person is considered as the pollutant in
order to investigate the mechanism of spreading respiratory
diseases. Additional studies examined how this exhalation
where u denotes the velocity field, is the variable in
question, is the diffusion coefficient.
20 Memarzadeh and Xu / Building Simulation / Vol. 5, No. 1
when is 1, Eq. (1) represents mass conservation equation,
u, momentum equation, h, energy equation, C, concentration
equation.
As nearly all indoor airflows are turbulent, turbulence
models are also needed to assess the effects of turbulence in
momentum and heat transfer. Historically, there have been
numerous efforts to establish turbulence models for various
applications. This paper uses a model that combines LVEL
(Agonafer et al. 1996) and the popular k-ε model (Launder
and Spalding 1974). Equation (1) remains applicable. This
turbulence model adds two additional partial differential
equations for turbulence kinetic energy k and turbulent energy
dissipation to solve.
Solving the above set of equations numerically requires
changing the form of the equations from differential to
algebraic. This process is called discretization. The most
widely used discretization method is called the “finite volume”
method, which divides the solution domain into many finite
volumes and then solves the discretized equations within
each volume. The general form of a discretized equation can
be written as
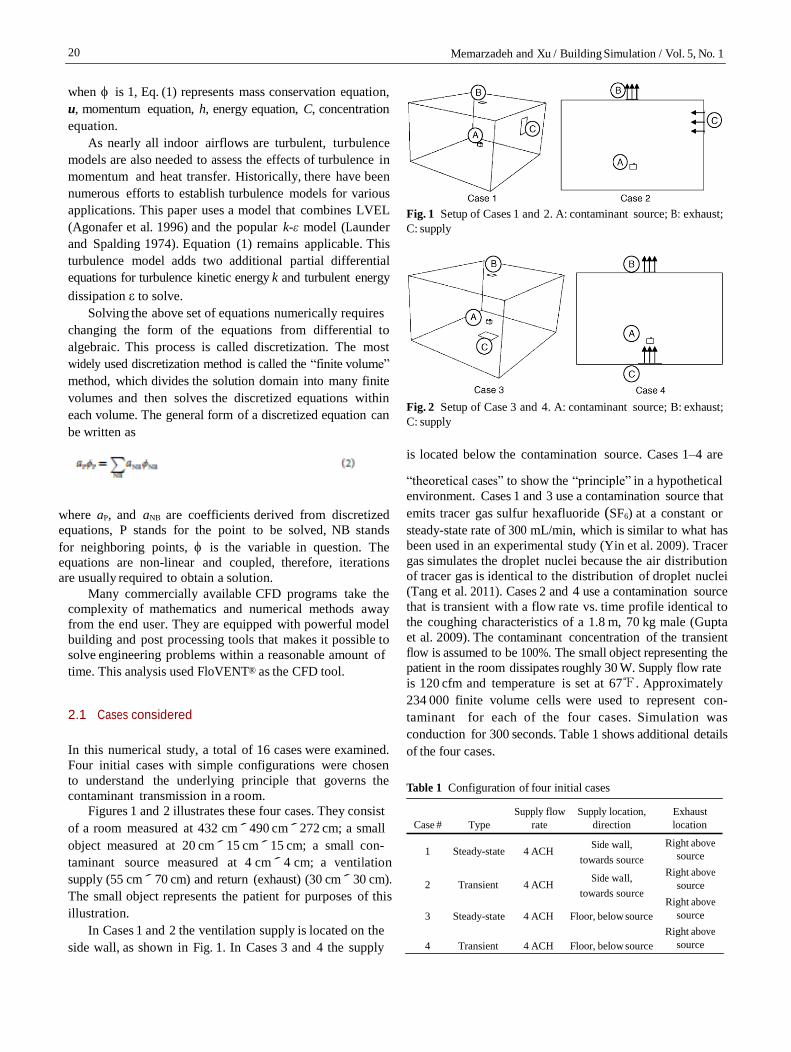
Fig. 1 Setup of Cases 1 and 2. A: contaminant source; B: exhaust;
C: supply
Fig. 2 Setup of Case 3 and 4. A: contaminant source; B: exhaust;
C: supply
is located below the contamination source. Cases 1–4 are
“theoretical cases” to show the “principle” in a hypothetical
environment. Cases 1 and 3 use a contamination source that
where aP, and aNB are coefficients derived from discretized
equations, P stands for the point to be solved, NB stands
for neighboring points, is the variable in question. The
equations are non-linear and coupled, therefore, iterations
are usually required to obtain a solution.
Many commercially available CFD programs take the
complexity of mathematics and numerical methods away
from the end user. They are equipped with powerful model
building and post processing tools that makes it possible to
solve engineering problems within a reasonable amount of
time. This analysis used FloVENT® as the CFD tool.
2.1 Cases considered
In this numerical study, a total of 16 cases were examined.
Four initial cases with simple configurations were chosen
to understand the underlying principle that governs the
contaminant transmission in a room.
emits tracer gas sulfur hexafluoride (SF6) at a constant or
steady-state rate of 300 mL/min, which is similar to what has
been used in an experimental study (Yin et al. 2009). Tracer
gas simulates the droplet nuclei because the air distribution
of tracer gas is identical to the distribution of droplet nuclei
(Tang et al. 2011). Cases 2 and 4 use a contamination source
that is transient with a flow rate vs. time profile identical to
the coughing characteristics of a 1.8 m, 70 kg male (Gupta
et al. 2009). The contaminant concentration of the transient
flow is assumed to be 100%. The small object representing the
patient in the room dissipates roughly 30 W. Supply flow rate
is 120 cfm and temperature is set at 67℉. Approximately
234 000 finite volume cells were used to represent con-
taminant for each of the four cases. Simulation was
conduction for 300 seconds. Table 1 shows additional details
of the four cases.
Table 1 Configuration of four initial cases
Figures 1 and 2 illustrates these four cases. They consist
of a room measured at 432 cm´ 490 cm´ 272 cm; a small
Case # Type
Supply flow
rate
Supply location,
direction
Exhaust
location
object measured at 20 cm´ 15 cm´ 15 cm; a small con-
taminant source measured at 4 cm´ 4 cm; a ventilation
supply (55 cm´ 70 cm) and return (exhaust) (30 cm´ 30 cm).
The small object represents the patient for purposes of this
illustration.
In Cases 1 and 2 the ventilation supply is located on the
side wall, as shown in Fig. 1. In Cases 3 and 4 the supply
1 Steady-state 4 ACH Side wall,
towards source
2 Transient 4 ACH Side wall,
towards source 3 Steady-state 4 ACH Floor, below source
4 Transient 4 ACH Floor, below source
Right above
source
Right above
source
Right above
source
Right above
source
21 Memarzadeh and Xu / Building Simulation / Vol. 5, No. 1
Item Dimension Additional information
Room
Patient
(A)
Exhaust
(B, B' )
Supply
(C)
Caregiver
(D)
Equipment
(E)
Cabinet
(F)
Bathroom
(G)
432 cm ́ 490 cm ́ 272 cm
175 cm tall, consist of various
body parts such as arms and
legs
Main exhaust B: 25 cm ́ 25 cm,
located at ceiling
Bathroom exhaust B': under the
bathroom door
Located on the ceiling, flow rate
and flow direction varies by
case
Same as the patient, standing
position
40 cm ́ 40 cm ́ 110 cm
60 cm ́ 140 cm ́ 272 cm
110 cm´ 165 cm with an angled
door
Adiabatic walls
Dissipates 85 W
Flow rate of B: various accord-
ing to the supply flow rate
Flow rate of B' : fixed at 75 cfm
Supply temperature 67℉
Dissipates 85 W
Dissipates 50 W
75 cfm going through the gap
under the angled door
Using these four cases, we were able to identify the
underlying “path” principle that affects contaminant transport
in rooms.
Twelve additional application cases (Cases 5–16) were
chosen to further validate the principle in a more realistic
patient room setup.
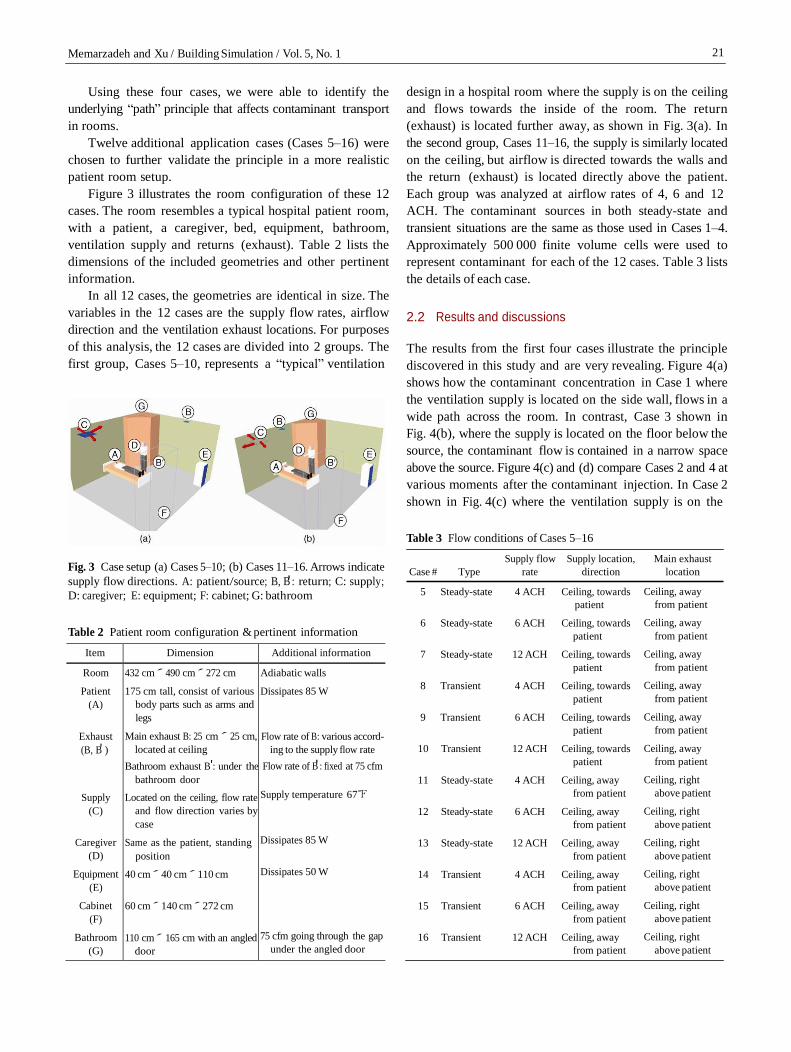
Figure 3 illustrates the room configuration of these 12
cases. The room resembles a typical hospital patient room,
with a patient, a caregiver, bed, equipment, bathroom,
ventilation supply and returns (exhaust). Table 2 lists the
dimensions of the included geometries and other pertinent
information.
In all 12 cases, the geometries are identical in size. The
variables in the 12 cases are the supply flow rates, airflow
direction and the ventilation exhaust locations. For purposes
of this analysis, the 12 cases are divided into 2 groups. The
first group, Cases 5–10, represents a “typical” ventilation
design in a hospital room where the supply is on the ceiling
and flows towards the inside of the room. The return
(exhaust) is located further away, as shown in Fig. 3(a). In
the second group, Cases 11–16, the supply is similarly located
on the ceiling, but airflow is directed towards the walls and
the return (exhaust) is located directly above the patient.
Each group was analyzed at airflow rates of 4, 6 and 12
ACH. The contaminant sources in both steady-state and
transient situations are the same as those used in Cases 1–4.
Approximately 500 000 finite volume cells were used to
represent contaminant for each of the 12 cases. Table 3 lists
the details of each case.
2.2 Results and discussions
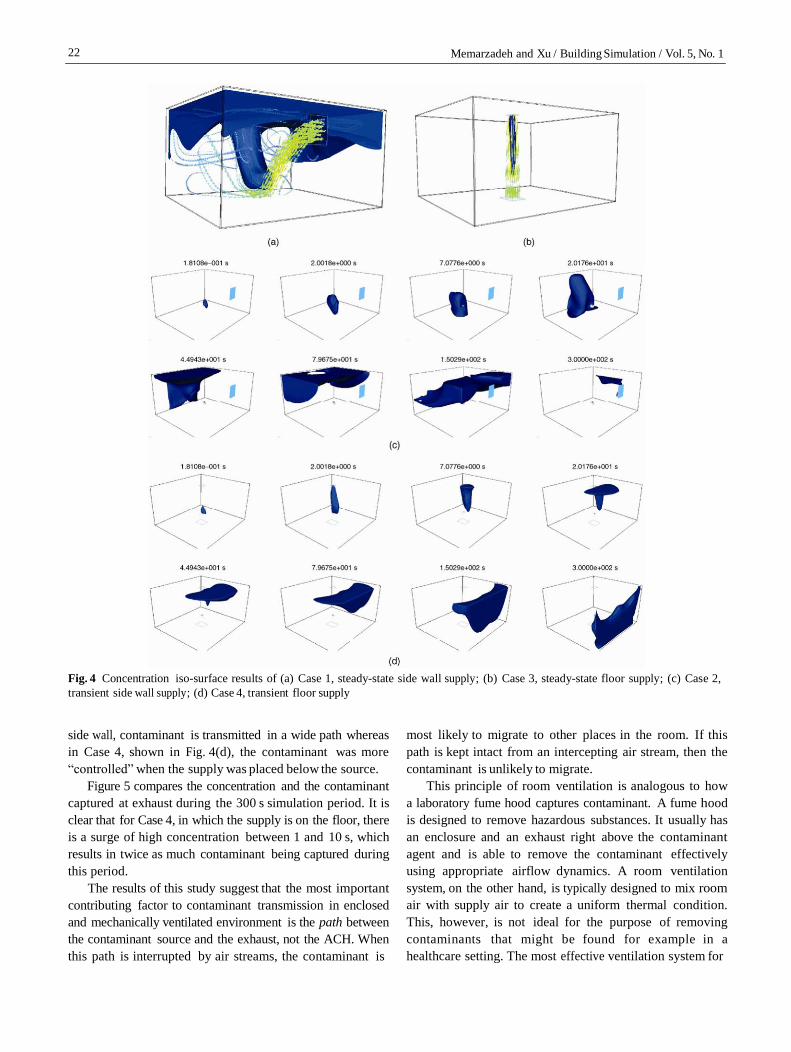
The results from the first four cases illustrate the principle
discovered in this study and are very revealing. Figure 4(a)
shows how the contaminant concentration in Case 1 where
the ventilation supply is located on the side wall, flows in a
wide path across the room. In contrast, Case 3 shown in
Fig. 4(b), where the supply is located on the floor below the
source, the contaminant flow is contained in a narrow space
above the source. Figure 4(c) and (d) compare Cases 2 and 4 at
various moments after the contaminant injection. In Case 2
shown in Fig. 4(c) where the ventilation supply is on the
Table 3 Flow conditions of Cases 5–16
Fig. 3 Case setup (a) Cases 5–10; (b) Cases 11–16. Arrows indicate
supply flow directions. A: patient/source; B, B' : return; C: supply;
Case # Type
Supply flow
rate
Supply location,
direction
Main exhaust
location
D: caregiver; E: equipment; F: cabinet; G: bathroom
Table 2 Patient room configuration & pertinent information
5 Steady-state 4 ACH Ceiling, towards
patient
6 Steady-state 6 ACH Ceiling, towards
patient
7 Steady-state 12 ACH Ceiling, towards
patient
8 Transient 4 ACH Ceiling, towards
patient
9 Transient 6 ACH Ceiling, towards
patient
10 Transient 12 ACH Ceiling, towards
patient
11 Steady-state 4 ACH Ceiling, away
from patient
12 Steady-state 6 ACH Ceiling, away
from patient
13 Steady-state 12 ACH Ceiling, away
from patient
14 Transient 4 ACH Ceiling, away
from patient
15 Transient 6 ACH Ceiling, away
from patient
16 Transient 12 ACH Ceiling, away
from patient
Ceiling, away
from patient
Ceiling, away
from patient
Ceiling, away
from patient
Ceiling, away
from patient
Ceiling, away
from patient
Ceiling, away
from patient
Ceiling, right
above patient
Ceiling, right
above patient
Ceiling, right
above patient
Ceiling, right
above patient
Ceiling, right
above patient
Ceiling, right
above patient
22 Memarzadeh and Xu / Building Simulation / Vol. 5, No. 1
Fig. 4 Concentration iso-surface results of (a) Case 1, steady-state side wall supply; (b) Case 3, steady-state floor supply; (c) Case 2,
transient side wall supply; (d) Case 4, transient floor supply
side wall, contaminant is transmitted in a wide path whereas
in Case 4, shown in Fig. 4(d), the contaminant was more
“controlled” when the supply was placed below the source.
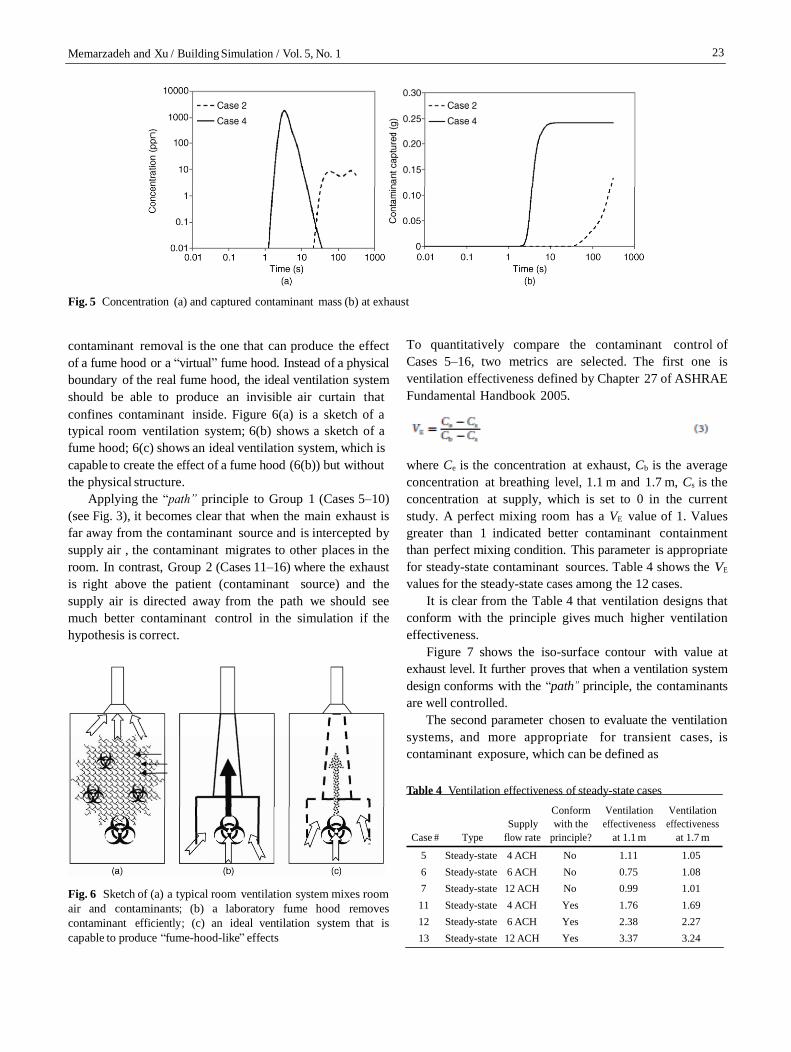
Figure 5 compares the concentration and the contaminant
captured at exhaust during the 300 s simulation period. It is
clear that for Case 4, in which the supply is on the floor, there
is a surge of high concentration between 1 and 10 s, which
results in twice as much contaminant being captured during
this period.
The results of this study suggest that the most important
contributing factor to contaminant transmission in enclosed
and mechanically ventilated environment is the path between
the contaminant source and the exhaust, not the ACH. When
this path is interrupted by air streams, the contaminant is
most likely to migrate to other places in the room. If this
path is kept intact from an intercepting air stream, then the
contaminant is unlikely to migrate.
This principle of room ventilation is analogous to how
a laboratory fume hood captures contaminant. A fume hood
is designed to remove hazardous substances. It usually has
an enclosure and an exhaust right above the contaminant
agent and is able to remove the contaminant effectively
using appropriate airflow dynamics. A room ventilation
system, on the other hand, is typically designed to mix room
air with supply air to create a uniform thermal condition.
This, however, is not ideal for the purpose of removing
contaminants that might be found for example in a
healthcare setting. The most effective ventilation system for
23 Memarzadeh and Xu / Building Simulation / Vol. 5, No. 1
Fig. 5 Concentration (a) and captured contaminant mass (b) at exhaust
contaminant removal is the one that can produce the effect
of a fume hood or a “virtual” fume hood. Instead of a physical
boundary of the real fume hood, the ideal ventilation system
should be able to produce an invisible air curtain that
confines contaminant inside. Figure 6(a) is a sketch of a
To quantitatively compare the contaminant control of
Cases 5–16, two metrics are selected. The first one is
ventilation effectiveness defined by Chapter 27 of ASHRAE
Fundamental Handbook 2005.
typical room ventilation system; 6(b) shows a sketch of a
fume hood; 6(c) shows an ideal ventilation system, which is
capable to create the effect of a fume hood (6(b)) but without
the physical structure.
Applying the “path” principle to Group 1 (Cases 5–10)
(see Fig. 3), it becomes clear that when the main exhaust is
far away from the contaminant source and is intercepted by
supply air , the contaminant migrates to other places in the
room. In contrast, Group 2 (Cases 11–16) where the exhaust
is right above the patient (contaminant source) and the
supply air is directed away from the path we should see
much better contaminant control in the simulation if the
hypothesis is correct.
where Ce is the concentration at exhaust, Cb is the average
concentration at breathing level, 1.1 m and 1.7 m, Cs is the
concentration at supply, which is set to 0 in the current
study. A perfect mixing room has a VE value of 1. Values
greater than 1 indicated better contaminant containment
than perfect mixing condition. This parameter is appropriate
for steady-state contaminant sources. Table 4 shows the VE
values for the steady-state cases among the 12 cases.
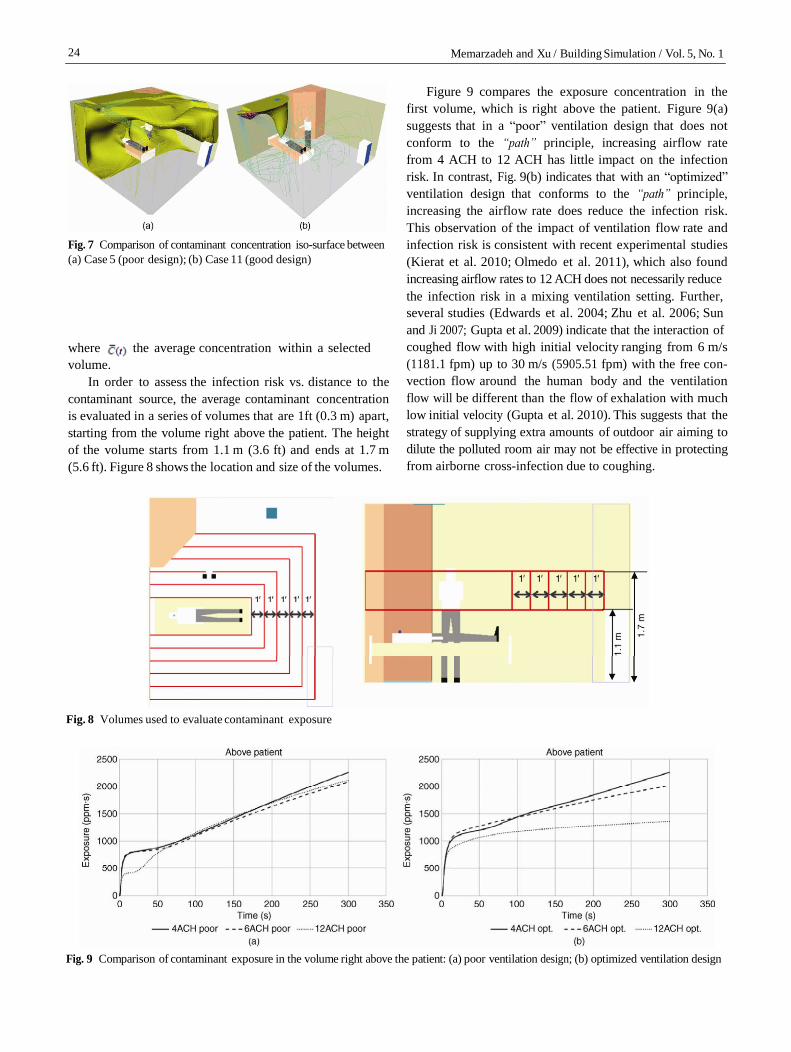
It is clear from the Table 4 that ventilation designs that
conform with the principle gives much higher ventilation
effectiveness.
Figure 7 shows the iso-surface contour with value at
exhaust level. It further proves that when a ventilation system
design conforms with the “path” principle, the contaminants
are well controlled.
The second parameter chosen to evaluate the ventilation
systems, and more appropriate for transient cases, is
contaminant exposure, which can be defined as
Table 4 Ventilation effectiveness of steady-state cases
Case # Type
Supply
flow rate
Conform
with the
principle?
Ventilation
effectiveness
at 1.1 m
Ventilation
effectiveness
at 1.7 m
Fig. 6 Sketch of (a) a typical room ventilation system mixes room
air and contaminants; (b) a laboratory fume hood removes
contaminant efficiently; (c) an ideal ventilation system that is
capable to produce “fume-hood-like” effects
5 Steady-state 4 ACH No 1.11 1.05
6 Steady-state 6 ACH No 0.75 1.08
7 Steady-state 12 ACH No 0.99 1.01
11 Steady-state 4 ACH Yes 1.76 1.69
12 Steady-state 6 ACH Yes 2.38 2.27
13 Steady-state 12 ACH Yes 3.37 3.24
24 Memarzadeh and Xu / Building Simulation / Vol. 5, No. 1
Fig. 7 Comparison of contaminant concentration iso-surface between
(a) Case 5 (poor design); (b) Case 11 (good design)
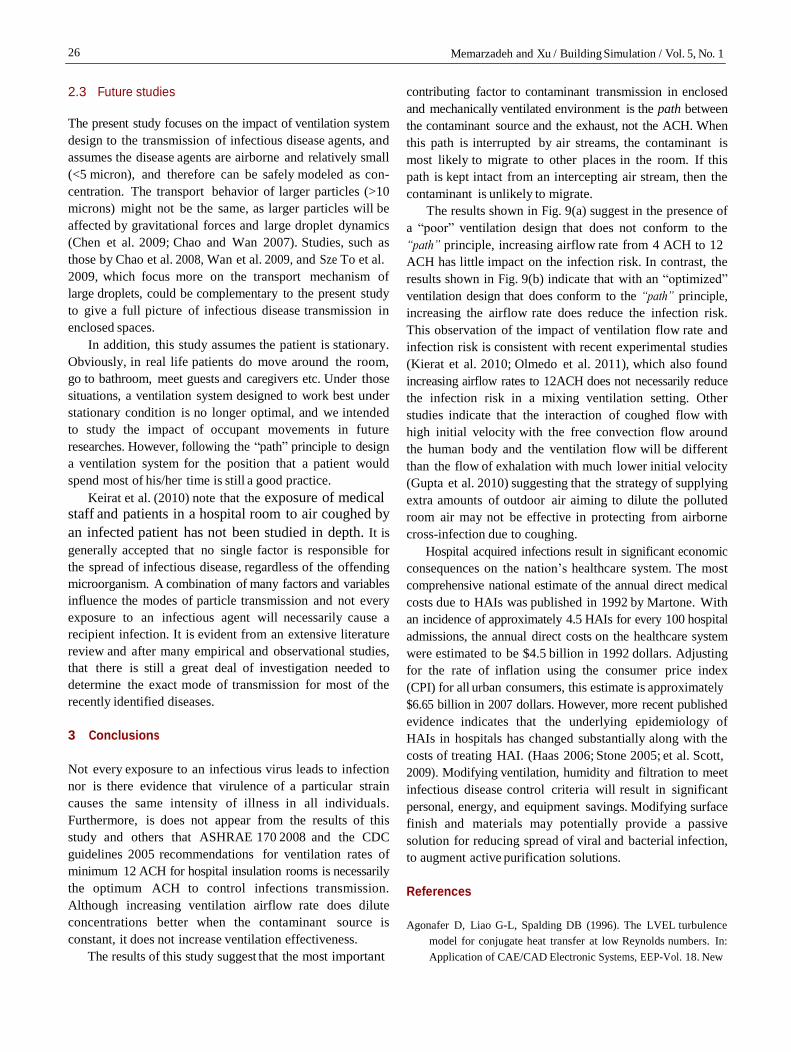
Figure 9 compares the exposure concentration in the
first volume, which is right above the patient. Figure 9(a)
suggests that in a “poor” ventilation design that does not
conform to the “path” principle, increasing airflow rate
from 4 ACH to 12 ACH has little impact on the infection
risk. In contrast, Fig. 9(b) indicates that with an “optimized”
ventilation design that conforms to the “path” principle,
increasing the airflow rate does reduce the infection risk.
This observation of the impact of ventilation flow rate and
infection risk is consistent with recent experimental studies
(Kierat et al. 2010; Olmedo et al. 2011), which also found
increasing airflow rates to 12 ACH does not necessarily reduce
the infection risk in a mixing ventilation setting. Further,
several studies (Edwards et al. 2004; Zhu et al. 2006; Sun
and Ji 2007; Gupta et al. 2009) indicate that the interaction of
where is the average concentration within a selected
volume.
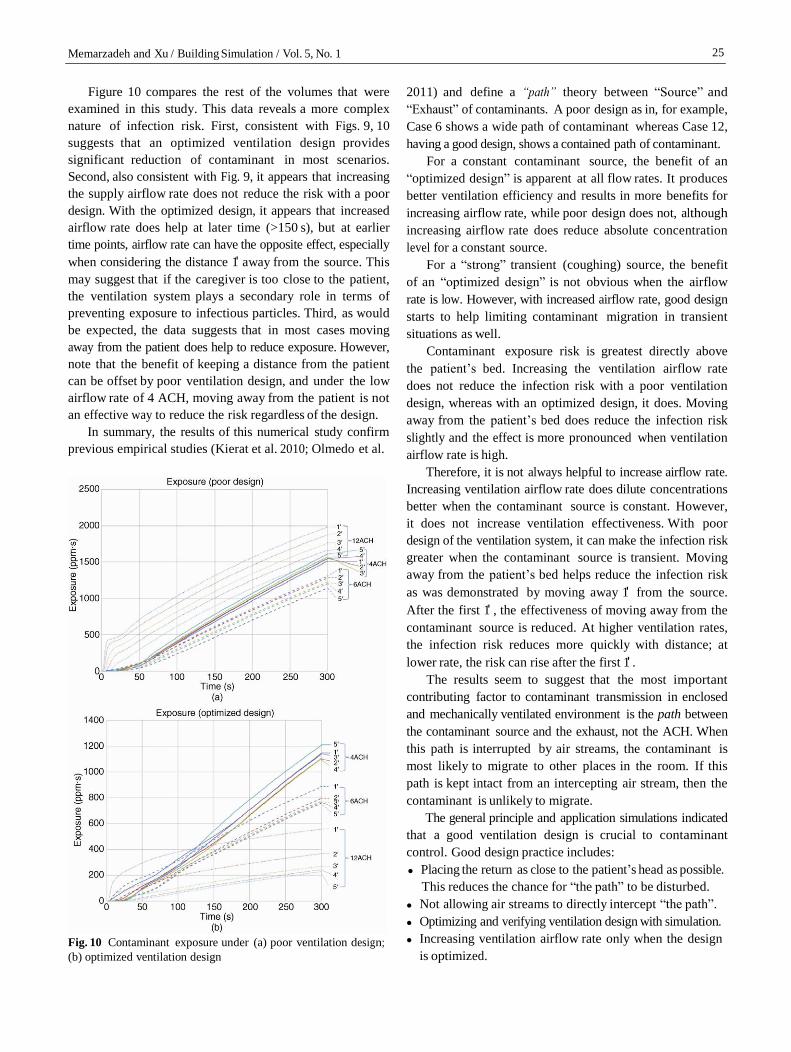
In order to assess the infection risk vs. distance to the
contaminant source, the average contaminant concentration
is evaluated in a series of volumes that are 1ft (0.3 m) apart,
starting from the volume right above the patient. The height
of the volume starts from 1.1 m (3.6 ft) and ends at 1.7 m
(5.6 ft). Figure 8 shows the location and size of the volumes.
coughed flow with high initial velocity ranging from 6 m/s
(1181.1 fpm) up to 30 m/s (5905.51 fpm) with the free con-
vection flow around the human body and the ventilation
flow will be different than the flow of exhalation with much
low initial velocity (Gupta et al. 2010). This suggests that the
strategy of supplying extra amounts of outdoor air aiming to
dilute the polluted room air may not be effective in protecting
from airborne cross-infection due to coughing.
Fig. 8 Volumes used to evaluate contaminant exposure
Fig. 9 Comparison of contaminant exposure in the volume right above the patient: (a) poor ventilation design; (b) optimized ventilation design
25 Memarzadeh and Xu / Building Simulation / Vol. 5, No. 1
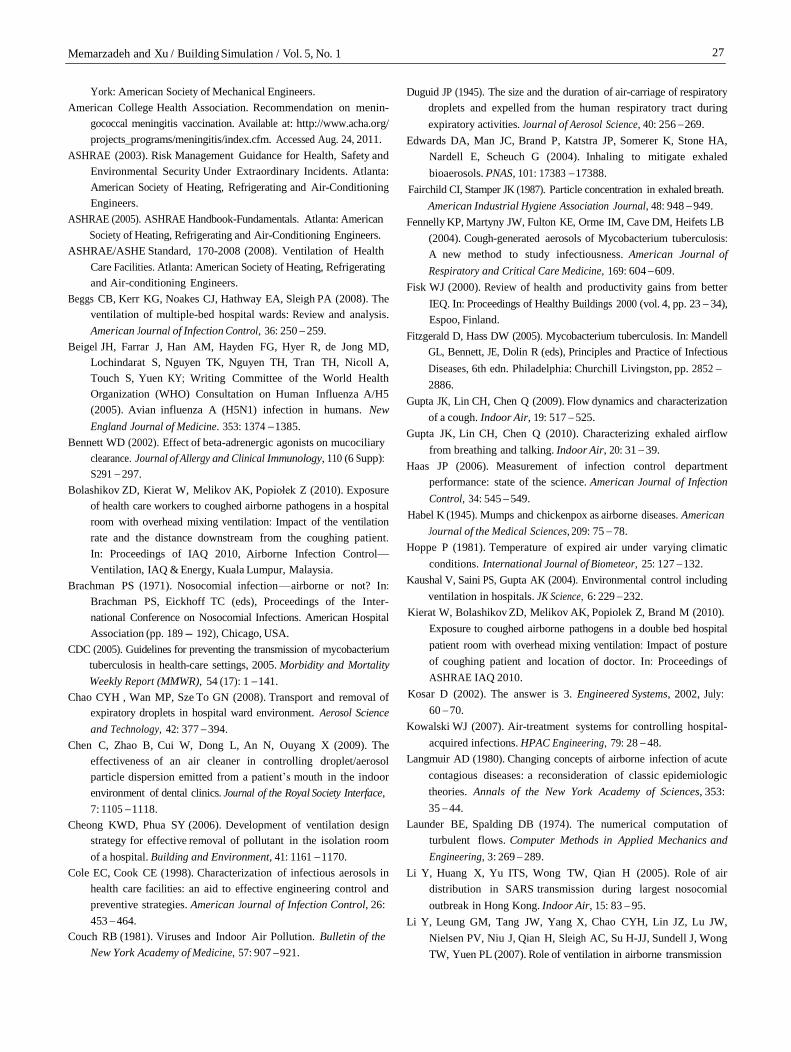
Figure 10 compares the rest of the volumes that were
examined in this study. This data reveals a more complex
nature of infection risk. First, consistent with Figs. 9, 10
suggests that an optimized ventilation design provides
significant reduction of contaminant in most scenarios.
Second, also consistent with Fig. 9, it appears that increasing
the supply airflow rate does not reduce the risk with a poor
design. With the optimized design, it appears that increased
airflow rate does help at later time (>150 s), but at earlier
time points, airflow rate can have the opposite effect, especially
when considering the distance 1' away from the source. This
may suggest that if the caregiver is too close to the patient,
the ventilation system plays a secondary role in terms of
preventing exposure to infectious particles. Third, as would
be expected, the data suggests that in most cases moving
away from the patient does help to reduce exposure. However,
note that the benefit of keeping a distance from the patient
can be offset by poor ventilation design, and under the low
airflow rate of 4 ACH, moving away from the patient is not
an effective way to reduce the risk regardless of the design.
In summary, the results of this numerical study confirm
previous empirical studies (Kierat et al. 2010; Olmedo et al.
Fig. 10 Contaminant exposure under (a) poor ventilation design;
(b) optimized ventilation design
2011) and define a “path” theory between “Source” and
“Exhaust” of contaminants. A poor design as in, for example,
Case 6 shows a wide path of contaminant whereas Case 12,
having a good design, shows a contained path of contaminant.
For a constant contaminant source, the benefit of an
“optimized design” is apparent at all flow rates. It produces
better ventilation efficiency and results in more benefits for
increasing airflow rate, while poor design does not, although
increasing airflow rate does reduce absolute concentration
level for a constant source.
For a “strong” transient (coughing) source, the benefit
of an “optimized design” is not obvious when the airflow
rate is low. However, with increased airflow rate, good design
starts to help limiting contaminant migration in transient
situations as well.
Contaminant exposure risk is greatest directly above
the patient’s bed. Increasing the ventilation airflow rate
does not reduce the infection risk with a poor ventilation
design, whereas with an optimized design, it does. Moving
away from the patient’s bed does reduce the infection risk
slightly and the effect is more pronounced when ventilation
airflow rate is high.
Therefore, it is not always helpful to increase airflow rate.
Increasing ventilation airflow rate does dilute concentrations
better when the contaminant source is constant. However,
it does not increase ventilation effectiveness. With poor
design of the ventilation system, it can make the infection risk
greater when the contaminant source is transient. Moving
away from the patient’s bed helps reduce the infection risk
as was demonstrated by moving away 1' from the source.
After the first 1' , the effectiveness of moving away from the
contaminant source is reduced. At higher ventilation rates,
the infection risk reduces more quickly with distance; at
lower rate, the risk can rise after the first 1' .
The results seem to suggest that the most important
contributing factor to contaminant transmission in enclosed
and mechanically ventilated environment is the path between
the contaminant source and the exhaust, not the ACH. When
this path is interrupted by air streams, the contaminant is
most likely to migrate to other places in the room. If this
path is kept intact from an intercepting air stream, then the
contaminant is unlikely to migrate.
The general principle and application simulations indicated
that a good ventilation design is crucial to contaminant
control. Good design practice includes:
Placing the return as close to the patient’s head as possible.
This reduces the chance for “the path” to be disturbed.
Not allowing air streams to directly intercept “the path”.
Optimizing and verifying ventilation design with simulation.
Increasing ventilation airflow rate only when the design
is optimized.
26 Memarzadeh and Xu / Building Simulation / Vol. 5, No. 1
2.3 Future studies
The present study focuses on the impact of ventilation system
design to the transmission of infectious disease agents, and
assumes the disease agents are airborne and relatively small
(<5 micron), and therefore can be safely modeled as con-
centration. The transport behavior of larger particles (>10
microns) might not be the same, as larger particles will be
affected by gravitational forces and large droplet dynamics
(Chen et al. 2009; Chao and Wan 2007). Studies, such as
those by Chao et al. 2008, Wan et al. 2009, and Sze To et al.
2009, which focus more on the transport mechanism of
large droplets, could be complementary to the present study
to give a full picture of infectious disease transmission in
enclosed spaces.
In addition, this study assumes the patient is stationary.
Obviously, in real life patients do move around the room,
go to bathroom, meet guests and caregivers etc. Under those
situations, a ventilation system designed to work best under
stationary condition is no longer optimal, and we intended
to study the impact of occupant movements in future
researches. However, following the “path” principle to design
a ventilation system for the position that a patient would
spend most of his/her time is still a good practice.
Keirat et al. (2010) note that the exposure of medical staff and patients in a hospital room to air coughed by
an infected patient has not been studied in depth. It is
generally accepted that no single factor is responsible for
the spread of infectious disease, regardless of the offending
microorganism. A combination of many factors and variables
influence the modes of particle transmission and not every
exposure to an infectious agent will necessarily cause a
recipient infection. It is evident from an extensive literature
review and after many empirical and observational studies,
that there is still a great deal of investigation needed to
determine the exact mode of transmission for most of the
recently identified diseases.
3 Conclusions
Not every exposure to an infectious virus leads to infection
nor is there evidence that virulence of a particular strain
causes the same intensity of illness in all individuals.
Furthermore, is does not appear from the results of this
study and others that ASHRAE 170 2008 and the CDC
guidelines 2005 recommendations for ventilation rates of
minimum 12 ACH for hospital insulation rooms is necessarily
the optimum ACH to control infections transmission.
Although increasing ventilation airflow rate does dilute
concentrations better when the contaminant source is
constant, it does not increase ventilation effectiveness.
The results of this study suggest that the most important
contributing factor to contaminant transmission in enclosed
and mechanically ventilated environment is the path between
the contaminant source and the exhaust, not the ACH. When
this path is interrupted by air streams, the contaminant is
most likely to migrate to other places in the room. If this
path is kept intact from an intercepting air stream, then the
contaminant is unlikely to migrate.
The results shown in Fig. 9(a) suggest in the presence of
a “poor” ventilation design that does not conform to the
“path” principle, increasing airflow rate from 4 ACH to 12
ACH has little impact on the infection risk. In contrast, the
results shown in Fig. 9(b) indicate that with an “optimized”
ventilation design that does conform to the “path” principle,
increasing the airflow rate does reduce the infection risk.
This observation of the impact of ventilation flow rate and
infection risk is consistent with recent experimental studies
(Kierat et al. 2010; Olmedo et al. 2011), which also found
increasing airflow rates to 12ACH does not necessarily reduce
the infection risk in a mixing ventilation setting. Other
studies indicate that the interaction of coughed flow with
high initial velocity with the free convection flow around
the human body and the ventilation flow will be different
than the flow of exhalation with much lower initial velocity
(Gupta et al. 2010) suggesting that the strategy of supplying
extra amounts of outdoor air aiming to dilute the polluted
room air may not be effective in protecting from airborne
cross-infection due to coughing.
Hospital acquired infections result in significant economic
consequences on the nation’s healthcare system. The most
comprehensive national estimate of the annual direct medical
costs due to HAIs was published in 1992 by Martone. With
an incidence of approximately 4.5 HAIs for every 100 hospital
admissions, the annual direct costs on the healthcare system
were estimated to be $4.5 billion in 1992 dollars. Adjusting
for the rate of inflation using the consumer price index
(CPI) for all urban consumers, this estimate is approximately
$6.65 billion in 2007 dollars. However, more recent published
evidence indicates that the underlying epidemiology of
HAIs in hospitals has changed substantially along with the
costs of treating HAI. (Haas 2006; Stone 2005; et al. Scott,
2009). Modifying ventilation, humidity and filtration to meet
infectious disease control criteria will result in significant
personal, energy, and equipment savings. Modifying surface
finish and materials may potentially provide a passive
solution for reducing spread of viral and bacterial infection,
to augment active purification solutions.
References
Agonafer D, Liao G-L, Spalding DB (1996). The LVEL turbulence
model for conjugate heat transfer at low Reynolds numbers. In:
Application of CAE/CAD Electronic Systems, EEP-Vol. 18. New
27 Memarzadeh and Xu / Building Simulation / Vol. 5, No. 1
York: American Society of Mechanical Engineers.
American College Health Association. Recommendation on menin-
gococcal meningitis vaccination. Available at: http://www.acha.org/
projects_programs/meningitis/index.cfm. Accessed Aug. 24, 2011.
ASHRAE (2003). Risk Management Guidance for Health, Safety and
Environmental Security Under Extraordinary Incidents. Atlanta:
American Society of Heating, Refrigerating and Air-Conditioning
Engineers.
ASHRAE (2005). ASHRAE Handbook-Fundamentals. Atlanta: American
Society of Heating, Refrigerating and Air-Conditioning Engineers.
ASHRAE/ASHE Standard, 170-2008 (2008). Ventilation of Health
Care Facilities. Atlanta: American Society of Heating, Refrigerating
and Air-conditioning Engineers.
Beggs CB, Kerr KG, Noakes CJ, Hathway EA, Sleigh PA (2008). The
ventilation of multiple-bed hospital wards: Review and analysis.
American Journal of Infection Control, 36: 250 259.
Beigel JH, Farrar J, Han AM, Hayden FG, Hyer R, de Jong MD,
Lochindarat S, Nguyen TK, Nguyen TH, Tran TH, Nicoll A,
Touch S, Yuen KY; Writing Committee of the World Health
Organization (WHO) Consultation on Human Influenza A/H5
(2005). Avian influenza A (H5N1) infection in humans. New
England Journal of Medicine. 353: 1374 1385.
Bennett WD (2002). Effect of beta-adrenergic agonists on mucociliary
clearance. Journal of Allergy and Clinical Immunology, 110 (6 Supp):
S291 297.
Bolashikov ZD, Kierat W, Melikov AK, Popiołek Z (2010). Exposure
of health care workers to coughed airborne pathogens in a hospital
room with overhead mixing ventilation: Impact of the ventilation
rate and the distance downstream from the coughing patient.
In: Proceedings of IAQ 2010, Airborne Infection Control—
Ventilation, IAQ & Energy, Kuala Lumpur, Malaysia.
Brachman PS (1971). Nosocomial infection —airborne or not? In:
Brachman PS, Eickhoff TC (eds), Proceedings of the Inter-
national Conference on Nosocomial Infections. American Hospital
Association (pp. 189 - 192), Chicago, USA.
CDC (2005). Guidelines for preventing the transmission of mycobacterium
tuberculosis in health-care settings, 2005. Morbidity and Mortality
Weekly Report (MMWR), 54 (17): 1 141.
Chao CYH , Wan MP, Sze To GN (2008). Transport and removal of
expiratory droplets in hospital ward environment. Aerosol Science
and Technology, 42: 377 394.
Chen C, Zhao B, Cui W, Dong L, An N, Ouyang X (2009). The
effectiveness of an air cleaner in controlling droplet/aerosol
particle dispersion emitted from a patient’s mouth in the indoor
environment of dental clinics. Journal of the Royal Society Interface,
7: 1105 1118.
Cheong KWD, Phua SY (2006). Development of ventilation design
strategy for effective removal of pollutant in the isolation room
of a hospital. Building and Environment, 41: 1161 1170.
Cole EC, Cook CE (1998). Characterization of infectious aerosols in
health care facilities: an aid to effective engineering control and
preventive strategies. American Journal of Infection Control, 26:
453 464.
Couch RB (1981). Viruses and Indoor Air Pollution. Bulletin of the
New York Academy of Medicine, 57: 907 921.
Duguid JP (1945). The size and the duration of air-carriage of respiratory
droplets and expelled from the human respiratory tract during
expiratory activities. Journal of Aerosol Science, 40: 256 269.
Edwards DA, Man JC, Brand P, Katstra JP, Somerer K, Stone HA,
Nardell E, Scheuch G (2004). Inhaling to mitigate exhaled
bioaerosols. PNAS, 101: 17383 17388.
Fairchild CI, Stamper JK (1987). Particle concentration in exhaled breath.
American Industrial Hygiene Association Journal, 48: 948 949.
Fennelly KP, Martyny JW, Fulton KE, Orme IM, Cave DM, Heifets LB
(2004). Cough-generated aerosols of Mycobacterium tuberculosis:
A new method to study infectiousness. American Journal of
Respiratory and Critical Care Medicine, 169: 604 609.
Fisk WJ (2000). Review of health and productivity gains from better
IEQ. In: Proceedings of Healthy Buildings 2000 (vol. 4, pp. 23 34),
Espoo, Finland.
Fitzgerald D, Hass DW (2005). Mycobacterium tuberculosis. In: Mandell
GL, Bennett, JE, Dolin R (eds), Principles and Practice of Infectious
Diseases, 6th edn. Philadelphia: Churchill Livingston, pp. 2852
2886.
Gupta JK, Lin CH, Chen Q (2009). Flow dynamics and characterization
of a cough. Indoor Air, 19: 517 525.
Gupta JK, Lin CH, Chen Q (2010). Characterizing exhaled airflow
from breathing and talking. Indoor Air, 20: 31 39.
Haas JP (2006). Measurement of infection control department
performance: state of the science. American Journal of Infection
Control, 34: 545 549.
Habel K (1945). Mumps and chickenpox as airborne diseases. American
Journal of the Medical Sciences, 209: 75 78.
Hoppe P (1981). Temperature of expired air under varying climatic
conditions. International Journal of Biometeor, 25: 127 132.
Kaushal V, Saini PS, Gupta AK (2004). Environmental control including
ventilation in hospitals. JK Science, 6: 229 232.
Kierat W, Bolashikov ZD, Melikov AK, Popiolek Z, Brand M (2010).
Exposure to coughed airborne pathogens in a double bed hospital
patient room with overhead mixing ventilation: Impact of posture
of coughing patient and location of doctor. In: Proceedings of
ASHRAE IAQ 2010.
Kosar D (2002). The answer is 3. Engineered Systems, 2002, July:
60 70.
Kowalski WJ (2007). Air-treatment systems for controlling hospital-
acquired infections. HPAC Engineering, 79: 28 48.
Langmuir AD (1980). Changing concepts of airborne infection of acute
contagious diseases: a reconsideration of classic epidemiologic
theories. Annals of the New York Academy of Sciences, 353:
35 44.
Launder BE, Spalding DB (1974). The numerical computation of
turbulent flows. Computer Methods in Applied Mechanics and
Engineering, 3: 269 289.
Li Y, Huang X, Yu ITS, Wong TW, Qian H (2005). Role of air
distribution in SARS transmission during largest nosocomial
outbreak in Hong Kong. Indoor Air, 15: 83 95.
Li Y, Leung GM, Tang JW, Yang X, Chao CYH, Lin JZ, Lu JW,
Nielsen PV, Niu J, Qian H, Sleigh AC, Su H-JJ, Sundell J, Wong
TW, Yuen PL (2007). Role of ventilation in airborne transmission
28 Memarzadeh and Xu / Building Simulation / Vol. 5, No. 1
of infectious agents in the built environment—a multidisciplinary
systematic review. Indoor Air, 17: 2 18.
Maki DG, Alvarado CJ, Hassemer CA, Zilz MA(1982). Relation of the
inanimate hospital environment to endemic nosocomial infection.
New England Journal of Medicine, 307: 1562 1566.
Memarzadeh F (2011a). Literature review of the effect of temperature
and humidity on viruses that cause epidemics & pandemics.
ASHRAE Transactions, 117(2): 24 37.
Memarzadeh F (2011b). The Environment of Care and Health Care-
Associated Infections: An Engineering Perspective. Chicago:
American Society of Health Care Engineers.
Morawska L (2006). Droplet fate in indoor environments, or can we
prevent the spread of infection? Indoor Air, 16: 335 347.
Morawska L, Johnson GR, Ristovski ZD, Hargreaves M, Mengersen
K, Corbett S, Chao, CYH, Li Y, Katoshevski D (2009). Size
distribution and sites of origin of droplets expelled from the
human respiratory tract during expiratory activities. Journal of
Aerosol Medicine, 40: 256 269.
Nicas M, Nazaroff WW, Hubbard A ( 2005). Toward understanding
the risk of secondary airborne infection: emission of respirable
pathogens. Journal of Occupational and Environmental Hygiene,
2: 143 154.
Nielsen PV, Olmedo I, Ruiz de Adana M, Grzelecki P, Jensen RL (2011).
Airborne cross infection between two people in a displacement
ventilated room. HVAC & R Research. (in presss)
Noakes CJ, Fletcher LA, Sleigh PA, Booth WB, Beato-Arribas B,
Tomlinson N (2009). Comparison of tracer techniques for
evaluating the behaviour of bioaerosols in hospital isolation rooms.
In: Proceedings of Healthy Buildings 2009, Syracuse, USA.
Olmedo I, Nielsen PV, de Adana MR, Jensen RL, Grzelecki P (2011).
Distribution of exhaled contaminants and personal exposure in a
room using three different air distribution strategies. Indoor Air,
doi: 10.1111/j.1600-0668.2011.00736.x
Papineni RS, Rosenthal FS (1997). The size distribution of droplets in
the exhaled breath of healthy human subjects. Journal of Aerosol
Medicine, 10: 105 116.
Riley EC, Murphy G, Riley RL (1978). Airborne spread of measles in a
suburban elementary school. American Journal of Epidemiology,
107: 421 32.
Salah B, Dinh Xuan AT, Fouilladieu JL, Lockhart A, Regnard J (1998).
Nasal mucociliary transport in healthy subjects is slower when
breathing dry air. European Respiratory Journal, 1: 852 855.
Schaal KP (1991). Medical and microbiological problems arising from
airborne infection in hospitals. Journal of Hospital Infection, 18
(Suppl. A): 451 459.
Scott RD (2009).The direct medical costs of healthcare-associated
infections in U.S. hospitals and the benefits of prevention. Report:
Centers for Disease Control and Prevention.
Stone PW, Braccia D, Larson E (2005). Systematic review of economic
analyses of health care-associated infections. American Journal of
Infection Control, 33: 501 509.
Streifel A (1999). Hospital Epidemiology and Infection Control, 2nd
Edn, Chapter 80. Philadelphia: Lippincott Williams & Wilkins.
Sun W, Ji J ( 2007). Transport of Droplets Expelled by Coughing in
Ventilated Rooms. Indoor and Built Environment, 16: 493 - 504.
Sze To GN, Wan MP, Chao CYH, Wei F, Yu SCT, Kwan JKC (2008).
A methodology for estimating airborne virus exposures in indoor
environments using the spatial distribution of expiratory aerosols
and virus viability characteristics. Indoor Air, 18: 425 438.
Tang JW, Noakes CJ, Nielsen PV, Eames I, Nicolle A, Li Y, Settles GS
(2011). Observing and quantifying airflows in the infection control
of aerosol- and airborne-transmitted diseases: an overview of
approaches. Journal of Hospital Infection, 77: 213 222.
Tung YC, Shih YC, Hu SC (2009a). Numerical study on the dispersion
of airborne contaminants from an isolation room in the case of
door opening. Applied Thermal Engineering, 29: 1544 1551.
Tung YC, Hu SC, Tsai TI, Chang IL (2009b). An experimental study on
ventilation efficiency of Isolation room. Building and Environment,
44: 271 279.
Waffaa NS, Iman A, Pachachi AI, Almashhadanii WM (2006). The
effect of montelukast on nasal mucociliary clearance. The Journal
of Clinical Pharmacology, 46: 588 590
Wan MP, Chao CYH (2007). Transport characteristics of expiratory
droplet nuclei in indoor environments with different ventilation
airflow patterns. Journal of Biomechanical Engineering, 129:
341 353.
Wan MP, Sze To GN, Chao CYH, Fang L, Melikov A (2009). Modeling
the fate of expiratory aerosols and the associated infection risk in
an aircraft cabin environment. Aerosol Science and Technology,
43: 322 343.
Wells WF, Wells MW, Wilder TS (1942). The environmental control
of epidemic contagion. I. An epidemiologic study of radiant
disinfection of air in day schools. American Journal of Hygiene,
35: 97 121.
Wells WF (1955). Airborne Contagion and Air Hygiene: An Ecological
Study of Droplet Infections. Cambridge, USA: Harvard University
Press.
Xie X, Li Y, Chwang ATY, Ho PL, Seto H (2007). How far droplets can
move in indoor environments—revisiting the Wells evaporation-
falling curve. Indoor Air, 17: 211 225.
Yin Y, Xu W, Gupta JK, Guity A, Marmion P, Manning A, Gulick RW,
Zhang X, Chen Q (2009). Experimental study on displacement
and mixing ventilation systems for a patient ward. HVAC&R
Research, 15: 1175 1191.
Zhu S, Kato S, Yang JH (2006). Investigation into airborne transport
characteristics of airflow due to coughing in a stagnant room
environment. ASHRAE Transactions, 112(1): 123 133.