Role Effectiveness of Audit Committees' Governance Characteristics ...
243
Role Effectiveness of Audit Committees’ Governance Characteristics: Impacts on Internal and External Auditing of Listed Companies A thesis submitted in fulfilment of the requirements for the degree of Doctor of Philosophy Shir Li Ng BBus (Hons) RMIT BCom Melb School of Accounting College of Business RMIT University March 2013
Transcript of Role Effectiveness of Audit Committees' Governance Characteristics ...

Role Effectiveness of Audit Committees’
Governance Characteristics: Impacts on Internal
and External Auditing of Listed Companies
A thesis submitted
in fulfilment of the requirements for the
degree of Doctor of Philosophy
Shir Li Ng
BBus (Hons) RMIT
BCom Melb
School of Accounting
College of Business
RMIT University
March 2013

ii
ACKNOWLEDGEMENTS
I have benefited significantly from the expertise, guidance, interest and encouragement
received from a number of people during the conduct of this thesis. Indeed, it would not have
been possible without them.
First of all, I would like to express my deepest appreciation to my senior supervisor,
Professor Dennis Taylor, for his patience, time, guidance and academic advice he has
provided throughout my whole candidature. His positive outlook and confidence in my study
encouraged me greatly to complete this thesis. And I would like to thank my fellow PhD
students and the staff of the School of Accounting at RMIT University for all their support
and hospitality.
Also, I am extremely grateful to the Institute of Internal Auditors Australia (IIA) who
provided valuable comments and assisted with the pilot testing of the questionnaire. And, of
course, to the IIA members and the Chief Internal Auditors who completed the questionnaire
despite their busy time schedules.
Above all, I would like to acknowledge the tremendous sacrifices that my loving parents
made to ensure that I have an excellent education. I dedicate this thesis to them. Without their
love, encouragement and devotion, it would not be possible to complete my PhD candidature.
Finally, and by no means least, I would like to give special thanks to my partner for his
endless love and encouragement throughout this entire journey. Without him, I would have
struggled to find the inspiration and motivation.

iii
TABLE OF CONTENTS
ACKNOWLEDGEMENTS ........................................................................................... ii
TABLE OF CONTENTS ............................................................................................... iii
LIST OF TABLES .......................................................................................................... ix
LIST OF FIGURES ....................................................................................................... xi
LIST OF ACRONYMS ................................................................................................. xii
ABSTRACT ............................................................................................................. xiii
DECLARATION .......................................................................................................... xvi
CHAPTER 1. INTRODUCTION ................................................................................ 1
1.1 Background to the Study and Research Issues .................................................... 1
1.2 Overview of AC Regulations in Australia ........................................................... 2
1.3 Roles and Responsibilities of ACs in Australia ................................................... 4
1.4 Composition of ACs in Australia ......................................................................... 6
1.5 Objectives of the Study ........................................................................................ 7
1.6 Motivation and Significance of the Study ........................................................... 8
1.7 Organisation of the Study .................................................................................... 9
CHAPTER 2. LITERATURE REVIEW .................................................................. 11
2.1 Introduction ....................................................................................................... 11
2.2 AC Effectiveness ............................................................................................... 11
2.3 Characteristics that Reflect AC Effectiveness ................................................... 13
2.3.1 Independence of AC Chair ............................................................................ 13
2.3.2 Financial and Industry Expertise of AC Members ...................................... 14
2.3.3 Frequency of Meetings of AC ..................................................................... 15
2.3.4 Size of AC ................................................................................................... 15
2.3.5 Formal Charter of AC ................................................................................. 16
2.4 AC Overseeing the Quality of the Internal Audit Function ............................... 17
2.4.1 Introduction ................................................................................................. 17
2.4.2 Extant Studies ............................................................................................. 18

iv
2.4.3 Comparative Assessment ............................................................................ 19
2.4.4 Tabulated Annotations ................................................................................ 20
2.5 AC Ensuring the Independence of the Internal Audit Function ........................ 29
2.5.1 Introduction ................................................................................................. 29
2.5.2 Extant Studies ............................................................................................. 29
2.5.3 Comparative Assessment ............................................................................ 31
2.5.4 Tabulated Annotations ................................................................................ 32
2.6 AC Facilitating the Quality of the External Audit ............................................. 39
2.6.1 Introduction ................................................................................................. 39
2.6.2 Extant Studies ............................................................................................. 40
2.6.3 Comparative Assessment ............................................................................ 42
2.6.4 Tabulated Annotations ................................................................................ 43
2.7 AC Ensuring the Independence of the External Auditors .................................. 55
2.7.1 Introduction ................................................................................................. 55
2.7.2 Extant Studies ............................................................................................. 55
2.7.3 Comparative Assessment ............................................................................ 57
2.7.4 Tabulated Annotations ................................................................................ 59
2.8 Governance-related Agency Costs and their
Value Relevance to Shareholders ...................................................................... 69
2.8.1 Introduction ................................................................................................. 69
2.8.2 Extant Studies ............................................................................................. 69
2.8.3 Comparative Assessment ............................................................................ 70
2.8.4 Tabulated Annotations ................................................................................ 71
CHAPTER 3. THEORITICAL FOUNDATION AND HYPOTHESES
DEVELOPMENT ......................................................................................................... 76
3.1 Introduction........................................................................................................ 76
3.2 Theoretical Foundation ...................................................................................... 76
3.2.1 Agency Theory and AC ................................................................................ 76
3.3 Hypotheses Development .................................................................................. 80
3.3.1 AC Overseeing the Quality of the Internal Audit Function .......................... 80
3.3.2 AC Ensuring the Independence of the Internal Audit Function .................... 82
3.3.3 AC Facilitating the Quality of the External Audit ........................................ 83

v
3.3.4 AC Ensuring the Independence of the External Auditors ............................. 85
3.3.5 Audit-related Agency Monitoring Costs and Total Shareholders Return ..... 86
CHAPTER 4. RESEARCH METHODS .................................................................. 88
4.1 Introduction ....................................................................................................... 88
4.2 Selection of Sample of Companies .................................................................... 88
4.3 Selection of Financial Year ................................................................................ 89
4.4 Questionnaire Data Collection Stage ................................................................. 89
4.4.1 Selection of Respondents ........................................................................... 90
4.4.2 Research Instrument.................................................................................... 90
4.4.3 Questionnaire Design .................................................................................. 91
4.4.4 Questionnaire Cover Letter ......................................................................... 91
4.4.5 Questionnaire Contents ............................................................................... 92
4.4.5.1 Section One: Background .................................................................... 92
4.4.5.2 Section Two: Internal Audit Function Activities ................................. 93
4.4.5.3 Section Three: AC and the Internal Audit Function ............................ 93
4.4.5.4 Section Four: Internal Audit Function Independence .......................... 94
4.4.6 Ethical Issues .............................................................................................. 94
4.4.7 Administration of the Questionnaire ........................................................... 95
4.4.8 Sample Response Rate ................................................................................ 96
4.5 Secondary Data Collection Stage ...................................................................... 97
4.5.1 Secondary Data Sources ............................................................................. 97
4.5.2 Variable Definitions and Measurements ..................................................... 98
4.5.2.1 Independent Variables ........................................................................ 98
4.5.2.2 Dedependent Variables ..................................................................... 105
4.5.2.3 Control Variables .............................................................................. 108
4.6 Model Specification ......................................................................................... 113
4.6.1 Introduction ............................................................................................... 113
4.6.2 AC Overseeing the Quality of the Internal Audit Function ...................... 113
4.6.3 AC Ensuring the Independence of the Internal Audit Function ................ 114
4.6.4 AC Facilitating the Quality of the External Audit .................................... 115
4.6.5 AC Ensuring the Independence of the External Auditors ......................... 115
4.6.6 Audit-related Agency Monitoring Costs and Total Shareholders Return . 116

vi
4.7 Conceptual Model............................................................................................ 116
CHAPTER 5. DATA ANALYSIS AND DISCUSSION .......................................... 117
5.1 Introduction ..................................................................................................... 117
5.2 Sample 1 (Questionnaire-data Based Sample): Profile, Description and
Validation of Variables ..................................................................................... 118
5.2.1 Profile of the Questionnaire Respondents and their Companies .............. 118
5.2.2 Profile of ACs ........................................................................................... 120
5.2.3 Descriptive Statistics for Variables in Model 1 and Model 2 ................... 123
5.2.4 Validity and Reliability Tests on Variables in Model 3 and Model 4 ....... 127
5.2.5 Descriptive Statistics for Variables in Model 3 and Model 4 ................... 130
5.2.6 Descriptive Statistics for Variables in Model 7 ......................................... 132
5.3 Sample 2 (Secondary-data Based Sample): Profile, Description and
Validation of Variables ..................................................................................... 133
5.3.1 Industry Distribution ................................................................................. 133
5.3.2 Descriptive Statistics for Variables in Model 5 and Model 6 ................... 134
5.4 Hypotheses Testing .......................................................................................... 136
5.4.1 Normality of the Variables ........................................................................ 136
5.4.2 Test for Small Sample Size of Sample 1 ................................................... 136
5.4.3 Choice of Stepwise Regression for Sample .............................................. 137
5.4.4 Model 1 and Model 2: Tests of Hypothesis One (a) and One (b) ............. 138
5.4.4.1 Correlation Analysis ......................................................................... 138
5.4.4.2 Regression Analysis .......................................................................... 140
5.4.4.3 Discussion on Findings on Model 1 and Model 2 ............................ 142
5.4.5 Model 3 and Model 4: Tests of Hypothesis Two (a) and Two (b) ............ 145
5.4.5.1 Correlation Analysis .......................................................................... 145
5.4.5.2 Regression Analysis .......................................................................... 147
5.4.5.3 Discussion on Findings on Model 3 and Model 4 ............................ 147
5.4.6 Model 4 and Model 5: Tests of Hypothesis Three and Hypothesis Four .. 148
5.4.6.1 Correlation Analysis .......................................................................... 148
5.4.6.2 Comparisons of Means ...................................................................... 150
5.4.6.3 Regression Analysis .......................................................................... 153

vii
5.4.6.3.1 Results for Model 5
(The Effects of Control Variables on Audit Fees) ........................ 153
5.4.6.3.2 Results for Model 5
(The Effects of AC Variables on Audit Fees) ............................... 156
5.4.6.3.3 Discussion of Findings on Model 5 ............................................. 158
5.4.6.3.4 Results for Model 6
(The Effects of Control Variables on Non-Audit fees) ................ 160
5.4.6.3.5 Results for Model 6
(The Effects of AC Variables on Non-audit fees) ....................... 162
5.4.6.3.6 Discussion on Findings on Model 6............................................. 164
5.4.7 Model 6: Tests of Hypothesis Five ........................................................... 164
5.4.7.1 Correlation Analysis .......................................................................... 164
5.4.7.2 Regression Analysis .......................................................................... 165
5.4.7.2.1 Results for Model 7 .................................................................... 165
5.4.7.2.2 Discussion on Findings on Model 7............................................ 166
5.5 Conclusion ....................................................................................................... 168
CHAPTER 6. COMPARATIVE CASE STUDY.................................................... 169
6.1 Introduction ..................................................................................................... 169
6.2 Selection of the Companies ............................................................................. 169
6.3 Comparative Case Study in the Financials Industry ........................................ 170
6.3.1 Profile of the Companies .......................................................................... 170
6.3.2 Profile of the ACs...................................................................................... 171
6.3.3 Questionnaire Comparison........................................................................ 172
6.3.3.1 Introduction ........................................................................................ 172
6.3.3.2 Profile of the Internal Audit Function................................................. 172
6.3.3.3 Internal Audit Function Activities ...................................................... 173
6.3.3.4 Internal Audit Function Authority .................................................... 173
6.3.3.5 Internal Audit Function and External Auditors.................................. 174
6.3.3.6 AC and Internal Audit Function ........................................................ 174
6.3.3.7 Internal Audit Function Independence .............................................. 175
6.3.3.8 Discussion .......................................................................................... 175
6.4 Comparative Case Study in the Materials Industry ......................................... 178

viii
6.4.1 Profile of the Companies .......................................................................... 178
6.4.2 Profile of the ACs...................................................................................... 179
6.4.3 Questionnaire Comparison........................................................................ 179
6.4.3.1 Introduction ........................................................................................ 179
6.4.3.2 Profile of the Internal Audit Function................................................. 180
6.4.3.3 Internal Audit Function Activities ...................................................... 180
6.4.3.4 Internal Audit Function Authority .................................................... 181
6.4.3.5 Internal Audit Function and External Auditors.................................. 181
6.4.3.6 AC and Internal Audit Function ........................................................ 181
6.4.3.7 Internal Audit Function Independence .............................................. 182
6.4.3.8 Discussion .......................................................................................... 182
6.5 Conclusion ....................................................................................................... 186
CHAPTER 7. CONCLUSIONS, LIMITATIONS, IMPLICATIONS AND
FUTURE RESEARCH ............................................................................................... 187
7.1 Introduction ..................................................................................................... 187
7.2 Summary of the Study ..................................................................................... 187
7.3 Findings of the Study ....................................................................................... 188
7.4 Limitations of the Study .................................................................................. 191
7.5 Implications of the Study ................................................................................. 192
7.6 Suggestions for Future Research ..................................................................... 193
REFERENCES ............................................................................................................ 195
APPENDIX……. ......................................................................................................... 212
ix
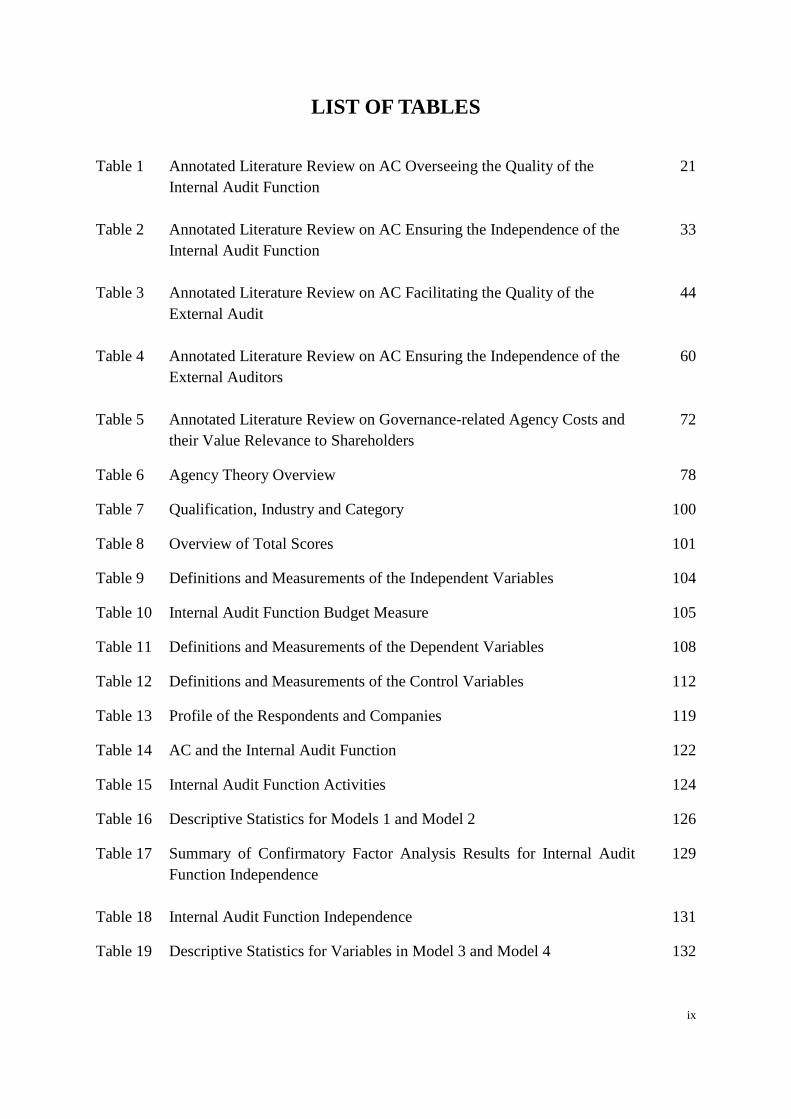
LIST OF TABLES
Table 1 Annotated Literature Review on AC Overseeing the Quality of the
Internal Audit Function
21
Table 2 Annotated Literature Review on AC Ensuring the Independence of the
Internal Audit Function
33
Table 3 Annotated Literature Review on AC Facilitating the Quality of the
External Audit
44
Table 4 Annotated Literature Review on AC Ensuring the Independence of the
External Auditors
60
Table 5 Annotated Literature Review on Governance-related Agency Costs and
their Value Relevance to Shareholders
72
Table 6 Agency Theory Overview 78
Table 7 Qualification, Industry and Category 100
Table 8 Overview of Total Scores 101
Table 9 Definitions and Measurements of the Independent Variables 104
Table 10 Internal Audit Function Budget Measure 105
Table 11 Definitions and Measurements of the Dependent Variables 108
Table 12 Definitions and Measurements of the Control Variables 112
Table 13 Profile of the Respondents and Companies 119
Table 14 AC and the Internal Audit Function 122
Table 15 Internal Audit Function Activities 124
Table 16 Descriptive Statistics for Models 1 and Model 2 126
Table 17 Summary of Confirmatory Factor Analysis Results for Internal Audit
Function Independence
129
Table 18 Internal Audit Function Independence 131
Table 19 Descriptive Statistics for Variables in Model 3 and Model 4 132

x
Table 20 Descriptive Statistics for Variables in Model 7 133
Table 21 Industry Distribution 133
Table 22 Descriptive Statistics Variables in Model 5 and Model 6 135
Table 23 Sample Size Statistical Power Test
137
Table 24 Correlation Analysis for Model 1 and Model 2 139
Table 25 Stepwise Regression Results for Model 1 141
Table 26 Stepwise Regression Results for Model 2 142
Table 27 Correlation Analysis for Model 3 and Model 4 146
Table 28 Correlation Analysis for Model 5 and Model 6 149
Table 29 Comparison of Means 152
Table 30 Ordinary Least Squares Regression Results Model 5 (The Effects of
Control Variables on Audit Fees)
155
Table 31 Ordinary Least Squares Regression Results Model 5 (The Effects of AC
Variables on Audit Fees)
157
Table 32 Ordinary Least Squares Regression Results Model 6 (The Effects of
Control Variables on Non-Audit Fees)
161
Table 33 Ordinary Least Squares Regression Results Model 6 (The Effects of AC
Variables on Non-Audit Fees)
163
Table 34 Correlation Analysis for Model 7 165
Table 35 Ordinary Least Squares Regression Results Model 7 166
Table 36 Summary of Findings 190

xi
LIST OF FIGURES
Figure 1 Conceptual Model
116
Figure 2 Scree Plot
128

xii
LIST OF ACRONYMS
AC Audit Committee
AI Australian Industry Group
AICD Australian Institute of Company Directors
ASX Australian Stock Exchange
ASX CGC Australian Stock Exchange Corporate Governance Council
AUASB Auditing and Assurance Standards Board
CA Institute of Chartered Accountants Australia
CEO Chief Executive Officer
CFO Chief Financial Officer
CIA Chief Internal Auditor
CLERP Corporate Law Economic Reform Program
CPA Certified Practicing Accountant Australia
IIA Institute of Internal Auditors Australia
KMO Kaiser-Meyer-Olkin
OSL Ordinary Least Squares
PCA Principal Components Approach
S&P Standard and Poor
SOX Sarbanes-Oxley Act
VIF Variance Inflation Factor

xiii
ABSTRACT
Audit Committees (ACs) have become more important and prevalent since the initial
corporate governance reforms of the mid-2000s. Initially, ACs were made responsible for
overseeing and monitoring the company’s financial reporting. However, due to the evolving
business environment and international auditing standards, ACs are now responsible for other
audit and assurance activities that are not directly related to financial reporting. In their
expanded roles, ACs have become a key player in their entity’s suite of corporate governance
mechanisms which are intended to protect the interest of the shareholders and reduce the
shareholder-manager agency conflicts in a company. The concept of AC effectiveness can be
benchmarked against the widely-recognised contemporary roles of an AC. Effectiveness of
ACs in fulfilling their roles is expected to be conditional upon their own structures and
members’ characteristics.
The aim of this study is to examine the role effectiveness of ACs’ governance characteristics
in achieving desired levels of quality and independence for the internal and external auditing
functions of listed companies in Australia. However, achieving this role effectiveness of ACs
will require agency costs. So this study also investigates whether higher audit-related agency
monitoring costs (i.e., external audit fees, internal audit function budget and AC fees) result
in higher returns to shareholders. The motivations for this study are to contribute to existing
AC literature, to develop a comprehensive empirical design, and to provide new evidence
from Australia using the ASX CGC revised 2007 edition best practice recommendations on
governance.
Five sets of hypotheses are generated from focal literature. Hypothesis one (a) and one (b)
test the association between AC’s mechanisms for role effectiveness, based on its AC’s
governance characteristics (i.e., chair independence, financial and industry expertise, size,
frequency of meetings and charter) and financial resources (budget and labour hours) devoted
to the internal audit function. Hypothesis two (a) and two (b) test the association between
AC’s mechanisms for role effectiveness and the independence of the internal audit function.
Hypothesis three tests the association between AC’s mechanism for role effectiveness and the
quality of the external audit while hypothesis four tests the association between AC’s
mechanisms for role effectiveness and the independence of the external auditors. Lastly,

xiv
hypothesis five tests the relationship between audit-related agency monitoring costs and total
shareholders return. This study uses cross-sectional data and mainly applies multiple
regressions to test the hypotheses.
The sampling frame for this study is top 300 companies listed on the Australian Stock
Exchange (ASX) for the financial year ending in 2010. A total of 255 companies are drawn
from the sampling frame on an elimination basis. Mixed methods are used to gather both
primary and secondary data. There are two stages of data collection employed. In the first
phase, questionnaires have been developed and administered to the Chief Internal Auditors
(CIA) of the sampled companies. Financial accounting and market data and the text in the
annual reports are obtained from Connect 4, Aspect-Huntley’s FinAnalysis and
Morningstar’s DatAnalysis databases.
There are several findings from this study. First, in terms of AC’s governance characteristics
and the role of AC overseeing the quality of the internal audit function, hypothesis one (a)
reveals that only AC size is significantly positively associated with financial resources
devoted to the internal audit function while hypothesis one (b) shows that both AC expertise
and AC size are significantly related to internal audit function’s labour hours. Second, in
terms of AC’s governance characteristics and the AC’s role of ensuring the independence of
the internal audit function, tests of hypotheses two (a) and (b) find that no attributes of AC’s
governance characteristics have a significant impact on the effectiveness of ACs in their role
of ensuring the internal audit function independence.
Third, in terms of AC’s governance characteristics and the role of AC facilitating the quality
of the external audit, the tests of hypothesis three find that AC size and AC frequency of
meetings are significantly related to external audit fees (a proxy for external audit quality).
Fourth, in terms of AC’s governance characteristics and the role of AC ensuring the
independence of external auditors, the test of hypothesis four reveals that both AC size and
frequency of meetings are significantly negatively related to non-audit fees (a proxy for
external auditors’ independence). Finally, in terms of audit-related agency monitoring costs
and total shareholders return, results concerning hypothesis five reveal that total AC fees, but
not internal or external auditor costs, are significantly related to total shareholders return.

xv
To provide a more in-depth analysis of the key AC’s governance characteristics that are
found in the regression analysis to be significant, a comparative case study between two
different companies in the financials and materials industry is performed. The results are
generally supportive where AC size and frequency of meetings play a significant role in
relation to the effectiveness of ACs in performing their roles, especially in the internal audit
function (consistent with results of the regression models).
In conclusion, the various findings of this study have important implications for regulators of
corporate governance, professional accounting/auditing bodies, shareholders, board of
directors and scholarly researchers. This study highlights the significant relationship between
an AC’s governance characteristics and its effectiveness in fulfilling its roles in overseeing
the quality of the internal audit function and also external auditing, as well as ensuring the
independence of the internal and external auditors. Finally, this study contributes to current
auditing-related governance literature by introducing a comprehensive empirical model along
with statistical measure for AC’s governance characteristics.

xvi
DECLARATION
I, Shir Li Ng, certify that:
1. – except where due acknowledgement has been made, the work completed is mine alone;
2. – the work has not been submitted previously, in whole or in part, to qualify for any other
academic award;
3. – the content of the thesis is the result of work which has been carried out since the
official commencement date of the approved research program;
4. – any editorial work, paid or unpaid, carried out by a third party is acknowledged;
5. – and relevant ethics procedures and guidelines have been followed.
Shir Li Ng
27 March 2013

1
CHAPTER 1. INTRODUCTION
1.1 Background to the Study and Research Issues
Up until about a decade ago, ACs were commonly viewed as a monitoring mechanism that
enhances the audit attestation function of financial reporting by establishing a formal
communication link between the board of directors, internal audit function and external
auditors (Blue Ribbon Committee, 1999). In the past, financial reporting, accounting systems
and internal controls were the main focuses of the ACs’ role. Today, ACs are given a broad
mandate that covers a wide range of responsibilities such as risk management, financial and
non-financial compliance requirements and other audit and assurance activities that are not
directly related to the company’s financial reporting (AUASB, AICD and IIA, 2008). It is
contended that these more extensive responsibilities of ACs can protect the interests of the
shareholders and reduce shareholder-manager agency conflicts in the company.
High profile corporate collapses in the previous decade such as Enron and WorldCom in the
United States and OneTel, Harris Scarfe and HIH Insurance in Australia have caused
corporate regulators and investors to query the effectiveness of ACs in effectively applying a
monitoring and compliance role (Dellaportas et al., 2012). Hence, the United States, Australia
and many other countries have introduced corporate governance law reforms such as new
codes and guidelines to restore investors’ confidence in the financial reporting system. The
gradual strengthening of corporate governance structures has impacted on the formation and
operation of ACs which provides the setting for this study.
Previous studies in Australia (Cooper, 1993; Goodwin, 2003; Goodwin and Kent, 2006;
Singh and Newby, 2010) are conducted on data from the years before the implementation of
the Australian Stock Exchange Corporate Governance Council (ASX CGC) revised 2007
edition code. Thus, this study seeks to fill a gap in the corporate governance literature which
lacks evidence on the effectiveness of governance characteristics of ACs in fulfilling their
multiple roles under the current revised code (ASX CGC, 2007) of good corporate
governance in Australia.

2
In this study, the concept of AC effectiveness is benchmarked against the many roles and
responsibilities of an AC. The effectiveness of an AC is expected to be influenced by its
structure and its members’ governance characteristics such as independence, financial and
industry expertise, frequency of meetings, size of the committee, and the existence of an AC
charter. Past studies addressing AC effectiveness are wide-ranging and have identified
several factors that impact on the effectiveness of an AC. (Kalbers and Fogarty, 1993;
Goodwin and Yeo, 2001; DeZoort et al., 2002; Carcello et al., 2002; Abbott et al., 2003;
Carcello et al., 2005).
According to Kalbers and Forgarty (1993), the structure of an AC and characteristics of its
members are considered as a determinant of AC effectiveness. Also, DeZoort and Salterio
(2001) argued that the effectiveness of an AC is likely to be affected by its members’
collective characteristics of being competent, inquisitive and decisive. However, most of
these prior studies only address partial aspects in the design of AC structures and
characteristics in terms of AC effectiveness. Hence, this study seeks to provide an up-to-date
and comprehensive modelling of the effectiveness of the governance characteristics of
Australian ACs in fulfilling their auditing-related roles.
1.2 Overview of AC Regulations in Australia
Previously, regulators in Australia had adopted a simple disclosure-based approach to the
establishment of ACs where companies were not required to comply with any rules or best
practices. Nevertheless, over the past years, there have been a number of formal
recommendations from the regulators, government and professional accounting/auditing
bodies seeking to mandate the establishment of ACs in listed companies in Australia.
According to Munro and Buckby (2008), the development of AC regulations in Australia can
be categorized into three distinct periods: Period 1 (from 1976 to 1 July 1993) – voluntary
AC formation and non-disclosure, Period 2 (from 1 July 1993 to 1
January 2003) – voluntary
AC formation and public disclosure and Period 3 (from 1 January 2003 to present) –
mandatory AC formation and public disclosure.
Period 1 (from 1976 to 1 July 1993) is the period where listed companies in Australia are not
required to establish an AC and are not required to disclose publicly in their annual reports
whether they had an AC. Period 2 (from 1 July 1993 to 1 January 2003) represents the period

3
where listed companies in Australia are still not required to establish an AC but they are
required by the ASX to publicly disclose in their annual reports whether they had an AC.
Period 3 (from 1 January 2003 to present) is the period where top 300 listed companies in
Australia are required by the ASX to have an AC and must disclose further information about
the composition and operation of their AC (Munro and Buckby, 2008; ASX, 2001; ASX,
2006).
With the increase of financial reporting frauds and high profile corporate scandals, the
Sarbanes-Oxley Act (SOX) was enacted in the United States (January 2002) to establish new
corporate governance standards for the board of directors and the ACs. The SOX legislation
was enacted mainly due to the collapse of Enron and implemented rules and regulations that
required all listed companies in the United States to establish an AC. Following the issue of
SOX in the United States and the collapse of big corporations in Australia, the Corporate Law
Economic Reform Program (Audit Reform & Corporate Disclosure) Act 2004, also known as
CLERP 9, was introduced by the Australian government. This Act was largely implemented
by modifications to the Corporations Act 2001. CLERP 9 was designed to strengthen the
regulatory framework in the key areas of corporate accountability and governance,
continuous disclosure, and the protection of the interests of the shareholders.
At present, the ASX CGC’s best practice recommendations and ASX’s listing rules govern
the foundation, policy and procedures of ACs in Australia. In March 2003, ASX CGC issued
the Principles of Good Corporate Governance and Best Practices Recommendations
Guidelines: ASX CGC 2003. ASX CGC (2003) was implemented to improve the efficiency,
quality and integrity of corporate governance practices and presentation of a listed company’s
financial position (Murno et al., 2008). Due to the evolving nature of corporate governance,
in 2 August 2007, ASX CGC undertook an extensive review and issued a revised edition of
the Principles of Good Corporate Governance and Best Practices Recommendations
Guidelines: ASX CGC 2007.
This document was very similar to the 2003 release. The key changes between the ASX CGC
2003 edition and the ASX CGC 2007 edition are the removal of best practice from the title
and further guidance on the list of relationship affecting board members independence status
which will assist boards to determine the independence of a director for AC purposes (ASX

4
CGC, 2007). The ASX CGC 2003 and ASX CGC 2007 are the key points of reference for the
ACs on their roles and responsibilities. The recommendations of the ASX CGC for ACs
focuses on ACs’ characteristics such as independence, financial and industry expertise, size,
frequency of meetings and the existence of a formal charter.
On the other hand, the operation and composition of ACs in Australia are governed by the
ASX listing rules. The ASX listing rules have statutory backing under the Corporations Act
2001. In 2003, ASX Listing Rule 12.7 was issued, where from 1 January 2003 onwards, top
500 companies listed on the ASX at the beginning of the financial year are required to
establish an AC and must comply with ASX CGC’s AC recommendations. However, in 2004,
the ASX Listing Rule 12.7 was amended such that only top 300 listed companies are required
to establish an AC. The rules also require the top 300 listed companies to comply with
recommendations of the ASX CGC’s principles and recommendations on the composition,
operation and responsibility of an AC (AUASB, AICD and IIA, 2008). The next 200 listed
companies are also require to establish an AC but not necessarily to follow ASX CGC’s AC
recommendations whereas, the remaining smaller listed companies are only require to
indicate in their annual reports whether an AC had been created.
In summary, Australia has moved forward from a simple disclosure-based approach to an
established comprehensive framework of corporate governance through amendments to the
Corporations Act (2001), the implementation of CLERP 9 and the active involvement by the
ASX, which has issued corporate governance listing rules and best practice recommendations
(ASX CGC, 2003, ASX CGC, 2007; Munro and Buckby, 2008). Hence, this study aims to
test whether AC regulations and guidelines on corporate governance structures and practices
have been effective in improving the role fulfilment of ACs within the top 300 ASX listed
companies.
1.3 Roles and Responsibilities of ACs in Australia
An AC is a subcommittee of the board of directors responsible for overseeing the company’s
financial reporting and disclosure, overseeing risk management and internal controls and
acting as a communication link between the board, management, external auditors and
internal auditors. An effective AC represents a good corporate governance mechanism that
reduces potential agency conflicts arising due to the separation of corporate control and

5
ownership between the management and the shareholders (Jensen and Meckling, 1976;
Abbott and Parker, 2000; Lary and Taylor, 2011). The scope of roles and responsibilities of
an AC will rely, to some extent, upon the individual needs and characteristics of a company.
It can be seen that, some Australian companies have established one committee (Audit and
Risk Committee) with broad responsibility such as risk management and assurance matters
while other companies choose to establish a traditional AC (Audit Committee) and a separate
risk management committee (Risk and Compliance Committee).
The ASX CGC (2007) provides recommendations and guidelines to improve the efficiency
and quality of ACs in Australia. ASX CGC puts forward a limited focus on the AC and the
companies can choose to increase and expand the role of the AC to take on a wider multitude
of other responsibilities. Moreover, the roles and responsibilities, powers and rights,
membership requirements, structure and procedures for conducting AC meetings are also
clearly described in the AC charter. It can be argued that an AC must exhibit at least five
characteristics (has independent members, has financial and industry expert members, has
sufficient members, has frequent meetings and has a formal charter) to enable it to effectively
discharge its roles.
An AC is considered to have oversight roles in three core areas: 1) financial statement
reporting; 2) internal audit functioning and 3) external audit services. The main function of an
AC in the financial reporting area is to help the board of directors of the company to carry out
its supervision responsibilities such as reviewing the financial information and overseeing the
company’s accounting and financial reporting processes. An AC is also responsible for
ensuring the credibility and reliability of the financial reports (e.g., reduce earnings
management) by reviewing the appropriateness of accounting policies and disclosures to the
presentation of a true and fair view.
Additionally, in the external audit area, an AC is responsible for facilitating the quality of the
external audit and ensuring the independence of the external auditors. In this respect, an AC
is required to make recommendations to the board on the appointment, removal and
remuneration of the external auditors. Also, the AC is expected to invite the external auditors
to attend AC meetings to discuss matters about the external audit plan including proposed
audit strategies and programs.

6
For internal audit function, the main role for an AC is to oversee the internal audit function
and ensure the independence of the internal auditors. An AC is responsible to make
recommendations to the board of the company on the appointment, remuneration and
dismissal of Chief Internal Auditor (CIA). An AC is also responsible for reviewing the
internal audit function’s plan, internal controls, risk management, resources and budget such
that the internal audit function is effective and independent from the management. In
summary, this study benchmarks AC effectiveness against aspects of two of the AC’s core
roles: 1) overseeing the quality and ensuring the independence of the internal audit function
and 2) facilitating the quality and ensuring the independence of the external auditors.
1.4 Composition of ACs in Australia
The composition of ACs in Australia is expected to consist of members with a high quality of
independence and objectivity, demonstrated financial literacy, and a balance of professional
skills and technical experiences and also the AC should be of sufficient size to carry out its
responsibilities effectively (ASX CGC, 2007). According to the ASX Listing Rule 12.7, top
300 listed companies are required to establish an AC. The rule also requires the top 300 listed
companies to comply with recommendations of the ASX CGC’s principles and
recommendations on the composition, operation and responsibility of an AC (AUASB, AICD
and IIA, 2008). ASX CGC’s Recommendation 4.1 suggests that the board of a company
should establish an AC. Moreover, ASX CGC’s Recommendations 4.2 and 4.3 recommend
that the AC should be structured so that it consists of independent non-executive directors, is
chaired by an independent chair, has at least three members and has a charter.
The ability to make objective and independent decisions by the AC is important. The AC
should consist of independent directors who are free from day to day management and other
relationships that can interfere with the AC’s decisions to act in the best interest of the
shareholders. The Chief Executive Officer (CEO) or the Chief Financial Officer (CFO)
should not be a member of the AC. Sometimes, the board might choose to appoint a member
in the AC that has an indirect relationship with the company because of the member’s
expertise. Thus, ASX CGC recommends that the board should disclose the existence of any
such relationship and state the reason for choosing a member of the AC. Also, the chair of the
AC plays an important role in ensuring the effectiveness of the AC’s operation in a company.

7
According to ASX CGC, the chair of the AC should not be the chair of the board, but should
have financial expertise and be knowledgeable about the company’s business, financial
reporting and auditing requirements. To perform their roles and responsibilities effectively, it
is important to have AC members who are financially literate and, preferably, have an
accounting/financial qualification. According to ASX CGC, an AC should have members
who are able to understand financial statements, should have at least one member who has
relevant qualifications and experience and should have some members with an understanding
of the industry in which the company operates (at least 10 years relevant industry experience).
An AC’s objectives are expected to be achieved through regular conduct of meetings. ASX
CGC does not provide recommendations on the number of meetings that an AC should have
each year as the required number of meetings may differ. The number of AC meetings held
each year should depend on the size and complexity of the business. It is common for the
CEO and CFO of the company to attend AC meetings to discuss and resolve issues in a
timely manner. AC members also have the right to meet without the presence of the
management in order to maintain its independence and objectivity.
AC size is also seen to be important to the overall strength of the AC. According to ASX
CGC, an AC should be structured so that it has at least three members to carry out the wide
responsibilities and the complex nature of accounting and financial matters. However, ASX
CGC does not place an upper limit on the number of members in a committee and there is an
issue whether or not larger AC size would lead to more effective monitoring. A final
characteristic is an AC charter. This is viewed as important because it makes explicit the
scope of an AC’s responsibilities, rights (which give it authority) and the procedures for
conducting meetings. ASX CGC requires an AC to have a formal charter. To sum it up, in
this study, the concept of AC effectiveness is benchmarked against AC members’ governance
characteristics.
1.5 Objectives of the Study
This study aims to investigate the effectiveness of ACs in performing their roles and,
supplementary to this aim, to also examine the relationship between the audit-related agency
monitoring costs and total shareholders return as an intended central part of good corporate

8
governance in the post-reform era in Australia. The four specific objectives are detailed as
follows:
1. To identify the prevalence of ‘good governance’ characteristics of ACs in Australian
listed companies, in terms of AC chair independence, members’ financial and
industry expertise, size of committee, meeting frequency and formal charter.
2. To explain the extent to which ACs’ governance characteristics impact on ACs’ roles
of overseeing the quality of the internal audit function and ensuring the independence
of the internal audit function.
3. To explain the extent to which ACs’ governance characteristics impact on ACs’ roles
of facilitating the quality of external audit and ensuring the independence of external
auditors.
4. To determine whether higher audit-related agency monitoring costs (i.e., external
audit fees, internal audit function budget and AC fees) result in higher returns to
shareholders (i.e., higher total shareholders return).
From the findings of this study, conclusions will be reached on which AC’s governance
characteristics are more effective in fulfilling the AC’s roles especially in the internal audit
function and the external audit engagement.
1.6 Motivation and Significance of the Study
This study is motivated to contribute to existing literature on AC effectiveness and its ‘good
governance’ determinants. Previous corporate governance studies have been limited in
modelling the effectiveness of ACs. Even though the effectiveness of ACs are investigated in
the United States, the United Kingdom and Australia, no empirical evidence are provided
from the viewpoint of testing the effectiveness of AC’s governance characteristics in
fulfilling their dual roles of overseeing the internal audit function and also the external audit
engagement. Most studies focused solely on either internal or external audit. Thus, the
incremental contribution of this study is to provide findings on the effectiveness of Australian
ACs in performing these dual audit-related roles in the context of top 300 companies listed on
the ASX. By providing a comprehensive and integrated understanding of the operations and
responsibilities of ACs, this study has practical interest for regulators, corporate boards and
auditors.

9
The Australian context lends itself to research as recent regulatory changes (ASX CGC,
2007) relating to ACs, enables the findings of this study to provide a review for regulators on
whether regulatory changes have improved the ACs’ roles of large listed companies. Previous
studies in Australia focused on the effectiveness of ACs in terms of audit fees or earnings
management in the years before the implementation of the ASX CGC 2007 revised edition
code. Moreover, this study is significant because it refines and extends the methodology of
prior accounting research. The methodology of prior research, which has provided the
foundation of this study is refined and extended in a number of important directions, as will
be detailed in Chapter 4.
As well, a distinctive aspect of this study which has not been addressed in previous papers
concerns the issue of agency costs and benefits. Separation of ownership and control between
the shareholders and management provides incentives for managers to act in their own best
interest. Hence, the strengthening of the corporation’s auditing and internal control functions
(i.e., the functions of the AC, external auditors and internal auditors) can reduce this problem.
It can be argued that higher audit-related agency monitoring costs (AC fees, external audit
fees and internal audit budget) should bring about greater protection of the interest of the
shareholders.
Higher audit-related agency monitoring costs should produce a stronger monitoring
mechanism and improve corporate governance quality of the company in terms of reducing
agent conflict between the shareholders and the managers. But does such shareholder
protection expected from incurring higher audit-related agency costs lead to increased
financial returns to shareholders? To this extent, there is no study testing this question. Hence,
this study is the first to examine whether aggregate audit-related agency monitoring costs is
positively related to total shareholders return.
1.7 Organisation of the Study
This study has seven chapters. Chapter 1 presents an overview, motivation, significance and
expected contribution of the study. The remaining chapters are organized as follows:
Chapter 2 reviews related prior studies and provides a summary of literature used. Chapter 3
explains the theoretical foundation of agency theory and states the hypotheses forming the

10
basis of this study. Chapter 4 describes the questionnaire data research methodology and
secondary data research methodology used to test the underlying assumptions of the
hypotheses of this study. This includes data source, data collection, basis of measurements
and definitions, model development and conceptual model. Chapter 5 reports the analysis,
results and discussion corresponding to the related hypotheses and models.
Chapter 6 undertakes two comparative case study analyses. Due to the issue of confidentiality,
the four companies will not be named. The companies will be called Company A, Company
B, Company C and Company D instead. Company A and Company B are in the financials
industry while Company C and Company D are in the materials industry. The companies are
selected based on the findings from the preceding chapter (Chapter 5). Lastly, Chapter 7
summarises the whole thesis and discusses the implications based on major findings. In
addition, limitations and directions for future research are considered.
11
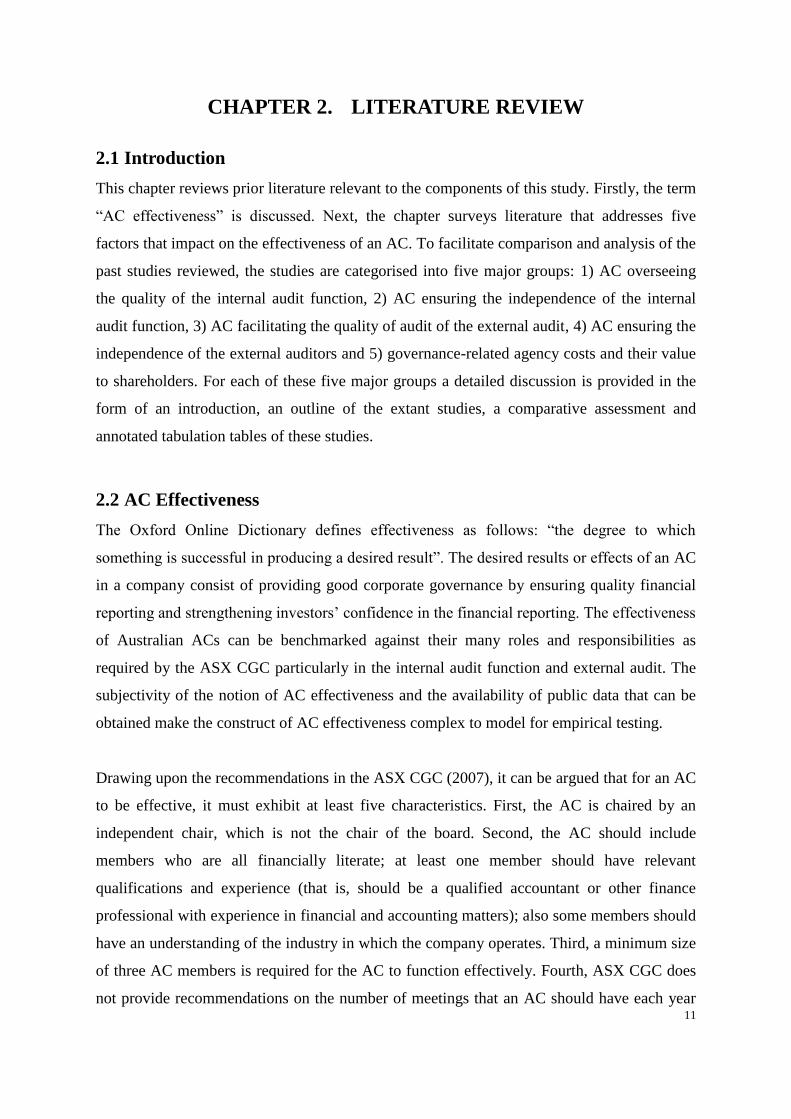
CHAPTER 2. LITERATURE REVIEW
2.1 Introduction
This chapter reviews prior literature relevant to the components of this study. Firstly, the term
“AC effectiveness” is discussed. Next, the chapter surveys literature that addresses five
factors that impact on the effectiveness of an AC. To facilitate comparison and analysis of the
past studies reviewed, the studies are categorised into five major groups: 1) AC overseeing
the quality of the internal audit function, 2) AC ensuring the independence of the internal
audit function, 3) AC facilitating the quality of audit of the external audit, 4) AC ensuring the
independence of the external auditors and 5) governance-related agency costs and their value
to shareholders. For each of these five major groups a detailed discussion is provided in the
form of an introduction, an outline of the extant studies, a comparative assessment and
annotated tabulation tables of these studies.
2.2 AC Effectiveness
The Oxford Online Dictionary defines effectiveness as follows: “the degree to which
something is successful in producing a desired result”. The desired results or effects of an AC
in a company consist of providing good corporate governance by ensuring quality financial
reporting and strengthening investors’ confidence in the financial reporting. The effectiveness
of Australian ACs can be benchmarked against their many roles and responsibilities as
required by the ASX CGC particularly in the internal audit function and external audit. The
subjectivity of the notion of AC effectiveness and the availability of public data that can be
obtained make the construct of AC effectiveness complex to model for empirical testing.
Drawing upon the recommendations in the ASX CGC (2007), it can be argued that for an AC
to be effective, it must exhibit at least five characteristics. First, the AC is chaired by an
independent chair, which is not the chair of the board. Second, the AC should include
members who are all financially literate; at least one member should have relevant
qualifications and experience (that is, should be a qualified accountant or other finance
professional with experience in financial and accounting matters); also some members should
have an understanding of the industry in which the company operates. Third, a minimum size
of three AC members is required for the AC to function effectively. Fourth, ASX CGC does
not provide recommendations on the number of meetings that an AC should have each year

12
but given the various roles and responsibilities allocated to the AC, it needs to hold sufficient
meetings (at least three times a year) to undertake its obligation effectively. Lastly, the AC
should have a formal charter.
Previous literature adopted different proxies to determine the effectiveness of ACs in their
monitoring roles. DeZoort et al. (2002) characterised the effectiveness of AC as having
qualified members with the authority and resources to protect stakeholders’ interests by
ensuring reliable financial reporting, internal controls, and risk management through its
diligent oversight efforts. Similarly, Kalbers and Fogarty (1993) defined AC effectiveness as
the competency of the AC to undertake specified oversight responsibilities in the company.
On the other hand, Carcello et al. (2005) conceived AC effectiveness as an ability to oversee
the internal audit function activities which are measured by total internal audit budget
devoted to the internal audit function. Alternatively, Goodwin and Yeo (2001) assessed the
effectiveness of an AC as an ability to maintain internal audit function independence whether
in appearance or fact. From yet another perspective, Carcello et al. (2002) defined the
effectiveness of an AC as an ability to protect the interests of the shareholders by purchasing
higher quality audit services, where the quality of audit service is represented in higher audit
fees. Likewise, Abbott et al. (2003) assessed the AC effectiveness as an ability to maintain
the independence of external auditor which is measured by the ratio of non-audit fees to audit
service fees.
Literature addressing AC effectiveness is wide-ranging and has identified several factors that
impact on the effectiveness of an AC. Drawing on this literature, the five factors used in this
study are independence of AC chair, financial and industry expertise of AC members,
frequency of meetings of AC, size of AC and formal charter of AC (subject of ASX CGC’s
2007 recommendations). These five factors would act as a suitable construct in testing the
effect of the role of AC effectiveness on the internal and external audit in this study.

13
2.3 Characteristics that Reflect AC Effectiveness
Based on past literature, this study has identified five factors that can reflect the role
effectiveness of an AC:
1. Independence of AC chair
2. Financial and industry expertise of AC members
3. Frequency of meetings of AC
4. Size of AC
5. Formal charter of AC
2.3.1 Independence of AC Chair
The independence of AC members and chair are deemed to be important characteristics
enabling AC effectiveness. Fama and Jensen (1983) argued that independent AC members as
outside directors may view the directorate as a means of enhancing their reputations as being
an expert in decision control. According to ASX CGC (2007) Recommendations 4.2, the AC
should be structured so that it comprises only of non-executive directors, consists of a
majority of independent directors and is chaired by an independent chair that is not the chair
of the board. These recommendations are supported by the findings of previous studies which
established that AC independence impacts on the committee’s effectiveness (Abbott et al.,
2000; Beasley et al., 2000; Carcello and Neal, 2000; Goodwin and Yeo, 2001; Klein, 2002;
Abbott et al., 2004).
Past literature also proposes that AC independence can strengthen the quality of financial
reporting. Beasley et al. (2000) argued that fraudulent reporting firms are less likely to occur
when firms have an AC that is active and independent. Also, Abbott and Parker (2000) found
that ACs that consist of independent directors and meet at least twice per year are less likely
to be sanctioned for fraudulent or misleading reporting. In a later study by Abbott et al.
(2004), the authors found that AC independence is significantly and negatively related to the
occurrence of earnings management.
Similar findings also emerged from Klein (2002) and Carcello and Neal (2000) where ACs
comprised of independent members are more effective in monitoring the corporate financial
accounting process. In summary, previous studies found that ACs independent from
management are likely to demand a greater level of audit assurance and ensure reliable

14
financial reporting. Conversely, other studies found no evidence between the independence of
AC members and discretionary accruals (Xie et al., 2003), or the occurrence of earnings
restatements (Lin et al., 2006), or quarterly earnings management (Yang and Krishnan, 2005).
2.3.2 Financial and Industry Expertise of AC Members
In addition to independence, AC expertise is considered important governance characteristic
for the effectiveness of ACs in fulfilling their oversight role and protecting the interests of
shareholders. It is essential for all the members in the AC to have a financial or/and
accounting background in order to assist the committee to understand and report on the
financial information of the organisation and also some members need to have industry
experience relevant to the organisation (Munro and Buckby, 2008).
It has been proposed in ASX CGC (2007) Recommendations 4.3 that AC should include
members who are all financially competent, at least one member should have relevant
qualifications and experience and some members should have an understanding of the
industry in which the entity operates. ASX CGC defines financial expertise as the ability to
read and understand financial statements. The financial qualifications and experience of the
AC members can be demonstrated by previous or current employment in finance or
accounting firms and the membership of a professional financial/accounting body.
Findings from earlier studies have shown that financial expertise is essential for AC members
to perform their role well (Raghunandan et al., 2001; DeZoort and Salterio, 2001; Abbott et
al., 2003; Goodwin, 2003; Xie et al., 2003; Abbott et al., 2004; Davidson et al., 2004).
Raghunandan et al. (2001) and Goodwin (2003) posited that an AC with financial expertise
has greater interaction and communication with the internal auditors. This implies that AC
members with financial reporting knowledge are more likely to understand the extent of the
internal controls and work performed by the internal audit function. Moreover, DeZoort and
Salterio (2001) argued that AC members with more experience and financial knowledge are
more likely to comprehend the risk the external auditors face and provide additional support
for the external auditors when discussing issues and disagreements with the management.
Also, organisations with an AC that has financial expertise and industry experience are more
likely to produce higher quality financial reports. Davidson et al. (2004) argued that the

15
market reacts positively to the appointment of an AC with financial expertise. This is because
AC members with corporate or financial background would be able to better understand
earnings management and take action to prevent managers engaging in earnings management.
Abbott et al. (2003) and Abbott et al. (2004) also found that there is a negative relationship
between financial fraud and AC financial expertise.
2.3.3 Frequency of Meetings of AC
ASX CGC does not provide recommendations on the number of meetings that an AC should
have each year. The number of AC meetings held each year may differ and should depend on
the size and the risk of the business.
Empirical evidence supports the importance of AC meeting (Beasley et al., 2000; Xie et al.,
2003; Abbott et al., 2004). Beasley et al. (2000) found that the frequent AC meetings are
associated with less fraud. Moreover, Xie et al. (2003) found that AC meetings are associated
with reduced levels of discretionary current accruals and the authors concluded that AC
activity may be an important factor in constraining the propensity of managers to engage in
earnings management. Consistent with both studies, Abbott et al. (2004) found that ACs that
meet at least four times annually are less likely to restate their annual reports. These results
indicated that ACs that meet frequently are more likely to be up to date about the current
auditing issues faced by the company and are more attentive in discharging their
responsibilities.
However, other papers are unsuccessful in finding a significant association between the AC
meetings and fraud (Abbott et al., 2004) or earnings management (Yang and Krishnan, 2005).
Also, Davidson et al. (2005) found no evidence of a significant relation between the number
of AC meetings and earnings management.
2.3.4 Size of AC
AC size is also seen to be crucial to the overall strength of the AC. ASX CGC (2007)
Recommendation 4.2 asserts that the AC should be structured so that it has at least three
members to carry out their wide responsibilities and the complex nature of accounting and
financial matters. However, ASX CGC does not place an upper limit on the number of

16
member in the committee and there is an issue whether larger AC size would lead to more
effective monitoring.
Felo et al. (2003) posited that a larger AC increases financial reporting quality as such an AC
is more likely to discover and solve potential risks in the financial reporting process. This
may be possible if the resources available to the AC are increased to improve the oversight of
financial reporting. Furthermore, Lin et al. (2003) found that companies with ACs comprising
of at least four members are less likely to experience earnings restatements. Dalton et al.
(1999) also found a positive association between AC size and the monitoring function of the
board. Further, Psaros (2009) argued that an AC needs to have sufficient members such that
different and informed views can be canvassed, and it is not dominated by one individual.
However, Xie et al. (2003) found a weak association between AC size and earnings
management and Abbott et al. (2004) also found no evidence of a relationship between AC
size and earnings restatement.
Based on the results from previous studies it can be argued that a larger AC is necessary for
effective monitoring. Although ASX CGC (2007) recommends that AC should have at least
three members, companies may choose to have more than three members. Thus, this study
uses the same argument that a larger size AC would have more diverse skills and knowledge
to enhance monitoring.
2.3.5 Formal Charter of AC
An AC charter is important in an organisation as it clearly sets out the AC’s roles and
responsibilities, powers and rights, membership requirements, structure and the procedures
for conducting AC meetings. The charter is probably the most important basis for achieving
an effective AC. According to ASX CGC (2007) Recommendation 4.3, an AC should have a
formal charter. The ASX CGC’s recommendation for an AC charter sets forward the
minimum expectations. As such, an AC responsibility will be very much a function of the
company and the industry in which it operates (Psaros, 2009).
To this date, not many studies have examined the AC charter. Rezaee et al. (2003)
investigated the subject matter of the AC charters of Fortune 100 companies and found that
over nine percent of charters state the composition, independence, qualifications and financial

17
expertise of their AC members. Moreover, Kalbers and Fogarty (1993) argued that the
existence of a clear AC charter provides power for authoritative decision making and thus,
the AC can achieve its oversight role more effectively.
2.4 AC Overseeing the Quality of the Internal Audit Function
2.4.1 Introduction
One of the responsibilities of AC in Australia is oversight of the internal audit function’s
policies and procedures. The relationship between internal audit function and the AC is,
however, much greater than that of overseen and overseer (Goodwin and Yeo, 2001). To
maintain good corporate governance, communication between the employees responsible for
the internal audit function and the AC is vital (Scarbrough et al., 1998; IIA 2002a, 2002b,
2003b).
According to Gwilliam and Kilcommins (1998), the presence of an AC creates a perception
of enhanced independence of internal audit function and more reliable financial reporting
among financial statement users. This point of view is also supported by Krishnan (2005)
where the AC’s position is enhanced because it can depend on the work of the internal audit
function. Internal audit function in a company can also help to reduce problems related to
agency theory and information asymmetry because an AC does not have direct access to the
same level of information as the management (Raghunandan et al., 2001). Rezaee and Lander
(1993) argued that the working relationship between the internal audit function and AC must
be year round and an open relationship in order to be most effective. Moreover, Zaman and
Sarens (2013) found that AC and internal audit function engaging in informal interactions in
addition to formal prescheduled regular meetings represent additional opportunities for AC to
monitor the internal audit function.
The sub-sections below present and discuss literature that examined the relationship between
the AC and the internal audit function and a summary table of annotated literature review is
also presented.

18
2.4.2 Extant Studies
Scarborough et al. (1998) investigated the association between AC composition and their
interaction with the internal audit function. The authors surveyed CIAs of Canadian
manufacturing companies with sales greater than $50 million. The results indicated that there
are no significant differences with respect to involvement in decisions to dismiss the CIA.
Also, ACs consisting solely of non-employee directors are more likely to have frequent
meetings with the CIA and review the internal auditing program.
Furthermore, Raghunandan et al. (1998) presented empirical evidence about the perceived
level of knowledge of ACs based on a survey of 72 CIAs. The main findings showed that
ACs that granted private access to their CIA and reviewed both the plans and results of
internal auditing are more likely to be perceived as knowledgeable by their CIA. In more
recent years, Raghunandan et al. (2001) performed a similar study to Scarbrough et al. (1998)
by using responses from CIAs of 114 United States manufacturing companies. Consistent
with Scarbrough et al. (1998), they found that ACs consisting solely of independent directors
and with at least one member having an accounting or finance background are more likely to
have longer meetings with CIA, provide private access to CIA and review internal audit
proposals and results of internal auditing.
On a similar theme, Goodwin (2003) examined the separate influence of independence and
financial expertise on AC relations with the internal audit function. Using data from Australia
and New Zealand, the study focused on ACs and internal audit functions in both private and
public sector. They found that independence and accounting experience have a
complementary impact on AC relations with the internal audit function. The author argued
that independence is more associated with the issue of process while accounting experience is
associated with the extent that the AC reviews the work of the internal audit function.
Carcello et al. (2005) examined factors associated with United States public investment
companies in internal auditing. Data from surveys sent to CIA of mid-sized public companies
are combined with publicly available data. The authors found that internal audit budget is
positively related to AC review of the budget. In the United States, Abbott et al. (2010)
investigated the association between the AC’s oversight of the internal audit function and the
nature of internal audit function activities by surveying 134 CIAs from Fortune 1000. They
19
documented a strong, positive association between the AC oversight variable and the amount
of internal audit function budget allocated to internal-controls-based activities.
Taking a qualitative approach, Cooper’s (1993) study discussed the formation and
membership of an AC and the relationship of the AC and internal audit in Australia. The
author argued that an effective and harmonious relationship between the AC and internal
audit can have a profound beneficial effect on corporate management and control. A final
study in this review is Abbott et al.’s (2003) examination of the association between AC
effectiveness and internal audit outsourcing. Data are obtained from a survey of 219 CIAs
and from relevant proxy statements filed in 2001. The findings indicated that companies with
effective ACs are less likely to outsource internal auditing to the external auditor. Effective
ACs that also have authority over the CIAs’ dismissals will have an incrementally negative
relation with the extent of outsourcing.
2.4.3 Comparative Assessment
Overall, previous studies have concluded that an effective AC can heighten the status of the
internal audit function and at the same time, the internal audit function helps the AC in its
oversight role (Cooper, 1993; Scarbrough et al., 1998; Raghunandan et al., 1998;
Raghunandan et al., 2001; Goodwin, 2003; Abbott et al., 2003; Carcello et al., 2005; Abbott
et al., 2010).
In addressing the relationship of the AC to the internal audit function, studies such as
Scarbrough et al. (1998) and Raghunandan et al. (2001) examined the association between
AC composition and the committee’s interaction with internal auditing. Both studies used the
same method by sending surveys to CIAs in publicly held manufacturing companies.
Scarbrough et al.’s (1998) study is performed in Canada using a larger sample size while
Raghunandan et al.’s (2001), a more recent United States study used a smaller sample size
consisted of 114 public companies. Both consistently found that ACs consisting of solely
non-employee directors are more likely to have frequent meetings with the CIA and review
the internal auditing program.
Moreover, Goodwin (2003) performed a similar study to Scarbrough et al. (1998) and
Raghunandan et al. (2001) in Australia and New Zealand where the author separated the

20
influence of independence and financial expertise on AC relations with the internal audit
function. They found that independence and accounting experience have a complementary
impact on AC relations with internal audit. On the other hand, in terms of analysing the
perception and the perceived level of knowledge of ACs, Raghunandan et al. (1998) found
that ACs that granted private access to their CIAs and reviewed both the plans and results of
internal auditing are more likely to be perceived as knowledgeable. It could be argued that
ACs performing their role as an internal control oversight can have a strong beneficial effect
on corporate management. These results provided empirical support for the recommendations
of a private sector commission which has called for increased interaction between ACs and
internal auditing.
In a different context, Abbott et al. (2010) used the AC’s oversight of the internal audit
function as a direct measure in their study. Like all other studies, the authors survey 134 CIAs
from Fortune 1000. They found that ACs with greater internal audit function oversight are
associated with a larger percentage of internal audit function hours being allocated towards
internal control activities. It infers that ACs demanding for better internal controls may cause
higher internal audit function focus on internal controls.
2.4.4 Tabulated Annotations
The annotated literature review on AC overseeing the quality of the internal audit function is
presented in Table 1.

21
Table 1: Annotated Literature Review on AC Overseeing the Quality of the Internal Audit Function
Author(s)
Year(s)
Purpose/ Objective Sample & Data
Collection
Methods Main Findings Limitations & Future
Research
Scarbrough,
P., Rama,
D.V., &
Raghunandan,
K. (1998)
Examine the association
between AC composition
and the committee's
interaction with internal
auditing, as measured by
(1) involvement of the
AC in decisions to
dismiss the CIA (2)
meetings between the AC
and the CIA, and (3) AC
review of the internal
auditing program and
results of the internal
auditing.
398 companies are
mailed the
questionnaire.
Receive 58 responses
from large companies
(>$50million sales) and
50 responses from small
companies.
Survey CIAs of
Canadian
manufacturing
companies with
sales greater than
$50million.
No significant differences
with respect to involvement
in decisions to dismiss the
CIA.
ACs consisting of solely non-
employee directors are more
likely than AC consisting of
one or more insiders to have
(1) frequent meetings with
the CIA and (2) review the
internal auditing program and
the results of internal
auditing.
Internal auditors'
interactions may be
influenced by other factors.
Study focus is narrow;
only examine those issues
which have been discussed
in the reports of various
private sector
commissions.
Do not examine issues in
greater depth.
Future research: (1)
Examine AC interactions
with internal auditors in
other countries and
compare the results. (2)
Examine issues related to
AC interactions with
internal auditors in greater
depth by focusing on the
quality of the interaction.

22
Table 1 (Continued): Annotated Literature Review on AC Overseeing the Quality of the Internal Audit Function
Author(s)
(Year)
Purpose/ Objective Sample & Data
Collection
Methods Main Findings Limitations & Future
Research
Raghunandan,
K., Rama,
D.V., &
Scarbrough,
D. (1998)
Extend current literature
related to AC by
providing evidence about
the perceived level of
knowledge of Canadian
ACs with respect to
accounting and auditing
issues and the impact of
the nature of interaction
between the AC and
internal auditing on such
perceived level of
knowledge.
Indentify names and
address all publicly held
Canadian manufacturing
companies with sale
greater than $50million.
Mail questionnaire to
the CIA of 398
companies.
Perform additional
analysis by
including company
size and the
proportion of
internal auditing
time spent on
financial auditing.
Find an association between
AC interaction with internal
auditing and the perceived
knowledge level of AC.
ACs that grant private access
to the CIA and reviewed both
the plans and results of
internal auditing are more
likely to be perceived as
knowledgeable by CIAs.
Possibility of non-response
bias.
Survey asks respondents’
perceptions about the
knowledge level of AC.
Perceptions may differ
from reality and may be
subject to bias based on
individual experiences.

23
Table 1 (Continued): Annotated Literature Review on AC Overseeing the Quality of the Internal Audit Function
Author(s)
(Year)
Purpose/ Objective Sample & Data
Collection
Methods Main Findings Limitations & Future
Research
Raghunandan,
K., Read,
W.J., & Rama,
D.V. (2001)
Examine the association
between AC composition
and the committee’s
interaction with internal
auditing.
Obtain the names and
addresses of all publicly
held United States
manufacturing
companies with sales
greater than $250
million from CD-SEC
database.
Mail to 400 randomly
selected companies of
CIA. Receive 129
responses.
Final sample consists of
114 usable responses.
Examine 5 research
questions with five
multivariate
regression analyses.
ACs comprise solely of
independent directors and
with at least one member
having an accounting or
finance background are more
likely to: (1) have longer
meetings with the CIA (2)
provide private access to the
CIA and (3) review internal
audit proposals and results of
internal auditing.
Future research: (1) Should
examine the nature of the
relationship between ACs
and internal auditing by
delving into issues such as
personality, attitude and
character brought into the
relationship by the AC
members. (2) Examine
how the composition of
ACs without inside or gray
directors varies across
countries. (3) Compare AC
interaction with internal
auditing in various
countries.

24
Table 1 (Continued): Annotated Literature Review on AC Overseeing the Quality of the Internal Audit Function
Author(s)
(Year)
Purpose/ Objective Sample & Data
Collection
Methods Main Findings Limitations & Future
Research
Goodwin-
Stewart, J.
(2003)
Examine the separate
influence of
independence and
financial experience on
AC relations with the
internal audit function.
Use data from Australia
and New Zealand, the
study focuses on ACs
and internal audit in
both private and public
sector.
Data are collected by
means of a
questionnaire sent to
CIAs.
IIA processes the
mailing of
questionnaires with
responses being mailed
directly to the
researcher.
Final sample consists of
120 responses.
Identify differences
in responses based
on the composition
of AC, country and
sector in which the
entity operates.
Find that independence and
accounting experience have a
complementary impact on AC
relations with internal audit.
Independence is more
associated with the issue of
process while accounting
experience is associated with
the extent that the AC
reviews the work of the
internal audit function.
Small sample size may
have influenced the results.
Generalisability of the
results to other
jurisdictions may be
limited.
Future research: (1)
Studies could explore the
nature and level of
accounting expertise that
best equip AC members.
(2) The nature of AC
meetings with the CIA
could be investigated to
identify the extent of AC
reliance on the work of
internal audit.

25
Table 1 (Continued): Annotated Literature Review on AC Overseeing the Quality of the Internal Audit Function
Author(s)
(Year)
Purpose/ Objective Sample & Data
Collection
Methods Main Findings Limitations & Future
Research
Carcello, J.V.,
Hermanson,
D.R., &
Raghunandan,
K. (2005)
Investigate three factors
associated with United
States public companies’
investment in internal
auditing.
Expect the internal audit
budget to be higher when
the AC reviews the
internal audit budget.
Examine whether the
total investment in
internal audit is
associated with the
percentage of company’s
internal auditing that is
outsourced.
Address the relation
between external audit
fees and internal audit
budgets.
Data from a survey
administer to CIA of
mid-sized United States
public companies are
supplemented with
publicly available data.
Final sample consists of
217 companies.
Use OLS regression
models in the
analysis.
Internal audit budgets are
positively related to company
size, leverage, financial
service and utility industries,
relative amount of inventory,
operating cash flows and AC
review of the internal audit
budget.
Total internal audit budget
are negatively related to the
percentage of the internal
audit services.
Data are derived from a
survey of CIAs and the
study relied on the
accuracy of these
responses.
Study focuses on mid-sized
public companies and the
results might not be
generalised to other public
companies or to private
organisations.
Unmeasured factors, such
as management
characteristics may be
correlated with both
internal audit investment
and certain independent
variables.

26
Table 1 (Continued): Annotated Literature Review on AC Overseeing the Quality of the Internal Audit Function
Author(s)
(Year)
Purpose/ Objective Sample & Data
Collection
Methods Main Findings Limitations & Future
Research
Abbott, L.J.,
Parker, S., &
Peters, G.F.
(2010)
Examine the association
between the activities
performed by the internal
audit function and the
extent of AC oversight of
the internal audit
function.
Examine the association
between AC oversight
and the amount of
internal audit function
resources allocated to
internal-controls-based
activities.
Examine the allocation of
the internal audit function
budget and utilize a better
measure of the degree of
AC involvement with the
budget process.
Questionnaire is mailed
to Fortune 1000
companies after
excluding banks.
The 1st survey is sent in
July 2006 and results in
a total of 72 usable
responses. A follow-up
mailing is conducted in
September 2006 and
produces an additional
62 usable responses.
Final sample consists of
134 observations.
Survey 134 CIAs
from fortune 1000
firms regarding the
amount of internal
audit resources
allocated across
internal audit
activities in fiscal
year 2005.
Construct a
composite measure
of AC oversight
contingent on the
relative control that
the AC has over
internal audit
function via vis-à-
vis management.
AC with greater internal audit
function oversight is
associated with larger
percentages of internal audit
function hours being
allocated toward internal
controls activities.
Document significant
differences in the allocation
of internal audit budget
across different activities.
Majority of the budget is
devoted to internal controls
activities.
AC’s demand for better
internal controls may lead to
greater internal audit function
focus on internal controls.
Survey instrument captures
the CIA’s perception of
AC oversight may not
indicate the complex
relationship amount the
various stakeholders.
Do not allow study to
make causal inferences,
only to document
associations.
Response bias may reduce
the generalisable of results
and endogeneity issues
may be at play.
Future research: (1) Can
utilise the study's results to
benchmark both internal
audit resource allocations
and the degree of AC
oversight of the internal
audit function. (2) Fully
explore the internal audit
function and AC.

27
Table 1 (Continued): Annotated Literature Review on AC Overseeing the Quality of the Internal Audit Function
Author(s)
(Year)
Discussions
Cooper, B.J.
(1993)
Discuss the formation and membership of an AC in Australia. A successful AC usually comprises of three to five non-executive
directors who are able and willing to accept the responsibility, has a chairman who understands the importance of his or her position
and ensures that it maintains the confidence of management.
Discuss the relationship of AC and internal audit. The author posited that the role of the AC in an organisation has been considered
with particular emphasis on providing an internal audit perspective.
Discuss on how to improve the relationship of the AC and internal audit. Internal auditors should see the establishment and operation
of an AC as ideal opportunity to improve their service to management. However, they must be proactive and educate the committee on
the real benefits of a good internal audit function. An effective and harmonious relationship between the AC and internal audit can
have a profound beneficial effect on corporate management and control.

28
Table 1 (Continued): Annotated Literature Review on AC Overseeing the Quality of the Internal Audit Function
Author(s)
(Year)
Purpose/ Objective Sample & Data
Collection
Methods Main Findings Limitations & Future
Research
Abbott, L.,
Parker, S.,
Peters, G., &
Rama, D.V.
(2003)
Examine the association
between AC effectiveness
and internal audit
outsourcing.
Data obtain from a
survey of 219 CIAs and
from relevant proxy
statements filed in 2001.
Final sample consists of
287 usable responses.
Use regression
models to test the
hypotheses.
Companies with effective
ACs are less likely to
outsource internal auditing to
the external auditors.
Effective ACs also has
authority over the CIAs’
dismissals and has an
incrementally negative
relation with the extent of
outsourcing.
Do not differentiate
between alternative
explanations for the
findings.

29
2.5 AC Ensuring the Independence of the Internal Audit Function
2.5.1 Introduction
According to the Institute of Internal Auditors (IIA), internal auditing is an independent,
objective assurance and consulting activity designed to evaluate and improve an
organisation’s operations. Both the organisational independence of the internal audit function
and the individual objectivity of internal auditors are important features as proposed by IIA.
The standards require that the CIA report to a level within the organization that allows the
internal audit function to fulfil its responsibilities. To achieve necessary independence, best
practices suggest that the CIA should report directly to the AC or its equivalent. For day to
day administrative purposes, the CIA should report to the most senior executive (IIA, 2010).
The IIA recognises that ACs and internal auditors have interlocking goals. A good working
relationship between the internal auditors and a company’s AC is necessary. A direct channel
of communication between the CIA and the AC is required such as provisions for the CIA to
have access to the AC, to attend AC meetings, to present the audit plan, to report on the
results of major audits and key audit findings or other matters, and to discuss internal auditing
observations on risk and internal controls within the organisation (IIA, 2010). Moreover, CIA
and AC should meet regularly without the presence of senior management and the external
auditors.
The sub-sections below present, discuss and annotate the extant literature that has examined
the relationship between AC and internal audit function independence.
2.5.2 Extant Studies
Goodwin and Yeo (2001) argued that the relationship between internal audit and AC may
affect organisational independence while the use of the internal audit function as a
management training ground may affect individual objectivity. Using a survey of CIAs in
Singapore, they found that an effective AC can strengthen the position of the internal audit
function by acting as an independent forum in which internal auditors may raise matters
affecting management.

30
Moreover, in a recent study, Christopher et al. (2009) analysed the independence of the
internal audit function through its relationship with the management and the AC. Based on
survey of 34 CIAs from the Australian corporate sector, they identified a number of threats to
independence including having the CEO and CFO approve the internal audit budget and
being involved in the audit plan, not reporting functionally to the AC, the AC not having sole
responsibility for appointing and dismissing the CIA and a lack of AC accounting expertise.
In New Zealand, Van Peursem (2005) examined the internal auditor’s role and addressed how
an effective internal auditor can overcome the tension of working with management to
improve performance while also remaining sufficiently distant (independence) from
management in order to report on their performance. The results indicated that an internal
auditor’s close relationship with management can place their independence from management
at risk.
On the other hand, Schneider and Wilner (1990) examined the effects of managers’
perceptions of internal and external auditing on the potential commission of financial
reporting irregularities. The authors found that in settings where the internal audit function is
independent, in terms of reporting level, this will lead to an improved control environment
and a reduction in reporting errors results. Their findings are also supported by Grambling et
al. (2004) that independence through proper reporting relationship is viewed as the most focal
criteria.
Independence of the internal audit function may also be affected depending on whom has the
responsibility and authority for hiring and firing the CIA. McHugh and Raghunandan (1994)
found that a large majority of the internal auditors indicated that vesting hiring or firing
authority with the AC would enhance the independence of the internal audit function and
improve the ability of internal auditors to generate action on audit findings.
On the other hand, taking a cognitive perspective of internal auditor independence, Ahmad
and Taylor (2009) developed measures for the concepts of commitment to independence, role
conflict and role ambiguity in the context of the internal auditor’s work environment, in order
to provide evidence of the effect of the role conflict and ambiguity, and their sub-dimensions,
on the internal auditor’s commitment to independence. The results revealed that both role

31
ambiguity and role conflict are significantly negatively related to commitment to
independence.
2.5.3 Comparative Assessment
Based on the above studies, a discussion is now provided on the effects of AC in ensuring the
independence of the internal audit function. The results of many studies (Schneider and
Wilner, 1990; McHugh and Raghunandan, 1994; Goodwin and Yeo, 1998; Van Peursem,
2005; Christopher et al., 2009) posited that the independence of the internal audit function
plays an important role in an organisation. The broaden responsibilities of the internal audit
function within the environment of a changing business world, coupled with increasing
economic competition and globalisation are creating pressure on the internal audit function
which can jeopardise its independence (Mutchler et al., 2001).
Goodwin and Yeo (2001), Van Peursem (2005) and Christopher et al. (2009) took a similar
research approach by investigating the independence of internal audit function through the
working relationship with the management and AC. Although the three studies are conducted
in different countries (Singapore, Australia and New Zealand respectively) where the
reporting environment is different, all of the three studies produced the same results. Based
on a survey of CIAs, Goodwin and Yeo (2001) and Christopher et al. (2009) found that an
effective AC (performing all their duties) can strengthen the independence position of the
internal audit function. In addition, Van Peursem (2005) made observations, examined
documents and interviewed senior internal auditors in six New Zealand organisations to find
that internal auditors close relationship with management can place their independence at risk.
On the other hand, both Schneider and Wilner’s (1990) and Ahmad and Taylor’s (2009)
studies investigated the perception of the internal auditor independence. Schneider and
Wilner (1990) looked at the effects of managers’ perceptions of internal and external auditing
on the potential commission of financial reporting irregularities in the United States while
Ahmad and Taylor (2009) developed measures for the concepts of commitment to
independence. Schneider and Wilner (1990) found that independence through proper
reporting relationship is important. Whereas, Ahmad and Taylor’s (2009) study conducted in
Malaysia suggested that ambiguity in both the exercise of authority by the internal auditor

32
and time pressure faced by internal auditors plus conflict between the internal auditors’ and
managements’ personal values have the greatest impact on commitment to independence.
2.5.4 Tabulated Annotations
The annotated literature review on AC ensuring the independence of the internal audit
function is presented in Table 2.

33
Table 2: Annotated Literature Review on AC Ensuring the Independence of the Internal Audit Function
Author(s)
(Year)
Purpose/ Objective Sample & Data
Collection
Methods Main Findings Limitations & Future
Research
Goodwin-
Stewart, J., &
Yeo, T.Y.
(2001)
Argue that the
relationship between
internal audit and AC
may affect organisational
independence while the
use of the internal audit
function as a management
training ground may
affect individual
objectivity.
A total of 80
questionnaires are
mailed, 27 to CIAs of
listed companies and 53
to CIAs of unlisted
companies. A total of 65
responses are received.
Data are collected
by means of a
questionnaire sent
to CIAs of both
listed and unlisted
companies in
Singapore.
A strong relationship between
the AC and the internal audit
function is found, with the
level of interaction being
greater when AC is
comprised solely of
independent directors.
The use of the internal audit
function as a management
training ground is also found
to be quite widespread in
Singapore.
All respondents are
members of the IIA and
hence there may be a bias
towards those who are
career internal auditors
rather than manager who
are only temporarily
employed as internal
auditors.
The sample size is
relatively small, possibly
leading to non-significant
results.
Future research: An
analysis of the interaction
between internal audit and
AC will provide a
complete picture.

34
Table 2 (Continued): Annotated Literature Review on AC Ensuring the Independence of the Internal Audit Function
Author(s)
(Year)
Purpose/ Objective Sample & Data
Collection
Methods Main Findings Limitations & Future
Research
Christopher,
J., Sarens, G.,
& Leung, P.
(2009)
Analyse critically
whether internal audit
function in practice are
operating independently,
in line with theoretical
best practice guidelines.
The questionnaire is
electronically
distributed as an
attachment to an e-mail
cover letter sent by IIA
Australia to their list of
CIAs in the corporate
sector. This represents a
sample size of 206. A
total of 34 responses are
received, representing a
response rate of 17 per
cent.
Results are based on
a critical
comparison of
responses from
questionnaires sent
to Australian CIAs
versus existing
literature and best
practice guidelines.
With respect to the
relationship with the AC,
significant threats identified
include CIAs not reporting
functionally to the AC; the
AC not having sole
responsibility for appointing,
dismissing and evaluating the
CIA; and not having all AC
members or at least one
member qualified in
accounting.
Limited number of
respondents can be an
impediment to
generalisation of the
results.
Questionnaire is only sent
to IIA members.
Different levels of
independence threats are
considered to exert the
same level of impact,
though it can be reasonably
assumed that some threats
exert a stronger influence
than others.
Future research: Undertake
research in other countries
to identify whether the
findings of this study are a
worldwide phenomenon or
a localised issue.

35
Table 2 (Continued): Annotated Literature Review on AC Ensuring the Independence of the Internal Audit Function
Author(s)
(Year)
Purpose/ Objective Sample & Data
Collection
Methods Main Findings Limitations & Future
Research
Van Peursem,
K.A. (2005)
Examine the New
Zealand internal auditor’s
role and conceptualise on
the auditor’s influence
over the role and how an
effective internal auditor
can overcome the tension
of working with
management to improve
performance while also
remaining sufficiently
distant from management
in order to report on their
performance.
Six New Zealand
organisations.
An Eisenhardt-
inspired multiple
case-based
approach is applied
in which the
researcher make
observations,
examined
documents and
interviewed senior
internal auditors in
six NZ
organisations.
Three concepts characteristics
of those who best balanced
their role: the internal
auditor’s external
professional status, the
presence of a formal an
informal communication
network and the internal
auditor’s place in determining
their own role. Informing
these concepts is the auditor’s
ability to manage ambiguity.
Qualitative study generally
is less objectively-
measured.
Future research: (1)
Explore each source of
influence in more detail
and in different contexts
and examine the
framework’s application
elsewhere. (2) Gender
studies may be of value.

36
Table 2 (Continued): Annotated Literature Review on AC Ensuring the Independence of the Internal Audit Function
Author(s)
(Year)
Purpose/ Objective Sample & Data
Collection
Methods Main Findings Limitations & Future
Research
Schneider, A.,
& Wilner, N.
(1990)
Examine the effects of
managers’ perceptions of
internal and external
auditing on the potential
commission of financial
reporting irregularities.
Test whether the
deterrence effects of
internal and external
auditing are similar.
A total of 264 subjects,
the vast majority of
whom are experienced
managers, make
decisions on three cases
involving financial
reporting issues.
Use the quantitative
randomized
response technique.
The results support internal
and external auditing as
deterrents to financial
reporting irregularities when
all of the following four
conditions are present:
material dollar amounts,
irregularities involving asset
overstatements, unambiguous
GAAP violations and less
incentive for misstating
income.
Internal auditing effects are
similar to those external
auditing.
Lack of significance
obtains for some of the
statistical tests.
Despite the authors’ effort
to assure anonymity by
means of using the
randomized response
technique, some subjects
still may have been
reluctant to report
truthfully.
Inability to explain why
the existence of audits is
perceived as having
deterrent effect.
Be careful about the
generalisability of the
results.

37
Table 2 (Continued): Annotated Literature Review on AC Ensuring the Independence of the Internal Audit Function
Author(s)
(Year)
Purpose/ Objective Sample & Data
Collection
Methods Main Findings Limitations & Future
Research
McHugh, J., &
Raghunandan,
K. (1994)
Examine how CIAs are
hired and fired.
Final sample consists of
471 usable responses.
Responses from internal
auditors from
governmental and non-
profit organizations are
not included in this
analysis since they
differ substantially from
for-profit entities.
Responses from
companies without an
AC are also deleted.
A questionnaire is
mailed to a
randomly selected
list of 1,000 CIAs
with the help of the
IIA.
A large majority of the
internal auditors indicate that
vesting hiring or firing
authority with the AC would
enhance the independence of
the internal audit function,
reduce oversight by the AC
and improve the ability of
internal auditors to generate
action on audit findings.

38
Table 2 (Continued): Annotated Literature Review on AC Ensuring the Independence of the Internal Audit Function
Author(s)
(Year)
Purpose/ Objective Sample & Data
Collection
Methods Main Findings Limitations & Future
Research
Ahmad, Z., &
Taylor, D.
(2009)
Develop measures for the
concepts of commitment
to independence, role
conflict and role
ambiguity in the context
of the internal auditor’s
work environment.
The sample is drawn
from the database of the
IIAM in which listed
companies with an in-
house internal audit
function are extracted.
A total of 101 useable
responses are obtained.
To measure these
concepts, scales are
developed for a
questionnaire by
drawing on
measures
established in the
organizational
behaviour literature
and adapting these
to the internal
auditor’s context.
Both role of ambiguity and
role of conflict are
significantly negatively
related to commitment to
independence.
The underlying dimensions
found to have the greatest
impact on commitment to
independence are: first,
ambiguity in both the
exercise of authority by the
internal auditor and time
pressure faced by internal
auditor, and second, conflict
between the internal auditor’s
personal values and both
management’s and their
profession’s expectations and
requirements.
Future research: (1)
Outsource internal auditor
should be considered. (2)
Other independent
variables could be
modelled. (3) Alternative
research methods (an
experimental design) could
provide considerable
refinement to the
understanding of the
relationships between the
variables in this study.

39
2.6 AC Facilitating the Quality of the External Audit
2.6.1 Introduction
This study examines the association between the effectiveness of AC roles and the quality of
external audit using audit fees. Francis (2004) argued that a higher audit fees imply higher
audit quality. A higher audit quality should improve the quality of financial reporting and
reduce the risk of the external auditors providing an incorrect audit opinion (Goodwin and
Kent, 2006).
An AC may be expected to exert two-way pressure on audit fees (Collier and Gregory, 1996).
The association of AC with external audit can be explained either from the demand for audit
services by the client or the supply of audit services by the external auditors. The demand
side of the argument suggests that ACs are likely to demand higher quality of audit because
ACs will ensure that the audit hours are not reduced to a level where the quality of audit
would be compromised and may also require additional work to be performed by the external
auditors.
For example, ACs might insist that the external auditors set the materiality limit at a lower
level resulting in increased testing (Goddard and Masters, 2001). Evaluating the scope of
external auditors’ audit plan, work and conclusions, is highly regarded as a vital role of the
AC by the Cadbury Committee (1992), Blue Ribbon Committee (1999) and ASX CGC
(2007). AC members also have incentives to ensure a high quality audit in order to reduce the
risk of litigation and loss of reputation in the event of fraudulent financial reporting
(Goodwin and Kent, 2006). Thus, under this approach, stronger ACs will be willing to incur
greater total audit fees to ensure a higher level assurance.
On the other hand, from the supply side of the argument, ACs may reduce the audit fees at
the same time. One of the AC’s roles is to oversee and review the internal controls within the
company. The AC’s involvement in tightening internal controls might help to reduce the
assessed level of control risk and substantive testings by the external auditors and hence lead
to a lower audit fees (Goodwin and Kent, 2006).
However, the two-way pressure (demand and supply) exerted by the ACs on audit fees could
cancel out, causing no observed relationship. O’Sullivan (1999) provided evidence that the

40
board and AC characteristics do not influence external auditors’ pricing decisions due to the
conflicting pressures of the demand and supply theories on the audit fees. Furthermore, it
could be argued that the quality of AC characteristics is positively related to audit fees
because an increase in audit hours will result from the need for the audit partner to liaise
regularly with the AC, attend AC meetings throughout the year and prepare reports for the
committee. Carcello et al. (2002), Abbott et al. (2003), Goodwin and Kent (2006), Singh et al.
(2009) and Hoitash and Hoitash (2009) each give evidence on the relationship between ACs’
characteristics and audit fees from the demand rather than supply of audit services. Therefore,
this study is only able to examine the net effect of these two conflicting pressures.
The sub-sections below present, discuss and tabulate studies that have examined the
relationship between AC and audit fees.
2.6.2 Extant Studies
Two Australian studies examined the impact of AC on audit fees. Using a sample drawn from
all companies listed on the ASX, Goodwin and Kent (2006) examined whether the existence
of an AC, AC characteristics and the use of internal audit are associated with higher external
audit fees. The authors found that the existence of an AC, more frequent committee meetings
and increased use of internal audit are related to higher audit fees. Also, the authors found
that expertise of AC members is associated with higher audit fees when meeting frequency
and independence are low. Moreover, Singh and Newby (2010) extended Goodwin and Kent
(2006)’s study by using year 2005 publicly available information to analyse the relationship
between internal audit and audit fees. The authors used given data for internal audit existence
(proxy for internal audit activities) from secondary resources. Their findings supported
Goodwin and Kent (2006)’s study.
Using 1991 United Kingdom data, Collier and Gregory (1996) seek to establish whether ACs
are effective in ensuring audit quality by protecting the auditors from fee cuts which might
affect audit quality and signal tighter internal controls which help to reduce audit time and
hence audit fees. They found that the relationship between size-related audit fees and the
presence of an AC is positive, although they found only weak support for a decreasing effect
based on the risk and complexity-related audit fees.

41
In post-Cadbury regulation reform, Goddard and Masters (2001) tested the relationship
between size of the audit fees and the existence of an AC for United Kingdom companies for
the years ending in 1994 and 1995. The results of the study showed no evidence that ACs
have any overall effect on audit fees. However, the authors also found inconclusive and
conflicting results on complexity and risk-related audit fees and the existence of an AC.
In addition, in a more recent United Kingdom study, Zaman et al. (2011) examined the
influence of AC effectiveness, a proxy for governance quality on audit fees using a new
composite measure comprising AC independence, expertise, diligence and size. The study
used the UK FTSE-350 which represented a good mix of large and relatively small United
Kingdom companies during the period 2001-2004. The findings indicated that after
controlling for board of director characteristics, there is a significant positive association
between AC effectiveness and audit fees only for larger client.
In a New Zealand setting, Rainsbury et al. (2009) investigated the association between the
quality of ACs and financial reporting quality and external audit fees, respectively, in an
environment where the formation of ACs was unregulated. The study used a sample of 87
firms and the result showed no significant association between the quality of an AC and the
level of fees paid to external auditors. The authors posited that the benefits of ‘best practice’
ACs may be less than anticipated by regulators and policy markers.
On the other hand, in Israel, Lifschutz et al. (2010) examined the association between
corporate governance characteristics and external audit fees in large public companies. Using
a sample size of 100 largest companies, the authors found that AC diligence (number of
meetings) is positively and significantly associated with audit fees. The results are consistent
with the demand-based perspective of audit services, wherein firms with strong corporate
governance characteristics demand additional assurance from the auditors and higher quality,
resulting in higher external audit fees.
In the United States, Carcello et al. (2002) studied the relations between board characteristics
and AC characteristics and audit fees for Fortune 1,000 companies audited by Big 6 auditors.
They found that significant positive relations between audit fees and AC independence,
diligence and expertise. Also, Abbott et al. (2003) examined the relationship between AC and

42
audit fees for a sample 492 non-regulated American firms audited by Big 5 auditors. They
found that AC independence and financial expertise are positively related with audit fees but
found no significance for AC meetings.
In the post Sarbanes Oxley Act (SOX) period, Hoitash and Hoitash (2009) examined the
association between AC characteristics and auditor’s compensation and dismissals using a
large sample of 2,393 public companies audited by large and small auditors. It is observed
that strong ACs demand higher level of assurance and is less likely to dismiss their auditors.
Further, an increase is found in auditor’s independence as measured by reduced board
involvement and less dismissals following an unfavourable audit opinion.
Last but not least, Yatim et al. (2006) examined the association between external audit fees
and board and AC characteristics of 736 Malaysian listed firms. Contradictory to other
studies, Yatim et al. (2006) hypothesised that good AC characteristics reduce auditor’s
assessments, resulting in lower audit fees. The authors found that external audit fees are
negatively and significantly related to board independence, AC expertise and the frequency
of AC meetings.
2.6.3 Comparative Assessment
Based on the discussion above, the results of the previous studies are mixed. Most studies
show that the quality of AC characteristics are positively related to the level of audit fees
(Carcello et al., 2002; Abbott et al., 2003; Goodwin and Kent, 2006; Yatim et al., 2006;
Hoitash and Hoitash 2009; Lifschutz et al., 2010; Singh and Newby, 2010; Zaman et al.,
2011) while others find no significant association (Goddard and Masters, 2001; Rainsbury et
al., 2009).
The finding of Goddard and Masters (2001) are much different from the rest of the studies
conducted because the authors investigated the effect of AC on audit fees adherence to the
Cadbury Committee Report recommendations of 1992 by using data collected from financial
reports for the years ending in 1994 and 1995. It could be argued that the effect of
environmental changes is likely to increase the quality of all audits, irrespective of the
presence of an AC.

43
Rainsbury et al. (2009) also found no significant association between the quality of an AC
and the level of fees paid to external auditors in New Zealand. The authors tested a sample of
87 firms including 29 that have adopted a high quality AC in an environment where the
formation of AC was unregulated. Thus, their study is subjected to data availability and a
small sample size which may cause the results to be insignificant. Moreover, the study only
focused on AC membership in terms of independence and expertise but a number of other
AC attributes such as business backgrounds of the members and the number of years they
have served on the AC have not been tested (Rainsbury et al., 2009).
On the other hand, Collier and Gregory (1996) found the relationship between size-related
audit fees and the presence of an AC is positive but found only weak support for a decreasing
effect based on the risk and complexity-related audit fees. The difference between the two
results may be due to difference in variable definition. Moreover, Collier and Gregory (1996)
conducted their study using 1991 data and great transformation have taken place in the audit
setting since then that their findings are less applicable in current today’s environment.
2.6.4 Tabulated Annotations
The annotated literature review on AC facilitating the quality of the external audit is
presented in Table 3.

44
Table 3: Annotated Literature Review on AC Facilitating the Quality of the External Audit
Author(s)
(Year)
Purpose/ Objective Sample & Data Collection Methods Main Findings Limitations & Future
Research
Goodwin-
Stewart,
J., &
Kent, P.
(2006)
Examine whether in
an Australian
setting, the existence
of an AC, AC
characteristics and
the use of internal
audit are associated
with a higher level
of audit fees.
A questionnaire is sent to all
companies listed on the ASX
in October 2000
(approximately 1400
companies), seeking
information on their internal
audit activities.
Collect data from the annual
reports which included both
financial variables relating to
size, profitability, risk and
audit fee and non-financial
variables concerning corporate
governance, external audit, and
the complexity of the entity.
Final sample consists of 401
companies.
To test hypotheses,
the study uses a
number of ordinary
least squares (OLS)
regression models,
extending the
traditional audit fee
model.
The existence of an AC is
associated with a higher level
of audit fees.
More frequent AC meetings
are associated with higher
audit fees.
Committee independence and
accounting and finance
expertise are not significantly
associated with audit fees.
Expertise is associated with
higher audit fees when both
meeting frequency and
independence are low.
The use of internal audit is
associated with higher external
audit fees.
The number of employees
in internal audit may not be
a good measure of the use
of internal audit as it do not
take into account the use of
outsourcing or of
secondment of employees
into internal audit on a
temporary basis.
Future research: (1) More
refined measures of
independence, expertise and
diligence of AC members.
(2) Need to distinguish
between supply side and
demand side effects on audit
fees and to unravel the
complex interrelationships
between the various
monitoring mechanisms.

45
Table 3 (Continued): Annotated Literature Review on AC Facilitating the Quality of the External Audit
Author(s)
(Year)
Purpose/ Objective Sample & Data Collection Methods Main Findings Limitations & Future
Research
Singh, H.,
& Newby,
R. (2010)
Examine the
direction of the
relationship between
a firm’s internal
audit function and
its external audit
fees, extending
previous study by
Goodwin-Stewart
and Kent (2006).
Data are gathered from the
annual reports of the top 300
publicly listed companies in
Australia during the year 2005.
Hypotheses are
tested via ordinary
least squares (OLS)
regression with
identical control
variables similar to
those used by
Goodwin and Kent
(2006).
For the OLS
regression models,
the existence of an
internal function
proxy for internal
audit usage came
from secondary
sources.
The findings support Goodwin
and Kent (2006)’s result that
the existence of an internal
audit function in a firm has a
significantly positive
relationship with audit fees. In
fact, the strength of this
relationship has increased
since 2000.
The study focuses on the
top 300 public companies
from a market capitalisation
perspective and, therefore,
the results may not be
generalisable to other
smaller public companies or
to private firms.
Dichotomous experimental
variable used in the study
might not be an ideal
measure of internal audit
usage since it may not be
sensitive enough to capture
all the variation in external
audit fees.

46
Table 3 (Continued): Annotated Literature Review on AC Facilitating the Quality of the External Audit
Author(s)
(Year)
Purpose/ Objective Sample & Data Collection Methods Main Findings Limitations & Future
Research
Collier,
P., &
Gregory,
A. (1996)
Seek to establish
whether ACs are
effective in ensuring
audit quality by
protecting the
auditors from fees
cuts which might
affect audit quality,
and signal tighter
internal controls
which help to reduce
audit time and hence
audit fees.
The sample is
constructed by sending
questionaries on ACs to all
firms which are members of
the Financial Times All Share
Index (FTASI) in
December 1991 and for which
accounting records (on the
Stock Exchange
Micro-Fiche Service) are
available for the years ended in
1991, 1990 and 1989.
Final sample consists of 315
responding firms.
The hypotheses are tested
by developing a regression
model for the audit fees.
Quality aspect of the audit
can be captured through a
dummy firm size variable,
whilst the internal control
aspects can be captured
through dummy risk and
complexity variables.
The relationship
between size-related
audit fees and the
presence of an AC is
positive and statistically
significant, but that
although there is a
negative relationship
between risk-related
and complexity-related
audit fees and the
presence of an AC, the
relationships are not
conclusively
significant.
The findings provide
support for the
contention that ACs are
at least partially
effective in preventing
reductions in the audit
fee to levels where the
quality of the audit may
be compromised.
Non-response tests clearly
show some size bias in
responding companies,
although there is no
evidence of any industry
bias. Nevertheless, given
sample size, the authors
believe that this size bias is
unlikely to be a serious
problem.

47
Table 3 (Continued): Annotated Literature Review on AC Facilitating the Quality of the External Audit
Author(s)
(Year)
Purpose/ Objective Sample & Data Collection Methods Main Findings Limitations & Future
Research
Goddard,
A. R., &
Masters,
C. (2001)
Report an analysis
of the relationship
between the size of
the audit fees and
the existence of an
AC.
Investigate the effect
on audit fees of AC
adherence to the
Cadbury Committee
Report
recommendations of
1992.
Data is collected from financial
reports for the years ending
in1994 and 1995.
The population test consists of
companies listed on the Stock
Exchange and included in the
Times 1,000 of 1996,
excluding the top 350.
Final sample consists of 233
companies in 1994 and 223 in
1995, nine companies having
ceased to exist in the interim.
Data is analysed using two
multiple regression models.
ACs have been through a
transitional phase
comprising changes to the
general audit environment
and a learning phase for the
establishment and operation
of committees.
By 1995 there is no
evidence that ACs, whether
adhering to the Cadbury
Code or not, have any
overall effect on audit fees.
The only effect found is a
reduction in fees due to
improved internal controls
in the presence of auditee’s
complexity.
There is evidence that size
is the main determinant of
the presence of an AC.

48
Table 3 (Continued): Annotated Literature Review on AC Facilitating the Quality of the External Audit
Author(s)
(Year)
Purpose/ Objective Sample & Data Collection Methods Main Findings Limitations & Future
Research
Zaman,
M.,
Hudaib,
M., &
Haniffa,
R. (2011)
Extend prior
research on the
relationship between
governance quality
and auditor
remuneration.
Examine the
influence of AC
effectiveness, a
proxy for
governance quality
on audit fees and
non-audit services
fees using a new
composite measure
comprising AC
independence,
expertise, diligence
and size.
The population of the study is
the UK FTSE-350 which
represented a good mix of
large and relatively small UK
companies during the period
2001-2004.
The final sample consists of
non-financial UK FTSE-350
companies with a total number
of 540 company year
observations.
Use a number of ordinary
least squares regression
models to help to explore
further the various
relationship between AC
effectiveness and audit fees
and non-audit fees while
controlling for other
variables.
After controlling for board
of director characteristics,
there is a significant
positive association between
AC effectiveness and audit
fees only for larger clients.
Indicate that effective ACs
undertake more monitoring
which results in wider audit
scope and higher audit fees.
Findings support regulatory
initiatives aimed at
improving corporate
governance quality.
Use only four factors in
the composite measure
of AC effectiveness in
different regulatory and
institutional contexts.
Use dichotomous
measure of financial
expertise, coded 1 if at
least one member in the
AC has financial
expertise, and 0 other
wise.
The definition of
financial expertise is
perhaps too broad and
encompasses skills that
may not necessarily
contribute to AC
effectiveness.

49
Table 3 (Continued): Annotated Literature Review on AC Facilitating the Quality of the External Audit
Author(s)
(Year)
Purpose/ Objective Sample & Data
Collection
Methods Main Findings Limitations & Future
Research
Rainsbury,
E.A.,
Bradbury,
M., &
Cahan,
S.F.
(2009)
Examine firms that
voluntarily adopt a
high quality AC in
an environment,
New Zealand, where
prior to 2003, the
formation of ACs is
completely
unregulated.
Examine whether
New Zealand firms
with high quality
ACs in 2001 has
higher financial
reporting quality and
lower external audit
fees than New
Zealand firms with a
lower quality AC or
no AC.
The population of interest
is all NZ companies listed
on the NZX main trading
board in the 2001 Datex
Investment Guide.
Final sample consists of 87
firms.
Financial and AC
membership data are hand
collected from the 2001
annual reports of the
sampled firms.
Measure AC quality based on
the quality of its membership
using guidelines that were
issued by the New Zealand
Securities Commission (NZSC)
in 2004.
Measure financial reporting
quality by adopting five
accounting choices (estimated
useful life of buildings,
estimated useful life of motor
vehicles, goodwill
amortization, tax effect
accounting and assigning costs
to inventory) and then use these
to create an accounting quality
score.
No significant association
between the quality of an
AC and the quality of
financial reporting. These
results are robust to
alternative measures of
earnings quality.
The quality of ACs have
little impact on the level of
fees paid to external
auditors.
The results suggest that the
benefits of ‘best practice’
ACs may be less than
anticipated by regulators
and policymakers.
Focus on AC
membership in terms of
independence and
expertise, but a number
of other AC attributes
such as the business
backgrounds of the AC
members and the
number of years they
have served on the AC
have not been tested.

50
Table 3 (Continued): Annotated Literature Review on AC Facilitating the Quality of the External Audit
Author(s)
(Year)
Purpose/ Objective Sample & Data
Collection
Methods Main Findings Limitations & Future
Research
Lifschutz,
S., Jacobi,
A., &
Feldshtein,
S. (2010)
Examine the
association between
corporate
governance
characteristics and
external audit fees in
large public
companies in Israel.
The sample includes 100
largest public companies
on the Tel-Aviv 100 Stock
Exchange Index with the
exception of banks,
insurance companies and
dual-listed companies
which have a distinct
financial reporting.
Use multiple regressions to test
the hypotheses of the study.
Show that board
independence and AC
diligence are positively and
significantly associated with
audit fees.
Small sample cover one
year of Israeli data.
The results may not be
generalised over
different time period
and countries.
Only a few corporate
governance variables
were tested.
Future research: Other
variables such as
managerial ownership
and internal control can
be considered.

51
Table 3 (Continued): Annotated Literature Review on AC Facilitating the Quality of the External Audit
Author(s)
(Year)
Purpose/ Objective Sample & Data
Collection
Methods Main Findings Limitations & Future
Research
Carcello,
J.V.,
Hermanson,
D.R., Neal,
T.L., &
Riley JR,
R.A. (2002)
Examine the
relations between
three board
characteristics
(independence,
diligence and
expertise) and Big 6
audit fees for
Fortune 1000
companies.
A questionnaire is sent to
the controllers of all
Fortune 1000 companies
asking them to provide the
amount of their external
audit fee for the fiscal year
ended between April 1992
and March 1993.
Use single-equation approach
to test the hypotheses.
There is a significant
positive relation between
audit fees and board
independence, diligence
and expertise.
The results persist when
similar measures of AC
“quality” are included in
the model.
The sample is limited
to very large public,
non-financial
companies and the
extent to which the
results apply in other
settings is uncertain.
There may be
exogenous factors at
the entity level that are
correlated both with the
board characteristics.
Could not rule out the
possibility that a more
independent, diligent
and expert board
simply exhibits less
price resistance.

52
Table 3 (Continued): Annotated Literature Review on AC Facilitating the Quality of the External Audit
Author(s)
(Year)
Purpose/ Objective Sample & Data
Collection
Methods Main Findings Limitations & Future
Research
Abbott, L.J.,
Parker, S.,
Peters, G.F., &
Raghunandan,
K. (2003)
Examine the
association between
certain AC
characteristics
(independence,
financial expertise
and meeting
frequency) and one
economic aspect of
the auditor-
management
relationship, audit
fee.
Examine a sample of 492
non-regulated, Big 5-
audited firms that filed
proxy statements with the
SEC in the period from
February 5, 2001 to Jun3
30, 2001.
Use cross-sectional regression
model to examine the
association between AC
characteristics and audit fees.
AC independence (defined
as an AC comprised
entirely of outside,
independent directors) and
financial expertise (defined
as an AC containing at
least one member with
financial expertise) is
significantly, positively
associated with audit fees.
Meeting frequency
(defined as an AC that
meets at least four times
annually) is not associated
with higher audit fees at
conventional levels.
Future research: (1)
Incorporating actual
audit hours and AC
characteristics can
shed additional light
on which of the two
explanations drive the
higher audit fees. (2)
Emphasise subsequent
changes in other
corporate governance
mechanisms that may
be either complements
or substitutes for AC
activities. (3) Focus of
research in this area
may shift to an
exploration of AC
processes and decision
making.

53
Table 3 (Continued): Annotated Literature Review on AC Facilitating the Quality of the External Audit
Author(s)
(Year)
Purpose/ Objective Sample & Data
Collection
Methods Main Findings Limitations & Future
Research
Hoitash,
R., &
Hoitash,
U. (2009)
Examine the
association between
AC characteristic
and auditor related
decisions following
the mandated
changes in its
composition and
responsibilities.
Use large sample
comprises of 2,393 public
companies audited by large
and small auditor with
complete data for fiscal
year 2004.
Define AC expertise as the
percentage of experts on the
AC (PFE); AC size is measure
as the number of board
members on the AC (ACSIZE);
and AC diligence is measure by
the number of AC meetings
(ACMEETING).
Construct composite measure
for the overall strength of the
board using size, independence
and the frequency of board
meetings.
Financial experts are
associated with higher audit
fees.
AC size and the frequency
of AC meetings are
positively associated with
audit fees.
The measure of the board of
directors is not associated
with audit fees.
Strong ACs might choose to
authorize less non-audit
services, possibly in order
to contribute to the
perception of auditors’
independence.
Observe stronger ACs are
less likely to dismiss their
auditors and there is no
association between the
issuance of new going
concern reports and auditor
dismissals.
Audit fees are
determined based on
the supply and the
demand for audit
services. Not able to
detangle the impact of
the demand and supply
on audit fees but rather
measure their combined
effect.
Audit fees are used as a
level of proxy for the
level of assurance
which might not fully
measure the quality of
work performed by
auditors.
Dismissal decisions are
often reached jointly by
auditors and their
clients. Inability to
fully observe these
decisions might bias
results.

54
Table 3 (Continued): Annotated Literature Review on AC Facilitating the Quality of the External Auditors
Author(s)
(Year)
Purpose/ Objective Sample & Data
Collection
Methods Main Findings Limitations & Future
Research
Yatim, P.,
Kent, P., &
Clarkson, P.
(2006)
Examine the association
between external audit
fees and board and AC
characteristics of 736
Malaysian listed firms.
The sample
comprises of the
Bursa Malaysia non-
financial public
listed companies in
year 2003.
Multiple regression analysis is
used to estimate the
relationships proposed in the
hypotheses.
External audit fees are
positively and significantly
related to board
independence, AC
expertise and the frequency
of AC meetings.
There is a strong negative
association between
external audit fees and
Bumiputra-owned firms.
Cannot be generalised
and should be
interpreted in the
context of the
Malaysian corporate
environment,
particularly where
ethnicity is concerned.
The financial and
corporate data employ
in this study and the
findings thereafter may
not completely explain
the link between
governance variables
and external audit fees
as other variables such
as detailed ownership
structures are likely to
better explain the
relationship.

55
2.7 AC Ensuring the Independence of the External Auditors
2.7.1 Introduction
In an organisation, the responsibilities of the external auditors are to review the annual
financial reports, monitor and verify the actions of management and express an independent
audit opinion to the shareholders of the company. In order to reduce agency costs from the
separation of ownership between the management and shareholders, it is in the shareholders’
best interest to employ the external auditors. Therefore, external auditors must be
independent from the company’s financial report, ownership structures and internal controls.
Although shareholders ultimately appoint the external auditors, management’s influence in
the decision process regarding the initial appointment and subsequent reappointment of the
external auditors, shareholders are concerned about the independence of the auditors in
protecting their interest (Firth, 1997). Since, the independence of external auditors will be
hard to observe, shareholders will depend on the auditor’s good reputation, professional
bodies, regulators and audit fees to monitor the external auditors. Fees paid to external
auditors consist of audit fees as well as fees paid for other services. While all fees potentially
create economic bonds between the auditor and the client, critics have alleged that the
provision of non-audit services gives audit firms incentives to agree with management
accounting choices, thus reducing auditor’s independence and ultimately the quality of
financial reporting (Coulton et al., 2007).
The sub-sections below present and assess previous papers that have investigated the
relationship between AC and the independence of the external auditors and a summary table
of annotated literature review is also presented.
2.7.2 Extant Studies
Previous studies have examined the economic bond (i.e., non-audit service fees) between the
audit firm and its client (DeAngelo, 1981; Prakash and Venable, 1993; Firth, 1997; Frankel et
al., 2002; Ashbaugh, 2003). These studies used the ratio of non-audit fees to total audit fees
as the measure of the economic bond. The provision of non-audit services to audit client
(management) will increase the economic bond between the auditor and the client. This can
compromise the external auditor independence. DeAngelo (1981) examined whether audit

56
fees below total current costs on initial audit engagements (‘low balling’) impairs auditor
independence. The author defined audit quality as the probability of detecting errors and the
probability of reporting the errors. These attributes are analogous to competence and
independence, respectively. The results of the study showed that ‘low balling’ does not
impair independence.
Using the ratio of non-audit service fees to audit fees as a proxy of the independence of
external auditors, Prakash and Venable (1993) investigated the effects of agency incentives
and knowledge spill-overs in joint engagements for audit and non-audit services. The
frequency of non-audit service is expected to reflect knowledge spill-overs from joint
engagements and the level of economic bonding between the auditor and the company. They
found that firms with higher agency costs are likely to purchase higher level of audit quality
and thus limit the demand for non-audit services purchases from their current auditor.
Moreover, Firth (1997) developed a model that seeks to explain a company’s decision to hire
non-audit services from the auditor. The author argued that companies faced with potentially
high agency costs will purchase relatively smaller amounts of non-audit services from their
auditors. This is because high agency cost companies need independent auditors in order to
reassure investors and creditors.
In the United States, Frankel et al. (2002) examined whether the audit fees are associated
with earnings management and market reaction to the disclosure of auditor. Using data
collected from proxy statements, the authors found that non-audit fees are positively
associated with small earnings surprises and the magnitude of discretionary accruals while
audit fees are negatively associated with these earnings management.
Moreover, Ashbaugh et al. (2003) challenged the findings of Frankel et al. (2002) by using a
different research approach in their study, adjusting discretionary current accruals for firm
performance. In contrast to Frankel et al. (2002), the authors found no relation between
positive discretionary accruals and any of the auditor fees when discretionary accruals are
adjusted for firm performance and sample firms are partitioned by income increasing versus
income decreasing accruals. They also found no systematic evidence that auditors violate
their independence as a result of clients purchasing relatively more non-audit services.

57
Prior to SOX, Abbott et al. (2003) examined the association between AC characteristics and
the ratio of non-audit service fees to audit fees. Using a sample of 538 firms, the authors
found that ACs comprised solely of independent directors, meet at least four times annually
are significantly and negatively associated with the non-audit service fees ratio. This
evidence is consistent with AC members perceiving a high level of non-audit service fees in a
negative light and taking action to decrease the non-audit service fees ratio.
Meanwhile, in the post SOX period, Hoitash and Hoitash’s (2009) study investigated the
association between AC characteristics and non-audit service fees. They hypothesized that
there is an inverse relationship between the non-audit fees to total fees ratio and indicators of
stronger ACs. Similar to the findings of Abbott et al. (2003), the authors found that strong
ACs might choose to authorize less non-audit services, possibly in order to contribute to the
perception of auditor independence.
In a recent Australian study, Lary and Taylor (2011) examined the association between AC’s
governance characteristics and their role effectiveness. The sampling frame is Australian
listed companies, over the year 2004 to 2009, consisting of 180 observations. The results of
the study showed that greater AC diligence, but not independence or competence is
significantly related to lower non-audit fees ratio (higher independence of external auditors).
Moreover, in the United Kingdom, Zaman et al. (2011) examined the influence of AC
effectiveness, a proxy for governance quality on non-audit fees using a new composite
measure comprising AC independence, expertise, diligence and size. The study used the UK
FTSE-350 which represented a good mix of large and relatively small UK companies during
the period 2001- 2004. The authors found that the association between AC effectiveness and
non-audit fees to be positive and significant, especially for larger clients. This suggested that
a larger client is more likely to purchase non-audit services even in the presence of effective
ACs, probably due to the complexity of the client’s activities.
2.7.3 Comparative Assessment
The results of DeAngelo (1981), Prakash and Venable (1993), and Firth (1997) indicated that
non-audit service fees can threaten the independence of external auditors. Moreover, the
results of prior studies in the pre and post SOX periods (Abbott et al., 2003; Hoitash and

58
Hoitash, 2009; Lary and Taylor, 2011; Zaman et al., 2011), suggested that good AC
characteristics will enable the AC to actively monitor and influence the firm’s non-audit
service fees purchase decisions.
DeAngelo (1981) developed a model to test the hypothesis that the higher the economic bond
between the audit firm and client (management), the higher the audit firm’s dependence on
the client. Prakash and Venable (1993) and Firth (1997) respectively used the same method
by applying the ratio of non-audit service fees to audit fees (proxy of external auditor’s
independence) and tested whether management manage the level of non-audit service fees
purchased from their current auditor. Both consistently find that firms with higher agency
costs are likely to purchase a higher level of audit quality and thus limit the demand for non-
audit services purchases from their auditor.
Furthermore, motivated by regulatory action and criticism of non-audit service fees, Frankel
et al. (2002) and Ashbaugh et al. (2003) have used indicators of earnings management and
market reaction as a proxy for differences in the quality of financial reporting. The results of
Ashbaugh et al.’s (2003) discretionary accruals tests differ from Frankel et al. (2002) because
the authors used a different research method to identify the extent of possible accounting
manipulation where discretionary current accruals for firm performance are adjusted.
Moreover, Frankel et al.’s (2003) results are sensitive to sample selection and governance
attributes. There is also a possibility that the sharply increased regulatory focus
accompanying the statutory disclosure of United States’s audit and non-audit service fees
might have encouraged the management to manipulate some of the fees beyond what may
have otherwise occurred.
However, neither of these studies examines the relationship between AC characteristics and
non-audit service fees purchases. The role of an AC is to ensure the independence of external
auditors by monitoring the extent of non-audit service fees supplied by the auditor to the
management. Currently, there are four studies (Abbott et al., 2003; Hoitash and Hoitash,
2009; Lary and Taylor, 2011; Zaman et al., 2011) that examine these association. Although
Abbott et al.’s (2003) study is conducted in the pre-SOX period and Hoitash and Hoitash’s
(2009) study is conducted in the post-SOX period, both studies consistently found the same
results. This is evident that indicators of strong ACs are associated with a lower ratio of non-

59
audit service fees to total audit fees. On the other hand, the findings of two more recent
studies are different. Lary and Taylor (2011) found that AC diligence is significantly related
to lower non-audit fees ratio but Zaman et al. (2011) found that AC characteristics are
positively and significantly associated with non-audit fees in larger companies. It can be
argued that the difference between the findings of these two studie is due to sample size.
2.7.4 Tabulated Annotations
The annotated literature review on AC ensuring the independence of the external auditors is
presented in Table 4.

60
Table 4: Annotated Literature Review on AC Ensuring the Independence of the External Auditors
Author(s)
(Year)
Purpose/ Objective Sample & Data
Collection
Methods Main Findings Limitations & Future
Research
DeAngelo, L.
(1981)
Investigate the allegations
of the Commission on
Auditors' Responsibilities
and the
Securities and Exchange
Commission that 'low
balling' on initial audit
engagements impairs
auditor independence.
Develop a model of inter
temporal audit pricing
when incumbent auditors
possess cost advantages
over competitors in
future audits of a given
client.
These advantages occur
due to significant start-
up costs in audit
technology and
transactions costs of
switching auditors.
When incumbent
auditors possess these
advantages, they can
raise future audit fees
above the avoidable
costs of producing
audits.
Demonstrate that, contrary to
these claims, 'low balling'
does not impair
independence; rather it is a
competitive response to the
expectation of future quasi-
rents to incumbent auditors
(due, e.g., to technological
advantages of incumbency).
'Low balling' in the initial
period is the process by
which auditors compete for
these advantages. Critically,
initial fee reductions are sunk
in future periods and
therefore do not impair
auditor independence.

61
Table 4 (Continued): Annotated Literature Review on AC Ensuring the Independence of the External Auditors
Author(s)
(Year)
Purpose/ Objective Sample & Data
Collection
Methods Main Findings Limitations & Future
Research
Prakash, M.,
& Venable,
C.F. (1993)
Investigate the effects of
agency incentives and
knowledge spill-over in
joint engagements for
audit and non-audit
services.
Data from Fortune
500 companies,
disclose under
Accounting Series
Release (ASR) No.
250.
Ownership data for
1980 from the
Corporate Data
Exchange Stock
Ownership
Directory are
collected form
proxy statements.
A multiple regressions
are used to test whether
companies vary non-
audit purchase in
accordance with the
potential agency costs
that could arise.
The variables related to
expected agency costs
(management ownership,
outside investment
concentration, and leverage)
significantly explain cross-
sectional differences in the
demands for recurring non-
audit services.
Companies purchase higher
levels of recurring services
when they engaged particular
auditors (i.e., industry
services or the audit firm that
is the largest overall provider
of non-audit services).
Overall agency costs do not
explain the level of non-
recurring services purchased
from the auditor.
Operationalisation of
recurring and non-
recurring services is
difficult and may require
finer partitioning.
Managerial ownership
unexpectedly is associated
with non-recurring merger
and acquisition services
and is not associated with
recurring systems or
pension and personnel
services.
Restricted to publicly
available data only.
Future research: Explore
how non-audit services
influence auditor
switching.

62
Table 4 (Continued): Annotated Literature Review on AC Ensuring the Independence of the External Auditors
Author(s)
(Year)
Purpose/ Objective Sample & Data
Collection
Methods Main Findings Limitations & Future
Research
Firth, M.
(1997)
Seek to explain a
company’s decision to
hire non-audit services
from the auditor in UK.
Use data
observations from
500 largest British
companies.
Data are extracted
from Datastream,
Exstat, annual
reports and the
Financial Times.
Use multiple regression
models to test whether
companies that face high
agency costs purchase
relatively smaller
amounts of non-audit
services.
Companies that have higher
agency cost proxies are
associated with smaller
purchases of non-audit
services from their auditors.

63
Table 4 (Continued): Annotated Literature Review on AC Ensuring the Independence of the External Auditors
Author(s)
(Year)
Purpose/ Objective Sample & Data
Collection
Methods Main Findings Limitations & Future
Research
Frankel, R.M.,
Johnson, F.M.,
& Nelson,
K.K. (2002)
Examine whether auditor
fees are associated with
earnings management and
the market reaction to the
disclosure of auditor fees.
Initial sample
consists of 4,701
proxy statements
on the SEC’s Edgar
database with filing
date between
February 5, 2001
and June15, 2001.
Final sample
consists of 3074
firms
Use multiple regression
models to test the
variables.
There is a positive association
between non-audit fees and
the likelihood of reporting a
small earnings surprise, the
magnitude of absolute
discretionary accruals, and
the magnitudes of both
income-increasing and
income-decreasing
discretionary accruals.
There is a negative
association between audit
fees and these earnings
management indicators
No association between total
fees and any of these earnings
management indicators,
indicating that combining
audit and non-audit fees into
a single measure masks their
differential incentive effects.
Future research: (1) Tests
also suggest that size is an
important conditioning
variable in explaining the
incentive effects of audit
and non-audit fees. Future
research could consider
this and other economic
circumstances that affect
auditor incentives. (2)
Analyses are based on the
first year of disclosed fees.
As additional years of data
become available, research
on changes in the market
for audit and non-audit
services and the effect of
these changes on auditor
incentives and financial
reporting quality would be
of interest.

64
Table 4 (Continued): Annotated Literature Review on AC Ensuring the Independence of the External Auditors
Author(s)
(Year)
Purpose/ Objective Sample & Data
Collection
Methods Main Findings Limitations & Future
Research
Ashbaugh, H.,
LaFond, R., &
Mayhew,
B.W. (2003)
Paper challenges the
findings of Frankel,
Johnson and Nelson
(2002).
Collect data for
4959 firms from
US registrants’
2000 proxy
statements that are
available on Edgar
or Global Access
during November
and December of
2001.
Final sample
consists of 317
firms.
Replicate Frankel,
Johnson and Nelson
(FJN)’s empirical tests to
investigate whether their
results are sensitive to
research design choices
Use multiple regression
models to test the
variables.
Find no relation between
positive discretionary
accruals and any of the
auditor fees metrics when
discretionary accruals are
adjusted for firm performance
and sampled firms are
partitioned by income
increasing versus income
decreasing accruals.
No relation between fee ratio
and the likelihood that firms
beat analysts’ forecasts.
No evidence that the market
reacts to the magnitude of
non-audit fees relative to total
fees.

65
Table 4 (Continued): Annotated Literature Review on AC Ensuring the Independence of the External Auditors
Author(s)
(Year)
Purpose/ Objective Sample & Data
Collection
Methods Main Findings Limitations & Future
Research
Abbott, L.J.,
Parker, S., &
Peters, G.
(2003)
Examine the association
between AC
characteristics and the
ratio of non-audit service
fees to audit fees, using
data gathered under the
Securities and Exchange
Commission’s (SEC’s)
fee disclosure rules.
First examine all
proxies filed with
the Sec between
February 5, 2001
and March 6, 2001.
Expand the original
sample of 310
firms; the authors
then select a
random sample of
250 proxy filings
from March 19,
2001 to 30 June
2001.
After deleting
observations with
missing variables,
538 companies
remained.
Use multivariate
regression to address
research question.
Find ACs that consist of
solely independent directors
and that meet at least four
times annually are
significantly and negatively
associated with non-audit
service fees ratio.
Consistent with AC member
perceiving a high level of
non-audit service fees in a
negative light and taking
actions to decrease the non-
audit service fees ratio.
Cannot eliminate the
possibility that
management’s attitude
towards corporate
governance drives both AC
characteristics and choices
related to auditor services.
Data are from the initial
period in which the SEC
had required registrants to
include information about
audit and non-audit service
fees paid to the auditor.
Given the time frame and
speed of the rule’s
enactment, the ability of
managers to adjust the
level of non-audit service
fees provided by the
incumbent auditor in
response to the new
disclosure requirements
may have been limited.

66
Table 4 (Continued): Annotated Literature Review on AC Ensuring the Independence of the External Auditors
Author(s)
(Year)
Purpose/ Objective Sample & Data
Collection
Methods Main Findings Limitations & Future
Research
Hoitash, R., &
Hoitash, U.
(2009)
Examine the association
between AC
characteristic an auditor
related decisions
following the mandated
changes in its
composition and
responsibilities.
Use large sample
comprised of 2,393
public companies
audited by large and
small auditor with
complete data for
fiscal year 2004.
Define AC expertise as the
percentage of experts on the
AC (PFE); AC size was
measured as the number of
board members on the AC
(ACSIZE); and AC diligence
was measured by the number
of AC meetings
(ACMEETING).
Financial experts are
associated with higher
audit fees.
AC size and the frequency
of AC meetings are
positively associated with
audit fees.
The measures of the board
of directors will not be
associated with audit fees.
Strong ACs might choose
to authorize less non-audit
services, possibly in order
to contribute to the
perception of auditor
independence.
Observe stronger ACs are
less likely to dismiss their
auditors and there is no
association between the
issuance of new going
concern reports and auditor
dismissals.
Audit fees are
determined based on
the supply and the
demand for audit
services. Not able to
disentangle the impact
of the demand and
supply on audit fees
but rather measure
their combined effect.
Audit fees are used as
a level of proxy for the
level of assurance
which might not fully
measure the quality of
work performed by
auditors.
Dismissal decisions are
often reached jointly
by auditors and their
clients. Inability to
fully observe these
decisions might bias
results.

67
Table 4 (Continued): Annotated Literature Review on AC Ensuring the Independence of the External Auditors
Author(s)
(Year)
Purpose/ Objective Sample & Data
Collection
Methods Main Findings Limitations & Future
Research
Lary, A.M., &
Taylor, D.W.
(2011)
Examine the association
between AC’s
governance
characteristics and their
role effectiveness.
To contribute a more
comprehensive model
and new evidence from
Australia that
complements and extend
recent studies from
different country settings
on characteristics, roles
and effectiveness of ACs.
The sampling frame
is Australian listed
companies over
years 2004 to 2009,
consisting of 180
observations.
The study applies multiple
regressions to validate the
hypotheses and models.
Reveal that stronger AC
independence and
competence, but not
diligence, are significantly
related to lower incidence
and severity of financial
restatements (i.e., to a
higher integrity of financial
statements).
Greater AC diligence, but
not independence or
competence, is
significantly related to
lower non-audit fee ratio
(i.e., to higher external
auditor independence).
AC major role of
monitoring the
company’s internal
audit function is not
integrated into the
model of the study.
Specific proxy
measures use to
represent the broader
concepts of
effectiveness of the
ACs are likely to have
deficiencies in their
construct validity.
AC members’
collective
characteristics are
likely to be constructed
from several
behavioural factors.

68
Table 4 (Continued): Annotated Literature Review on AC Ensuring the Independence of the External Auditors
Author(s)
(Year)
Purpose/ Objective Sample & Data
Collection
Methods Main Findings Limitations & Future
Research
Zaman, M.,
Hudaib, M., &
Haniffa, R.
(2011)
Extend prior research on
the relationship between
governance quality and
auditor remuneration.
Examine the influence of
AC effectiveness, a proxy
for governance quality on
audit fees and non-audit
services fees using a new
composite measure
comprising AC
independence, expertise,
diligence and size.
The population of
the study is the UK
FTSE-350 which
represents a good
mix of large and
relatively small UK
companies during
the period 2001-
2004.
The final consists of
non-financial UK
FTSE-350
companies with a
total number of 540
company year
observations.
Use a number of ordinary least
squares regression models to
help to explore further the
various relationship between
AC effectiveness and audit
fees and non-audit fees while
controlling for other variables.
Find that after controlling
for board of director
characteristics, there is a
significant positive
association between AC
effectiveness and audit fees
only for larger clients.
Indicate that effective ACs
undertake more monitoring
which results in wider
audit scope and higher
audit fees.
Find the association
between AC effectiveness
and non-audit fees to be
positive and significant,
especially for larger
clients.
Findings supported
regulatory initiatives aimed
at improving corporate
governance quality.
Use only four factors
in the composite
measure of AC
effectiveness in
different regulatory
and institutional
contexts.
Use dichotomous
measure of financial
expertise, coded 1 if at
least one member in
the AC has financial
expertise, and 0 other
wise.
The definition of
financial expertise is
perhaps too broad and
encompasses skills that
may not necessarily
contribute to AC
effectiveness.

69
2.8 Governance-related Agency Costs and their Value Relevance to
Shareholders
2.8.1 Introduction
Separation of ownership and control between the principal (shareholders) and the agent
(managers) gives rise to agency theory (Jensen and Meckling, 1976). Managers have the
incentives to act in their own best interests by supplying biased financial information which
does not reflect the true value of the company to the shareholders. Thus, from a financial
reporting perspective, a desirable consequence of corporate governance is hypothesised to be
the provision of high quality accounting information to financial statement user groups
(Habib and Azim, 2008). An AC is in a good position to perform a monitoring function for
the shareholders (Goddard and Masters, 2001).
The sub-sections below present and assess literature that has examined the relationship
between governance-related agency costs and their value relevance to shareholders and a
summary table of annotated literature review is also presented.
2.8.2 Extant Studies
Bushman and Smith (2001) reviewed and proposed additional research concerning the role of
publicly reported financial accounting information in the governance processes of
corporations. The authors argued that future research on the relationship between governance
use and capital market use of financial accounting information is important for developing a
more complete understanding of the effect of financial accounting information on economic
performance. While governance research typically focuses on a particular governance
mechanism in isolation, more complete understanding requires an explicit recognition of the
interactions across governance mechanisms (Bushman and Smith, 2001).
On the other hand, Davis-Friday et al. (2006) examined the impact of the economic
environment on the value relevance of earnings and book value in four Asian countries;
Indonesia, South Korea, Malaysia and Thailand, in the period surrounding the Asian financial
crisis from 1996-1997. The authors also examined the effects of corporate governance
mechanisms on the value relevance of accounting numbers. Using a sample of 1035 firms
across two years, the results of the study indicated that value relevance of earnings in
Indonesia and Thailand are significantly reduced during the Asian financial crisis while value

70
relevance of book value increased. In Malaysia, the value relevance of both earnings and
book value did not decrease during the crisis while in Korea, neither book value nor are
earnings significantly impacted by the crisis.
Jamaluddin et al. (2009) extended the analysis of Davis-Friday et al. (2006) by examining the
value relevance of equity book value and earnings, in a setting where the country experienced
corporate governance reform (during and after the issuance of the Malaysian Code on
Corporate Governance). The sample consisted of Main Board companies listed on Bursa
Malaysia from 1999 to 2001. The authors found that Malaysian companies’ equity book
value and earnings are of value relevance in determining the firm’s share price. However, the
regulatory change experienced by the county to enhance the level of corporate governance in
response to the financial crisis in 1997 does not have an impact on the valuation of equity
book value and accounting earnings.
Another corporate governance and value relevance study is conducted by Habib and Azim
(2008). The authors examined the relationship between accounting numbers and share price
as the measure of accounting information quality and also consider the impact of ASX
Corporate Governance Best Practice Code on the changes in the value relevance of
accounting information in Australia. This study uses board, AC and external audit related
variables to proxy for corporate governance. Similar to Davis-Friday et al. (2006), the
regression results showed that firms with strong governance structure exhibit higher value
relevance of accounting information. Results further showed that firm-specific economic
variables are important variables of the value relevance of accounting information.
2.8.3 Comparative Assessment
Based on the outlines of studies above, the findings of Davis-Friday et al. (2006), Habib and
Azim (2008), and Jamaluddin et al. (2009) indicated that corporate governance structure has
an impact on the value relevance to shareholders. Good corporate governance structure
creates value by providing value relevance information to the shareholders. The issues of
corporate governance have been debated extensively for it is believed that a sound corporate
governance system is indispensable in protecting the quality of accounting information
produced by companies (Machuga and Teitel, 2009). Past studies have examined the agency
theory and corporate governance as a monitoring mechanism (Bonazzi and Islam, 2007; Dey,

71
2008; Miller, 2009; Safieddine, 2009) but to date no studies have tested the relationship
between the audit-related agency monitoring costs (external audit fees, internal audit budget
and AC fees) and total shareholders return. In order to fill the research gap, this study aims to
examine this relationship.
2.8.4 Tabulated Annotations
The annotated literature review on governance-related agency costs and the value relevance
of these costs to shareholders is presented in Table 5.

72
Table 5: Annotated Literature Review on Governance-related Agency Costs and their Value Relevance to Shareholders
Author(s)
(Year)
Discussions
Bushman,
R.M., &
Smith, A.J.
(2001)
Review and propose additional research concerning the role of publicly reported financial accounting information in the governance
processes of corporations.
Discuss research on the use of financial accounting in managerial incentive plans and explore future research directions.
Propose that governance research be extended to explore more comprehensively the use of financial accounting information in
additional corporate control mechanisms, and suggest opportunities for expanding such research.
Propose cross-country research to investigate more directly the effect of financial accounting information on economic performance
through its role in governance and more generally.

73
Table 5 (Continued): Annotated Literature Review on Governance-related Agency Costs and their Value to Shareholders
Author(s)
(Year)
Purpose/ Objective Sample & Data
Collection
Methods Main Findings Limitations & Future
Research
Davis-Friday,
P., Eng, L.L.,
& Liu, C.
(2006)
Examine the value
relevance of earnings and
book value in four Asian
countries, Indonesia,
South Korea, Malaysia
and Thailand, in period
surrounding the Asian
financial crisis
Examine the impact of
the economic
environment on the value
relevance of book value
and earnings.
Examine the effects of
corporate-governance
mechanisms and the type
of accounting system
together with economic
environment on the value
relevance of accounting
numbers.
Sample consists of
firms from
Indonesia, Korea,
Malaysia and
Thailand for which
all required data are
available.
Market value of
equity, book value
of equity and net
income data are
obtained from
Datastream
Research Services.
The sample period is
1996 and 1997 and
consisted of 1035
firms (across two
years): 158 from
Indonesia, 217 from
Korea, 271 from
Malaysia and 389
from Thailand.
The market value of equity is
regressed on book value of
equity and net income.
Model 1 includes an indicator
variable to examine the effect
of the economic environment
(the effect of the crisis) on the
valuation of earnings and book
value.
Model 2 tests market value of
equity on book value of equity
and net income, controlling
for the effects of negative
book value and negative net
income.
Model 3 investigates whether
the use of IAS had any impact
on the value relevance of
earnings and book value.
The value relevance of
earnings in Indonesia and
Thailand is significantly
reduced during the Asian
financial crisis while the
value relevance of book
value increased.
In Malaysia, the value
relevance of both earnings
and book value decreased
during the crisis.
In Korea, neither book
value nor earnings is
significantly impacted by
the crisis.
Results also indicate that
the level of corporate
governance mechanisms
has impact on the extent of
changes in the value
relevance of book values,
but not earnings.

74
Table 5 (Continued): Annotated Literature Review on Governance-related Agency Costs and their Value to Shareholders
Author(s)
(Year)
Purpose/ Objective Sample & Data
Collection
Methods Main Findings Limitations & Future
Research
Jamaluddin,
A., Mastuki,
N., & Ahmad,
A. E. (2009)
Examine the effect of
corporate governance
reform on the value
relevance of equity book
value and earnings by
employing the Ohlson’s
Valuation model.
Sample consists of
Main Board
companies listed on
Bursa Malaysia
from 1999 to 2001
in order to
investigate the effect
during and after the
issuance of the
Malaysian Code on
Corporate
Governance
(MCCG) as a
measure of
corporate
governance reform.
Examines the value relevance
of equity book value and
earnings, this study will be
based on Ohlson’s valuation
model which relates market
value as a function of book
value and earnings.
Equity book value and
earnings are value relevant
in assisting investors to
value firms’ equity.
The regulatory change
experience by the country
did not have an impact on
the valuation of equity
book value and earnings.
This suggests that most of
the Malaysia companies
may not have met the
intended purpose of
MCCG, but merely
conformed to the minimum
requirement.
The study only
examines the effect
during and following
the issuance of the
code, covering only a
three-year period
(1999-2001).
Future research: (1)
Extend the period of
the study to cover
longer and more recent
periods (2) A
comparison between
Malaysian and other
emerging capital
market may also
contribute to the
scarcity of research
done in emerging
markets.

75
Table 5 (Continued): Annotated Literature Review on Governance-related Agency Costs and their Value to Shareholders
Author(s)
(Year)
Purpose/ Objective Sample & Data
Collection
Methods Main Findings Limitations & Future
Research
Habib, A., &
Azim, I.
(2008)
Seek to examine the
relationship between
corporate governance and
the value relevance of
accounting information.
Use data from
Australia’s top 500
listed companies for
the period 2001-
2003.
Final sample
consists of 1289
firm-year
observations from
2001 to 2003 with
430, 426 and 433
firms, respectively.
Financial statement
data and corporate
governance
information came
from the Aspect
Financial Analysis
and Connect 4
databases,
respectively.
Use board, AC and external
audit related variables to
proxy for corporate
governance.
Value-relevance is measured
by the adjusted R 2 derived
from a regression of stock
price on earnings and equity
book values following
Ohlson’s accounting-based
valuation framework.
Regression results show
that firm with strong
governance structure
exhibit higher value-
relevance of accounting
information.
Results further show that
firm-specific economic
variables are important
determinants of the value-
relevance of accounting
information.
Significant regulatory
reforms regarding
corporate governance
around the world give
an impression that
regulators believe that
governance plays a key
role in ensuring,
among others, credible
financial reporting.

76
CHAPTER 3. THEORETICAL FOUNDATION AND
HYPOTHESES DEVELOPMENT
3.1 Introduction
This chapter describes the theoretical foundation of the study and develops the sets of
hypotheses that will be tested. The theoretical foundation is first discussed. The behavioural
assumption underlying this study is that humans are economically rational and act in their
own self-interest. This underlies agency theory and provides the rationale for the extent to
which monitoring costs are incurred to monitor the behaviour and performance of top
management. Next the hypotheses are formulated. There are 5 sets of hypotheses to be tested
in this study.
3.2 Theoretical Foundation
3.2.1 Agency Theory and AC
Agency theory is the most common theoretical foundation in explaining corporate
governance and its reforms. Agency theory provides particularly useful guidance in
understanding the role of an AC which will be the focal point of this study. Berle and Means
(1932) first emphasized the concept of separation of ownership and control stating that as the
ownership of corporate wealth has become more widely dispersed, ownership of that wealth
and control over it have come to lie less and less in the same hands. Jensen and Meckling
(1976) is the first study to place this ownership issue into a proper theoretical framework and
model the agency relationship.
According to Jensen and Meckling (1976), an agency relationship can be defined as a
contract under which one or more persons (the principal) engage another person (the agent) to
perform some service on their behalf which involves delegating some decision making
authority to the agent. In the context of a company, the shareholders (principal) appoint the
managers (agent) to carry out day-to-day business decision making on their behalf. Managers
might have personal goals that compete with the principal's goal of maximising wealth. Since
the shareholders authorise managers to take charge and control of the firm's economic
resources, a potential conflict of interest exists between these two groups. Importantly,
agency theory suggests that, in imperfect labour and capital markets, managers will seek to
77
maximize their own utility at the expense of shareholders due to information asymmetry and
moral hazard (Kleiman, 2010). Managers may excessively consume firm resources and make
decisions that are not in the shareholders’ best interests.
Subsequent development in agency theory has been proposed by Fama and Jensen (1983).
Similar to Jensen and Meckling (1976), Fama and Jensen (1983) also argued that the contract
structure of organisations which involves separating ownership from control, gives rise to
agency problems resulting from the fact that the agents (managers) do not want to bear the
risks. Furthermore, the development of the agency theory has resulted in the proposition and
implementation of governance structures. The strengthening of corporate governance (i.e.,
board of directors, ACs, external auditors and internal audit function) can reduce this agency
problem. Without effective control procedures, managers are more likely to take actions that
deviate from the interest of the shareholders (Psaros, 2009). An overview of key features of
agency theory is given in Table 6.
The concept of agency theory where managers will seek to act in their own best interest
instead of the shareholders gives rise to three agency theory problems. The first problem
relates to the potential for managers to maximize their own utility at the expense of
shareholders. This can be manifest in excessive remuneration, bonuses, golden parachute and
other unfair benefits provided to the managers by the company. The second problem of
agency theory relates to the managers’ preference to focus on short term performance to meet
their company’s profit target. This will eventually lead to a short fall of longer term goals and
hence decreases the shareholders’ value. Longer term goals achieved by managers are
arguable more beneficial to shareholders. The last problem of agency theory is the differences
between managers’ and shareholders’ attitude towards risk. Managers prefer to take riskier
investments compared to shareholders as managers are more likely to be rewarded for
success than failure (Psaros, 2009).

78
Table 6: Agency Theory Overview
Key idea Principal-agent relationships should reflect
efficient organisation of information and
risk-bearing costs.
Unit of analysis Contract between principal and agent.
Human assumptions Self-interest.
Bounded rationality.
Risk aversion.
Organisational assumptions Partial goal conflict among participants.
Efficiency as the effectiveness criterion.
Information asymmetry between principal
and agent.
Information assumption Information as a purchasable commodity.
Contracting problems Agency (moral hazard and adverse selection)
Risk sharing.
Problem domain Relationships in which the principal and
agent have partly differing goals and risk
preferences (e.g., compensation, regulation,
leadership, impression management, whistle-
blowing, vertical integration, transfer
pricing).
Source: Clarke (2004)
In order to deal with shareholder-manager agency conflicts, shareholders could monitor every
managerial action to make sure that managers perform according to their written contract.
The primary means of monitoring is via the annual financial statements whose reliability is
enhanced by an audit report. However, financial statements may be inadequate for monitoring
purposes due to information asymmetry and incomplete information (Goddard and Masters,
2001). The financial statements are prepared by managers who know more about the current
condition and future prospects of the firm than shareholders or auditors. To exploit their
information advantage at the expense of outsiders, managers are reluctant to disclose any
private matters for fear that it may be used against them. Shareholders’ monitoring using
financial statements could be extremely costly and inefficient.

79
Conversely, to reduce shareholders-managers agency conflicts, there is a role for an
intermediary between the managers, auditors and shareholders. According to Fama and
Jensen (1983), non-executive directors can act as arbiters in disagreements among internal
managers and carry out tasks that involve serious agency problems between managers and
shareholders. An AC that consists of independent non-executive directors, without a day-to-
day responsibility, is in a good position to perform a monitoring function for the shareholders
(Goddard and Masters, 2001).
Also, ACs are commonly viewed as monitoring mechanisms that enhance the financial
reporting (Blue Ribbon Committee, 1999). The ASX CGC (2007) states that ACs are
responsible for reviewing the entity’s financial statements before submission to the board of
directors, ensuring the independence and competence of the internal and external auditors,
overseeing the company’s internal controls and many more. Thus, the extensive roles and
responsibilities of an AC will protect the interest of the shareholders and reduce the
shareholders-managers agency conflicts. As a result, the demand for active, independent,
expert audit committees to strengthen the quality of auditing and to reinforce the task of
monitoring in general is likely to increase under pressure from outside shareholders (Garcia-
Sanchez et al., 2012).
Past studies have examined the agency theory and corporate governance as a monitoring
mechanism (Bonazzi and Islam, 2007; Dey, 2008; Miller, 2009; Safieddine, 2009). Since
2000, where many high profile companies collapsed in Australia, there have been an
increasing number of studies focusing on corporate governance. The importance of sound
corporate governance also increased due to regulatory reforms (SOX Act 2002 in the United
States, Combined Code on Corporate Governance 2003 in the United Kingdom and ASX
CGC 2003 & 2007 in Australia). Therefore, the establishment of an AC in a company is a
fundamental component of a good corporate governance structure.
Based on the principal-agent theoretical perspective, this study will investigate how effective
and relevant is the use of an AC (part of the corporate governance component) as a
monitoring mechanism to reduce agency conflict between the managers (agent) and the
shareholders (principal). The responsibilities of an AC facilitating the quality of external
audit, ensuring the independence of external auditors, overseeing the quality of the internal

80
audit function and ensuring the independence of internal auditors can align the interest of the
shareholders with the interest of the managers. The interaction between the AC, external
auditors and internal auditors also helps to achieve maximum value for the company and its
shareholders.
3.3 Hypotheses Development
3.3.1 AC Overseeing the Quality of the Internal Audit Function
The main role of an AC is to oversee the quality of financial reporting and corporate
accountability. Alternatively, the internal audit function plays a crucial role in preventing
fraud and errors and ensuring effective controls. Hence, the objectives of the internal audit
function and the AC are closely related with one another. An efficient AC can be helpful to
the internal audit function in performing its duties. To maintain good corporate governance,
communication and a good working relationship between the staff responsible for the internal
audit function and the AC are important (Scarbrough et al., 1998, IIA 2002a, 2002b, 2003b).
Thus, this study first aims to explore whether the effectiveness of AC roles based on AC’s
governance characteristics are associated to financial resources and labour hours devoted to
the internal audit function. Independent AC members and AC chair are more likely to be
concerned with issues related to internal audit processes such as being involved in the
decision to dismiss the CIA, and the frequency and length of meetings with the internal audit
function (Goodwin, 2003). In addition, AC members equipped with financial or industry
expertise are more likely to have a better understanding of the complex technical and design
aspects of internal controls related to the particular company. DeZoort (1997) found that AC
members with financial experience make judgements more similar to auditors than those AC
members without such experience.
A larger AC size with number of members that have a more diverse set of skills and
knowledge would exercise a greater degree of expertise in monitoring the internal audit
function. Another consideration is the frequency of meetings. By meeting more frequently,
members would remain informed, alert and diligent about auditing issues (Scarbrough et al.,
1998). On the other hand, an AC charter is also important as it clearly sets out the AC’s roles
and responsibilities, giving a stronger sense of authority to the AC. Kalbers and Fogarty

81
(1993) argued that the existence of a clear AC charter provides power for authoritative
decision making and thus, the AC can achieve its oversight role more effectively.
Earlier studies have explored the relationship between the internal audit function and the AC
(Scarborough et al., 1998; Raghunandan et al., 1998; Raghunandan et al., 2001; Goodwin,
2003; Abbott et al., 2010). Scarborough et al.’s (1998) study found that effective ACs (i.e.,
independent, diligent and capable members) are associated with an objective and independent
internal audit function. Likewise, Raghunandan et al. (1998) demonstrated that ACs which
have granted private access to the CIA and have reviewed both the plans and the results of
internal auditing are more likely to be perceived as knowledgeable by their CIAs.
In a later study, Raghunandan et al. (2001) argued that ACs comprised solely of independent
directors and with at least one member having an accounting or finance background are more
likely to have longer meetings with the CIA and review internal audit proposals. Furthermore,
using data from Australia and New Zealand, Goodwin (2003) found that independence and
accounting experience have a complementary impact on AC relations with the internal audit
function. Moreover in the United States, Abbott et al. (2010) documented a strong, positive
association between AC oversight variable and the amount of internal audit function budget
allocated to internal controls-based activities.
The findings of past studies suggest that characteristics of ACs are associated with aspects of
the internal audit function. An effective AC should ensure that adequate financial resources
and hours are devoted to internal control based activities. Also an AC should ensure that the
CIA has private access to the chair or other members of the AC and is able to discuss
concerns on resourcing needs of the internal audit function. Hence, the following hypotheses
are formulated:
Hypothesis One (a): The AC’s mechanisms for role effectiveness, based on its AC’s
governance characteristics (i.e., chair independence, financial and industry expertise, size,
frequency of meetings and charter) are positively related to financial resources devoted to the
internal audit function.

82
Hypothesis One (b): The AC’s mechanisms for role effectiveness, based on its AC’s
governance characteristics are positively related to labour hours devoted to the internal audit
function.
3.3.2 AC Ensuring the Independence of the Internal Audit Function
In more recent years, the independence of the internal audit function has gained a lot of
interest among the Institute of Internal Auditors (IIA), academics and practitioners. The
motivation for this growth in research relates to the potential conflicts arising from the
expanding role of the internal audit function as both a key corporate governance mechanism
and an internal consultancy service (Stewart and Subramaniam, 2010). It can be argued that,
internal auditors providing both assurances to external stakeholders and consulting services to
management may cause a conflict of interest and threaten the internal auditors’ independence.
Firms have established an AC to monitor corporate governance matters, risk management and
assurance issues. Hence, the AC serves as an oversight role in ensuring the independence of
the internal audit function. An effective AC with good governance characteristics can
strengthen the independence position of the internal audit function (Verschoor, 1992).
Empirically, Goodwin and Yeo (2001) argued that the relationship between internal audit
function and AC may affect organisational independence while the use of the function as a
management training ground may affect individual objectivity.
Moreover, in Australia, Christopher et al. (2009) identified a number of threats to the internal
audit function’s independence. These include having the management to approve the internal
audit budget and being involved in the audit plan, the internal audit function not reporting
functionally to the AC, the AC not having sole responsibility for appointing and dismissing
the CIA and a lack of AC accounting expertise. McHugh and Raghunandan (1994) also found
that a large majority of internal auditors indicated that vesting hiring or firing authority with
the AC would enhance the independence of the internal audit function and improve the ability
of internal auditors to generate action on audit findings.
Thus, based on the argument above, the AC is an important vehicle in increasing the
company’s status and the independence of internal audit function. AC ‘good governance’
83
characteristics are more likely to ensure the independence of the internal audit function. The
following hypotheses from the literature are articulated:
Hypothesis Two (a): The AC’s mechanisms for role effectiveness, based on AC’s
governance characteristics are positively related to the independence of the internal audit
function.
Hypothesis Two (b): The AC’s mechanisms for role effectiveness, based on AC’s
governance characteristics are positively related to the extent of AC support for internal audit
function independence.
3.3.3 AC Facilitating the Quality of the External Audit
Studies relating to AC and external audit fees have been published in recent years. To date,
existing evidence from these previous studies is mixed. Most studies show that the quality of
AC characteristics is positively related to the level of audit fees (Carcello et al., 2002; Abbott
et al., 2003; Goodwin and Kent, 2006; Yatim et al., 2006; Hoitash and Hoitash, 2009; Singh
and Newby, 2010), but some have found no significant association (Goddard and Masters,
2001; Rainsbury et al., 2009).
A number of studies have investigated the association of AC independence with financial
reporting and audit fees. ACs comprised of independent members are less likely to
experience earnings restatements as they are more effective in monitoring the corporate
financial accounting process (Beasley et al., 2000; Carcello and Neal, 2000; Klein, 2002;
Abbott et al., 2004). This implies that an AC independent from the management is more
likely to question and dispute management on various issues and, therefore, is better at
protecting the reliability of the accounting process. Independent ACs will also ensure that the
audit hours are not reduced to a level where the quality of audit would be compromised.
Moreover, in order to reduce financial misstatements, independent ACs may also demand
additional work (beyond the initial audit plan) to be performed by the external auditors.
Supporting the arguments above, Carcello et al. (2002) and Abbott et al. (2003) found that
AC independence is positively related to external audit fees. Independent ACs will demand a
greater level of audit assurance and potentially provide stronger support for external auditors

84
during scope negotiations with management (Abbott et al., 2003). Thus, this tends to improve
the quality of external audit and leads to higher audit fees.
On the other hand, the effectiveness of an AC in facilitating the quality of external audit is
further enhanced if the members have relevant expertise. ACs equipped with financial and
industry expertises are better at understanding complex external auditing risk assessment tests
and procedures proposed. Furthermore, financial experts on the AC can provide additional
support for external auditors when discussing or negotiating auditing issues with management
(Abbott et al., 2003). Evidence from previous studies suggests that AC financial expertise is
positively related to audit fees (Carcello et al., 2002; Abbott et al., 2003; Hoitash and Hoitash,
2009). AC members that possess financial and industry expertise seek to purchase higher
audit quality in order to protect their reputation and also protect the interest of shareholders.
Following the ASX CGC’s recommendation, this study will examine two measures of
expertise: accounting expertise and industry expertise. Consistent with previous studies, a
high proportion of financial and industry experts on the AC will be positively related to audit
fees.
Previous studies have also shown that the frequency of AC meetings is a good measure of AC
effectiveness. In regards to external audit fees, Carcello et al. (2002) found no significance
between AC meetings and audit fees, while Abbott et al. (2003), Goodwin and Kent (2006)
and Hoitash and Hoitash (2009) observed a positive significant association. AC that meets
frequently with the auditors and management are more likely to be informed about the
auditing issues and can prevent the occurrence of financial reporting problems. Higher
frequency of AC meetings can proactively and positively influence the audit coverage during
various stages of the audit (Abbott et al., 2003). Thus, the frequency of AC meetings will be
positively associated with higher audit fees.
On the other hand, AC size and charter are important characteristics to the overall
effectiveness and strength of AC. Larger AC tends to have more authority (Kalbers and
Fogarty, 1993) which is found to increase financial reporting quality (Felo et al., 2003),
reduce the incidence of earnings restatements (Lin et al., 2003) and have a committee with a
more effective monitoring function (Dalton et al., 1998). Hence, AC size is likely to be
associated with higher external audit fees that facilitate better quality service. Furthermore,

85
the responsibilities of an AC are clearly defined and explained in its charter. Kalbers and
Fogarty (1993) argued that the existence of a clear AC charter provides power for
authoritative decision making. Thus, the AC can achieve its oversight role more effectively
by successfully obtaining a good external audit function as reflected in their ability to get
board approval for higher external audit fees. The presence of an AC charter will be
positively related to audit fees. The following hypothesis drawn from the above studies is
formulated:
Hypotheses Three: The AC’s mechanisms for role effectiveness based on AC’s governance
characteristics are positively related to external audit fees (a proxy for the quality of the
external audit).
3.3.4 AC Ensuring the Independence of the External Auditors
The external auditors when acting as an independent party with knowledge of the company’s
financial affairs can provide the AC with valuable, objective insight into aspects of the
company’s governance and internal controls, including its risk management. The AC in turn
aids the effectiveness of the external auditors (AUASB, AICD and IIA, 2008). Hence, one of
the key roles of the AC is to ensure the independence of the external auditors and observe the
extent of non-audit services provide by the auditor to the management.
Given an active and independent AC’s concern for perceived external auditor’s independence,
an AC can influence the non-audit services purchase decision (Abbott et al., 2003). The
results of previous studies (DeAngelo, 1981; Prakash and Venable, 1993; Firth, 1997)
showed that non-audit service fees can threaten the independence of external auditors. So far,
only four studies examined the relationship between AC characteristics and non-audit service
fees purchases (Abbott et al., 2003; Hoitash and Hoitash, 2009; Lary and Taylor, 2011;
Zaman et al., 2011).
Abbott et al. (2003) found that ACs comprised solely of independent directors and meet at
least four times annually, are significantly and negatively associated with the non-audit
service fees ratio. Moreover, in the post-SOX period, Hoitash and Hoitash (2009) also found
that strong ACs might choose to authorize less non-audit services, possibly in order to
contribute to the perception of auditor’s independence. Two more recent studies, Lary and

86
Taylor (2011) found that some AC characteristics are negatively and significantly associated
with non-audit fees while Zaman et al. (2011) found that AC characteristics are positively
and significantly associated with non-audit fees in larger companies. This prior literature
suggests that an effective AC is more likely to reduce the level of non-audit service fees
provided by the external auditor to the management. Hence, the following hypothesis is
formulated:
Hypotheses Four: The AC’s mechanisms for role effectiveness based on AC’s governance
characteristics are negatively related to non-audit fees (a proxy for the independence of the
external auditors).
3.3.5 Audit-related Agency Monitoring Costs and Total Shareholders Return
Separation of ownership and control (the agency problem) between the managers (agent) and
the shareholders (principal) provide incentives for managers to act in their own best interest
and maximise their personal wealth. This can lead to managers providing biased accounting
and financial information to shareholders. Hence, the strengthening of the audit-related
corporate governance structures and mechanisms (i.e., AC, external auditors and internal
audit function) can mitigate this problem. In an organisation, an AC is an important
component of board governance.
Habib and Azim (2008) argued that from a financial perspective, a desirable consequence
espoused for corporate governance is the provision of high quality accounting information to
financial statement user groups. Strong AC’s governance characteristics help to align the
interest of the managers with the interest of shareholders by reducing manger’s opportunistic
earnings management practices and providing reliable financial information. Furthermore,
Goodwin and Seow (2002) also argued that sound corporate governance is important because
it can affect the quality of financial reporting and thus, leads to increased investor confidence
especially in an emerging capital market.
Based on the agency theory framework, owners would rationally incur higher agency
monitoring costs in order to gain greater returns due to the restricting of management’s
behaviour associated with adverse selection and moral hazard. In particular, adverse selection
of financial information by management to report to, or withhold from shareholders, is

87
expected to be reduced when higher audit-related monitoring costs are incurred. Therefore,
this study will investigate whether the resourcing of audit-related governance structures and
mechanisms (i.e., incurring higher agency monitoring costs) is positively related to the
company’s returns to shareholders. In this respect, no prior auditing studies have tested the
relationship between audit-related governance costs (i.e., external audit fees, internal audit
function budget and AC fees) and total shareholders return. The following hypothesis is
developed:
Hypothesis Five: Audit-related agency monitoring costs (external audit fees, internal audit
function budget and AC fees) are positively related to shareholders return.

88
CHAPTER 4. RESEARCH METHODS
4.1 Introduction
Mixed methods are used to gather both primary and secondary data. There are two stages of
data collection employed in this study: the primary data collection stage involving the
administration of a questionnaire and the secondary data collection stage involving extraction
from annual reports and financial databases. This chapter addresses the following areas: (1)
justification of choice of selection of companies; (2) justification of the financial year
selected; (3) questionnaire data collection stage; and (4) secondary data collection stage. Both
data collection stages are discussed in detail in separate sections.
4.2 Selection of Sample of Companies
The sample of companies for both primary and secondary data collection is chosen as a
census of all top 300 listed companies on the ASX with financial year ending in 2010. A
constituent list of top 300 listed companies is obtained from the Standard and Poor’s (S&P)
website. These companies are selected because top 300 listed companies on the ASX include
large capitalisation, mid capitalisation and small capitalisation components of the S&P/ASX
index family. Moreover, top 300 listed companies also cover approximately 81% of
Australian equity market capitalisation (ASX, 2010).
Companies are then excluded from the sample for the following reasons:
a) Missing or no data and other relevant information available on the Aspect Huntley
FinAnalysis database and the Morningstar DatAnalysis database (i.e., annual reports,
financial statements, AC variables, board of director variables and information
regarding the CEO and CFO).
b) Companies with no internal audit function.
c) Foreign companies listed on the ASX.
d) Incomplete or no company addresses provided.
This resulted in a final sample of 255 listed companies with financial year ending in 2010 as
shown in Appendix A.

89
4.3 Selection of Financial Year
Company data for financial year ending in 2010 is selected for the following reasons. The
ASX Listing Rule requires companies listed on the S&P/ASX All Ordinaries index to have an
AC from 1 January 2003 onwards. This rule also requires the top 300 listed companies to
comply with the recommendations of the ASX CGC’s Principles and Recommendations
(Recommendation 4.1, 4.2, 4.3 and 4.4) on the composition, operation and responsibility of
the AC (AUASB, AICD and IIA, 2008).
Moreover, in terms of the Australian economy and the share market, 2010 is a relatively
normal year. The share market had recovered from the global financial crisis and company
earnings announcements were improved on the downturn of 2008 and 2009. According to the
Australian Industry Group’s (AIG) 2010 economic report, the economic recovery in Australia
has gained momentum, underpinned by significant increases in commodity prices, stronger
corporate profitability, strengthening labour market conditions and higher wage growth.
Also, recent regulatory changes (ASX CGC, 2007) relating to ACs have lent themself to the
research in this study. In year 2007, ASX CGC released Corporate Governance Principles
and Recommendations which is a revised version of the original 2003 publication. The
revisions included some amendments to details on the roles and responsibilities of ACs.
Companies are expected make changes in an orderly way so as to meet these amendments
over a reasonable period. Hence, 2010 is an appropriate year to use in this study as it best
captures the gradual strengthening of corporate governance since 2007, especially in ACs.
4.4 Questionnaire Data Collection Stage
This section discusses the methods used in the first stage of data collection. A questionnaire
is developed and administered to the Chief Internal Auditor (CIA) of the sampled companies.
The purpose is to investigate hypothesis one and two of this study by combining primary data
with secondary data collected in the second stage.
The information sought from the CIA in the questionnaire is divided into four sections.
Section one relates to the background of both the CIA and the company. Section two asks
respondents about the internal audit function activities while section three seeks data on the

90
relationship between the AC and the internal audit function. The fourth section of the
questionnaire asks respondents about the independence of the internal audit function.
Apart from presenting the questionnaire instrument, the issues concerning construction and
administration of the instrument are discussed throughout this section. These issues are: (1)
justification of the respondents selected; (2) construction and rationale for the research
instrument used to collect the data; (3) approval required prior to using the research
instrument; (4) and the approaches taken in administration of the questionnaire; and (5) the
sample response rate.
4.4.1 Selection of Respondents
The data is collected by mailing a questionnaire to CIA of sampled top 300 ASX listed
companies. This method is considered appropriate because the CIA is likely to be
knowledgeable about the company’s internal audit function and the operations of the AC
(Goodwin and Yeo, 2001). The information sought in the questionnaire is not available
through secondary data sources. Moreover, using a questionnaire enables comparisons to be
made with previous studies (Scarbrough et al., 1998; Goodwin, 2003; Ahmad and Taylor,
2009; Abbott et al., 2010) that applied the same research method.
4.4.2 Research Instrument
The questionnaire of this study focuses mainly on the internal audit function and the AC. It
consists of 22 questions, organised into four sections. Section One: Background, Section
Two: Internal Audit Function Activities, Section Three: AC and the Internal Audit Function
and Section Four: Internal Audit Function Independence (See Appendix D). Information
collected from question 8, question 9, question 10, question 18 and question 21 is used to test
hypotheses one and two of this study. Whereas, information collected from the rest of the
questionnaire is used in comparative case study analysis. The nature and approach to the
comparative case study methods is discussed in detail in Chapter 6, Section 6.2.
Prior to completing the final version of the questionnaire, the formatting of the questionnaire
is subjected to pretesting to ensure question comprehensiveness, relevancy, appropriateness
and efficiency. It is pre-tested on four RMIT University academics with familiarity in

91
auditing and corporate governance research experience. The questionnaire is also presented to
the manager of research and publishing at the Institute of Internal Auditors (IIA) Australia for
review and approval before its distribution to IIA members for pilot testing. Amendments are
made after receiving constructive feedback from both parties. The comments received are
shown in the discussion parts of each of the four sections of the questionnaire, and again
under the administration of the questionnaire.
4.4.3 Questionnaire Design
The questionnaire in this study is created and formatted according to Dillman’s (2000)
scientific basis for survey research methodology such as the development of question scales
and multiple choice answers, confidentiality requirements, minimisation of question bias and
the use of unambiguous wording. Dillman (2000) is regarded as a leader in establishing a
paper-based questionnaire. If respondent finds the questionnaire easy to read and follow, the
response rate will improve. Moreover, a well formatted questionnaire will also reduce
measurement error as the respondent will be more likely not to misread or overlook questions.
In designing the questionnaire, a number of important factors are considered. Firstly, the CIA
is an extremely busy person and difficult to gain access to. Therefore, the questionnaire
should not be too long. Second, the questionnaire should not be too complicated and should
not take more than 10 to 15 minutes to complete. This suggests that the questions created
require the respondents to tick an answer as an alternative for written answers. Third,
information required on the internal audit function is not publicly available and is regarded as
a sensitive issue for a company. Annual reports do not provide information about an
organisation’s internal audit function. Fourth, CIA is likely to be secretive about disclosing
information concerning their organisation. Hence, personal information on the CIA will
remain anonymous in this study. In summary, all of these issues are adhered to in the final
questionnaire and cover letter.
4.4.4 Questionnaire Cover Letter
The questionnaire cover is a short single page letter explaining the purpose and the content of
the research project. The cover letter also gives details to the respondents about the benefits
of participating in the research project and a statement that personal details will be treated in

92
confidence. Further, the letter describes the instructions and options on how to complete the
questionnaire, the approximate time to complete the questionnaire and instructions to return
the questionnaire in the postage-paid envelope provided. The cover letter is signed by both
the researcher and the thesis senior supervisor. The letter concludes with a paragraph stating
that the research project is vetted and approved by the RMIT University’s Business College
Human Ethics Committee. It directs respondents with questions about the manner in which
the questionnaire is being managed to contact the thesis senior supervisor. A sample of the
questionnaire cover letter is shown in Appendix C.
4.4.5 Questionnaire Contents
4.4.5.1 Section One: Background
In terms of rationale, section one of the questionnaire is designed to identify the background
of the respondents (CIAs) and the profile of the company. These questions are common
questions used by most studies and are adapted from Scarbrough et al. (1998), Goodwin
(2003) and Abbott et al. (2010). Respondents’ background in this questionnaire provides
basic demographic information about age, gender, years of working experience in the internal
audit field and their current job position. This section also includes a series of questions
related to the profile of the company including company name, company size based on
market capitalisation, company industry, professional audit staff employed and total annual
internal audit budget.
Information on the characteristics of the respondents and companies is deemed important in
the interpretation of the questionnaire results. Analysis of the reported characteristics of the
company profile and the respondents can indicate the quality of the information collected and
whether or not it is a representative of the population. The questions in section one is
numbered 1 to 9 in the questionnaire shown in Appendix D of the thesis. Feedback on the
first draft of the questionnaire from the four RMIT University academics resulted in minor
changes in the wording in a number of questions and reduction in the total number of
questions.

93
4.4.5.2 Section Two: Internal Audit Function Activities
In terms of rationale, section two explores the manner in which the internal audit function in
the company operates. These questions are revised based on the questionnaire used in
Goodwin and Yeo (2001), Raghunandan et al. (2001), Goodwin (2003) and Abbott et al.
(2010). The second section of the questionnaire asks a number of questions relating to total
hours devoted to internal audit function, the approximate percentage distribution of internal
audit function activities, the use of internal audit function as training ground and staff
turnover, internal audit function reporting responsibility, termination rights and budgetary
oversight. Also, section two asks about the coordination of internal audit function with the
external auditors in respect to audit coverage and work scheduling and also whether external
auditors have access to working paper and management reports of the internal audit function.
Information on the internal audit function activities is essential in interpreting the findings of
this study. Data collected from question 10 will be used to test hypothesis one while the rest
of the data gathered from question 11, 12, 13, 14 and 15 will be used in comparative case
analysis. The questions in section two are numbered 10 to 15 in the questionnaire as shown in
Appendix D of the thesis. There is a reduction in the number of questions in this section due
to feedback from the four RMIT academic reviewers of the draft.
4.4.5.3 Section Three: AC and the Internal Audit Function
In terms of rationale, section three of the questionnaire is used to determine the relationship
between the AC and the internal audit function of the company. The questions are designed
and adapted according to Raghunandan et al. (1998), Scarbrough et al. (1998), Goodwin and
Yeo (2001), Raghunandan et al. (2001) and Goodwin (2003). The third section collects data
on the relationship between AC and internal audit function relating to AC meetings with the
CIA (i.e., length, privacy and number of meetings), AC expertise in regards to internal
control matters, AC reviewing of plans and receiving reports from the internal audit function.
These questions provides insight into the level of AC involvement relative to its role in the
internal audit function and the information collected from the questionnaire will be used in
comparative case analysis. The questions in section three are numbered 16 to 20 in the
questionnaire as shown in Appendix D of the thesis. Feedback on the draft of this section of

94
the questionnaire from the four RMIT University academics resulted in changes in the
wording in a number of questions.
4.4.5.4 Section Four: Internal Audit Function Independence
In terms of rationale, section four looks at the independence of the internal audit function.
These questions are originally created based on the questionnaire used in Ahmad and
Taylor’s (2009) study. Taking a cognitive perspective of internal auditor independence,
Ahmad and Taylor (2009) developed the questionnaire by drawing on measures established
in the organisational behaviour literature and adapting these to the internal auditor’s context.
The exercise of independence by internal audit function is important given their modern roles
and responsibilities. The questions constructed in section four will be used to test hypothesis
two of the study.
The fourth section of the questionnaire asks respondents about the internal audit function
independence in terms of: (a) the dedication of internal audit function to maintain
independence; (b) whether internal audit function would resist any pressure and threat in
order to maintain independence; (c) would the internal audit function comprise independence
if they work under both audit role and advisory service role; (d) whether the AC provides a
strong backing for the maintenance of internal audit function independence; (e) whether the
independence of the internal audit function is strongly upheld because AC members have
strong collective independence; and lastly (f) would AC be prepared to take action to
maintain the independence of the internal audit function.
The questions in section four are numbered 21 in the questionnaire as shown in Appendix D
of the thesis. Feedback on the draft of the questionnaire from the four RMIT University
academics resulted in changes in the wording in a number of sub-questions.
4.4.6 Ethical Issues
The rules and regulations of RMIT University require that when human data is collected by
questionnaire, whether it is for a research project or thesis, a formal ethics approval of the
contents of the questionnaire must be obtained from the RMIT Human Research Ethics
Committee. The required procedure for the application process is to complete the specified

95
forms and submit the application to the Secretary of Business College Human Ethics
Advisory Network for assessment. Ethics approval for the study is approved by the Chair of
the Business College Human Ethics Advisory Network and approval is granted for the period
from 21 June 2011 to 1 March 2014. The letters of ethics approval received from the
committee appears in Appendix B of the thesis.
4.4.7 Administration of the Questionnaire
The questionnaire is first administered online by using the template on the online
questionnaire software package, Survey Monkey. After setting up the template, a survey link
is generated and respondents could click on the link to complete the questionnaire online. In
parallel, a hard copy of the questionnaire is also sent to the sampled subjects to complete.
Thus, the respondents of this study are given two options, either to complete the
questionnaire online or by mail.
The pilot test of the questionnaire is electronically sent by IIA Australia in an email together
with a cover letter and an online questionnaire link. The research manager at IIA Australia
arranged to forward the email to a limited number of IIA members who are CIAs in the top
300 ASX listed companies. This represented a sample size of 60. The questionnaire is first
sent on 10 October 2011 by IIA. A total of 4 usable responses are received representing a
response rate of 7%. No further responses and comments are received from the respondents.
Due to poor responses from the email sent by IIA to selected members who are CIAs of top
300 companies, the administration of the questionnaire is reviewed again. It is found that
there is an online technical error in one of the questions where the respondents could not key
in their answer. The error is corrected and a second and third pilot test is sent by IIA
Australia to the same number of members on 20 October 2011 and 10 November 2011
respectively. A total of 9 usable responses are received, yielding a response rate of only 15%.
The 9 responses are analysed, and no further revisions to the wording in the questionnaire are
deemed necessary. Due to this continuing poor response rate, a different method of
administration is chosen.
Rather than going through IIA Australia using an email approach, the questionnaire is
administered directly from RMIT University through a copy of the printed questionnaire,

96
cover letter and postage-paid envelope that is sent to the Chief Financial Officers (CFOs) of
top 300 ASX listed companies. The CFO is instructed to pass the enclosed questionnaire to
the company’s CIA for completion. After completing the questionnaire, the CIA is requested
to return the questionnaire using the enclosed postage-paid envelope provided. The
questionnaires are mailed out in two stages.
The first stage of the questionnaires is sent on 2 December 2011 and a reminder of the
questionnaire is mailed on 6 February 2012. There are two major reasons for selection of the
dates to send the questionnaire. First, by these dates the previous financial year’s annual
reports would have been completed and the CIA would most likely to be contactable and thus,
would increase their willingness to complete the questionnaire sent to them. Second, the
periods are before and after Christmas and summer holidays, so the CIA is likely to be
available. A record is kept to track the number of questionnaires sent and recovered during
the initial and reminder periods.
4.4.8 Sample Response Rate
The questionnaires are mailed out in two stages. A total of 255 questionnaires are initially
mailed on 2 December 2011. A total of 23 usable responses are received, yielding a response
rate of 9%. A follow-up mailing is conducted on 6 February 2012 and produced an addition
of 13 usable responses. A total of 27 unusable responses consisted of 5 companies without
internal audit function, 3 CIAs stating they are not interested to take part in the research
project, 13 companies that outsourced their internal audit function and 6 questionnaires that
are returned to sender. This led to the final sample size of 36 respondents, representing a
response rate of 14%. Compared to other studies’ response rates, using a questionnaire of a
similar nature targeting the CIA [Carcello et al., 2005 (25%); Pararit et al., 2012 (18%);
Christopher et al., 2009 (17%); Abbott et al., 2010 (13%)], the response rate for this study is
deemed fairly reasonable and may present a fair reflection of the views of the CIA.
A non-response bias test is performed to compare the responses of those who returned the
first mailing of the questionnaire to those who returned the second mailing of the
questionnaire. The 36 usable response are divided into two groups, based on those sent in the
first stage of the mailed out on 2 December 2011 (23 responses) and those sent in the second
stage of the mailed out on 6 February 2012 (13 responses). Results of a t-test indicated that

97
there are no statistically significant differences between the means of the test variables for the
two groups (p >0.05).
4.5 Secondary Data Collection Stage
This section discusses the methods used in the second stage of data collection. In this stage,
secondary data (financial and non-financial) of top 300 ASX listed companies listed for the
financial year ending in 2010 is hand collected from annual reports and financial databases.
The purpose is to test all the hypotheses of this study by combining the secondary data
collected at this stage with the questionnaire data collected at the first stage. The discussion in
this section centres on the following areas: (1) the data sources utilised in data collection; (2)
variable definition and measurement; (3) model specification; and (4) conceptual model.
4.5.1 Secondary Data Sources
Secondary data (financial and non-financial) are hand collected from the annual reports.
Annual reports for the financial year ending in 2010 are downloaded for all sampled
companies from the Connect 4 online database while various share market and other
company data are extracted from the Aspect Huntley FinAnalysis and Morningstar
DatAnalysis online databases. Non-financial data on the sampled companies’ ACs are
collected from the annual reports. AC chair independence and AC members’ expertise and
industry experience are gathered from the director’s profile while AC meetings are obtained
from the director’s meeting section. AC size and charter are collected from the corporate
governance section while the AC fees are obtained from the director’s report in the annual
reports.
Other data collected from annual reports are audit fees, non-audit fees and total shareholders
return. Both audit fees and non-audit fees are obtained from the notes to the accounts of the
financial statements. Calculated numbers for the total shareholders return, dividend per share,
share price at the beginning of the period and share price at the end of the period are collected
from the Aspect Huntley FinAnalysis database. Data on the characteristics of the company
and external auditors are collected from the Aspect Huntley FinAnalysis database and
modelled as control variables in this study (i.e., total assets, leverage, receivable ratio,
inventory ratio, current ratio, operating cash flow, growth, mining, industry companies,
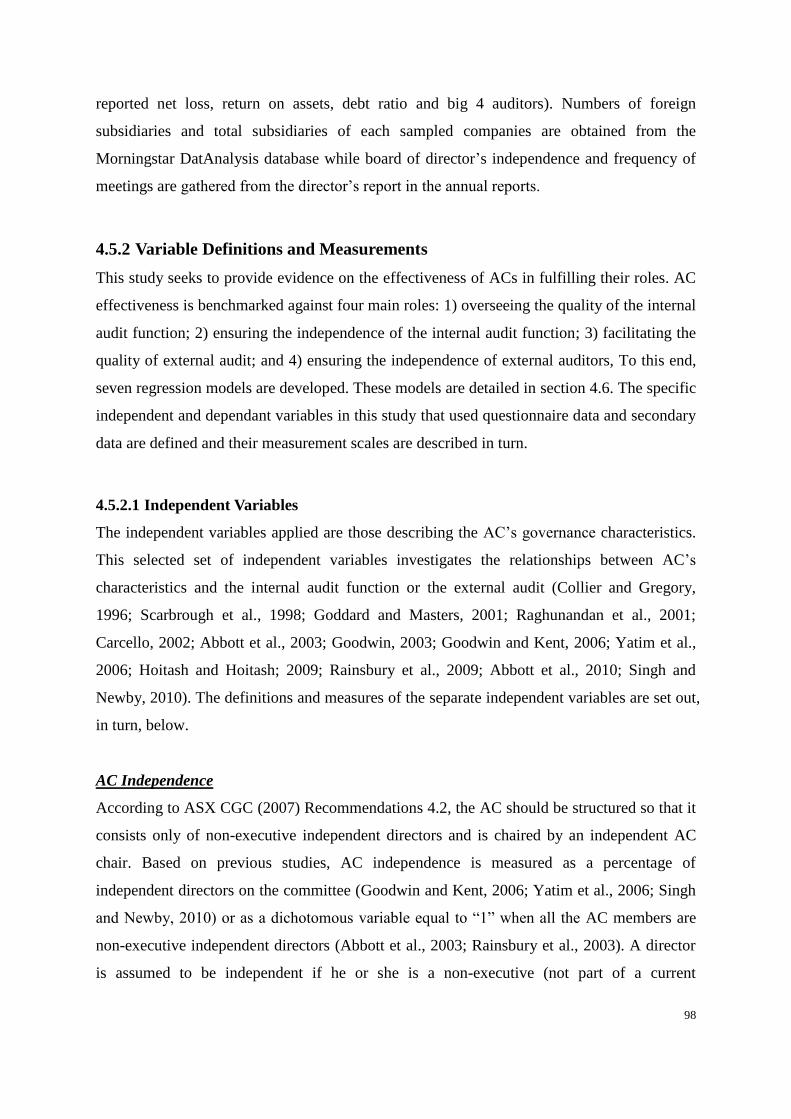
98
reported net loss, return on assets, debt ratio and big 4 auditors). Numbers of foreign
subsidiaries and total subsidiaries of each sampled companies are obtained from the
Morningstar DatAnalysis database while board of director’s independence and frequency of
meetings are gathered from the director’s report in the annual reports.
4.5.2 Variable Definitions and Measurements
This study seeks to provide evidence on the effectiveness of ACs in fulfilling their roles. AC
effectiveness is benchmarked against four main roles: 1) overseeing the quality of the internal
audit function; 2) ensuring the independence of the internal audit function; 3) facilitating the
quality of external audit; and 4) ensuring the independence of external auditors, To this end,
seven regression models are developed. These models are detailed in section 4.6. The specific
independent and dependant variables in this study that used questionnaire data and secondary
data are defined and their measurement scales are described in turn.
4.5.2.1 Independent Variables
The independent variables applied are those describing the AC’s governance characteristics.
This selected set of independent variables investigates the relationships between AC’s
characteristics and the internal audit function or the external audit (Collier and Gregory,
1996; Scarbrough et al., 1998; Goddard and Masters, 2001; Raghunandan et al., 2001;
Carcello, 2002; Abbott et al., 2003; Goodwin, 2003; Goodwin and Kent, 2006; Yatim et al.,
2006; Hoitash and Hoitash; 2009; Rainsbury et al., 2009; Abbott et al., 2010; Singh and
Newby, 2010). The definitions and measures of the separate independent variables are set out,
in turn, below.
AC Independence
According to ASX CGC (2007) Recommendations 4.2, the AC should be structured so that it
consists only of non-executive independent directors and is chaired by an independent AC
chair. Based on previous studies, AC independence is measured as a percentage of
independent directors on the committee (Goodwin and Kent, 2006; Yatim et al., 2006; Singh
and Newby, 2010) or as a dichotomous variable equal to “1” when all the AC members are
non-executive independent directors (Abbott et al., 2003; Rainsbury et al., 2003). A director
is assumed to be independent if he or she is a non-executive (not part of a current

99
management team) who is not closely affiliated and has no related party transactions with the
company.
ASX Listing Rule 12.7 requires the top 300 listed companies on the S&P/ASX All Ordinaries
Index to establish an AC and follow ASX CGC recommendations (Recommendation 4.1, 4.2,
4.3 and 4.4). The next 200 companies on the Index are also required to establish an AC but
not necessarily to follow ASX CGC recommendations (many still choose to do so). In this
study, the independence of AC members is not examined as all the top 300 listed companies
used in the sample will display the same level of independence characteristics. Instead, AC
chair independence is tested, using a more demanding measure of independence than
specified by the ASX. The chair of the AC plays an important role in shaping the agenda of
the AC committee. The chair needs to have independence for the AC team to be seen to have
credibility.
To date, no study examined the chair of AC independence by comparing the AC chair’s
common background data with the CEO and the CFO of the company (a new measure
created for this study). A chair of the AC is deemed to be not independent if he or she shares
a common background (same qualifications and same industry experience) with the CEO
and/or the CFO of the company. It can be argued that with different qualifications and
industry experience between the chair of the AC, CEO and CFO, the chair of the AC can be
viewed as independent from the management because he or she would have a different
mindset and arguments relating to particular financial reporting and auditing issues in the
company and it is not dominated by one individual.
AC chair independence (ACCHAIRIND) is measured as a scale. Scores are assigned to AC
chair, CEO and CFO based on respective qualification and industry experience categories as
shown in Table 7. The numbers assigned to categories in Table 7 are for purposes of
determining the extent of matching/non-matching of the background of AC chair with the
backgrounds of the CEO and CFO.

100
Table 7: Qualification, Industry and Category
Qualification Category
Accounting and Finance 1
Engineering 2
Law and Arts 3
Health and Science 4
Management and Marketing 5
Industry Category
Mining and Energy 1
Banking, Insurance, Finance and Law 2
Service and Retail 3
Manufacturing 4
Health 5
Because there can be multiple qualifications and industry experiences in the background of
any individual, the numbering scheme needs to ensure uniqueness of multiple backgrounds.
This is achieved by adding a 0 to the category number if a single background category applies
to an individual, and combining the digits if a multiple background applies. For example, if
an AC chair has an accounting qualification, a score of 10 would be given as 1 for accounting
and finance qualification category and 0 for no second qualification. Whereas, if an AC chair
has both accounting and engineering qualifications a score of 12 would be given as 1 for
accounting qualification category and 2 for engineering qualification category. Scores for AC
chair qualification, AC chair industry experience, CEO qualification, CEO industry
experience, CFO qualification and CFO industry experience are each collected.
Subsequently, a new single numbered score is assigned if AC chair matches or does not
match one or more of the requirements: same qualifications to CEO and CFO and same
industry experience to CEO and CFO. For instance, if an AC chair has a score of 10 for
qualification and CEO has a score of 10 for qualification too (both an accounting and finance
qualification), then a new score of 1 would be given. Also, if an AC chair has a score of 40
for industry experience and CEO has a score of 40 for industry experience (both from
manufacturing industry), then a new score of 1 would also be given and added to the total
score (total AC chair independence score is now equals to 2). The same process is carried out
by comparing the scores of AC chair qualification with the scores of CFO qualification and

101
comparing the scores of AC chair industry experience with the scores of CFO industry
experience. In the end, the scores will be totalled up. Thus, the scale can range from 0 (i.e.,
chair of AC is very independent) to 4 (i.e., chair of AC is not independent). This shows that
the higher score on the scale of 0 to 4, the more similar are the backgrounds. Hence, the
higher the score, the less independent the chair of the AC. An overview of the total scores is
shown in Table 8.
Table 8: Overview of Total Scores
AC Chair Independence
Qualification Industry experience
CEO 1/0 1/0
CFO 1/0
1/0
Total 4/0 is the maximum/minimum score for AC chair independence from
both the CEO and CFO.
AC Expertise
To construct the expertise variables, biographical information of the AC members is collected
from the annual reports and members are classified based on their qualifications. Earlier
papers measured expertise as a percentage of AC members with an accounting or finance
qualification (Goodwin and Kent, 2006; Yatim et al., 2006; Singh and Newby, 2010) or as a
dichotomous variable equal to “1” if at least one member of the AC has accounting or
financial management experience (Abbott et al., 2003; Mangena and Pike, 2004; Rainsbury et
al., 2009). On the other hand, Hoitash and Hoitash (2009) took a different approach in
measuring AC expertise. The authors divided expertise into accounting financial expertise
and supervisory financial expertise where each category of expertise is measured as a
proportion of the AC size.
ASX CGC (2007) states that the AC should include members, who are all financially literate,
have relevant qualifications and have an understanding of the industry in which the entity
operates. Following the ASX CGC’s recommendation, two measures of expertise are
constructed in this study. Expertise of the AC is measured by two independent variables:
accounting/financial expertise (ACEXP) and industry expertise (ACINDUS). Accounting
experts include AC members who are or were certified public accountants, charted

102
accountants, CFOs, vice presidents of finance, financial controllers, certified management
accountants, certified financial analysts, principal financial officers, auditors or chief
accounting officers (Hoitash and Hoitash, 2009). ACEXP is a ratio of number of AC
members with accounting or financial qualification to total number of AC members while
ACINDUS is a ratio of number of AC members who has worked in the same industry as the
company for a substantial number of years (at least 10 years) to total number of AC members.
AC Meeting
Recent papers have supported the importance of AC frequency of meetings (Beasley et al.,
2000 and Abbott et al. 2004). Given the various roles and responsibilities allocated to the AC,
it needs to hold sufficient meetings to undertake its obligation effectively. The ASX CGC
does not provide recommendations on the number of meetings that an AC should have each
year. Following earlier studies (Abbott et al., 2003; Goodwin and Kent, 2006; Yatim et al.,
2006; Hoitash and Hoitash, 2009; Singh and Newby, 2010), AC frequency of meetings
(ACMEET) in this study measures the number of AC meetings held during the financial year
ending in 2010.
AC Size
Psaros (2009) argued that an AC needs to have sufficient members such that different and
informed views can be canvassed, and also so that it is not dominated by one individual.
However, an AC needs to be sufficiently small such that it is focused, and streamlined in
decision making to accounting and auditing demands. ASX CGC (2007) Recommendation
4.2 states that the AC should be structured so that it has at least three members. Three
members is considered ideal by the ASX CGC as one member cannot possibly carry out the
wide responsibilities of the AC and in an unforeseen circumstances that required a vote, there
are enough numbers such that a majority decision can be made. In this study, AC size
(ACSIZE) measures the number of members serving on the AC during the financial year
ending in 2010 (Goodwin and Kent, 2006; Yatim et al., 2006; Hoitash and Hoitash, 2009;
Singh and Newby, 2010).
AC Charter
AC formal charter shows the composition of the committee, its basic framework, structure,
membership requirements and committee’s responsibilities. According to ASX CGC (2007)

103
Recommendations 4.3, the AC should have a formal charter. The ASX CGC’s
Recommendations for an AC charter sets forward the minimum expectations of companies.
To date, no study in Australia examines AC formal charter as one of the quality of AC’s
governance characteristics. Hence, in this study the presence of an AC formal charter is
measured as a categorical variable. AC formal charter (ACCHAR) is equal to the value of “1”
if the AC has a charter and “0” otherwise.
AC Fees
Agency conflicts arise due to separation of ownership and control between the shareholders
and the managers of the company. The managers working on behalf of the shareholders do
not usually act in the best interest of the shareholders. An AC that consists of independent
non-executive directors, without a day-to-day responsibility is in a good position to perform a
monitoring function for the shareholders (Goddard and Masters, 2001). The ASX CGC
(2007) states that ACs are responsible for reviewing the entity’s financial statements,
ensuring the independence and competence of the external auditors and internal audit
function and overseeing the entity’s internal controls.
The wide roles and responsibilities of an AC will protect the interest of shareholders and thus,
reduce the shareholders-managers agency conflicts. Agency costs arise due to the cost of
hiring the AC to monitor the actions of the managers and directors of the company. In this
study, AC fees (ACFEES) measures the total fees paid to the chair and AC members for the
financial year ending in 2010.
A summary of the definitions and measurements of the independent variables is presented in
Table 9.

104
Table 9: Definitions and Measurements of the Independent Variables
Independent
Variables
Acronym
Definition Measurement References
ACCHAIR
IND
Chair of AC
independence
Score is assigned if AC chair satisfies the
requirements: same qualifications to CEO
and CFO and same industry experience to
CEO and CFO.
Abbott et al. (2003)
Rainsbury et al. (2003)
Goodwin and Kent (2006)
Yatim et al. (2006)
Singh and Newby (2010)
ACEXP AC
accounting/
financial
expertise
(Number of AC members with accounting or
financial qualifications) / Total AC
members.
Abbott et al. (2003)
Mangena and Pike, (2004)
Goodwin and Kent (2006)
Yatim et al. (2006)
Hoitash and Hoitash (2009)
Rainsbury et al. (2009)
ACINDUS AC industry
expertise
{Number of AC members who worked in
the same industry for a substantial number
of years (at least 10 years)}/ Total AC
members.
ACMEET AC
frequency of
meetings
Number of AC meetings held during the
financial year.
Abbott et al. (2003)
Rainsbury et al. (2003)
Goodwin and Kent (2006)
Yatim et al. (2006)
Hoitash and Hoitash (2009)
ACSIZE AC size Number of members serving on the AC
during the financial year.
Goodwin and Kent (2006)
Yatim et al. (2006)
Hoitash and Hoitash, (2009)
Singh and Newby (2010)
ACCHAR AC formal
charter
Equal to the value of “1” if AC has a charter
and “0” otherwise.
Kalbers and Fogarty (1993)
ACFEES AC fees Total fees paid to the chair and AC
members.
ACFEES
RATIO
AC fees ratio Ratio of total fees paid to the chair and AC
members to total number of AC members.
AUDFEES
RATIO
External
audit fees
ratio
Ratio of total external audit fees to total
assets.
Hoitash and Hoitash (2009)
Yatim et al. (2006)
IAFBUD
RATIO
Internal audit
function
budget ratio
Ratio of total internal audit budget to total
assets.
Carcello et al. (2005)
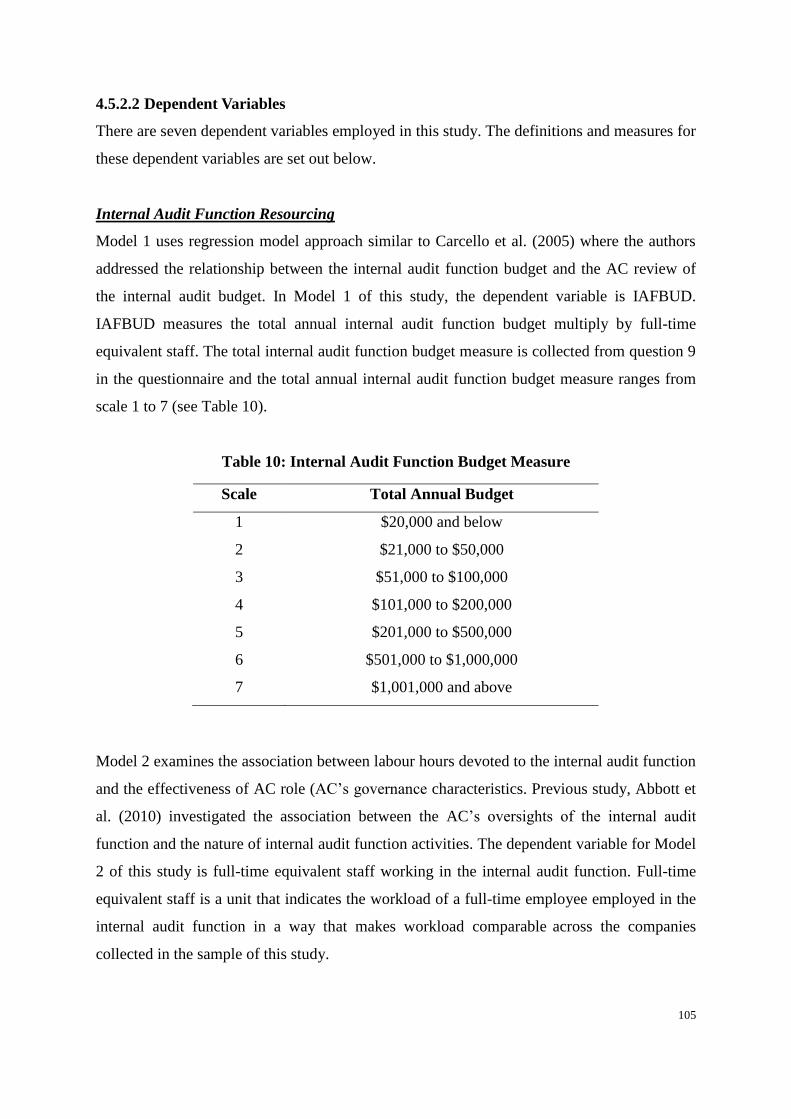
105
4.5.2.2 Dependent Variables
There are seven dependent variables employed in this study. The definitions and measures for
these dependent variables are set out below.
Internal Audit Function Resourcing
Model 1 uses regression model approach similar to Carcello et al. (2005) where the authors
addressed the relationship between the internal audit function budget and the AC review of
the internal audit budget. In Model 1 of this study, the dependent variable is IAFBUD.
IAFBUD measures the total annual internal audit function budget multiply by full-time
equivalent staff. The total internal audit function budget measure is collected from question 9
in the questionnaire and the total annual internal audit function budget measure ranges from
scale 1 to 7 (see Table 10).
Table 10: Internal Audit Function Budget Measure
Scale Total Annual Budget
1 $20,000 and below
2 $21,000 to $50,000
3 $51,000 to $100,000
4 $101,000 to $200,000
5 $201,000 to $500,000
6 $501,000 to $1,000,000
7 $1,001,000 and above
Model 2 examines the association between labour hours devoted to the internal audit function
and the effectiveness of AC role (AC’s governance characteristics. Previous study, Abbott et
al. (2010) investigated the association between the AC’s oversights of the internal audit
function and the nature of internal audit function activities. The dependent variable for Model
2 of this study is full-time equivalent staff working in the internal audit function. Full-time
equivalent staff is a unit that indicates the workload of a full-time employee employed in the
internal audit function in a way that makes workload comparable across the companies
collected in the sample of this study.

106
To obtain a measure of full-time equivalent staff, the numerator of the formula is a
multiplication of two products: maximum weekly working hours multiply by working weeks
per year. The standard maximum weekly working hours in Australia is 38 weeks and the
average working weeks per year is 52 weeks. The denominator of the formula is total hours
per employee that are devoted to internal audit services which are obtained from question 10
in the questionnaire. Then, the whole fraction is multiply by the number of internal audit staff
employed in the company which is obtained from question 8 in the questionnaire. A
mathematical representation of full-time equivalent staff is:
Maximum weekly working hours x Working weeks per year X
Total hours per employee that are devoted to internal audit services
Internal Audit Function Independence
The results of many studies (Schneider and Wilner, 1990; McHugh and Raghunandan, 1994;
Goodwin and Yeo, 1998; Van Peursem, 2005; Christopher et al., 2009) posited that the
independence of the internal audit function plays an important role in an organisation. Model
3 and 4 of this study measures the association between the effectiveness of AC role (AC’s
governance characteristics) and the internal audit function independence. The dependent
variable for Model 3 is internal audit function independence (IAFIND) and the dependent
variable for Model 4 is AC support for the internal audit function independence
(ACSUP_IAFIND). Both dependent variables are factor scores from a principal component
analysis (PCA). PCA are performed to reduce the number of items in question 21 in the
questionnaire into components that account for most of variance in the internal audit function
independence variables.
External Audit Quality
Similar to most literature (Abbott et al., 2003; Goodwin and Kent, 2006; Yatim et al., 2006;
Hoitash and Hoitash, 2009), the dependent variable for the Model 5 in this study is external
audit fees. External audit fees are measured by the total value of audit fees paid by the
company to the external auditors. The total audit fees are collected from the annual reports
Number of
internal audit
staff
employed in
the company

107
and are then transformed into natural log (LNAUDFEES). The natural log is used to control
for the skewed nature of audit fees (Yatim et al., 2006).
External Auditors Independence
The dependent variable for Model 6 is the ratio of non-audit fees to total fees (Abbott et al.,
2003; Hoitash and Hoitash, 2009). The ratio of non-audit fees to total audit fees is
transformed into natural log (LNNONAUDAFEES) too. Fees paid to external auditors
consists of audit service fees as well as fees paid for other services such as taxation and
management advice. While all fees potentially create economic bonds between the auditor
and client, critics have alleged that the provision of non-audit services gives audit firms
incentives to agree with accounting choices by management, thus reducing auditor
independence and ultimately the quality of financial reporting (Coulton et al., 2007).
Shareholders Return
Lastly, Model 7 in this study tests the association between the audit-related agency
monitoring costs (external audit fees, internal audit function budget and AC fees) and total
shareholders return. The dependent variable for Model 7 is total shareholders return. Total
shareholders return is calculate by subtracting share price at the end of the period with share
price at the beginning of the period and adding dividend per share. The whole equation would
then be divided by share price at the beginning of the period. A mathematical representation
of total shareholders return is:
(Share price at the end of the period - Share price at the beginning of the period + Dividend
per share)
Share price at the beginning of the period
A summary of the definitions and measurements of the dependent variables is presented in
Table 11.

108
Table 11: Definitions and Measurements of the Dependent Variables
Independent
Variables
Acronym
Definition Measurement References
IAFBUD Internal audit
function budget
Total annual internal audit budget measure x
full-time equivalent staff.
Carcello et al.
(2005)
IAHOUR
Internal audit
function hours
Full-time equivalent staff working in the
internal audit function.
Abbott et al.
(2003)
IAFIND Internal audit
function
independence
Internal audit function independence is factor
score from PCA.
Ahmad and
Taylor (2009)
ACSUP_IAFIND
AC support for internal audit function
independence is factor score from PCA.
LNAUDFEES
Total value of
audit fees paid by
the firm to the
external auditors
Total audit fees are collected from the company
annual reports and are then transformed into
natural log.
Hoitash and
Hoitash
(2009)
Yatim et al.
(2006)
LNNON
AUDFEES
Total value of non-
audit fees paid by
the firm to the
external auditors
Total fees paid for non-audit services divided
by the total fees paid to the external auditors
and are then transformed into natural log.
Hoitash and
Hoitash
(2009)
TSR Total shareholders
return (Share price at the end of the period - Share
price at the beginning of the period + Dividend
per share) / Share price at the beginning of the
period.
Habib and
Azim (2008)
4.5.2.3 Control Variables
Additional variables are included in the regression models to control for other factors that are
expected to potentially affect the dependent variables. The definitions and measures for these
control variables are set out below.
Control Variables for Model 1 and Model 2
Both Model 1 and Model 2 control for the same effects of other variables. These models
control for firm size: natural log of total assets (LNTA) and ratio of total long-term debt to
total assets (LEVERAGE). A positive association between the control variables and the

109
dependent variables would be expected as larger and more leveraged firms are likely to
increase the internal audit function labour hours and budget to ensure greater efficiency of the
internal control system (Carcello et al., 2005 and Abbott et al., 2010). Since firm complexity
has the potential to increase the need for better monitoring and internal controls, this study
expects the control variables such as ratio of inventory to total assets (INVENRATIO), ratio
of receivables to total assets (RECRATIO), ratio of number of foreign subsidiaries to total
number of subsidiaries (FORSUB) and square root of total number of subsidiaries (SUB) to
be positively related to the dependent variables.
Model 1 and 2 also control for growth (Carcello et al., 2005 and Abbott et al., 2010).
According to Beasley (1996), firms experiencing rapid growth rates may experience
deterioration in controls, driving the AC to demand more controls-oriented work. Thus, there
will be a positive relationship between the three-year rate of sales growth (GROWTH) and
the dependent variables. Furthermore, similar to Carcello et al. (2005), this study also expects
a positive sign for operating cash flow (OPCASH) and ratio of current assets to current
liabilities (CURATIO).
Control Variables for Model 3 and Model 4
Model 3 and 4 controls for firm size: natural log of total assets (LNTA). A positive
association between firm size and the dependent variables would be expected as larger firm
will ensure better internal audit function independence. The regression models also control
for the quality of the external auditor by indicating whether the firm is audited by Big 4
auditors (BIG4), expecting a positive sign.
Control Variables for Model 5
Furthermore, Model 5 controls for the outcome of other variables that can affect the external
audit fees. Studies have found external audit fees to be related to firm size, firm complexity,
audit risk of the client firm, profitability, the use of Big 4 audit firm and industry (Simunic,
1980; Francis, 1984; Craswell and Francis, 1999; Abbott et al., 2003; Goodwin and Kent,
2006; Hoitash and Hoitash, 2009; Singh and Newby, 2010). Similar to Goodwin and Kent
(2006) and Singh and Newby (2010), the firm size control variable is measured by the natural
log of the firm’s total assets (LNTA) and a positive sign is expected. The firm complexity
control variable is measured by the square root of the total number of subsidiaries (SUB) and

110
the ratio of foreign subsidiaries to total number of subsidiaries (FORSUB) (Low et al., 1990;
Simon, 1995). Firm complexity variables will be positively related to audit fees.
In addition, the risk level of the company is measured by whether the firm records a loss in
any of the three years prior to 2010 (LOSS) and by the ratio of earnings before interest and
tax to total assets (ROA) (Johnson et al., 1995). Further measures of risk also comprise of the
ratio of receivables to total assets (RECRATIO), the ratio of non-current liabilities to total
assets (DEBTRATIO) and the ratio of inventory to total assets (INVENRATIO) (Sumunic,
1980; Taylor, 1997). This study expects that ROA will be negatively related to audit fees and
that there will be a positive association between the rest of the risk variables and audit fees.
The regression model also controls for the quality of the external auditor by indicating
whether the firm is audited by Big 4 auditors (BIG4), expecting a positive sign (Chan et al.,
1993).
Moreover, this study includes control variables: whether the firm is in the mining sector
(MINING), board-related factors involving board independence (BOARDINDEP) and
number of board meetings (BOARDMEET). According to Carcello et al. (2002) and Abbott
et al. (2003), board independence and board meetings are positively associated with audit
fees. The reasoning is that outside directors on the board who act diligently will demand a
higher quality of audit and thus leads to higher audit fees.
Control Variables for Model 6
The same control variables in Model 5 are also used in Model 6, the non-audit fees model.
This study expects that firm size (LNTA) and complexity variables (SUB and FORSUB) are
positively related to non-audit fees because larger and more complex firms are more likely to
purchase non-audit services (Palmrose, 1986). Furthermore, risk variables such as LOSS,
RECRATIO, DEBTRATIO and INVENRATIO (except for ROA) will be positively related
with non-audit fees. Hoitash and Hoitash (2009) posited that risk variables reflect the
financial state of the firm and its ability to invest in a good internal control system.
Similar to Model 5, Model 6 also controls for Big 4 auditors (BIG4). Since Big4 auditors
have the potential to provide more non-audit services, this study expects that BIG4 variable
will be positively associated to non-audit fees. In addition, control variables such as board

111
independence (BOARDINDEP) and number of board meetings (BOARDMEET) will be
negatively associated to non-audit fees as board of directors whom are independent and
diligent will demand less non-audit services to ensure the external auditors’ independence.
Control Variables for Model 7
No control variables are employed in Model 7 for this study.
A summary of the definitions and measurements of the control variables are presented in
Table 12.

112
Table 12: Definitions and Measurements of the Control Variables
Control
Variables
Acronym
Definition Measurement References
BIG4 Big 4 audit firm Equal to the value of “1” if a Big 4 auditor is
used and “0” when a smaller audit firm is
used.
Simunic (1980)
Francis (1984)
Palmrose (1986)
Low et al.
(1990)
Chan et al.
(1993)
Johnson et al.
(1995)
Simon (1995)
Beasley (1996)
Taylor (1997)
Francis (1999)
Carcello et al.
(2002)
Abbott et al.
(2003)
Carcello et al.
(2005)
Goodwin and
Kent (2006)
Hoitash and
Hoitash (2009)
Singh and
Newby (2010)
Abbott et al.
(2010)
LNTA Total assets Natural log of total assets (in millions).
LEVERAGE Leverage Ratio of total long-term debt to total assets.
RECRATIO Receivables ratio Ratio of receivables to total assets.
INVENRATIO Inventory ratio
Ratio of inventory to total assets.
CURATIO Current ratio
Ratio of current assets to current liabilities.
OPCASH Operating cash
flow
Ratio of operating cash flow to total assets.
FORSUB Foreign
subsidiaries
Ratio of number of foreign subsidiaries to
total number of subsidiaries.
SUB Subsidiaries
Square root of total number of subsidiaries.
LNAUDFEES External audit fees
Natural log of total audit fees paid to
external auditor.
GROWTH Growth Three-year rate of sales growth.
BODIND Board of directors
independence
Ratio of non-executive directors on the board
to total number board of directors.
BODMEET Board of directors
meetings
Number of board meetings held during the
year.
MINING Mining Equal to the value of “1” when the company
is in the mining industry, “0” otherwise.
LOSS Loss
Equal to the value of “1” if the company has
reported a loss in any of the three years prior
to, “0” otherwise.
ROA Return on assets
Ratio of earnings before interest and tax to
total assets.
DEBTRATIO Debt ratio Ratio of non-current liabilities to total assets.

113
4.6 Model Specification
4.6.1 Introduction
There are seven ordinary least squares (OLS) multiple regression models used to test the
hypotheses of this study. Regression analysis helps researchers to understand how the typical
value of the dependent variable changes when any one of the independent variables is varied,
while the other independent variables are held fixed. OLS regression models are used in this
study to better understand which among independent variables (AC’s governance
characteristics) are related to the dependent variables (internal audit function and external
audit).
Also, OLS regression models are employed to explore the forms of these relationships
whether ACs in Australia are effective in fulfilling their roles in overseeing the quality of the
internal audit function, ensuring the independence of the internal audit function, facilitating
the quality of the external audit and ensuring the independence of the external auditors.
Agency costs arise due to the cost of hiring the AC, as well as internal and external auditors
to monitor the actions of the management in the company. Such agency costs are also tested
using an OLS regression model.
4.6.2 AC Overseeing the Quality of the Internal Audit Function
Models 1 and 2 examine the effectiveness of AC roles in overseeing the quality of the
internal audit function. The first model examines the association between the effectiveness of
AC role, based on AC’s governance characteristics (i.e., independence, financial and industry
expertise, size, frequency of meetings and charter) and financial resources (internal audit
function budget) devoted to the internal audit function. To test hypothesis one (a), this study
employs an OLS regression model approach similar to Carcello et al. (2005), Goodwin and
Kent (2006) and Abbott et al. (2010) that used an agency-based framework to explain the
demand for internal audit services. The regression framework is summarized as follows:

114
MODEL 1
IAFBUD = b0 + b1ACCHAIRIND + b2ACEXP + b3ACINDUS + b4ACMEET +
b5ACSIZE + b6ACCHAR + b7BIG4 + b8LNTA + b9LEVERAGE +
b10RECRATIO + b11INVENRATIO + b12CURATIO + b13OPCASH +
b14FORSUB + b15SUB + b16LNAUDFEES + b17GROWTH + ε
Note: Refer to Table 9, 11 & 12 for definitions and measurements of the variables in Model 1.
The second model examines the association between the effectiveness of AC role and total
hours devoted to the internal audit function. The result of running Model 2 will test
hypothesis one (b). Similar to Abbott et al. (2010) the regression equation is summarized as
follows:
MODEL 2
IAHOUR = b0 + b1ACCHAIRIND + b2ACEXP + b3ACINDUS + b4ACMEET +
b5ACSIZE + b6ACCHAR + b7BIG4 + b8LNTA + b9LEVERAGE +
b10RECRATIO + b11INVENRATIO + b12CURATIO + b13OPCASH +
b14FORSUB + b15SUB + b16LNAUDFEES + b17GROWTH + ε
Note: Refer to Table 9, 11 & 12 for definitions and measurements of the variables in Model 2.
4.6.3 AC Ensuring the Independence of the Internal Audit Function
Models 3 and 4 examine the association between the effectiveness of AC role in ensuring the
independence of the internal audit function. The results of running both the models are to test
hypothesis two (a) and hypothesis two (b) of this study. AC is an important vehicle in
increasing the status and the independence of the internal audit function. Previous literature
(McHugh and Raghunandan, 1994; Goodwin and Yeo, 2001; Christopher et al., 2009) argued
that the relationship between the internal audit function and the AC could affect the internal
auditor’s independence. The regression equations are summarized as follows:
MODEL 3
IAFIND = b0 + b1ACCHAIRIND + b2ACEXP + b3ACINDUS + b4ACMEET + b5ACSIZE
+ b6ACCHAR + b7BIG4 + b8LNTA + ε
MODEL 4
ACSUP_IAFIND = b0 + b1ACCHAIRIND + b2ACEXP + b3ACINDUS + b4ACMEET +
b5ACSIZE + b6ACCHAR + b7BIG4 + b8LNTA + ε
Note: Refer to Table 9, 11 & 12 for definitions and measurements of the variables in Model 3 and Model 4.

115
4.6.4 AC Facilitating the Quality of the External Audit
Model 5 examines the relationship between the effectiveness of AC role and the quality of
external auditors using audit fees. To test hypothesis three, this study employed and extended
the traditional audit fee model (Simunic, 1980; Francis, 1984; Francis and Simon, 1987;
Craswell and Francis, 1999). The regression equation is summarized as follows:
MODEL 5
LNAUDFEES = b0 + b1ACCHAIRIND + b2ACEXP + b3ACINDUS + b4ACMEET +
b5ACSIZE + b6ACCHAR + b7BODIND + b8BODMEET + b9BIG4 +
b10MINING + b11LOSS + b12ROA + b13INVENRATIO +
b14RECRATIO + b15DEBTRATIO + b16FORSUB + b17SUB + b18LNTA
+ ε
Note: Refer to Table 9, 11 & 12 for definitions and measurements of the variables in Model 5.
4.6.5 AC Ensuring the Independence of the External Auditors
Model 6 examines the association between the effectiveness of AC role and the independence
of the external auditors. To test hypothesis four, whether strong ACs is associated with a
lower ratio of non-audit fees to total audit fees (a proxy for the independence of the external
auditors), this study extends the non-audit fees model. Previous studies (DeAngelo, 1981;
Prakash and Venable, 1993; Firth, 1997) showed that non-audit fees can threaten the
independence of external auditors. Model 6 is summarized as follows:
MODEL 6
LNNONAUD
FEES = b0 + b1ACCHAIRIND + b2ACEXP + b3ACINDUS + b4ACMEET +
b5ACSIZE + b6ACCHAR + b7BODIND + b8BODMEET + b9BIG4 +
b10MINING + b11LOSS + b12ROA + b13INVENRATIO +
b14RECRATIO + b15DEBTRATIO + b16FORSUB + b17SUB + b18LNTA
+ ε
Note: Refer to Table 9, 11 & 12 for definitions and measurements of the variables in Model 6.

116
4.6.6 Audit-related Agency Monitoring Costs and Total Shareholders Return
Model 7 tests the association between the audit-related agency monitoring costs (external
audit fees, internal audit function budget and AC fees) and total shareholders return. The
result of running this model is to test hypothesis five. Model 7 is summarized as follows:
MODEL 7
TSR = b0 + b1ACFEESRATIO + b2AUDFEESRATIO + b3IAFBUDRATIO + ε
Note: Refer to Table 9, 11 & 12 for definitions and measurements of the variables in Model 7.
4.7 Conceptual Model
These model specifications are framed within the development of a conceptual model. The
hypothesised relationships between the variables in this study are shown by the arrows
connecting the boxes in Figure 1.
Figure 1: Conceptual Model
H1 & H2
H3 & H4
H5

117
CHAPTER 5. DATA ANALYSIS AND DISCUSSION
5.1 Introduction
The main purpose of this chapter is to present the results of tests of the five hypotheses as set
out in Chapter 3. Before presenting these hypotheses test results, the chapter begins by giving
the profile, description and validation of variables for the questionnaire-data based sample
(referred to as sample 1) and secondary-data based sample (referred to as sample 2),
respectively. It further gives an explanation and justification of the methods of analysis that
will be used on the data from samples 1 and 2, involving: (1) tests for small sample size
relating to sample 1; (2) normality tests on data that will be used in parametric analysis; (3)
explanation of the choice of model specifications; and (4) justification of the choice of
correlation analysis and multiple regression analysis.
For sample 1 (questionnaire-data based sample), it is optional for the respondents to provide a
company name but all 36 respondents did so. Hence, the primary data from the 36
respondents in sample 1 could be linked to the secondary data of their 36 corresponding
companies drawn from the 255 companies in sample 2 (secondary-data based sample).
Moreover, the questionnaire contains questions that go beyond those specifically required for
use in testing the hypotheses of this study. Some data from sample 1 relating to internal audit
function activities is used to measure variables contained in models that test hypotheses one
and two, while other data from sample 1 is used in comparative case study analysis which is
discussed in detail the next chapter (Chapter 6).
The secondary data from sample 2, on the other hand, is used to measure variables concerned
with aspects of external audit, corporate governance characteristics and company financial
results and structures. These variables arising from sample 2’s data are used in models related
to all the five hypotheses of this study.

118
5.2 Sample 1 (Questionnaire-data Based Sample): Profile, Description and
Validation of Variables
5.2.1 Profile of the Questionnaire Respondents and their Companies
From Table 13, it can be seen that of the total of 36 respondents, approximately half (50%)
are between 45 to 54 years of age, and 78% are male. Also the experience of the respondents
in the internal audit field is reasonably high with 50% having more than 10 years experience
in the field. 89% of the respondents’ current job position is Chief Internal Auditor (CIA) or
an equivalent title, while the remaining 11% of the respondents hold the CFO position.
Table 13 also shows the profile of the companies in which the respondents work.
Approximately 44% of the companies surveyed are in the ASX top 101- 200 (based on
market capitalisation), 42% of the companies are in the ASX top 21-100 while the rest of the
companies, 14% are in the ASX top 20. The companies are well spread across the GICS
industry sectors in the ASX with industries most represented being materials and financials
(both at 22%) while health care and utilities are under-represented (both at 3%). No
companies are represented in information technology and telecommunications services.

119
Table 13: Profile of the Respondents and Companies (n= 36)
No. Questionnaire items Frequency
No %
1 Your age group:
Below 35 5 14
35 to 44 8 22
45 to 54 18 50
55 to 64 5 14
65 or older
0 0
2 Gender:
Male 28 78
Female
8 22
3 How long have you worked in the internal audit field over your
career?
Less than 5 8 22
Between 5-10 10 28
Between 11-15 6 17
Between 16-20 7 19
More than 20
5 14
4 What is your current job position?
Chief Internal Auditor or other similar titles 32 89
CFO
4 11
6 Size of your company based on market capitalization:
ASX top 20 5 14
ASX 21- 100 15 42
ASX 101- 200 16 44
ASX 301- 500 0 0
ASX below 500
0 0
7 Industry of your company:
Consumer Discretionary 6 17
Consumer Staples 5 14
Energy 2 5
Financials 8 22
Health Care 1 3
Industrials 5 14
Information Technology 0 0
Materials 8 22
Telecommunication Services 0 0
Utilities 1 3
Others
0 0

120
5.2.2 Profile of ACs
Respondents are asked about the working relationship between the internal audit function and
the AC. Their responses are summarised in Table 14. The number of meetings and the length
of meetings per year between the respondents (CIA) and the AC are presented in Panel A of
Table 14. A total of 70% of CIAs attended 4 to 5 meetings a year with the AC and the length
of the meetings is between 81 to 120 minutes for 36% of the respondents. As an indicator of
the diligence of the AC, these results compare favourably with previous studies that found
CIAs have about 4 meetings per year with the AC (Raghunandan et al., 1998; Scarbrough et
al., 1998; Goodwin and Yeo, 2001). Raghunandan et al. (2001) reported on average, 3.3
meetings per year with the CIAs and 4.53 times per year for Goodwin (2003). Raghunandan
et al. (2001) and Goodwin (2003) also reported on the length of the meetings, which is on
average 60 and 99 minutes respectively.
In terms of privacy of the meetings with the AC, 36% of the CIAs in this study have some
meetings in a year that have private time, while 8% of the respondents have all meetings that
are totally private and 22% of the respondents have no private meetings at all with the CIA.
So there is no common practice concerning the confidentiality that the CIA can have from
other executives when meeting with the AC. The 22% of CIAs who indicated no private
meetings with the AC could prospectively have their independence compromised.
Further results in Table 14, Panel A, show 58% of ACs receive 3 to 5 routine internal audit
reports per year, and 84% of ACs receive 1 to 5 special investigation reports from the internal
audit function. Moreover, ACs review or assess the plans of the internal audit function in
terms of scheduling of work projects, on average, 3.64 times a year (shown in Panel B, Table
14). In terms of coordination between the internal audit function and the external auditors,
the AC reviews this on average 3.25 times a year. These results compare favourably with
earlier studies by Raghunandan et al. (1998) and Goodwin and Yeo (2001) where both
studies found that almost 70% of ACs review all plans, budgets and results relating to
financial reporting, internal controls and compliance. Likewise, Scarbrough et al. (1998)
found that 69% of ACs review the proposed internal audit program.
On the issue of financial expertise, CIAs are requested to rate the overall expertise of their
AC members in regards to accounting, auditing and internal control matters. Results in Panel

121
A of Table 14 show that 64% of respondents perceived their AC to have excellent expertise,
with a further 25% reporting that their AC members have good expertise. Only one
respondent rated his/her AC expertise as poor.
Generally, results in Table 14 suggest that there is a considerable level of communication and
interaction between the CIA and the AC in large listed companies through formal meetings,
presentations of reports by the CIA and reviews of the internal audit function’s plans, budgets
and results by the AC. This considerable communication and interaction between the CIA
and the AC is in line with expectations of recommended practice issued by both the ASX and
the IIA. The ASX’s CGC recommends that a key role of the AC is overseeing and monitoring
the internal audit function, while the IIA (2002a, 2002b, 2003a, 2003b) recommends that
communication between the personnel responsible for the internal audit function and the AC
is important for the maintenance of good corporate governance.

122
Table 14: AC and the Internal Audit Function (n= 36)
PANEL A
No. Questionnaire items Frequency
No %
16 How many times a year does you/ your internal audit function meet
with the AC and how long is the length of the meeting? (n= 36)
Number of meetings a year:
Less than 1
1
3
Between 2- 3 3 8
Between 4- 5 25 70
Between 6- 7 4 11
More than 7
3 8
Length of the meetings:
Less than 40 minutes 6 17
Between 40- 80 minutes 8 22
Between 81- 120 minutes 13 36
Between 121- 160 minutes 2 6
More than 160 minutes
7 19
17 In terms of privacy of your meetings with the AC (chair, individual
members or committee): (n= 36)
All meetings are totally private 3 8
All meetings are partially private 12 34
Some meetings in a year have private time 13 36
No private meetings
8 22
18 How do you rate the overall expertise of the AC members in regards
to accounting, auditing and internal control matters? (n=36)
Poor 1 3
Moderate 3 8
Good 9 25
Excellent
23 64
20 How often per year does the AC receive reports from your internal
audit function related to: (n= 36)
Routine internal audit activities:
None per year 0 0
1-2 per year 6 17
3-5 per year 21 58
6 or more per year
9 25
Special Investigations:
None per year 3 8
1-2 per year 15 42
3-5 per year 15 42
6 or more per year
3 8

123
PANEL B
No. Questionnaire items Mean Median 25th
%
75th
%
Std.
Dev.
19 Likert-Scale (1= Never, 2= Seldom, 3=
Sometimes, 4= Often, 5= Almost Always)
How often does the AC review or assess
the plans of the internal audit function in
terms of its:
Scheduling of work projects 3.64 4.00 3.00 4.00 1.18
Co-ordinating with the external auditors
3.25 3.00 2.00 3.00 1.25
5.2.3 Descriptive Statistics for Variables in Model 1 and Model 2
The descriptive statistics for variables in Model 1 and Model 2 are presented in Tables 15 and
16. Table 15 gives results relating to the internal audit function’s resources and activities
(from questions 8 to 10 of the questionnaire).
In Panel A, it shows 58% of the respondents’ internal audit function has human resources of
less than 5 professional internal audit staff employed and only 8% have more than 20
professional internal audit staff employed. Panel A further shows the extent of money
resources in the form of the total annual internal audit function budget. More than half, 54%
of the respondents’ internal audit function has a total annual budget ranging from $201,000 to
$1,000,000, with a further 31% reporting a total annual budget, above $1,001,000. Turning to
the work activity level of the internal audit function, Panel B in Table 15 indicates the total
hours devoted to internal audit services. On average, 1,489 hours per annum (or 28 hours per
week) per person are devoted to internal audit services by professional staff during the 2010
financial year. This suggests not all professional staff is employed in the internal audit
function on a full-time basis.

124
Table 15: Internal Audit Function Activities (n= 36)
PANEL A
No. Questionnaire items Frequency
No %
8 How many professional internal audit staff is employed in your
company?
Less than 5 21 58
Between 5- 10 9 25
Between 11- 15 2 6
Between 16- 20 1 3
More than 20
3 8
9 What is the total annual internal audit budget?
$20,000 and below 1 3
$21,000 to $50,000 1 3
$51,000 to $100,000 1 3
$101,000 to $200,000 2 6
$201,000 to $500,000 10 27
$501,000 to $1,000,000
$1,001,000 and above
10
11
27
31
PANEL B
No. Questionnaire items Mean Median 25th
% 75th
% Std.
Dev.
10 How many total hours are
devoted to internal audit
services by professional staff
(per person) during your
company’s most recent
financial year?
1,488.89
1,550.00
1,060.00
1975.00
661.13
Descriptive statistics for the variables in Table 16 are drawn from sample 2’s (secondary-data
based sample) published data of the 36 respondents’ companies. Panel A of Table 16 reports
statistics for continuous variables while Panel B reports statistics for dichotomous variables.
The AC’s governance characteristics (independent variables) are the variables of interest in
this study. The size of ACs (ACSIZE) ranges from 2 to 9 members, with a mean of 3.53
members. On average 4.47 AC frequency of meetings (ACMEET) are held during the
financial year ending in 2010 with a minimum of 0 meeting and a maximum of 9 meetings.
The mean percentage of AC members with accounting or financial qualifications to total
members (ACEXP) is 69%, ranging from 25% to 100%. Furthermore, the mean percentage of
total AC members that have worked in the same industry for at least 10 years (ACINDUS) is

125
about 50%. The mean AC chair independence (ACCHAIRIND) is 65% of cases. The
inference from these results is that AC characteristics of size and frequency of meetings,
expertise and independence are quite variable across the 36 companies in sample 1.
In terms of control variables, Table 16 reveals considerable diversity in the sample. The total
audit fees paid to the external auditors (AUDFEES) range from a minimum of $0.13 million
to a maximum of $16.38 million, with a mean of $2.74 million; the number of subsidiaries
(SUB) in this study ranges from 1.73 to 22.72 with a mean of 8.08 subsidiaries; the
percentage of foreign subsidiaries to total subsidiaries (FORSUB) ranges from 0% to 81%,
with a mean of 36%; the levels for inventory (INVENRATIO) and receivable ratios
(RECRATIO) are at both ends of the liquidity scale, with means of 7% and 19% respectively;
leverage (LEVERAGE) and current (CURATIO) ratios display means of 23% and 166%
correspondingly; operating cash flows ratio (OPCASH) shows a minimum of -13% and a
maximum of 139%; growth rate (GROWTH) shows a minimum of -33% and a maximum of
182%.
In Model 1 and Model 2, the dependent variables are measures of the internal audit function’s
relative extent of monetary resourcing (IAFBUD) and human resourcing (IAFHOUR). They
reflect the importance accorded to the internal audit function, which should largely be
championed by the AC as the company’s oversight body for the internal audit function.
Table 16, Panel A, shows that the average total annual internal audit budget per full-time
equivalent internal audit staff member (IAFBUD) is $45.56, ranging from a minimum of $0
to a maximum of $532. The number of full-time equivalent staff working in the internal audit
function (IAHOUR) is between 0 and 76 with an average staff size of 6.83.
Additional corporate governance characteristics are shown in Panel B of Table 16. Results
indicate that almost all companies in sample 1 have a formal charter for their AC. Also
almost all companies engage a Big 4 auditor firm as their external auditors.

126
Table 16: Descriptive Statistics for Model 1 and Model 2 (n=36)
PANEL A: Continuous Variables
Variable Name Mean Median Minimum Maximum Standard
Deviation
ACCHAIRIND 0.65 0.75 0.25 1.00 0.24
ACEXP 0.69 0.67 0.25 1.00 0.21
ACINDUS 0.50 0.33 0.00 1.00 0.28
ACMEET 4.47 4.00 0.00 9.00 1.86
ACSIZE 3.53 3.00 2.00 9.00 1.16
LEVERAGE 0.23 0.90 0.00 3.71 0.61
RECRATIO 0.19 0.72 0.00 3.33 0.55
INVENRATIO 0.07 0.04 0.00 0.24 0.08
CURATIO 1.66 1.28 0.01 10.27 1.71
OPCASH 0.13 0.08 -0.13 1.39 0.23
FORSUB 0.36 0.37 0.00 0.81 0.29
SUB 8.08 7.28 1.73 22.72 4.90
GROWTH 0.16 0.03 -0.33 1.82 0.41
IAFBUD 45.56 13.00 0.00 532.00 96.20
IAHOUR 6.83 2.00 0.00 76.00 13.67
ASSET ($) 24,800M 3,090M 163.4M 0.60B 0.10B
AUDFEES ($) 2.74M 1.14M 0.13M 16.38M 4.11M
PANEL B: Dichotomous Variables
Variable Name Mean Median Number of Firms
Coded “0”
Number of Firms
Coded “1”
ACCHAR 0.94 1.00 2 34
BIG4 0.97 1.00 1 35
Note: ACCHAIRIND is ratio of total scores assigned to each of the two criteria for AC chair independence;
ACEXP is ratio of number of AC members with accounting or financial qualifications to total AC members;
ACINDUS is ratio of number of AC members worked in the same industry for a substantial number of years (at
least 10 years) to total AC members; ACMEET is number of AC meetings held during the financial year;
ACSIZE is number of members serving on the AC during the financial year; LEVERAGE is ratio of total long-
term debt to total assets; RECRATIO is ratio of receivables to total assets; INVENRATIO is ratio of inventory
to total assets; CURATIO is ratio of current assets to current liabilities; OPCASH is ratio of operating cash flow
to total assets; FORSUB is ratio of number of foreign subsidiaries to total number of subsidiaries; SUB is square
root of total number of subsidiaries; GROWTH is three-year rate of sales growth; IAFBUD is total annual
internal audit budget measure * full-time equivalent staff; IAHOUR is full-time equivalent staff working in the
internal audit function; ASSET is total assets; AUDFEES is total of audit fees; ACCHAR is equal to the value
of “1” if the AC has a charter and “0” otherwise; BIG4 is equal to the value of “1” if a Big 4 auditor is used and
“0” when a smaller audit firm is used.

127
5.2.4 Validity and Reliability Tests on Variables in Model 3 and Model 4
To test the construct validity of the concept of independence of the internal audit function,
confirmatory factor analysis based on the principal components approach (PCA) is performed.
PCA is used to reduce the 6 items or sub-questions of internal audit function independence
into components that account for most of the variance. PCA seeks a linear combination of
variables such that the maximum variance is extracted from the variables. It then removes
this variance and seeks a second linear combination which explains the maximum proportion
of the remaining variance, and so on (Habib and Azim, 2008). An orthogonal rotation
(varimax) is used because this allows the 6 items to be more highly loaded onto each factor
resulting in more interpretable clusters of factors.
The Kaiser-Meyer-Olkin (KMO) measure verifies the sampling adequacy for the analysis.
For the sample 1 data, this test gives KMO= 0.677 (acceptable according to Field, 2009), and
all KMO values for individual items are more than 0.529, which is above the acceptable limit
of 0.5 (Field, 2009). Further, Bartlett’s test of sphericity x2(36)= 97.25 is significant,
indicating that the correlations between components are (overall) significantly different from
zero. Then an initial analysis is run to obtain eigenvalues for each component in the data.
As shown in Table 17, two components have eigenvalues over Kaiser’s criterion of 1 and in
combination explained 72.17% of the variance. Based on the scree plot in Figure 2, the point
of inflexion occurs at the second data point (component); therefore only one component is
extracted. However, the scree plot does not provide a particularly reliable criterion for faction
selection. Given the small sample size, Kaiser’s criterion on two components is the number of
components retained in the final analysis.
Table 17 shows the factor loadings after rotation. Loadings less than 0.70 are excluded; the
analysis yields a two-factor solution. Stevens (2002) recommends that for a small sample size
a loading of 0.70 can be considered significant. The items that cluster on the same
components suggest that component 1 represents internal audit function independence
(IAFIND) and component 2 represents AC support for internal audit function independence
(ACSUP_IAFIND). The factor scores from these two components will be used in the
subsequent regression models (Model 3 and Model 4) when examining the association
between the effectiveness of AC role and internal audit function independence.

128
Figure 2: Scree Plot
Point of Inflexion

129
Table 17: Summary of Confirmatory Factor Analysis Results for Internal Audit
Function Independence (n= 36)
Item
Rotated Factor Loadings
Internal audit
function
independence
(IAFIND)
AC support for
internal audit
function
independence
(ACSUP_IAFIND)
Your internal audit function puts a great
deal of effort beyond that normally expected
in order to ensure dedication to
independence.
0.706
0.203
Your internal audit function would resist
almost any type of pressure and threat in
order to maintain independence.
0.545 0.605
When your internal audit function is
required to work under both an ‘audit’ role
and ‘advisory service’ role by the
management this will never compromise
independence in the audit role.
0.892 0.131
The existing relationship between the AC
(or its chair) and the internal auditor
provides a strong backing for the
maintenance of your internal audit
function’s independence.
0.477 0.713
The independence of your internal audit
function is strongly upheld because of AC
members have strong collective
independence.
0.155 0.907
The AC would be prepared to take action to
maintain the independence of your internal
audit function if it is threatened by
management.
0.127 0.846
Eigenvalues
1.048 3.382
Percentage of total variance
15.795 56.371
Number of test measures
2 3
Note: Factor loadings over 0.70 appear in bold and italic

130
Since this study has a small sample size (n= 36), caution needs to be taken when a factor
analysis is performed. Further considerations are necessary. These are: 1) to apply Bartlett’s
test of sphericity (Cooley and Lohnes, 1971); 2) to have at least five times as many
observations in the study as the number of variables (Hair et al., 1995); and 3) to have
components with factor loadings above 0.70 (Stevens, 2002). In this study, the result of
Bartlett’s test of sphericity is significant. Moreover, there are more than five times the
number of observations to variables (there are two variables and 36 observations). All the
component loadings are more than 0.70. Consequently, these three tests suggest that the
results of factor analysis in this study produce two separate valid independent variables.
5.2.5 Descriptive Statistics for Variables in Model 3 and Model 4
The descriptive statistics for variables in Model 3 and Model 4 are presented in Tables 18 and
19. Table 18 shows the scoring of the items for internal audit function independence by the
36 respondents (CIAs). The results for these separate items suggest that the staff in the
internal audit function:
1) Put in a reasonable high effort in order to ensure dedication to independence (with a mean
[median] agreement of 3.69 [4.00]);
2) Resist almost any type of pressure and threat in order to maintain independence (with a
mean [median] agreement of 4.42 [4.00]);
3) Seek to be seen not to compromise their independence when required to work under both
an ‘audit’ role and ‘advisory service’ role (with a mean [median] agreement of 3.92 [4.00]);
4) Believe the relationship between the AC (or its chair) and the CIA provides a strong
backing for the maintenance of the internal audit function’s independence (with a mean
[median] agreement of 4.19 [4.00]);
5) Believe the independence of the internal audit function is seen to be strongly upheld when
AC members have strong collective independence (with a mean [median] agreement of 4.28
[4.00]); and
6) See the AC as being prepared to take action to maintain the independence of the internal
audit function if it is threatened by the management (with a mean [median] agreement of 4.31
[4.00]).

131
In summary, the results in Table 18 indicate that CIAs’ rate their company’s internal audit
function as having a satisfactory level of independence from the management and the AC as
providing strong support to the internal audit function independence.
Table 18: Internal Audit Function Independence (n= 36)
No. Questionnaire items Mean Median 25th
%
75th
%
Std.
Dev.
21 Likert-Scale (1= Strongly Disagree, 2= Disagree, 3= Neutral, 4= Agree, 5= Strongly
Agree) Please indicate your level of agreement with the following statements: (n= 36)
Your internal audit function puts a great
deal of effort beyond that normally
expected in order to ensure dedication to
independence.
3.69 4.00 3.00 4.00 0.89
Your internal audit function would resist
almost any type of pressure and threat in
order to maintain independence.
4.42 4.00 4.00 5.00 0.60
When your internal audit function is
required to work under both an ‘audit’
role and ‘advisory service’ role by the
management this will never compromise
independence in the audit role.
3.92 4.00 4.00 4.75 0.94
The existing relationship between the AC
(or its chair) and the internal auditor
provides a strong backing for the
maintenance of your internal audit
function’s independence.
4.19 4.00 4.00 5.00 0.98
The independence of your internal audit
function is strongly upheld because of AC
members have strong collective
independence.
4.28 4.00 4.00 5.00 0.78
The AC would be prepared to take action
to maintain the independence of your
internal audit function if it is threatened
by management.
4.31 4.00 4.00 5.00 0.79

132
Descriptive statistics for the dependent variables in Model 3 and Model 4 are presented in
Table 19. The results of the independent variables (ACCHAIR, ACEXP, ACINDUS,
ACMEET, ACSIZE and ACCHAR) and control variables (ASSET and BIG4) in Model 3
and Model 4 have been discussed in Section 5.2.3. IAFIND (internal audit function
independence) and ACSUP_IAFIND (AC support for internal audit function independence)
are the dependent variables of Model 3 and Model 4 which are generated from PCA above.
The average internal audit function independence (IAFIND) is 3.81, ranging from a minimum
of 2.00 to a maximum of 5.00 with a standard deviation of 0.77, while the average AC
support for the internal audit function independence is higher at 4.26, ranging from a
minimum of 2.67 and to a maximum of 5.00 with a standard deviation of 0.74.
Table 19: Descriptive Statistics for Dependent Variables in Model 3 and Model 4 (n=36)
Variable Name Mean Median Minimum Maximum Standard
Deviation
IAFIND 3.81 4.00 2.00 5.00 0.77
ACSUP_IAFIND 4.26 4.33 2.67 5.00 0.74
Note: IAFIND is internal audit function independence; ACSUP_IAFIND is AC support for internal audit
function independence.
5.2.6 Descriptive Statistics for Variables in Model 7
Descriptive statistics for the independent and dependent variables in Model 7 are presented in
Table 20. The ratio of total fees paid to the chair and AC members to total number of AC
members (ACFEESRATIO) ranges from a minimum of $2,000 to a maximum of $28,967,
with a mean of $11,552. Moreover, the ratio of total of external audit fees to total assets
(AUDFEESRATIO) ranges from a minimum of 0.003% to a maximum of 17.47%, with a
mean of 0.109%. The mean ratio of total internal audit budget to total assets
(IAFBUDRATIO) for the sample is 502.45 ranging from a minimum of 1.03 to a maximum
of 4,975. The variables described (ACFEESRATIO, AUDFEESRATIO and
IAFBUDRATIO) are the independent variables of this study. On the other hand, the
dependent variable, total shareholders return (TSR) shows a mean of 5.06 ranging from a
minimum of -0.76 to a maximum of 11.53 with a standard deviation of 3.43.
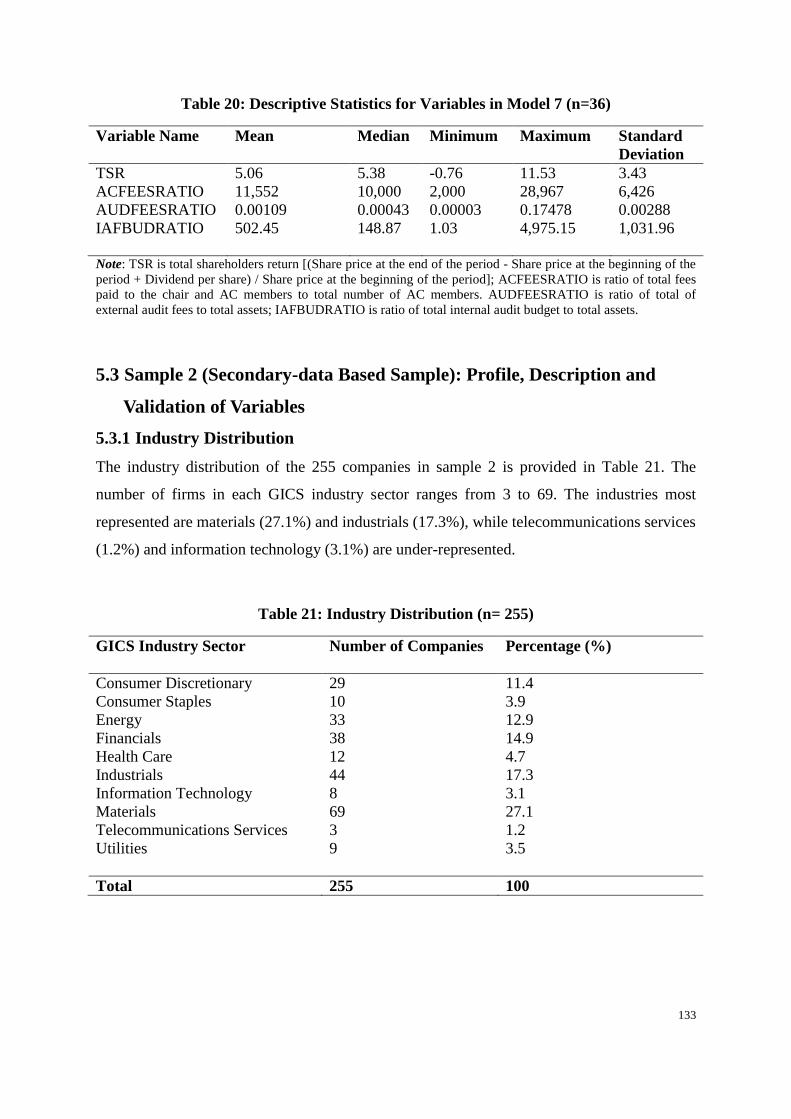
133
Table 20: Descriptive Statistics for Variables in Model 7 (n=36)
Variable Name Mean Median Minimum Maximum Standard
Deviation
TSR 5.06 5.38 -0.76 11.53 3.43
ACFEESRATIO 11,552 10,000 2,000 28,967 6,426
AUDFEESRATIO 0.00109 0.00043 0.00003 0.17478 0.00288
IAFBUDRATIO 502.45 148.87 1.03 4,975.15 1,031.96
Note: TSR is total shareholders return [(Share price at the end of the period - Share price at the beginning of the
period + Dividend per share) / Share price at the beginning of the period]; ACFEESRATIO is ratio of total fees
paid to the chair and AC members to total number of AC members. AUDFEESRATIO is ratio of total of
external audit fees to total assets; IAFBUDRATIO is ratio of total internal audit budget to total assets.
5.3 Sample 2 (Secondary-data Based Sample): Profile, Description and
Validation of Variables
5.3.1 Industry Distribution
The industry distribution of the 255 companies in sample 2 is provided in Table 21. The
number of firms in each GICS industry sector ranges from 3 to 69. The industries most
represented are materials (27.1%) and industrials (17.3%), while telecommunications services
(1.2%) and information technology (3.1%) are under-represented.
Table 21: Industry Distribution (n= 255)
GICS Industry Sector Number of Companies Percentage (%)
Consumer Discretionary 29 11.4
Consumer Staples 10 3.9
Energy 33 12.9
Financials 38 14.9
Health Care 12 4.7
Industrials 44 17.3
Information Technology 8 3.1
Materials 69 27.1
Telecommunications Services 3 1.2
Utilities
9 3.5
Total 255 100

134
5.3.2 Descriptive Statistics for Variables in Model 5 and Model 6
Descriptive statistics for variables in Model 5 and Model 6 are presented in Table 22. Panel A
reports statistics for continuous variables. In sample 2 (n= 255), company size in terms of
total assets (ASSET) ranges from a minimum of $14.42 million to a maximum of $700
billion, with a mean of $15.4 billion. The total audit fees paid to the external auditors
(AUDFEES) also ranges widely from a minimum of $25,450 to a maximum of $196.79
million, with a mean of $2.38 million, as does the total non-audit fees (NONAUDFEES),
ranging from $0 to $12.84 million, with a mean of $663,543.
The number of subsidiaries (SUB) attached to companies in this sample is also a high
variance, ranging from 0 to 974, with a mean of 51.06 subsidiaries. The percentage of foreign
subsidiaries to total subsidiaries (FORSUB) ranges from 0% to 100%, with a mean of 32%.
The minimum and maximum level for inventory (INVENRATIO) and receivable
(RECRATIO) ratios have means of 9% and 7% respectively (i.e., not showing high levels of
audit risk). Moreover, debt ratio (DEBTRATIO) and return on assets (ROA) display means
of 18% and 6% respectively and both have the same standard deviation of 20%.
Of particular interest to this study are the AC’s governance characteristics. In this study, the
size of AC (ACSIZE) ranges from 2 to 9 members, with a mean of 3.38 members. The
number of AC meetings held during the year (ACMEET) averages 4.09 with a minimum of 0
meetings and a maximum of 9 meetings. The mean percentage of AC members with
accounting or financial qualifications to total members (ACEXP) is 60%, ranging from 0% to
100%. Furthermore, the mean percentage of total members that has worked in the same
industry for at least 10 years (ACINDUS) is 54%. ACCHAIRIND, the test of AC chair
independence shows a percentage mean of 63%.
In terms of the composition of the board, Table 22 reveals that the average number of non-
executive directors on the board (BODNONEX) for the sample is 5.39, ranging from a
minimum of 2 to 10 non-executive board members. The number of directors on the board
(BODSIZE) is between 3 and 13 with an average board size of 6.92. The mean percentage of
non-executive directors on the board to total number of directors (BODIND- test of board of
directors’ independence) is 77%. Finally, Panel B in Table 22 reveals that sample 2 is made
up of 87% of companies that have an AC charter (ACCHAR), 85% that have a Big 4 external

135
auditor (BIG4), 23% that are in the mining industry (MINING), and 50% that reported a net
loss during the past 3 years (LOSS).
Table 22: Descriptive Statistics Variables in Model 5 and Model 6 (n=255)
PANEL A: Continuous Variables
Variable Name Mean Median Minimum Maximum Standard
Deviation
ACCHAIRIND 0.63 0.75 0.00 1.00 0.26
ACEXP 0.60 0.67 0.00 1.00 0.24
ACINDUS 0.54 0.50 0.00 1.00 0.25
ACMEET 4.09 4.00 0.00 9.00 0.25
ACSIZE 3.38 3.00 2.00 9.00 0.86
BODNONEX 5.39 5.00 2.00 10.00 1.79
BODSIZE 6.92 7.00 3.00 13.00 1.94
BODIND 0.77 0.80 0.40 1.00 0.11
BODMEET 11.80 11.00 3.00 37.00 4.74
ROA 0.06 0.07 -1.12 1.75 0.20
INVENRATIO 0.09 0.04 0.00 0.58 0.12
RECRATIO 0.07 0.03 0.00 0.43 0.09
DEBTRATIO 0.18 0.13 0.00 1.10 0.20
SUB 51.06 23.00 0.00 974.00 88.63
FORSUB 0.32 0.22 0.00 1.00 0.31
ASSET ($) 15.4B 919M 14.42M 700B 78.8B
AUDFEES ($) 2.38M 493,620 25,450 196.79M 12.66M
NONAUDFEES
($)
663,543 169,000 0.00 12.84M 1.57M
PANEL B: Dichotomous Variables
Variable Name Mean Median Number of Firms
Coded “0”
Number of Firms
Coded “1”
ACCHAR 0.87 1.00 34 221
BIG4 0.85 1.00 38 217
MINING 0.23 0.00 196 59
LOSS 0.50 1.00 127 128
Note: ACCHAIRIND is ratio of total scores assigned to each of the two criteria for AC chair independence;
ACEXP is ratio of number of AC members with accounting/financial qualifications to total AC members;
ACINDUS is ratio of number of AC members who has worked in the same industry for a substantial number of
years (at least 10 years) to total AC members; ACMEET is number of AC meetings held during the financial
year; ACSIZE is number of members serving on the AC during the financial year; BODNONEX is total number
of non-executive directors on the board; BODSIZE is total number of directors on the board; BODIND is ratio
of non-executive directors on the board to total number board of directors; BODMEET is number of board
meetings held during the year; ROA is ratio of earnings before interest and tax to total assets; INVENRATIO is
ratio of inventory to total assets; RECRATIO is ratio of receivables to total assets; DEBTRATIO is ratio of non-
current liabilities to total assets; SUB is number of subsidiaries; FORSUB is ratio of number of foreign
subsidiaries to total number of subsidiaries; ASSET is total assets; AUDFEES is total of audit fees;
NONAUDFEES is total of non-audit fees; ACCHAR is equal to the value of “1” if the AC has a charter and “0”
otherwise; BIG4 is equal to the value of “1” if a Big 4 auditor is used and “0” when a smaller audit firm is used;
MINING is equal to the value of “1” when the company is in the mining industry, “0” otherwise; LOSS is equal
to the value of “1” if the company has reported a loss in any of the three years prior to, “0” otherwise.

136
5.4 Hypotheses Testing
5.4.1 Normality of the Variables
Initial descriptive statistics for the variables to be modeled in this study suggest that all the
independent variables have non-normality in their data distributions. Non-normality is
detected for these variables due to significance values for both Kolmogorov-Smirnov test and
Shapiro-Walk test (p< 0.05). Also, skewness and kurtosis levels are found to be outside
normal tolerance limits. For all the independent variables in the models employed to test all
five sets of hypotheses, the Blom normal score transformation is applied because neither
logarithmic nor square root transformation is able to yield a normal distribution of these
measures (Kanel et al., 2008). Blom scores represent rank approximations of the exact order
of a normal distribution (Kraja et al., 2007). Using Blom’s proportional estimation formula in
SPSS, the assumption of normality is satisfied (data is normally distributed).
5.4.2 Test for Small Sample Size of Sample 1
The size of the sample used in a multiple regression has a direct effect on the statistical power
(R2) of the model and the generalisability of the results. Since the size of sample 1 of this
study is small (a total of 36 responses collected from the questionnaire), the findings can be
weakened when using multiple regressions. According to Hair et al. (1995), a small sample
that is characterized as having fewer than 20 observations, will be appropriate only for
bivariate analysis using correlations or simple regression with a single independent variable.
To gauge whether the sample size in this study has a direct and sizable impact on statistical
power, Hair et al.’s (1995) criterion is used. As shown in Table 23, this criterion compares
the significance level (α) and the number of independent variables in detecting a significant
R2. The values provided in this table are the minimum R
2 that the given sample size will
detect as statistically significant at significance level (α) of 0.05.
This study employs 6 independent variables and 11 control variables. With sample size of 36
(>20), these results satisfy the sample size statistical power test as Models 1, 2, 3 and 4 have
R2 more than 70%. According to Table 23, the minimum R
2 that a specified sample size will
detect as statistically significant at the 0.05 significance level is 42%.

137
Table 23: Sample Size Statistical Power Test
Significance Level (α)= 0.05
No. of Independent Variables
Sample Size 2 5 10 20
20 39 48 64 NA
50 19 23 29 42
100 10 12 15 21
250 4 5 6 8
500 3 4 5 9
100 1 1 2 2
Source: Hair et al. (1995)
Note: Minimum R2 that can be found statistically significant for
varying numbers of independent variables and sample sizes.
5.4.3 Choice of Stepwise Regression for Sample 1
Multivariate testing is performed to test the relative influence of each independent variable
when modeled together as determinants of a dependent variable. According to Singh and
Newby (2010), multivariate testing not only tests the significance of the relationship between
the independent and dependent variables but, more importantly it controls for the effects of a
number of other independent variables on this relationship.
In stepwise multiple regression, the independent variables are entered according to their
statistical contribution in explaining the variance in the dependent variable. Stepwise
regression is used in Models 1, 2, 3 and 4 (sample 1) of this study because it reduces the
number of independent variables in the model by excluding non-significant variables. This
study has 6 independent variables and 11 control variables. Therefore, stepwise regression is
considered the suitable choice of analysis by finding the set of predictors that are most
effective in predicting the dependent variable. Given that Models 1, 2, 3 and 4 have a small
sample size (36 respondents), it is essential to have a small number of independent variables
entering into the model when analysis occurs. Since variables will not be added to the
stepwise regression equation unless they make a statistically significant addition to the
analysis, all of the independent variables selected for inclusion will have a statistically
significant relationship to the dependent variable.

138
5.4.4 Model 1 and Model 2: Tests of Hypothesis One (a) and One (b)
5.4.4.1 Correlation Analysis
Table 24 reports the Pearson correlation coefficients for the variables used in Model 1 and
Model 2. The correlation matrix in Table 24 shows high significant correlations between
internal audit function labour hours (IAHOUR) and number of subsidiaries (SUB) (0.596),
between internal audit function budget (IAFBUD) and number of subsidiaries (SUB) (0.595)
and between internal audit function labour hours (IAHOUR) and internal audit function
budget (IAFBUD) (0.994). These correlations are intuitively expected since they relate the
size or diversity of internal audit tasks (i.e., number of subsidiaries) to the extent of internal
audit resourcing (i.e., IAFBUD and IAHOUR). Additionally, Table 24 shows that some
independent variables are significantly correlated with each other. However, these
correlations do not necessarily indicate that multicollinearity will be a serious problem for
stepwise regression analysis later.
The correlations of interest in Table 24 are those between the independent variables (i.e.,
AC’s governance characteristics) and the dependent variables (IAFBUD and IAHOUR).The
correlations between AC size (ACSIZE) with both internal audit function labour hours
(IAHOUR) and internal audit function budget (IAFBUD) are statistically significant (p<
0.05). The inference is that the monetary and human resourcing of the internal audit function
is dependent on the company having a larger AC.

139
Table 24: Correlation Analysis for Model 1 and Model 2
AC
CHAIR
IND
AC
EXP
AC
INDUS
AC
MEET
AC
SIZE
AC
CHAR
BIG 4 LNTA LEVER
AGE
REC
RATIO
INVEN
RATIO
CU
RATIO
OP
CASH
FOR
SUB
SUB LNAU
D
FEES
GROW
TH
IA
HOUR
IAF
BUD
ACCHAIR
IND
1.00
ACEXP
0.380*
1.00
ACINDUS
0.452**
0.196
1.00
ACMEET
0.044
0.139
0.019
1.00
ACSIZE
0.062
0.115
0.027
0.052
1.00
ACCHAR
0.105
0.150
0.272
0.156
0.140
1.00
BIG 4
0.106
0.182
0.047
0.246
0.164
0.041
1.00
LNTA
0.190
0.210
0.239
0.196
0.474**
0.130
0.141
1.00
LEVERAGE
0.168
0.254
0.160
0.044
0.003
0.342*
0.308*
0.228
1.00
RECRATIO
0.142
0.008
0.178
0.105
0.411**
0.304*
0.096
0.478**
0.415**
1.00
INVENRATIO
0.403**
0.266
0.478**
0.208
0.328*
0.200
0.481
0.202
0.358*
0.309*
1.00
CURATIO
0.265
0.026
0.273
0.188
0.208
0.328*
0.200
0.481**
0.202
0.358*
0.309*
1.00
OPCASH
0.548**
0.231
0.284*
0.309*
0.095
0.229
0.110
0.336*
0.279*
0.209
0.186
0.255
1.00
FORSUB
0.245
0.040
0.088
0.021
0.097
0.059
0.227
0.054
0.151
0.349*
0.127
0.155
0.098
1.00
SUB
0.031
0.063
0.012
0.152
0.189
0.031
0.276
0.394**
0.062
0.275
0.180
0.242
0.154
0.588**
1.00
LNAUDFEES
0.166
0.332*
0.161
0.396**
0.305*
0.070
0.371*
0.633**
0.144
0.078
0.265
0.420**
0.149
0.316*
0.632**
1.00
GROWTH
0.025
0.155
0.065
0.112
0.014
0.047
0.298*
0.236
0.062
0.013
0.058
0.116
0.318*
0.176
0.312*
0.174
1.00
IAHOUR
0.032
0.257
0.112
0.180
0.440**
0.082
0.268
0.370*
0.077
0.101
0.029
0.273
0.051
0.255
0.596**
0.295*
0.258
1.00
IAFBUD
0.004
0.229
0.101
0.174
0.451**
0.075
0.266
0.365*
0.071
0.089
0.046
0.252
0.052
0.262
0.595**
0.293*
0.262
0.994**
1.00
Note: ** Correlation is significant at the 0.01 level (1-tailed); * Correlation is significant at the 0.05 level (1-tailed)
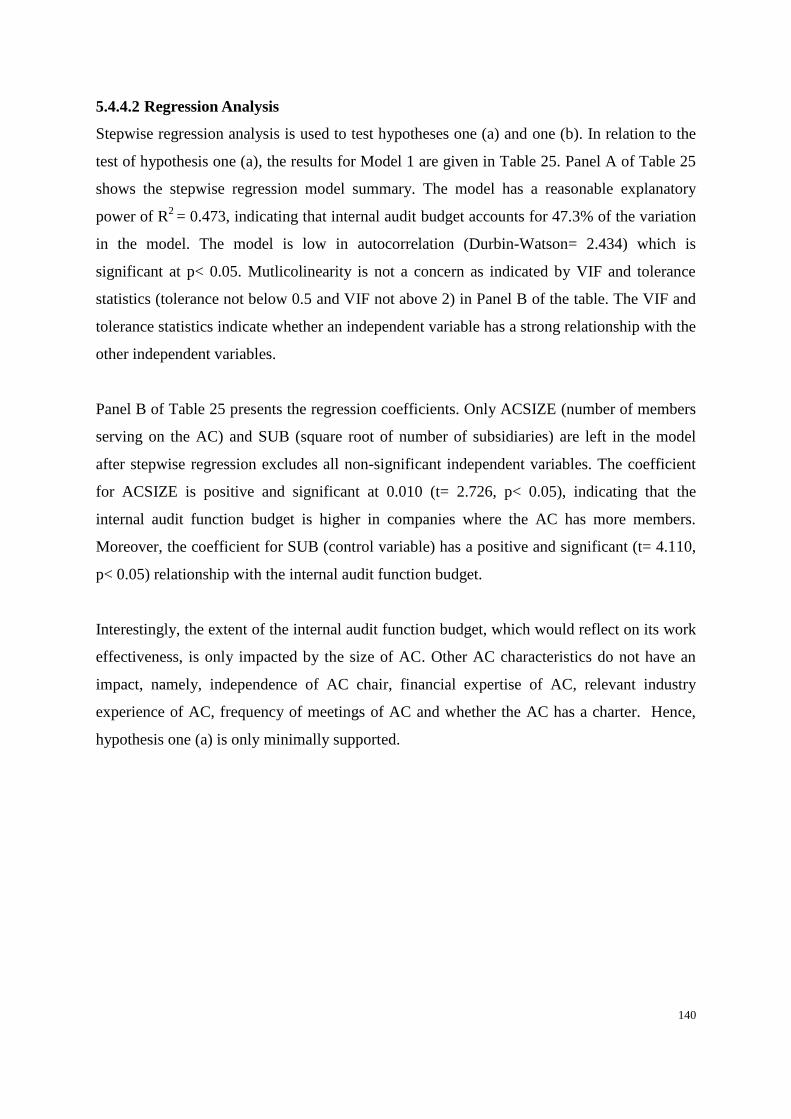
140
5.4.4.2 Regression Analysis
Stepwise regression analysis is used to test hypotheses one (a) and one (b). In relation to the
test of hypothesis one (a), the results for Model 1 are given in Table 25. Panel A of Table 25
shows the stepwise regression model summary. The model has a reasonable explanatory
power of R2
= 0.473, indicating that internal audit budget accounts for 47.3% of the variation
in the model. The model is low in autocorrelation (Durbin-Watson= 2.434) which is
significant at p< 0.05. Mutlicolinearity is not a concern as indicated by VIF and tolerance
statistics (tolerance not below 0.5 and VIF not above 2) in Panel B of the table. The VIF and
tolerance statistics indicate whether an independent variable has a strong relationship with the
other independent variables.
Panel B of Table 25 presents the regression coefficients. Only ACSIZE (number of members
serving on the AC) and SUB (square root of number of subsidiaries) are left in the model
after stepwise regression excludes all non-significant independent variables. The coefficient
for ACSIZE is positive and significant at 0.010 (t= 2.726, p< 0.05), indicating that the
internal audit function budget is higher in companies where the AC has more members.
Moreover, the coefficient for SUB (control variable) has a positive and significant (t= 4.110,
p< 0.05) relationship with the internal audit function budget.
Interestingly, the extent of the internal audit function budget, which would reflect on its work
effectiveness, is only impacted by the size of AC. Other AC characteristics do not have an
impact, namely, independence of AC chair, financial expertise of AC, relevant industry
experience of AC, frequency of meetings of AC and whether the AC has a charter. Hence,
hypothesis one (a) is only minimally supported.

141
Table 25: Stepwise Regression Results for Model 1
PANEL A: Model Summary
R R Square Adjusted
R Square
Std. Error
of the
Estimate
Durbin-
Watson
F-ratio Sig.
0.688 0.473 0.441 0.709 2.434 7.434 0.000
PANEL B: Regression Coefficients
Dependent
Variable
IAFBUD
Unstandardized
coefficients
Standardized
Coefficients
Collinearity
Statistics
B Std.
Error
Beta t-value Sig. Tolerance VIF
Intercept 0.002 0.118 0.018 0.986
Independent
Variables
ACSIZE 0.411 0.151 0.351 2.726 0.010 0.964 1.037
SUB
0.514 0.125 0.529 4.110 0.000 0.964 1.037
Note: ACCHAIRIND, ACEXP, ACINDUS, ACMEET, ACCHAR, BIG4, LNTA, LEVERAGE, RECRATIO,
INVENRATIO, CURATIO, OPCASH, FORSUB, LNAUDFEES and GROWTH are not a significant predictor
in this model.
Turning to the test of hypothesis one (b), regression results for Model 2 are shown in Table
26. Panel A indicates a high explanatory power (R2= 0.531). The model is low in
autocorrelation (Durbin-Watson= 2.447, p< 0.05). Mutlicolinearity is not a concern as
indicated by VIF and Tolerance statistics in Panel B of table 26 (tolerance not below 0.5 and
VIF not above 2).
The results in Panel B of Table 26 shows that ACEXP (number of AC members with
accounting/financial qualifications to total AC members), ACSIZE (number of members
serving on the AC) and SUB (square root of number of subsidiaries) are left in the model
after stepwise regression excludes all non-significant variables. The coefficients for ACEXP
and ACSIZE are positive and significant at 0.044 and 0.020 respectively (t= 2.101 and 2.456,
p< 0.05), indicating that labour hours undertaken by the internal audit function are higher in
companies where the AC has more accounting/financial experts and a larger number of
members. The inference is a larger and more expert AC will generate a more effective
internal audit function in terms of its business in hours worked. In addition, the coefficient for
SUB (control variable in the model) is positively and significantly (t= 4.473, p< 0.05) related

142
to the internal audit function labour hours. Number of subsidiaries could be a proxy for the
complexity of the internal audit function’s tasks.
In summary, it is found that AC expertise and size significantly impact on the effectiveness of
an AC in its role of overseeing the quality of the internal audit function. Other AC
characteristics of chair independence, relevant industry experience, frequency of meetings
and existence of a charter, do not impact on the quality of the internal audit function, as was
the finding for Model 1. Hence, hypothesis one (b) is also partially supported.
Table 26: Stepwise Regression Results for Model 2
PANEL A: Model Summary
R R Square Adjusted
R Square
Std. Error
of the
Estimate
Durbin-
Watson
F-ratio Sig.
0.728 0.531 0.487 0.675 2.447 4.415 0.044
PANEL B: Regression Coefficients
Dependent
Variable
IAHOUR
Unstandardized
coefficients
Standardized
Coefficients
Collinearity
Statistics
B Std.
Error
Beta t-value Sig. Tolerance VIF
Intercept 0.001 0.113 0.013 0.990
Independent
Variables
ACEXP 0.271 0.129 0.257 2.101 0.044 0.979 1.021
ACSIZE 0.355 0.145 0.306 2.456 0.020 0.948 1.055
SUB 0.535 0.210 0.554 4.473 0.000 0.957 1.045
Note: ACCHAIRIND, ACINDUS, ACMEET, ACCHAR, BIG4, LNTA, LEVERAGE, RECRATIO,
INVENRATIO, CURATIO, OPCASH, FORSUB, LNAUDFEES and GROWTH are not a significant predictor
in this model.
5.4.4.3 Discussion of Findings on Model 1 and Model 2
Both dependent variables, internal audit function budget and internal audit function labour
hours used in Model 1 and Model 2 have captured whether an AC is effective in ensuring the
firm’s internal audit function is well resourced with funds and staff to perform its functions.
The assumption is that the degree of resourcing of the internal audit function is largely in the
hands of the AC in its capacity as the firm’s oversight body for the quality of the internal
audit function. The findings in Table 25 and Table 26 add limited support to Scarborough et

143
al. (1998), Raghunandan et al. (1998), Raghunandan et al. (2001), Goodwin (2003) and
Abbott et al. (2010) who have concluded that an AC with better governance characteristics
will improve the status of the internal audit function in a company.
In relation to Model 1, Table 25 shows that AC size, is the only independent variable that is
positively and highly significantly related to the internal audit function budget which leads to
partial acceptance of hypothesis one (a). This result suggests that a larger sized AC is likely
to have more influence over the board of directors in advocating an adequate budget for the
internal audit function. A larger AC may also have more time to work with the CIA and CFO
in preparing a strong case for the internal audit function budget to be presented to the board.
Moreover, a larger AC can give greater attention to monitoring the internal audit function’s
funding needs and budget constraints. Such a commitment to reviewing the internal audit’s
on-going budgetary needs is likely to improve the resources allocated to the internal audit
function. Carcello et al. (2005) found that the internal audit budget is higher when an AC
reviews the internal audit budget. Raghunandan et al. (2001) also found that ACs that review
the internal audit budget are associated with a larger budget for internal audit monitoring.
Both studies have similar findings to this study. A further possibility is that the CIA can use
the AC as a lever if the AC is larger and more powerful within the company when negotiating
for extra funding within management, particularly during meetings with the management
Abbott et al., 2010).
On the other hand, in relation to Model 2 concerning internal audit staff resourcing, the
findings in Table 26 show that AC expertise and AC size are positively and highly
significantly related to the internal audit function labour hours (IAHOUR). The inference
from this result is that an AC with larger size and comprising of more members with
accounting or financial qualifications will be able to bring more pressure on ensuring that
labour hours allocated to the internal audit function are not compromised. In addition, AC
members equipped with financial expertise are more likely to have a better understanding of
the technicalities and complexities of internal audit tasks related to the company in a
particular industry. Results of this study are supported by Goodwin’s (2003) findings that
found AC members with accounting expertise are more involved in reviewing the work of the
internal audit function and ensuring that resources are allocated to the internal audit function.

144
During the review of the internal audit function budget and plan, larger size and financial
experts AC members have the power to influence the board and management over, not only
the amount of labour hours to be allocated to the internal control activities, but also the nature
and scope of internal audit programs (Abbott et al., 2010). Furthermore, an AC with financial
expertise is more likely to demand the internal audit function to act and to improve the
existing internal control system or increase the amount of work to be done in higher risk areas
(Carcello et al., 2005).
One of the responsibilities of the AC in a company is overseeing the internal audit function
by ensuring that management has designed and implemented an effective internal control
system (Raghunandan et al., 1998). To fulfil this role, an AC must have good corporate
governance characteristics to ensure adequate budget and labour hours are allocated to the
internal audit function. Raghunandan et al. (1998) found that good working relationships with
the CIA can enhance the effectiveness of the AC. They argued that an AC which reviews the
internal auditing program is more likely to be knowledgeable about accounting issues.
Based on the discussion above, it can be argued that AC size and AC expertise have an
impact on the effectiveness of an AC’s role in overseeing the quality of the internal audit
function. The evidence indicates that AC size is more associated with the internal audit
budget while both AC expertise and size are associated with the internal audit labour hours.

145
5.4.5 Model 3 and Model 4: Tests of Hypothesis Two (a) and Two (b)
5.4.5.1 Correlation Analysis
Table 27 reports the Pearson correlation coefficients for the variables used in Model 3 and
Model 4. The correlation matrix in Table 27 reveals significant correlations of interest to
Model 3 and Model 4. These are between the independent variables (AC’s governance
characteristics) and the dependent variables (IAFIND and AC_IAFIND).
The correlation between internal audit function independence (IAFIND) and AC size
(ACSIZE) (0.258) and between AC support for internal audit function independence
(AC_IAFIND) and AC size (ACSIZE) (0.207) are statistically significant at the p< 0.05 level.
Although AC size does not display a high correlation with IAFIND and AC_IAFIND, it does
imply that AC size has a significant influence on the dependent variables. While some of the
independent variables are significantly correlated with each other, their correlations do not
indicate that multicollinearity is a serious problem.

146
Table 27: Correlation Analysis for Model 3 and Model 4
AC
CHAIR
IND
AC
EXP
AC
INDUS
AC
MEET
AC
SIZE
AC
CHAR
BIG 4 LNTA IAFIND AC_
IAFIAND
ACCHA
IR
IND
1.00
ACEXP
0.380*
1.00
AC
INDUS
0.452**
0.196
1.00
AC
MEET
0.044
0.139
0.019
1.00
AC
SIZE
0.062
0.115
0.027
0.052
1.00
AC
CHAR
0.105
0.150
0.272
0.156
0.140
1.00
BIG 4
0.106
0.182
0.047
0.246
0.164
0.041
1.00
LNTA
0.190
0.210
0.239
0.196
0.474**
0.130
0.141
1.00
IAFIND
0.185
0.203
0.217
0.070
0.258*
0.042
0.186
0.104
1.00
AC_
IAFIND
0.016
0.001
0.030
0.006
0.207*
0.188
0.326*
0.156
0.462**
1.00
Note: ** Correlation is significant at the 0.01 level (1-tailed); * Correlation is significant at the 0.05 level (1-tailed)
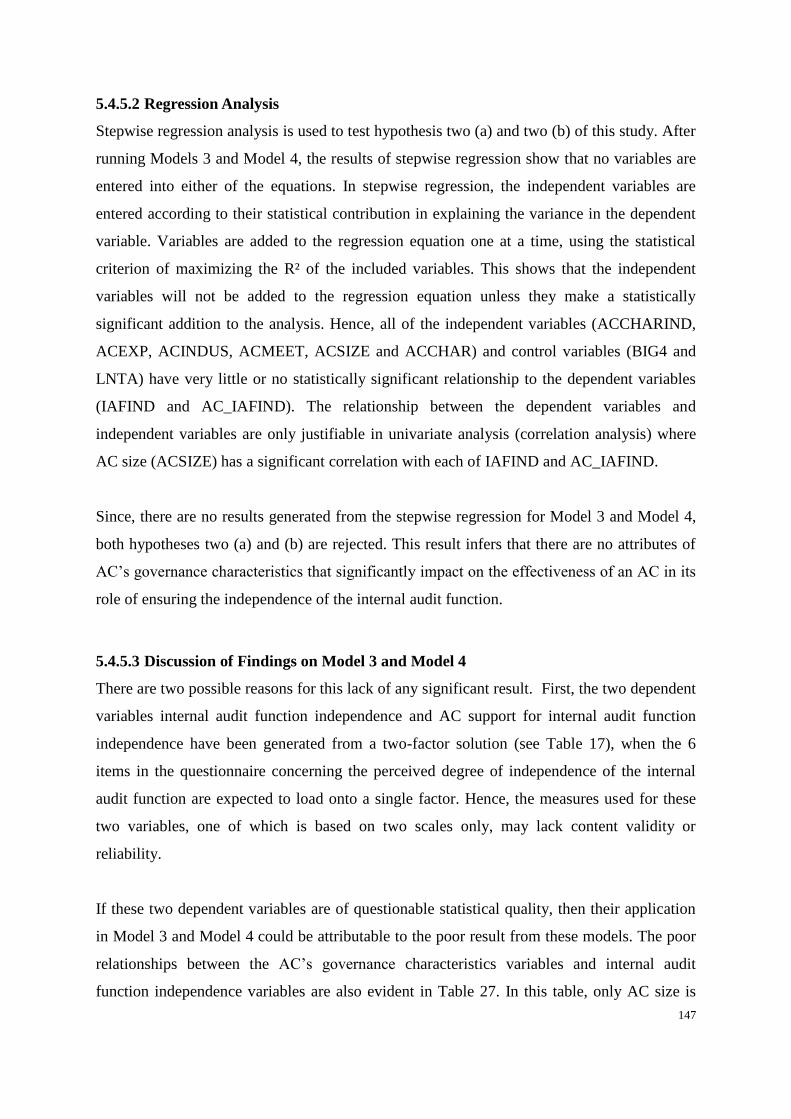
147
5.4.5.2 Regression Analysis
Stepwise regression analysis is used to test hypothesis two (a) and two (b) of this study. After
running Models 3 and Model 4, the results of stepwise regression show that no variables are
entered into either of the equations. In stepwise regression, the independent variables are
entered according to their statistical contribution in explaining the variance in the dependent
variable. Variables are added to the regression equation one at a time, using the statistical
criterion of maximizing the R² of the included variables. This shows that the independent
variables will not be added to the regression equation unless they make a statistically
significant addition to the analysis. Hence, all of the independent variables (ACCHARIND,
ACEXP, ACINDUS, ACMEET, ACSIZE and ACCHAR) and control variables (BIG4 and
LNTA) have very little or no statistically significant relationship to the dependent variables
(IAFIND and AC_IAFIND). The relationship between the dependent variables and
independent variables are only justifiable in univariate analysis (correlation analysis) where
AC size (ACSIZE) has a significant correlation with each of IAFIND and AC_IAFIND.
Since, there are no results generated from the stepwise regression for Model 3 and Model 4,
both hypotheses two (a) and (b) are rejected. This result infers that there are no attributes of
AC’s governance characteristics that significantly impact on the effectiveness of an AC in its
role of ensuring the independence of the internal audit function.
5.4.5.3 Discussion of Findings on Model 3 and Model 4
There are two possible reasons for this lack of any significant result. First, the two dependent
variables internal audit function independence and AC support for internal audit function
independence have been generated from a two-factor solution (see Table 17), when the 6
items in the questionnaire concerning the perceived degree of independence of the internal
audit function are expected to load onto a single factor. Hence, the measures used for these
two variables, one of which is based on two scales only, may lack content validity or
reliability.
If these two dependent variables are of questionable statistical quality, then their application
in Model 3 and Model 4 could be attributable to the poor result from these models. The poor
relationships between the AC’s governance characteristics variables and internal audit
function independence variables are also evident in Table 27. In this table, only AC size is

148
significantly correlated to the dependent variables. An alternative measure of the concept of
internal audit function independence might produce a more significant result for Model 3 and
Model 4. For example, taking a cognitive perspective of internal auditor independence,
Ahmad and Taylor (2009) developed measures for the concepts of commitment to
independence, role conflict and role ambiguity in the context of the internal auditor’s work
environment.
Second, the specification of Models 3 and Model 4 may be the reason for the lack of a
significant result. In other words, the AC’s governance characteristics could, in fact, have
quite minimal explanatory power as determinants of the extent of independence of the
internal audit function. Other factors, not included in the specification of Model 3 and Model
4, such as the demands and values of senior management in the company, or the pressures
from professional bodies like the IIA Australia, could be the more dominant influences on
shaping the independent of internal audit staff.
5.4.6 Model 4 and Model 5: Tests of Hypothesis Three and Hypothesis Four
5.4.6.1 Correlation Analysis
Table 28 reports the Pearson correlation coefficients for the variables used in the Model 5 and
Model 6. This table shows several significant correlations. The variables significantly
correlated to the natural log of audit fees (LNAUDFEES) worthy of noting are: AC meetings
(ACMEET) (0.560); natural log of non-audit fees (LNNONAUDFEES) (0.650); the number
of subsidiaries (SUB) (0.677); and the natural log of total assets (LNTA) (0.813).

149
Table 28: Correlation Analysis for Model 5 and Model 6
AC
CHAIR
IND
AC
EXP
AC
INDUS
AC
MEET
AC
SIZE
AC
CHAR
BOD
IND
BOD
MEET
BIG4 MINING LOSS ROA INVEN
RATIO
REC
RATIO
DEBT
RATIO
FOR
SUB
SUB LN
AUD
FEES
LN
NON
AUD
FEES
LN
TA
ACCHAIR
IND
1.00
ACEXP
0.241**
1.00
ACINDUS
0.149**
0.105*
1.00
ACMEET
0.010
0.198**
0.090
1.00
ACSIZE
0.009
0.091
0.235**
0.290**
1.00
ACCHAR
0.079
0.098
0.113*
0.033
0.109*
1.00
BODIND
0.122*
0.110*
0.192**
0.269**
0.232**
0.117*
1.00
BODMEET
0.053
0.070
0.028
0.134*
0.022
0.195**
0.036
1.00
BIG4
0.023
0.131*
0.092
0.268**
0.221**
0.160**
0.285**
0.153**
1.00
MINING
-0.069
-0.194**
-0.168**
-0.189**
-0.132*
-0.004
-0.139*
-0.060
-0.188**
1.00
LOSS
0.067
0.155**
0.208**
0.181**
0.173**
0.094
0.129*
0.059
0.342**
0.342**
1.00
ROA
0.192**
0.111*
0.248**
0.124*
0.089
0.070
0.013
0.039
0.230**
-0.230**
-0.479**
1.00
INVEN
RATIO
0.235
0.009
0.303
0.026
0.203
0.064
0.065
0.037
0.150
-0.105
-0.233
0.326
1.00
REC
RATIO
0.235**
0.064
0.231**
0.148**
0.088
0.062
0.029
0.022
0.150**
-0.325**
-0.397**
0.461**
0.431**
1.00
DEBT
RATIO
0.051
0.041
0.080
0.209**
0.062
0.148**
0.049
0.048
0.114*
-0.149**
-0.080
0.142*
0.072
-0.216**
1.00
FORSUB
0.207**
0.072
0.011
0.107*
0.021
0.042
0.015
0.027
0.019
-0.002
-0.068
0.063
0.061
0.156**
0.045
1.00
SUB
0.005
0.131*
0.222**
0.433**
0.309**
0.100
0.285**
0.063
0.305**
-0.381**
-0.272**
0.178**
0.233**
0.372**
0.134*
0.262**
1.00
LNAUDFEES
0.046
0.189**
0.199**
0.560**
0.443**
0.096
0.365**
0.023
0.447**
-0.321**
0.328**
-0.229**
0.218**
0.288**
0.252**
0.253**
0.677**
1.00
LNNON
AUDFEES
-0.060
-0.175**
-0.102
-0.403**
-0.380**
-0.102
-0.319**
-0.036
0.408**
-0.195**
0.198**
-0.112*
0.152
0.190**
0.166**
0.118*
0.483**
0.650**
1.00
LNTA
0.104
0.204**
0.148*
0.538**
0.469
0.149*
0.430**
0.007
0.402**
-0.303**
-0.269**
0.144*
0.153*
0.122
0.218**
0.058
0.674**
0.813**
0.651**
1.00
Note: ** Correlation is significant at the 0.01 level (1-tailed); * Correlation is significant at the 0.05 level (1-tailed)

150
5.4.6.2 Comparisons of Means
An independent samples t-test is performed for the AC continuous variables to determine
whether ACs that follow the ASX CGC’s principles and recommendations are significantly
different in terms of audit and non-audit fees from those that do not follow the guidelines.
The ASX CGC requires an AC to be chaired by an independent chair (who is not chair of the
board), has at least one member who has relevant qualifications and experience, has some
members who have an understanding of the industry in which the entity operates, has at least
3 members on the committee and should meet at least four times annually.
Review of Table 29 shows many of these significant differences. On average, ACs that
follow the ASX CGC recommendations have higher mean audit fees and lower mean non-
audit fees compared to firms that do not follow the guidelines. ACs that adhere to the ASX
CGC recommendations are more likely to demand a greater level of audit assurance by
accepting higher audit fees and reducing the level of non-audit service fees for consulting
services provided by the external auditor firm to the management.
The mean differences are significant (p< 0.05) in Table 29 for all the groups except for the
independence of AC chair. The mean of the independence of AC chair is not significantly
different between ACs that follow the ASX CGC recommendations and the ACs that do not
follow the guidelines. It can be argued that an AC chair is often a non-executive director of
the company but could still have a substantial relationship with the company as a customer, a
supplier or a professional advisor or there is some other matter that compromises that
person’s independence. This appears to be reflected in the finding of a non-significant
difference between the means of the independence of AC chair
In summary, the results in Table 29 show that:
i) Companies with higher audit fees (a proxy for higher quality of external audit) are
characterized as having an AC with significantly greater financial expertise, greater
industry experience, meet more frequently and are larger in size.
ii) Companies with higher non-audit fees (a proxy for weaker auditor independence) are
characterized as having an AC with significantly lower financial expertise, lower industry
experience, and meet less frequently and are smaller in size.

151
iii) Companies that have an apparently higher quality of external audit and external auditors’
independence are more in conformity with ASX CGC guidelines.
This conclusion implies that ACs with higher quality of governance structures will be more
effective in fulfilling their role of maintaining the quality of the external audit function and
ensuring the independence of external auditors.

152
Table 29: Comparison of Means
Variable
Name
Group Mean
Score
Difference
between
means
t-value Sig.
Audit Fees
LN
AUDFEES
ACCHAIRIND ≥ 0.50% of the chairs are
independent
13.340 0.129 -0.517 0.303
ACCHAIRIND < 0.50% of the chairs are
independent
13.211
LN
AUDFEES
ACEXP ≥ 2 members have financial
expertise
13.547 0.992 5.846 0.000
ACEXP < 2 members have financial
expertise
12.539
LN
AUDFEES
ACINDUS ≥ 2 members have 10 years
industry experience
13.270 0.070 3.760 0.035
ACINDUS < 2 members have 10 years
industry experience
13.200
LN
AUDFEES
ACMEET ≥ 4 meetings held a year 13.816 1.490 9.143 0.000
ACMEET < 4 meetings held a year
12.326
LN
AUDFEES
ACSIZE ≥ 3 members in the committee 13.330 1.791 7.737 0.000
ACSIZE < 3 members in the committee
11.539
Non-Audit Fees
LNNON
AUDFEES
ACCHAIRIND ≥ 0.50% of the chairs are
independent
10.648 0.446 -0.598 0.275
ACCHAIRIND < 0.50% of the chairs are
independent
11.094
LNNON
AUDFEES
ACEXP ≥ 2 members have financial
expertise
9.204 2.196 3.450 0.001
ACEXP < 2 members have financial
expertise
11.400
LNNON
AUDFEES
ACINDUS ≥ 2 members have 10 years
industry experience
10.695 0.054 9.700 0.046
ACINDUS < 2 members have 10 years
industry experience
10.749
LNNON
AUDFEES
ACMEET ≥ 4 meetings held a year 8.893 3.005 5.275 0.000
ACMEET < 4 meetings held a year
11.898
LNNON
AUDFEES
ACSIZE ≥ 3 members in the committee 8.886 1.940 1.619 0.045
ACSIZE < 3 members in the committee 10.826
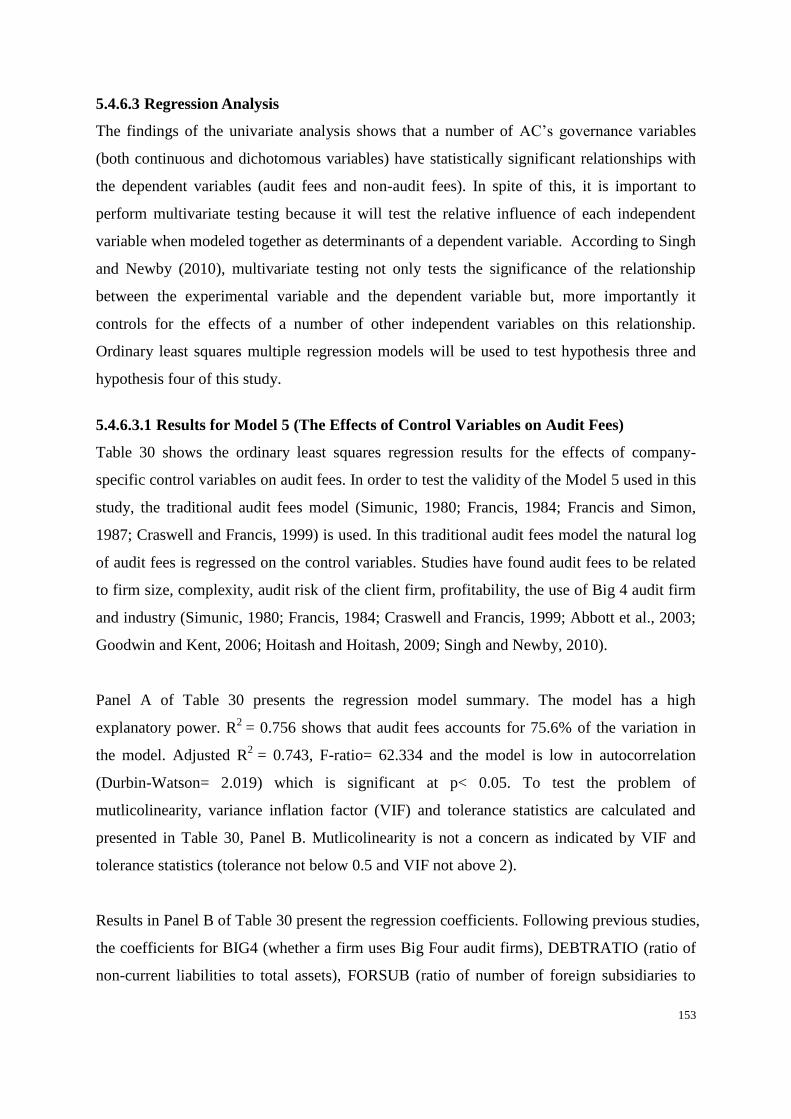
153
5.4.6.3 Regression Analysis
The findings of the univariate analysis shows that a number of AC’s governance variables
(both continuous and dichotomous variables) have statistically significant relationships with
the dependent variables (audit fees and non-audit fees). In spite of this, it is important to
perform multivariate testing because it will test the relative influence of each independent
variable when modeled together as determinants of a dependent variable. According to Singh
and Newby (2010), multivariate testing not only tests the significance of the relationship
between the experimental variable and the dependent variable but, more importantly it
controls for the effects of a number of other independent variables on this relationship.
Ordinary least squares multiple regression models will be used to test hypothesis three and
hypothesis four of this study.
5.4.6.3.1 Results for Model 5 (The Effects of Control Variables on Audit Fees)
Table 30 shows the ordinary least squares regression results for the effects of company-
specific control variables on audit fees. In order to test the validity of the Model 5 used in this
study, the traditional audit fees model (Simunic, 1980; Francis, 1984; Francis and Simon,
1987; Craswell and Francis, 1999) is used. In this traditional audit fees model the natural log
of audit fees is regressed on the control variables. Studies have found audit fees to be related
to firm size, complexity, audit risk of the client firm, profitability, the use of Big 4 audit firm
and industry (Simunic, 1980; Francis, 1984; Craswell and Francis, 1999; Abbott et al., 2003;
Goodwin and Kent, 2006; Hoitash and Hoitash, 2009; Singh and Newby, 2010).
Panel A of Table 30 presents the regression model summary. The model has a high
explanatory power. R2
= 0.756 shows that audit fees accounts for 75.6% of the variation in
the model. Adjusted R2
= 0.743, F-ratio= 62.334 and the model is low in autocorrelation
(Durbin-Watson= 2.019) which is significant at p< 0.05. To test the problem of
mutlicolinearity, variance inflation factor (VIF) and tolerance statistics are calculated and
presented in Table 30, Panel B. Mutlicolinearity is not a concern as indicated by VIF and
tolerance statistics (tolerance not below 0.5 and VIF not above 2).
Results in Panel B of Table 30 present the regression coefficients. Following previous studies,
the coefficients for BIG4 (whether a firm uses Big Four audit firms), DEBTRATIO (ratio of
non-current liabilities to total assets), FORSUB (ratio of number of foreign subsidiaries to

154
total number of subsidiaries), SUB (square root of number of subsidiaries) and LNTA
(natural log of total assets) are all positively related to audit fees and are significant (p< 0.05).
By comparison, the remaining five coefficients estimate, MINING (whether a firm is in the
mining industry), LOSS (whether a firm has reported a loss), ROA (ratio of earnings before
interest and tax to total assets), INVENRATIO (ratio of inventory to total assets) and
RECRATIO (ratio of receivables to total assets) are in the predicted direction but not
significant in explaining audit fees. These variables found not to be significant in this study
have mixed results in the previous studies, with some finding significance and others are not
(Abbott et al., 2003; Goodwin and Kent, 2006; Hoitash and Hoitash, 2009; Singh and Newby,
2010).
In terms of board characteristics, the coefficient estimates for BODIND (ratio of non-
executive directors on the board to total number board of directors) and BODMEET (number
of board meetings held during the year) are not significantly related to audit fees. This result
is consistent with a newer study (Hoitash and Hoitash, 2009) that found that characteristics of
the board of the directors are not associated with audit fees. However, the results of this study
and Hoitash and Hoitash (2009) are in contrast to the findings of Carello et al. (2002), Abbott
et al. (2003) and Goodwin and Kent (2006). It can be argued, there are a number of possible
reasons for the differences between the results.
Firstly, since ASX CGC Principles of Good Corporate Governance and Best Practice
Recommendations are introduced in 2003, it became the minimum standard for firm
corporate governance performance in Australia. Under the recommendations, companies
have a choice to follow and implement any new corporate governance strategies or
mechanisms. However, companies wanting to distinguish themselves from other companies
may choose to signal their corporate governance performance by using other corporate
governance mechanisms which are not compulsory under the recommendations of the ASX
CGC (Singh and Newby, 2009). Thus, this could the reason that BODIND and BODMEET
variables have changed from being significant to non-significant variables in explaining the
audit fees. Furthermore, it can also be posited that the lack of association between the board
of directors’ independence and meetings is consistent with the increased oversight and
responsibilities of the AC with respect to audit fees. This result indicates that ASX CGC

155
achieved its objective with regard to the monitoring oversight of the external auditors by re-
positioning this oversight from the board of directors to the AC.
Table 30: Ordinary Least Squares Regression Results Model 5 (The Effects of Control
Variables on Audit Fees)
PANEL A: Model Summary
R R Square Adjusted
R Square
Std. Error
of the
Estimate
Durbin-
Watson
F-ratio Sig.
0.869 0.756 0.743 0.504 2.019 62.334 0.000
PANEL B: Regression Coefficients
Dependent
Variable
LNAUDFEES
Unstandardized
coefficients
Standardized
Coefficients
Collinearity
Statistics
B Std.
Error
Beta t-value Sig. Tolerance VIF
Intercept 0.005 0.032 0.143 0.886
Independent
Variables
BODIND 0.009 0.036 0.009 0.238 0.812 0.785 1.274
BODMEET 0.040 0.033 0.40 1.208 0.228 0.937 1.067
BIG4 0.224 0.062 0.131 3.630 0.000 0.779 1.284
MINING -0.016 0.058 -0.010 -0.276 0.783 0.751 1.332
LOSS 0.075 0.057 0.051 1.302 0.194 0.664 1.506
ROA -0.022 0.039 -0.022 -0.565 0.573 0.654 1.528
INVENRATIO 0.021 0.040 0.020 0.530 0.597 0.733 1.363
RECRATIO 0.075 0.046 0.071 1.635 0.103 0.529 1.889
DEBTRATIO 0.071 0.036 0.069 1.988 0.048 0.844 1.185
FORSUB 0.189 0.036 0.175 5.177 0.000 0.884 1.131
SUB 0.097 0.051 0.096 1.904 0.058 0.501 1.499
LNTA 0.636 0.050 0.636 12.616 0.000 0.598 1.512
Note: LNAUDFEES is total audit fees are collected from the company annual reports and are then transformed
into natural log; BODIND is ratio of non-executive directors on the board to total number board of directors;
BODMEET is number of board meetings held during the year; BIG4 is equal to the value of “1” if a Big 4
auditor is used and “0” when a smaller audit firm is used; MINING is equal to the value of “1” when the
company is in the mining industry, “0” otherwise; LOSS is equal to the value of “1” if the company has reported
a loss in any of the three years prior to, “0” otherwise; ROA is ratio of earnings before interest and tax to total
assets; INVENRATIO is ratio of inventory to total assets; RECRATIO is ratio of receivables to total assets;
DEBTRATIO is ratio of non-current liabilities to total assets; FORSUB is ratio of number of foreign
subsidiaries to total number of subsidiaries; SUB is square root of total number of subsidiaries; LNTA is natural
log of total assets (in millions).

156
5.4.6.3.2 Results for Model 5 (The Effects of AC Variables on Audit Fees)
Panel A of Table 31 shows that the model has a high explanatory power. R2
= 0.772 explains
that audit fees accounts for 77.2% of the variation in the model. Adjusted R2
= 0.755, F-ratio=
30.147 and the model is low in autocorrelation (Durbin-Watson= 1.909) which is significant.
Mutlicolinearity is not a concern as tolerance statistics is not below 0.5 and VIF is not above
2 (shown in Panel B).
In addition, results in Panel B of Table 31 present the regression coefficients. The coefficient
for ACMEET (number of AC meetings held during the financial year) and AC SIZE (number
of members serving on the AC during the financial year are positive and significant at 0.004
and 0.039 respectively (t= 2.870 and 2.081, p< 0.05), indicating that audit fees are higher in
companies where the AC has more number of meetings held and larger number of members
serving on the committee. Whereas, the coefficients for ACCHAIRIND (ratio of scores
assigned to each of the two criteria for AC chair independence), ACEXP (ratio of number of
AC members with accounting/financial qualifications to total AC members.), ACINDUS
(ratio of number of AC members who has worked in the same industry for a substantial
number of years to total AC members) and ACCHAR (whether the firm has an AC charter)
are positive but not significantly (p> 0.05) associated with the level of audit fees (t= 1.672, t=
0.412, t= 0.609, t= 0.099, respectively).
Considering these results, the only attributes of AC’s governance characteristics that
significantly impacts on the effectiveness of AC in its role of facilitating the quality of
external audit are size and frequency of meetings while other AC characteristics do not have
an impact, namely, the independence of AC chair, financial and industry expertise of AC and
whether AC has a charter Hence, hypothesis three is partially supported.

157
Table 31: Ordinary Least Squares Regression Results Model 5 (The Effects of AC
Variables on Audit Fees)
PANEL A: Model Summary
R R Square Adjusted
R Square
Std. Error
of the
Estimate
Durbin-
Watson
F-ratio Sig.
0.879 0.772 0.755 0.493 1.909 30.147 0.000
PANEL B: Regression Coefficients
Dependent
Variable
LNAUDFEES
Unstandardized
coefficients
Standardized
Coefficients
Collinearity
Statistics
B Std.
Error
Beta t-value Sig. Tolerance VIF
Intercept 0.001 0.031 0.024 0.000
Independent
Variables
ACCHAIRIND 0.065 0.039 0.059 1.672 0.096 0.779 1.284
ACEXP 0.016 0.038 0.014 0.412 0.681 0.791 1.264
ACINDUS 0.023 0.038 0.021 0.609 0.543 0.775 1.291
ACMEET 0.116 0.040 0.111 2.870 0.004 0.640 1.562
ACSIZE 0.092 0.044 0.078 2.081 0.039 0.683 1.464
ACCHAR
0.006 0.059 0.003 0.099 0.921 0.847 1.181
Control
Variables
BODIND 0.006 0.036 0.006 0.173 0.863 0.754 1.327
BODMEET 0.022 0.034 0.022 0.644 0.520 0.862 1.161
BIG4 0.205 0.061 0.120 3.365 0.001 0.764 1.309
MINING -0.006 0.057 -0.004 -0.111 0.912 0.733 1.364
LOSS 0.061 0.057 0.042 1.080 0.281 0.646 1.548
ROA -0.022 0.039 -0.022 -0.567 0.572 0.637 1.569
INVENRATIO 0.032 0.041 0.029 0.764 0.445 0.663 1.508
RECRATIO 0.076 0.045 0.073 1.688 0.093 0.521 1.918
DEBTRATIO 0.069 0.036 0.067 1.931 0.050 0.807 1.240
FORSUB 0.200 0.037 0.185 5.463 0.000 0.839 1.192
SUB 0.085 0.050 0.085 1.703 0.009 0.591 1.560
LNTA 0.548 0.055 0.548 9.951 0.000 0.518 1.143
Note: LNAUDFEES is total audit fees are collected from the company annual reports and are then transformed into natural log;
ACCHAIRIND is ratio of total scores assigned to each of the two criteria for AC chair independence; ACEXP is ratio of number of AC members with accounting/financial qualifications to total AC members; ACINDUS is ratio of number of AC members who has worked in
the same industry for a substantial number of years (at least 10 years) to total AC members; ACMEET is number of AC meetings held
during the financial year; ACSIZE is number of members serving on the AC during the financial year; ACCHAR is equal to the value of “1” if AC has a charter and “0” otherwise;BODIND is ratio of non-executive directors on the board to total number board of directors;
BODMEET is number of board meetings held during the year; BIG4 is equal to the value of “1” if a Big 4 auditor is used and “0” when a
smaller audit firm is used; MINING is equal to the value of “1” when the company is in the mining industry, “0” otherwise; LOSS is equal to the value of “1” if the company has reported a loss in any of the three years prior to, “0” otherwise; ROA is ratio of earnings before
interest and tax to total assets; INVENRATIO is ratio of inventory to total assets; RECRATIO is ratio of receivables to total assets;
DEBTRATIO is ratio of non-current liabilities to total assets; FORSUB is ratio of number of foreign subsidiaries to total number of
subsidiaries; SUB is square root of total number of subsidiaries; LNTA is natural log of total assets (in millions).

158
5.4.6.3.3 Discussion of Findings on Model 5
Previous studies have shown that AC frequency of meetings and AC size are good measures
of AC effectiveness in fulfilling its role. The findings in Table 31 support Carello et al.
(2002), Goodwin and Kent (2006), Yatim et al. (2006) and Hoitash and Hoitash (2009) that
found audit fees to be significantly related to frequency of meetings and size. The
phenomenon underlying this result could be that ACs who meet frequently with the external
auditors and management are more likely to be informed about the auditing issues and
subsequently demand higher quality of external audits by increasing the audit fees. Moreover,
larger AC has more power to increase the quality of external audit by discovering and solving
potential risks in the financial reporting process.
Goodwin and Kent (2006), Yatim et al. (2006) and Singh and Newby (2010) found that audit
fees are not significantly associated with AC independence. These results are in contrast to
Carello et al. (2002) and Abbott et al. (2003) that reported a significant positive association
between higher external audit fees and AC independence. These contrasting findings could
be due to the regulatory corporate governance changes in the United States which have
caused greater AC oversight and have increased the level of disclosure relating to AC roles
and responsibilities. These regulatory changes could have instigated companies to reinforce
AC independence in ensuring the quality of the external audit.
Unlike other literature, this study examines the relationship between the independence of the
AC chair to audit fees (instead of the members’ independence). The reason for not applying
the latter is that all the top 300 ASX listed companies in Australia will display the same
extent of non-executive director independence across the committee members. The chair of
the AC plays an important role in influencing the agenda of the committee and the chair
needs to have independence for the AC to have credibility. Therefore, it is important to
examine this association.
The result of this study shows that the independence of AC chair is positive but not
significantly related with the level of audit fees. It can be argued that the enhanced
requirement by the ASX CGC which requires the AC to be chaired by an independent chair
that is not chair of the board of directors could probably cause a lack of association between
AC chair independence and audit fees. Further, the measure of independence in this study

159
may not be a good indicator to capture the association between chair independence and audit
fees because an AC chair is often a non-executive director of the firm but could still have a
substantial relationship with the company that hinders their independence.
The findings in Table 31 reveal that AC financial expertise and AC industry expertise are not
significantly related to audit fees. However, Abbott et al. (2003), Yatim et al. (2006) and
Hoitash and Hoitash (2009) reported a significant positive association between audit fees and
AC expertise. It can be argued that the findings in the previous studies differ from this study
due to sample size. Abbott et al. (2003) and Hoitash and Hoitash (2009) conducted their
studies in the United States. The sample of this study is comprised of large Australian
companies (ASX top 300) and even the large companies are considered small by the United
States standards (Holland and Ramsay, 2003). Moreover, another possible argument might be
that some Australian companies may have difficulty assigning independent directors with
suitable expertise and industry experience to be the members of the AC. As a result, this
could probably cause the relationship between AC expertise and industry with audit fees to be
insignificant.
Furthermore, the findings of this study show that AC charter is not significantly related to
audit fees. The association between AC charter and audit fees is new to the literature and this
study is the first to examine this association. According to ASX CGC (2007)
Recommendations 4.3, a firm should have a formal AC charter. An AC charter shows the
composition of the committee, responsibilities and its basic framework. The enhanced
requirements could possibly cause a lack of relationship between the AC charter and audit
fees. To balance this argument, it is found that out of 255 companies sampled in this study,
only 34 companies do not have an AC formal charter.
In conclusion, the results of this study only show that AC meetings and size are associated
with audit fees while the rest of the four variables are insignificant. AC frequency of
meetings and AC size definitely plays a larger role in facilitating the quality of external audit
in Australian companies.

160
5.4.6.3.4 Results for Model 6 (The Effects of Control Variables on Non-Audit Fees)
Table 32 shows the regression results for the effects of company-specific control variables on
non-audit fees. Panel A of Table 32 shows that the model has a reasonable explanatory power.
R2= 0.467 explains that non-audit fees accounts for 46.7% of the variation in the model.
Adjusted R2= 0.440, F-ratio= 17.635 and the model is low in autocorrelation.
Mutlicolinearity is not a concern as indicated by VIF and tolerance statistics presented in
Table 32, Panel B (tolerance not below 0.5 and VIF not above 2).
Results in Panel B of Table 32 present the regression coefficients. The coefficients for BIG4
(whether a firm uses Big Four audit firms) and LNTA (natural log of total assets) are
positively related to non-audit fees and are significant (p< 0.05). DEBTRATIO (ratio of non-
current liabilities to total assets), FORSUB (ratio of number of foreign subsidiaries to total
number of subsidiaries), SUB (square root of number of subsidiaries), LOSS (whether a firm
has reported a loss), INVENRATIO (ratio of inventory to total assets) and RECRATIO (ratio
of receivables to total assets) are in the predicted direction but not significant in explaining
non-audit fees.
Alternatively, the remaining two coefficients estimate, MINING (whether a firm is in the
mining industry) and ROA (ratio of earnings before interest and tax to total assets) is
negatively related but not significant in explaining non-audit fees too. In terms of board
characteristics, the coefficient estimates for BODIND (ratio of non-executive directors on the
board to total number board of directors) and BODMEET (number of board meetings held
during the year) are in predicted signs but not significantly related to non-audit fees.

161
Table 32: Ordinary Least Squares Regression Results Model 6 (The Effects of Control
Variables on Non-Audit Fees)
PANEL A: Model Summary
R R Square Adjusted
R Square
Std. Error
of the
Estimate
Durbin-
Watson
F-ratio Sig.
0.683 0.467 0.440 0.720 1.885 17.635 0.000
PANEL B: Regression Coefficients
Dependent
Variable
LNNON
AUDFEES
Unstandardized
coefficients
Standardized
Coefficients
Collinearity
Statistics
B Std.
Error
Beta t-value Sig. Tolerance VIF
Intercept 0.020 0.046 0.435 0.664
Control
Variables
BODIND -0.029 0.052 -0.029 -0.551 0.582 0.785 1.274
BODMEET -0.018 0.047 -0.018 -0.372 0.710 0.937 1.067
BIG4 0.263 0.088 0.159 2.983 0.003 0.779 1.284
MINING -0.069 0.083 -0.045 -0.828 0.408 0.751 1.332
LOSS 0.000 0.082 0.000 0.004 0.997 0.664 1.506
ROA -0.034 0.056 -0.035 -0.604 0.547 0.654 1.528
INVENRATIO 0.005 0.057 0.005 0.086 0.932 0.733 1.363
RECRATIO 0.110 0.066 0.108 1.677 0.095 0.529 1.889
DEBTRATIO 0.014 0.051 0.014 0.276 0.783 0.844 1.185
FORSUB 0.067 0.052 0.064 1.290 0.198 0.884 1.131
SUB 0.008 0.073 0.008 0.108 0.914 0.500 1.499
LNTA 0.549 0.072 0.567 7.625 0.000 0.598 1.512
Note: LNNONAUDFEES is total fees paid for non-audit services divided by the total fees paid to the auditors and are then transformed into
natural log; BODIND is ratio of non-executive directors on the board to total number board of directors; BODMEET is number of board
meetings held during the year; BIG4 is equal to the value of “1” if a Big 4 auditor is used and “0” when a smaller audit firm is used; MINING is equal to the value of “1” when the company is in the mining industry, “0” otherwise; LOSS is equal to the value of “1” if the
company has reported a loss in any of the three years prior to, “0” otherwise; ROA is ratio of earnings before interest and tax to total assets;
INVENRATIO is ratio of inventory to total assets; RECRATIO is ratio of receivables to total assets; DEBTRATIO is ratio of non-current liabilities to total assets; FORSUB is ratio of number of foreign subsidiaries to total number of subsidiaries; SUB is square root of total
number of subsidiaries; LNTA is natural log of total assets (in millions).

162
5.4.6.3.5 Results for Model 6 (The Effects of AC Variables on Non-Audit Fees)
Panel A of Table 33 shows that the model has a reasonable explanatory power. R2
= 0.480
explains that non-audit fees accounts for 48.0% of the variation in the model. Adjusted R2
=
0.440, F-ratio= 8.287 and the model is low in autocorrelation (Durbin-Watson = 1.890) which
is significant at p< 0.05. Mutlicolinearity is not a concern as indicated by VIF and tolerance
statistics (tolerance not below 0.5 and VIF not above 2).
Results in Panel B of Table 33 present the regression coefficients. The coefficient for
ACMEET (number of AC meetings held during the financial year) and AC SIZE (number of
members serving on the AC during the financial year) are negatively related to non-audit fees
and are significant at 0.050 and 0.049 respectively (t= -0.599 and -1.983, p< 0.05), indicating
that non-audit fees are lower in firms where the AC has more number of meetings held and
larger number of members serving on the committee.
By comparison, the coefficients for ACCHAIRIND (ratio of scores assigned to each of the
two criteria for AC chair independence), ACEXP (ratio of number of AC members with
accounting/financial qualifications to total AC members.), ACINDUS (ratio of number of AC
members who has worked in the same industry for a substantial number of years to total AC
members) and ACCHAR (whether the firm has an AC charter) are negative but not
significantly (p> 0.05) associated with the level of non-audit fees (t= -0.491, t= -1.283, t= -
0.714, t= -0.0281, respectively).
Of all the six AC’s governance characteristics that significantly impact on the effectiveness
of ACs in their role of ensuring independence of the external auditors, only AC size and AC
frequency of meetings have an impact. Hence, hypothesis four is also partially supported.

163
Table 33: Ordinary Least Squares Regression Results Model 6 (The Effects of AC
Variables on Non-Audit Fees)
PANEL A: Model Summary
R R Square Adjusted
R Square
Std. Error
of the
Estimate
Durbin-
Watson
F-ratio Sig.
0.693 0.480 0.440 0.720 1.890 8.287 0.000
PANEL B: Regression Coefficients
Dependent
Variable
LNNON
AUDFEES
Unstandardized
coefficients
Standardized
Coefficients
Collinearity
Statistics
B Std.
Error
Beta t-value Sig. Tolerance VIF
Constant 0.013 0.046 0.292 0.770
Independent
Variables
ACCHAIRIND -0.028 0.057 -0.026 -0.491 0.624 0.779 1.284
ACEXP -0.071 0.055 -0.068 -1.283 0.201 0.791 1.264
ACINDUS -0.039 0.055 -0.038 -0.714 0.476 0.775 1.291
ACMEET -0.035 0.059 -0.035 -0.599 0.050 0.640 1.562
ACSIZE -0.128 0.065 -0.113 -1.983 0.049 0.683 1.464
ACCHAR
-0.024 0.087 -0.014 -0.0281 0.779 0.847 1.181
Control
Variables BODIND -0.029 0.053 -0.029 -0.543 0.588 0.754 1.327
BODMEET -0.032 0.049 -0.033 -0.653 0.515 0.862 1.161
BIG4 0.246 0.089 0.148 2.762 0.006 0.764 1.309
MINING -0.079 0.084 -0.052 -0.945 0.346 0.733 1.364
LOSS 0.017 0.083 0.012 0.200 0.842 0.646 1.548
ROA -0.029 0.057 -0.030 -0.513 0.608 0.637 1.569
INVENRATIO 0.013 0.060 0.013 0.222 0.824 0.663 1.508
RECRATIO 0.111 0.066 0.109 1.671 0.096 0.521 1.918
DEBTRATIO 0.020 0.052 0.020 0.381 0.704 0.807 1.240
FORSUB 0.079 0.054 0.075 1.472 0.142 0.839 1.192
SUB 0.017 0.073 0.017 0.227 0.821 0.591 1.560
LNTA 0.471 0.081 0.486 5.843 0.000 0.518 1.143
Note: LNNONAUDFEES is total fees paid for non-audit services divided by the total fees paid to the auditors and are then transformed into
natural log; ACCHAIRIND is ratio of total scores assigned to each of the two criteria for AC chair independence; ACEXP is ratio of number of AC members with accounting/financial qualifications to total AC members; ACINDUS is ratio of number of AC members who has
worked in the same industry for a substantial number of years (at least 10 years) to total AC members; ACMEET is number of AC meetings
held during the financial year; ACSIZE is number of members serving on the AC during the financial year; ACCHAR is equal to the value of “1” if AC has a charter and “0” otherwise;BODIND is ratio of non-executive directors on the board to total number board of directors;
BODMEET is number of board meetings held during the year; BIG4 is equal to the value of “1” if a Big 4 auditor is used and “0” when a
smaller audit firm is used; MINING is equal to the value of “1” when the company is in the mining industry, “0” otherwise; LOSS is equal to the value of “1” if the company has reported a loss in any of the three years prior to, “0” otherwise; ROA is ratio of earnings before
interest and tax to total assets; INVENRATIO is ratio of inventory to total assets; RECRATIO is ratio of receivables to total assets;
DEBTRATIO is ratio of non-current liabilities to total assets; FORSUB is ratio of number of foreign subsidiaries to total number of
subsidiaries; SUB is square root of total number of subsidiaries; LNTA is natural log of total assets (in millions).

164
5.4.6.3.6 Discussion of Findings on Model 6
To this date only four studies examined the association between AC characteristics and non-
audit fees (Abbott et al., 2003; Hoitash and Hoitash, 2009; Lary and Taylor, 2011; Zaman et
al., 2011). Abbott et al. (2003) found that ACs comprised solely of independent directors and
meet at least four times annually, are significantly and negatively associated with the non-
audit service fees ratio. Similarly, in the post SOX period, Hoitash and Hoitash (2009) also
found that strong ACs lead to a smaller proportion of non audit fess with respect to total fees.
In summarizing the effects of AC characteristics on the independence of the external audit
function, the findings of this study show that higher AC frequency of meetings and AC size
significantly improve external auditor independence (as proxied by the lower non-audit fee
ratio). These results are consistent with those observed by Abbott et al. (2003), Hoitash and
Hoitash (2009) and Lary and Taylor (2011). It could be argued that ACs with more meetings
and larger size are in a better position to demand higher quality of external auditors by
ensuring a higher company budget allocated for audit service fees. Thus, higher audit service
fees would be likely to drive the non-audit fees ratio down. Moreover, stronger ACs (more
meetings and members) might be reluctant to authorize non-audit service fees provided by
the external auditors to the management in an attempt to increase external auditors’
independence.
In conclusion, the result of this study shows that AC frequency of meetings and AC size are
associated with non-audit fees while the rest of the four variables are insignificant. AC
frequency of meetings and AC size definitely play a larger role in ensuring the independence
of external auditors in Australian companies.
5.4.7 Model 6: Tests of Hypothesis Five
5.4.7.1 Correlation Analysis
Table 34 reports the Pearson correlation coefficients for the variables used in the Model 7
(audit-related agency monitoring costs and total shareholders return). The correlation matrix
table shows that total shareholders return (TSR) and AC fees ratio (ACFEESRATIO) has a
reasonable strong positive correlation (0.328) and is significant at p< 0.05. By comparison,
external audit fees ratio (AUDFEESRATIO) and internal audit function budget ratio
(IAFBUDRATIO) have a weak negative relationship with the dependent variable of this

165
study (TSR). Further multivariate analysis need to be performed in order to test the strength
and association of these relationships.
Table 34: Correlation Analysis for Model 7
TSR
ACFEES
RATIO
AUDFEES
RATIO
IAFBUD
RATIO
TSR
1.00
ACFEES
RATIO
0.328* 1.00
AUDFEES
RATIO
-0.179 0.123 1.00
IAFBUD
RATIO
-0.287* -0.049 0.821** 1.00
Note: ** Correlation is significant at the 0.01 level (1-tailed); * Correlation is at the
0.05 evel (1-tailed)
5.4.7.2 Regression Analysis
Ordinary least squares regression is used in Model 7 instead of stepwise regression. Although
this model uses a sample size (n= 36), there are only three variables in the model. Thus, it is
acceptable to run ordinary least squares regression to test hypothesis five of this study.
5.4.7.2.1 Results for Model 7
Table 35 shows regression results for the effects of audit-related agency monitoring costs on
total shareholders return. The model has a low explanatory power. R2
= 0.181 shows that total
shareholders return accounts for only 18.1% of the variation in the model. The model is low
in autocorrelation (Durbin-Watson = 2.103, p< 0.05.) and mutlicolinearity is not a concern as
indicated in Panel B where tolerance is not below 0.5 and VIF is not above 2.
In Panel B of Table 35 the regression coefficients show that only ACFEESRATIO (AC fees
ratio) is positive and significant at 0.041 (t= 1.867, p< 0.05), indicating that higher AC fees
paid to the chair and the members of the AC will result in higher total return on equity to the
shareholders of the company. Both independent variables AUDFEESRATIO (external audit
fees ratio) and IAFBUDRATIO (internal audit function budget ratio) are not significantly
associated to TSR (total shareholder returns) (p> 0.05). In summary, it can be seen that only

166
ACFEESRATIO (AC fees ratio) variable is significant. Hence, hypothesis five is also
partially supported.
Table 35: Ordinary Least Squares Regression Results Model 7
PANEL A: Model Summary
R R Square Adjusted
R Square
Std. Error
of the
Estimate
Durbin-
Watson
F-ratio Sig.
0.426 0.181 0.105 3.242 2.103 2.364 0.090
Panel B: Regression Coefficients
Dependent
Variable
TSR
Unstandardized
coefficients
Standardized
Coefficients
Collinearity
Statistics
B Std.
Error
Beta t-value Sig. Tolerance VIF
Intercept 3.59 1.210 2.970 0.006
Independent
Variables
ACFEES
RATIO
0.000 0.000 0.312 1.867 0.041 0.916 1.092
AUDFEES
RATIO
20.210 348.039 0.017 0.058 0.954 0.599 1.346
IAFBUD
RATIO
-0.001 0.001 -0.286 -0.983 0.333 0.503 1.303
Note: TSR is total shareholders return; ACFEESRATIO is ratio of total fees paid to the chair and AC members
to total number of AC members; AUDFEESRATIO is ratio of total of external audit fees to total assets;
IAFBUDRATIO is ratio of total internal audit budget to total assets.
5.4.7.2.2 Discussion of Findings on Model 7
The dependent variable, total shareholders return used in Model 7 captures whether higher
audit-related agency monitoring costs (i.e., AC fees, external audit fees and internal audit
function budget) have the effect of achieving higher total returns to the shareholders. The
findings in Table 35 show that AC fees are significantly related to total shareholders return
which leads to partial acceptance of hypothesis five.
This result infers that shareholders tend to obtain an economically rational outcome from the
board’s approval of relatively higher AC fees paid to the chair and members of the AC,
because this impacts positively on total shareholders returns. This significant cost-benefit
167
result for the AC could reflect the fact that a larger AC that meets more frequently would
incur relatively higher AC fees. Such larger and more active ACs are found to generate
stronger internal and external auditing for the company. That is, in Models 1, 2, 5 and 6 in
this study it is found that AC size, and in some cases AC meeting frequency, is significantly
positively related to higher resourcing of the internal audit function, as well as higher external
audit fees (indicating higher audit quality) and lower non-audit fees (indicating greater
auditor independence). These internal and external audit improvements brought about by
larger, more active and, presumably, more costly ACs, are found in Model 7 to translate into
greater benefits in terms of returns to shareholders.
However, Table 35 also reveals that no such economically rational outcome is achieved for
the shareholders, at least in the short term, from relatively higher costs being incurred directly
on external audit fees and internal audit function budget. These variables do not significantly
affect shareholders return. This finding in Model 7 may be due to the simple fact that these
higher costs do not outweigh the company benefits gained from the improved internal and
external audit services, as perceived in the share-market. Alternatively, other short-term
phenomena may have had a confounding effect on shareholders return in this study. In
particular, this study is based on data from the 2009- 2010 financial years which was still
under the effects of the global financial crisis. So relatively higher costs incurred on internal
and external auditing services in that year could have been less sensitive to the determination
of shareholders return in the Australian share-market in that year.
In conclusion, this study suggests that higher audit-related agency monitoring costs incurred
on the AC itself have economic benefits in terms of generating greater shareholder return, at
least in the short-term in a climate of financial market downturn. Interestingly, no such short-
term economic benefits to the shareholders in a climate of financial market downturn are
found from higher costs incurred on the companies’ internal and external audit services.

168
5.5 Conclusion
In this chapter, the results of the data analysis (questionnaire-data based sample and
secondary-data based sample) in relation to the effectiveness of ACs in performing their roles
especially in the internal audit function and external audit is discussed in detail. In general,
results of this study are mixed.
Hypothesis one (a) is partially supported. Only AC size is positive and significantly
associated with financial resources devoted to the internal audit function. Furthermore,
hypothesis one (b) is also partially supported. The findings show that both AC financial
expertise and AC size are positive and significantly related to internal audit function labour
hours. Conversely, hypotheses two (a) and (b) are rejected as no results are generated from
the stepwise regressions. This latter finding illustrates that no attributes of ACs governance
characteristics have a significant impact on the effectiveness of ACs in their role of ensuring
the internal audit function independence. Hypothesis three is partially supported too. AC size
and AC frequency of meetings are positive and significantly related to external audit fees. In
addition, hypothesis four is also partially accepted. Both AC size and frequency of meetings
are negatively and significantly related to non-audit fees. Finally, hypothesis five is partially
accepted as AC fees are positive and significantly related to total shareholders return.
The following chapter, Chapter 6, presents a comparative case study analysis for four
companies in the financials and materials industries, respectively. This next chapter will
provide a more in-depth analysis on the key AC’s governance characteristics that are found to
be significant in this chapter.

169
CHAPTER 6. COMPARATIVE CASE STUDY ANALYSIS
6.1 Introduction
A more in-depth analysis is reported in this chapter on the key AC’s governance
characteristics that are found to be significant in the regression analysis from the previous
chapter (Chapter 5). To this end, comparative analysis of two companies from the financials
industry and two companies from the materials industry is performed. Due to the issue of
confidentiality, the four companies will not be named. The companies will be called
Company A, Company B, Company C and Company D instead. Company A and Company B
are in the financials industry while Company C and Company D are in the materials industry.
First, the companies are compared according to the profile of each company and its audit
committee. Then, a detailed descriptive analysis on the nature and activities of the internal
audit function, the relationship between the AC and the internal audit function and the
independence of the internal audit function of each company is contrasted and examined. A
discussion and interpretation of the descriptive analysis of these companies are provided in
the latter section of the chapter.
6.2 Selection of the Companies
The findings of the data analysis presented in Chapter 5 shows that AC size, AC expertise
and AC frequency of meetings play a significant role in relation to the effectiveness of ACs
in performing their roles, especially in the internal audit function. The test of hypothesis one
(a) shows that AC size is significantly associated to financial resources devoted to the internal
audit function, and the test of hypothesis one (b) shows that both AC expertise and AC size
are significantly related to labour hours devoted to the internal audit function. Furthermore,
for hypothesis three, the results reveal that AC size and AC frequency of meetings are
significantly associated to external audit fees. Hypothesis four also shows that both AC size
and AC frequency of meetings are negatively and significantly associated to non-audit fees.
The results of significant AC characteristics are used as the criteria for selecting the
companies for comparative case study analysis in this chapter. The case companies are drawn
from the companies of 36 respondents collected from the questionnaire. Four companies are
selected (two companies from the financials industry and two companies from the materials

170
industry). In the financials industry, Company A and Company B are chosen because these
two companies have the largest and the smallest AC size, respectively, in the financials
industry. Company A has the largest AC size with a total of nine members while Company B
has the smallest AC size with a total of three members. Both companies have the same level
of AC expertise but a different AC frequency of meetings per year.
For the second pair of companies, drawn from the materials industry, the selection criterion is
the characteristics of AC frequency of meetings. Company C and Company D are selected
because these two companies have the highest and lowest AC frequency of meetings in a year.
Company C has the highest AC frequency of meetings with a total of nine meetings per year
while Company D has the lowest AC frequency of meetings with a total of two meetings per
year. Both companies have the same AC size but different level of AC expertise.
In summary, by comparing two companies in the same industry at the low and high end of the
scale for AC size and AC frequency of meetings, a detailed picture can be provided, whether
a company with a larger AC size or higher AC frequency of meetings is better at ensuring the
effectiveness of its internal audit function compared to a company with a smaller AC size and
lower AC frequency of meetings.
6.3 Comparative Case Study in the Financials Industry
A comparison is made between Company A and Company B in the financials industry. The
data used are secondary data collected from the annual reports, various financial data
collected from the online databases and also information extracted from extra questions in the
questionnaire (not used in the statistical analysis in Chapter 4).
6.3.1 Profile of the Companies
Company A is a banking and financial services provider in Australia while Company B is a
general insurance group with operations in Australia, New Zealand, United Kingdom, and
Asia. Both companies are categorised in the ASX GICS financials industry. In terms of
company size, Company A is a much larger public listed company with a total asset of
$618.28 billion while Company B has a total asset of $20.45 billion. Based on market
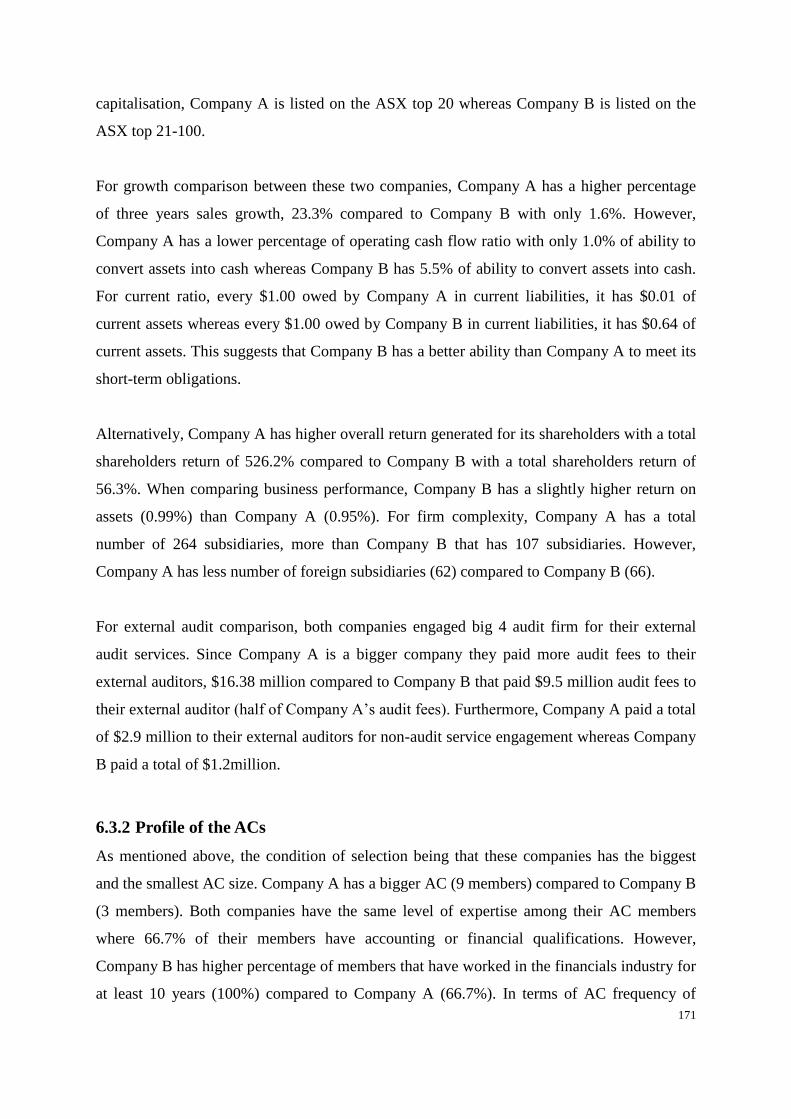
171
capitalisation, Company A is listed on the ASX top 20 whereas Company B is listed on the
ASX top 21-100.
For growth comparison between these two companies, Company A has a higher percentage
of three years sales growth, 23.3% compared to Company B with only 1.6%. However,
Company A has a lower percentage of operating cash flow ratio with only 1.0% of ability to
convert assets into cash whereas Company B has 5.5% of ability to convert assets into cash.
For current ratio, every $1.00 owed by Company A in current liabilities, it has $0.01 of
current assets whereas every $1.00 owed by Company B in current liabilities, it has $0.64 of
current assets. This suggests that Company B has a better ability than Company A to meet its
short-term obligations.
Alternatively, Company A has higher overall return generated for its shareholders with a total
shareholders return of 526.2% compared to Company B with a total shareholders return of
56.3%. When comparing business performance, Company B has a slightly higher return on
assets (0.99%) than Company A (0.95%). For firm complexity, Company A has a total
number of 264 subsidiaries, more than Company B that has 107 subsidiaries. However,
Company A has less number of foreign subsidiaries (62) compared to Company B (66).
For external audit comparison, both companies engaged big 4 audit firm for their external
audit services. Since Company A is a bigger company they paid more audit fees to their
external auditors, $16.38 million compared to Company B that paid $9.5 million audit fees to
their external auditor (half of Company A’s audit fees). Furthermore, Company A paid a total
of $2.9 million to their external auditors for non-audit service engagement whereas Company
B paid a total of $1.2million.
6.3.2 Profile of the ACs
As mentioned above, the condition of selection being that these companies has the biggest
and the smallest AC size. Company A has a bigger AC (9 members) compared to Company B
(3 members). Both companies have the same level of expertise among their AC members
where 66.7% of their members have accounting or financial qualifications. However,
Company B has higher percentage of members that have worked in the financials industry for
at least 10 years (100%) compared to Company A (66.7%). In terms of AC frequency of

172
meetings, Company B has more AC meetings than Company A with a total of 6 meetings and
4 meetings per year respectively. Both companies have a formal AC charter published on
their company website. On the other hand, Company A has higher AC chair independence
(100%) in contrast to Company B (75%). Last but not least, Company A paid $75,000 AC
fees per annum to its chair and members whereas Company B paid $21,000 less.
6.3.3 Questionnaire Comparison
6.3.3.1 Introduction
Findings from Chapter 5 illustrates that AC size plays a significant role in relation to the
effectiveness of AC in performing their roles especially in overseeing the quality of the
internal audit function. A larger AC size in a company would ensure higher quality of internal
audit function by allocating more budget and labour hours to internal audit activities. Thus,
using information collected from the questionnaire, this section will compare Company A
(largest AC size) with Company B (smallest AC size).
6.3.3.2 Profile of the Internal Audit Function
Since Company A is a much bigger company, it has a very large internal audit function in
contrast to Company B. Company A employed 100 professional staff in their internal audit
function with 76 full- time equivalent staff whereas Company B employed only 22
professional staff with 17 full- time equivalent staff. Both companies have the same
approximate total budget allocated to their internal audit function (approximately $1,000,000
and above). On average, 2600 hours per person are devoted to internal audit services by
Company B’s professional staff for the financial year ending in 2010. However, Company A
allocated less labour hours to their internal audit function. On average, 1500 hours per person
are devoted to internal audit services by Company A’s professional staff during the same
financial year.
Moreover, Company A reported that sometimes its internal audit function provide a training
ground as part of its employees’ career path in the company and often has internal audit
function staff moving to other management functions within the organization. In contrast,
Company B reported that its internal audit function sometimes provide a training ground as

173
part of the employees’ career paths and sometimes having internal audit function staff
moving to other management functions within the organization.
6.3.3.3 Internal Audit Function Activities
Proportion of total labour hours allocated to internal audit function activities differ slightly
between Company A and Company B. Company A has the most percentage of labour hours
allocated to maintaining the efficacy of management control systems (50%), evaluating the
effectiveness of risk management (30%), and both at 10% for financial statement auditing
and engaging in board and other corporate governance support work. Conversely, Company
B has the most percentage of labour hours allocated to evaluating the effectiveness of risk
management (47%), maintaining the efficacy of management control systems (46%),
financial statement auditing (5%) and deterring and investigating fraud (2%). No total hours
are assigned to engaging in board and other corporate governance support work.
6.3.3.4 Internal Audit Function Authority
Good AC practices in overseeing the internal audit function include: 1) making
recommendations to the board on the appointment and dismissal of CIA; 2) ensuring that
internal audit activity reports to the AC for functional purposes and reports to the CEO for
administrative purposes and 3) reviewing internal audit resources and budget setting
(AUASB, AICD and IIA, 2008).
Both companies strongly agree that their internal audit function reports to the AC, CEO and
CFO. Company A strongly agrees that AC and CEO in their company are responsible for
setting and approving the internal audit budget compared to CFO. However, the situation is
totally different for Company B. Both CEO and CFO play the most important role in
Company B’s internal budget setting compared to AC. Moreover, for Company A, AC, CEO,
and CFO share the same responsibility in appointing and replacing the CIA of internal audit
function whereas for Company B, CEO plays the most important role in appointing and
replacing the CIA.

174
6.3.3.5 Internal Audit Function and External Auditors
For coordination of internal audit function with the external auditors, both companies’
internal audit function often work together with their external auditors in the areas of internal
audit coverage. Company A’s internal audit function also coordinate internal audit work
schedule with their external auditors but Company B’s internal audit function only
occasionally coordinate internal audit work schedule with their external auditors. On the
other hand, the external auditors of Company A always have access to the working papers
and most management reports of the internal audit function but the external auditors of
Company B has limited access.
6.3.3.6 AC and Internal Audit Function
The internal audit function of Company A and Company B have the same number of
meetings (4 meetings per year) with their AC but Company A has longer length of meetings
(on average 180 minutes per meeting) compared to Company B (on average 30 minutes per
meeting). In terms of privacy of the internal audit function meetings with the AC, all
Company A’s meetings are partially private while all Company B’s meetings are totally
private.
The internal audit function of each company is asked to rate the overall expertise of their AC
members in regards to accounting, auditing and internal control matters. Both Company A
and Company B rated the expertise of its AC being good. Furthermore, there is a huge
comparison between the two companies in relation to AC reviewing the plans of the internal
audit function. Company A’s AC often reviews the plans of the internal audit function in
terms of its scheduling of work projects and co-coordinating with the external auditors but
Company B’s AC never does so.
Moreover, Company A’s AC receives more reports from its internal audit function compared
to Company B. Company A’s AC receives more than 6 reports per year regarding routine
internal audit activities and receives 3 to 5 reports per year regarding special investigations.
In contrast, Company B’s AC receives 3 to 5 reports per year relating to routine internal audit
activities and receives only 1 to 2 reports per year relating to special investigations from its
internal audit function.

175
6.3.3.7 Internal Audit Function Independence
Company A’s internal audit function has a better existing relationship with its AC and
Company A’s internal auditors also provide a strong backing for the maintenance of their
internal audit function’s independence in contrast to Company B. In addition, the
independence of both companies’ internal audit function is strongly upheld because of their
AC members have strong collective independence. The AC of Company A and Company B
would be prepared to take action to maintain the independence of their internal audit function
if it is threatened by the management of the company.
6.3.3.8 Discussion
The relationship between the internal audit function and the AC in an organization is deemed
to be a critical one. The goals of these two functions are closely related to each another and a
good relationship between them can enhance the overall quality of corporate governance. An
effective AC can enhance the status of the internal audit function and in turn the internal audit
function can help the AC in detecting financial misstatements (McHugh and Raghunandan,
1994). From the comparison of questionnaire data provided by the CIA of Company A
(largest AC size) and Company B (smallest AC size), it can be seen that there are several
differences between these two companies.
Firstly, substantial differences are found in the distribution of total labour hours allocated to
different internal audit function activities. Company A’s total labour hours are dominated by
maintaining the efficacy of management control systems, evaluating the effectiveness of risk
management, financial statement auditing and engaging in board and other corporate
governance support work. By comparison, Company B allocated its total hours more
narrowly on maintaining the efficacy of management control systems and evaluating the
effectiveness of risk management. This shows that Company A devotes a consideration
portion of internal audit hours to more internal control activities compared to Company B. It
can be argued that Company A, having a larger AC, has a more diverse set of skills and
knowledge to oversee and support the internal audit function’s development and execution of
its internal control systems. A larger AC will put a stronger emphasis on preventing material
control weaknesses, reacting proactively to increase internal controls, upholding corporate
governance support work and increasing financial statement auditing.

176
The second main difference is Company A’s AC has more authority than the CEO and CFO
in internal audit budget setting, compared to Company B where the AC has no authority to
override the CEO and CFO. It can be argued that Company A’s larger AC size gives it more
authority and voice in internal audit budget setting than Company B’s small AC size. Larger
ACs should command relatively more internal audit function oversight and be able to demand
relatively greater resources and internal audit focus allocated to internal controls. Carcello et
al. (2005) found a positive association between ACs that reviewed the internal audit’s budget
and the size of the budget.
To ensure an effective internal control system is implemented within an organization, the AC
is responsible to review the internal audit proposals related to plans, programs and
coordination with external auditors (Raghunandan et al., 2001). From the comparison
between these two companies, it can be seen that Company A’s AC often reviews or assesses
the plans of the internal audit function in terms of scheduling of work projects and
coordinating with the external auditors, but Company B’s AC never does so. This implies that
Company B’s larger AC has more members with technical expertise collectively have a better
understanding of the internal audit function’s work and have the ability to review all the work
and plans done by the internal audit function. According to Carcello et al. (2005), the review
of the internal audit plans by the AC suggests a greater commitment to internal audit
monitoring and risk oversight and is likely to manifest itself in greater resources being
provided to internal audit.
Also, Company A’s AC receives more reports from its internal audit function regarding
routine internal audit activities and special investigations compared to Company B’s AC. It
can be argued that more members in the AC will ensure better quality of the internal audit
function by demanding that internal auditors to provide more reports related to internal audit
activities. Felo et al. (2003) argued that a larger AC increases financial reporting quality as it
is more likely to discover and solve potential risks in the financial reporting process. This
may be possible if the resources available to the AC are increased to improve the oversight of
financial reporting.
The next main difference reported is that Company A’s internal audit employees have a
longer length of meetings with their AC (on average 150 minutes per meetings longer)

177
compared to Company B. To improve the effectiveness of the internal audit function,
conducting regular meetings between the AC and the internal audit function is vital
(Scarbrough et al., 1998). Thus, this shows that Company A’s larger AC is more efficient in
organizing meetings with its internal audit employees and ensures that longer meetings are
conducted. More hours spent on conducting a meeting will better enable the needs of the
organization to be met by ensuring the planned scope of internal auditing issues are discussed
and reviewed during the meeting.
For internal audit function independence, it is found that Company A’s internal audit function
has a better existing relationship with its AC. Also Company A’s internal auditors provide a
strong backing for the maintenance of their internal audit function’s independence in contrast
to Company B. Moreover, it is likely that the strong internal audit function of Company A
(i.e., the internal auditors provide a strong backing for the maintenance of their internal audit
function’s independence) can enhance the effectiveness of the AC; an effective AC (i.e.,
larger size) in turn can strengthen the position of the internal audit function. Goodwin and
Yeo (2001) found that an effective AC can strengthen the position of the internal audit
function by acting as an independent forum in which internal auditors may raise matters
affecting management.
Based on the assessment above of the main differences found in the comparative case study
analysis between Company A (largest AC size) and Company B (smallest AC size), the
findings are compatible with the results from the hypotheses test in Chapter 5. AC size does
play a significant role in relation to the effectiveness of an AC in performing its role in
overseeing the quality of the internal audit function. This case assessment re-enforces the
results of regression models 1 and 2. However, this conclusion needs to be qualified by the
fact that other variables such as the complexity of business arrangement could also affect the
effectiveness of an AC in performing its role in overseeing the quality of the internal audit
function.

178
6.4 Comparative Case Study in the Materials Industry
A comparison is made between Company C and Company D in the materials industry. The
data used in the comparative case study are secondary data and also data collected from the
questionnaire for financial year ending in 2010.
6.4.1 Profile of the Companies
Company C is a global corporation and among the world’s largest producers of commodities.
Activities involve mining, exploration, production and distribution of minerals, petroleum
and uranium. Conversely, Company D is an Australian-based nickel sulphide explorer and
producer. In terms of company size, Company C is a large public listed company in Australia
with a total asset of $122.32 billion while Company D has a total asset of $0.52 billion. Based
on market capitalisation, Company C is listed on the ASX top 20 whereas Company D is
listed on the ASX top 101- 300.
For growth comparison between these two companies, Company D has a very much higher
percentage of three years sales growth, 113.9% than Company C with only 9.7% of three
years sales growth rate. However, Company D has a lower percentage of operating cash flow
ratio, 16.7% of ability to convert assets into cash compared to Company C, 3.5% more ability
to convert assets into cash. For current ratio, every $1.00 owed by Company C in current
liabilities, it has $1.96 of current assets whereas every $1.00 owed by Company D in current
liabilities, it $2.22 of current assets. This proved that Company D has a better capacity than
company C to pay short-term obligations. For total shareholders return, Company C has a
really excellent and high overall return generated for its shareholders with a total
shareholders return of 304.9% compared to Company D with a total shareholders return of
72.2%.
Furthermore, 56.7% of Company D’s total assets are financed through long term debt
whereas only 15.3% of Company C’s total assets are financed through long term debt. When
comparing business performance, Company C has a higher return on assets (14.7%) than
Company D (6.9%). For company complexity, Company C has a total of 77 subsidiaries (39
foreign subsidiaries) more than Company D which has a total of 4 subsidiaries (no foreign
subsidiaries). For external audit comparison, Company C employs big 4 audit firm for its
external audit services while Company D employs a smaller audit firm. Since Company C is

179
a much bigger company they paid more audit fees to their external auditors, $15.70 million
compared to Company D that paid only $132,000 audit fees to its external auditors. Moreover,
Company C paid a total of $10.36 million to its external auditors for non-audit service
engagements whereas Company D paid a total of $26,000.
6.4.2 Profile of the ACs
As mentioned above, the condition of selection being that these companies have the most and
least frequency of AC meetings in a year. Company C has the most frequency of AC
meetings, 9 meetings in a year compared to Company D with only 2 meetings in a year.
Although Company C is a much larger company than Company D, both companies have the
same number of members on the AC (4 members) and both companies also have the same
level of AC chair independence (50%).
Company C has a higher level of expertise among its members where 75% of its AC
members have accounting or financial qualifications whereas only 50% of Company D’s AC
members have accounting or financial qualifications. However, Company D has higher
percentage of members that has worked in the materials industry for at least 10 years (50%)
compared to Company C (25%). Both companies have a formal AC charter published on
their company website. On the other hand, Company C paid a total of $ 75,000 AC fees per
annum to its chair and members whereas Company D paid $47,000 less.
6.4.3 Questionnaire Comparison
6.4.3.1 Introduction
Results from previous chapter (Chapter 5) shows that AC frequency of meetings is significant
in relation to the effectiveness of AC in performing roles of overseeing the quality of the
internal audit function. ACs who meet frequently are more likely to be informed about the
internal auditing issues and subsequently demand higher quality of internal audits. Hence,
using information collected from the questionnaire, this section will compare Company C
which has the most frequency of AC meetings in a year with Company D which has the least
frequency of AC meetings in a year.

180
6.4.3.2 Profile of the Internal Audit Function
Given that Company C is a huge company in Australia, it has a very large internal audit
function compared to Company D. Company C hired 54 professional staff in its internal audit
function with 36 full-time equivalent staff whereas Company D just has one professional staff.
There is also a huge comparison between the total budgets allocated to internal audit function
by each company. Company C has approximately $1,000,000 and above total budget
allocated to its internal audit function while Company D only has approximately $20,000 and
below total budget allocated to its internal audit function. On average, 1300 hours per person
are devoted to internal audit services by Company C’s professional staff for financial year
ending in 2010. Company D allocated 800 less labour hours per person to its internal audit
function.
Furthermore, Company C reported that its internal audit function always provide a training
ground as part of its employees’ career path in the company and always has internal audit
function staff moving to other management functions within the organization. In contrast,
Company D reported that its internal audit function only occasionally provide a training
ground as part of the employees’ career path and never has staff moving to other management
functions within the organization.
6.4.3.3 Internal Audit Function Activities
The proportion of total labour hours allocated to internal audit function activities differ
between Company C and Company D. Company C has the most percentage of labour hours
allocated to maintaining the efficacy of management control systems (45%), evaluating the
effectiveness of risk management (25%), financial statement auditing and engaging in board
and other corporate governance support work (both at 10%) and deterring and investigating
fraud (5%). On the other hand, Company D has the most percentage of labour hours allocated
to maintaining the efficacy of management control systems (50%), evaluating the
effectiveness of risk management (40%) and engaging in board and other corporate
governance support work (10%). No total hours are allocated to deterring and investigating
fraud and financial statement auditing.

181
6.4.3.4 Internal Audit Function Authority
Both companies have their internal audit function reports to the AC and CFO. Company C
strongly agrees that AC and CFO in the company are responsible for setting and approving
the internal audit budget compared to the CEO. However, the situation is totally different for
Company D. CFO plays the most important role in Company D’s internal audit budget setting
compared to AC and CEO. Moreover, for Company C, AC and CFO share the same
responsibility in appointing and replacing the CIA of the internal audit function whereas for
Company D, the CFO plays the most important role in appointing and replacing the CIA.
6.4.3.5 Internal Audit Function and External Auditors
Company C’s internal audit function has a very much better coordination with its external
auditors compared to Company D. Company C’s internal audit function always work together
with their external auditors in the areas of internal audit coverage and internal audit work
schedule but the situation is totally opposite for Company D. In addition, the external auditors
of Company C always have access to the working papers and most management reports of
the internal audit function compared to the external auditors of Company D that has no access
at all.
6.4.3.6 AC and Internal Audit Function
The internal audit function of Company C has more meetings (8 meetings per year) with its
AC in contrast to Company D (4 meetings per year). Also Company C has longer length of
meetings (on average 120 minutes per meeting) compared to Company D (on average 30
minutes per meeting). In terms of privacy of the meetings with the AC, some of Company
C’s meetings in a year have private time while Company D has no private meetings at all.
The internal audit functions of each company are asked to rate the overall expertise of their
AC members in regards to accounting, auditing and internal control matters. There is a huge
comparison between these two companies. Company C rated the expertise of its AC being
excellent while Company D rated the expertise of its AC being poor. Moreover, Company
C’s AC often review the plans of the internal audit function in terms of its scheduling of work
projects and co-coordinating with the external auditors. Conversely, Company D’s AC only
occasionally reviews the plans of the internal audit function in terms of its scheduling of
work projects and co-coordinating with the external auditors. In addition, Company C’s AC

182
also receives more reports from their internal audit function compared to Company D.
Company C’s AC receives 3 to 5 reports per year regarding routine internal audit activities
and special investigations. In contrast, Company D’s AC receives only 1 to 2 reports per year.
6.4.3.7 Internal Audit Function Independence
Company C’s internal audit function has a very much better existing relationship with its AC
and its internal auditors provide a strong backing for the maintenance of their internal audit
function’s independence compared to Company D. In addition, the independence of
Company C’s internal audit function is strongly upheld because of its AC members have
strong collective independence in contrast to Company D. The AC of both companies would
be prepared to take action to maintain the independence of their internal audit function if it is
threatened by the management of the company.
6.4.3.8 Discussion
From the comparison of questionnaire data provided by the CIA of Company C which has the
most AC frequency of meetings and Company D which has the least AC frequency of
meetings, it can be seen that there are several distinguish differences between these two
companies. First and foremost, Company C has a huge amount of total internal audit budget
and labour hours allocated to the internal audit function. It also has more professional internal
audit staff employed in the company compared to Company D.
It is found that Company C’s AC that meets more often than Company D’s AC in a year is
more likely to discuss issues faced by the internal audit function and to review the planned
scope of the internal auditing. Thus, Company C’s AC is more likely to be up to date about
the current internal auditing issues faced by the company and is more attentive in discharging
its responsibilities by allocating more resources (budget, staff and total labour hours) to the
internal audit function. Carcello et al. (2005) found that the internal audit budget is higher
when the AC reviews the internal audit budget. Also, Raghunandan et al. (2001) found that
ACs that meet at least four times annually are more likely to review and approve the internal
audit’s plans and budget.
Additionally, this study finds substantial differences in the allocation of total labour hours to
the internal audit function activities. Company C’s total labour hours are dominated by

183
maintaining the efficacy of management control systems, evaluating the effectiveness of risk
management, financial statement auditing, engaging in board and other corporate governance
support work and deterring and investigating fraud. In contrast, Company D’s internal audit
function allocated its total hours more on maintaining the efficacy of management control
systems, evaluating the effectiveness of risk management and engaging in board and other
corporate governance support work.
It can be seen that Company C allocates a larger portion of internal audit hours to more
internal control activities compared to Company D. Company C‘s AC whom meet more
frequently is likely to demand a higher quality from the internal audit function by ensuring
that the internal auditors engage in performing more testing on controls, evaluating risk
management, investigating fraud, performing financial statement audits and providing
corporate governance support work. Abbott et al. (2010) argued that an effective AC wants to
heighten the quality of the internal audit function and wishes to have the internal audit
function allocate relatively more of its resources towards internal control evaluation.
The next main difference is that Company C‘s AC and CFO share authority in internal audit
function budget setting compared to Company D where only the CFO has authority in budget
setting. It is likely that, with more frequent meetings in a year, Company C‘s AC is more
informed and knowledgeable about the internal audit function and would demand more
resources for the internal audit function when setting the budget. Christopher et al. (2009)
argued that giving the CEO or CFO sole responsibility for setting approving the internal audit
budget may be considered a serious threat to the independence of the internal audit function
as the imposing of budget constraints is a powerful tool with which management can reduce
the scope and impact of the internal audit function.
Moreover, Company C‘s AC and CFO have the most substantial influence in any decisions to
appoint or replace the CIA compared to Company D where the CFO has the most authority.
McHugh and Raghunandan (1994) found that a large majority of internal auditors indicated
that giving vesting or firing authority to the AC would enhance the independence of the
internal audit function, reduce oversight by the AC and improve the ability of internal
auditors to generate action on audit findings. Also, Scarbrough et al. (1998) found that when

184
an AC is involved in decisions to dismiss the CIA, the CIA is more likely to have private
access to the AC.
A further notable difference is that Company C’s internal audit function has more frequent
meetings and also has a longer length of meetings with its AC in contrast to Company D.
According to Scarbrough et al. (1998), conducting regular meetings between the AC and
internal audit function is widely recognized as an important vehicle of improving the
effectiveness of internal audit in the company. In reference to Company C, its AC which has
more frequent meetings would be more attentive to issues faced by the internal audit function.
In addition, some meetings of Company C’s internal audit function with their AC have
private time while there are no private meetings between Company D’s internal audit
function and its AC. Kalbers and Fogarty (1993) argued that the meetings between the CIA
and the AC should be conducted in private without the presence of members of company
management, since private meetings serve the purpose of enhancing and protecting the
independence of internal auditors.
In terms of the expertise of AC members, Company C’s internal audit function rated the
overall expertise of its AC members in regards to accounting, auditing and internal control
matters as excellent while the scenario is totally different for Company D. Company D’s
internal audit function rated the overall expertise of its AC members in as poor. This indicates
that effective ACs where Company C has more frequent AC meetings and higher AC
expertise than Company D are seen by their internal audit function as knowledgeable.
Raghunandan et al. (1998) found that ACs which granted private access to the CIA, and
reviewed both the program and results of the internal auditing, are perceived as
knowledgeable about accounting and auditing issues by the company’s CIA.
From the comparison of responses between Company C and Company D, Company C’s AC
often reviews or assesses the plans of the internal audit function in terms of scheduling of
work projects in contrast to Company D’s AC. A possible argument might be that Company
C’s AC that meets frequently, is more likely to be up to date about the current internal
auditing issues faced by the company and is more diligent in discharging its responsibility of
reviewing the internal audit function’s plan. Goodwin and Yeo (2001) found that almost 70%
of ACs in Singapore reviewed all plans, budget and results relating to financial reporting,

185
internal control and compliance. Furthermore, Company C’s AC receives more reports from
its internal audit function regarding routine internal audit activities and special investigations
as compared to Company D’s AC. It can be argued that with more frequent meetings, AC is
more knowledgeable about the internal audit function and will ensure better quality of the
internal audit function by demanding the internal auditors provide more reports related to
internal audit activities.
Turning to the issue of ensuring the independence of the internal audit function, it is found
that Company C’s internal audit function has a better existing relationship with its AC.
Moreover, the internal auditors at Company C provide a strong backing for the maintenance
of its internal audit function’s independence in contrast to Company D. Moreover, the
independence of Company C’s internal audit function is strongly upheld because AC
members have strong collective independence compared to Company D. Scarborough et al.
(1998) suggested that effective ACs are associated with objective and independent internal
audit functions. This upholding of independence suggests that Company C’s AC has a good
working relationship with its internal audit function. Company C’s more effective AC can
strengthen the position of the internal audit function by acting as an independent forum for
internal auditors to raise matters affecting the internal audit function (Goodwin and Yeo,
2001). Simultaneously, Company C’s internal audit function can assist its AC fulfilling its
oversight role regarding reporting, risk management and control. This, in turn implies a
higher quality of internal audit function.
Based on the assessment of the main differences found in the comparative case study between
Company C (most AC frequency of meetings) and Company D (least AC frequency of
meetings), strong evidence is found to support findings in Chapter 5. AC frequency of
meetings plays an important part in relation to the effectiveness of an AC in performing its
role of overseeing the quality of the internal audit function. The results of regression models
1 and 2 are confirmed by this comparative case study analysis. However, this conclusion
needs to be qualified by the fact that other variables such as the complexity of business
arrangement could also affect the effectiveness of an AC in performing its role in overseeing
the quality of the internal audit function.
186
6.5 Conclusion
In this chapter, a comparative case study analysis between two different companies in the
financials and materials industry is discussed in detail. The results are generally supportive
where AC size and frequency of meetings play a significant role in relation to the
effectiveness of AC in performing their roles especially in the internal audit function and are
consistent with results of the regression models in Chapter 5.

187
CHAPTER 7. CONCLUSIONS, LIMITATIONS,
IMPLICATIONS AND FUTURE RESEARCH
7.1 Introduction
This concluding chapter is structured into four sections. The first section will reiterate the
purpose, rationale and approach taken in this study and summarise conclusions from the
findings. The second section discusses the limitations of the study. In the third section, the
practical implications of the study are considered. The final section contains some
suggestions for future research.
7.2 Summary of the Study
The main aim of this study is to contribute to existing literature on AC effectiveness in
fulfilling its audit oversight role, as assessed through its corporate governance characteristics.
No prior empirical evidence has been provided from the viewpoint of testing the
effectiveness of AC’s governance characteristics in fulfilling their dual roles of overseeing
the internal and external audit functions. Moreover, previous studies have been limited in
measuring the effectiveness of ACs and this study will provide a more comprehensive
empirical design.
This study also has practical motivation. It examines AC effectiveness under the ASX CGC
revised 2007 edition best practice recommendations. The Australian context lends itself to
research as this 2007 regulatory change relating to ACs, enables the findings of this study to
give an assessment of whether regulatory changes have strengthened the AC roles or not. A
further practical consequence of this research is to assess whether higher agency costs (i.e.,
AC fees, external audit fees and internal audit budget) can better protect the interest of the
shareholders.
This study is based on economic perspectives embodied in agency theory. The premise is that
the AC, through its monitoring roles, will reduce agency problems associated with
information asymmetry and moral hazard. The concept of AC effectiveness can be
benchmarked against the roles outlined for ACs by the ASX CGC. Four of these AC roles are
examined in this study: 1) AC overseeing the quality of the internal audit function, 2) AC

188
ensuring the independence of the internal audit function, 3) AC facilitating the quality of the
external audit and 4) AC ensuring the independence of the external auditors. Five hypotheses
are developed from AC studies and this study has identified five factors that impact on the
role of effectiveness of an AC (i.e., independence of AC chair, financial and industry
expertise of AC members, frequency of meetings of AC, size of AC and AC formal charter).
Mixed methods are used to gather both primary and secondary data. There are two stages of
data collection employed- the questionnaire data collection stage and the secondary data
collection stage. In the first stage of data collection, a questionnaire is developed and
administered to the CIA of the sampled companies. In the second stage of data collection,
secondary data (financial and non-financial) of top 300 ASX listed companies listed during
the 2010 financial year is hand collected from annual reports and financial databases. The
five hypotheses of this study are tested using ordinary least squares and stepwise regression
models. A comparative case study analysis is also performed for four specific companies, two
from the financials industry and two from the materials industry. Comparative case study
analysis provides a more in-depth analysis on the key AC’s governance characteristics found
to be significant in the regression analysis.
7.3 Findings of the Study
The findings of this study are obtained from the analysis of both primary and secondary data.
First, data collected from the questionnaire sent to CIA are used to test hypothesis one (a),
hypothesis one (b), hypothesis two (a) and hypothesis two (b). Hypothesis one (a) is partially
supported. Only AC size is positive and significantly associated with financial resources
devoted to the internal audit function. Furthermore, hypothesis one (b) is also partially
supported. The findings show that both AC financial expertise and AC size are positive and
significantly related to internal audit function labour hours. Conversely, hypotheses two (a)
and (b) are rejected as no results are generated from the stepwise regressions. This latter
finding illustrates that no attributes of ACs governance characteristics have a significant
impact on the effectiveness of ACs in their role of ensuring the internal audit function
independence.
Second, data collected from the annual reports and financial databases are used to test
hypothesis three and hypothesis four. Hypothesis three is partially supported too. AC size and

189
AC frequency of meetings are positive and significantly related to external audit fees. This
proves that AC size and AC frequency of meetings are effective in facilitating the quality of
the external audit. In addition, hypothesis four is also partially accepted. Both AC size and
frequency of meetings are negatively and significantly related to non-audit fees. ACs
governance characteristics of size and frequency of meetings are effective in their role of
ensuring the independence of the external auditors.
Finally, in the agency costs-benefit analysis, overall data (combination of questionnaire and
secondary data) are used to test hypothesis five. Hypothesis five is partially accepted as AC
fees are positive and significantly related to total shareholders return. However both
independent variables, external audit fees and internal audit function budget are not
significantly associated with total shareholders return. These results reveal that audit-related
agency monitoring costs are only rationally incurred to generate returns to the shareholders,
at least in the short-term, when those costs relate to the members of the AC itself.
Furthermore, results from the comparative case study analysis between two different
companies in the financials and materials industry are generally supportive where AC size
and frequency of meetings play a significant role in relation to the effectiveness of AC in
performing their roles especially in the internal audit function and are consistent with results
of the regression models in. A summary of these findings is given in Table 36. Highlights of
similarities and differences between these findings and prior empirical studies have been
discussed in Chapter 5 and Chapter 6 of the thesis (Refer to Section 5.4.4.3, Section 5.4.5.3,
Section 5.4.6.3.3, Section 5.4.6.3.6, Section 5.4.7.2.2, Section 6.3.3.8 and Section 6.4.3.8).

190
Table 36: Summary of Findings
Findings Summary
Hypothesis One (a)
Partially
supported
AC size is positive and significantly associated with
financial resources devoted to the internal audit
function.
Hypothesis One (b)
Partially
supported
AC financial expertise and AC size are positive and
significantly related to internal audit function labour
hours.
Hypothesis Two (a)
Rejected No attributes of ACs governance characteristics have
a significant impact on the effectiveness of ACs in
their role of ensuring the internal audit function
independence.
Hypothesis Two (b)
Rejected No attributes of ACs governance characteristics have
a significant impact on the effectiveness of ACs in
their role of ensuring the internal audit function
independence.
Hypothesis Three
Partially
supported
AC size and AC frequency of meetings are positive
and significantly related to external audit fees.
Hypothesis Four
Partially
supported
AC size and frequency of meetings are negatively and
significantly related to non-audit fees.
Hypothesis Five
Partially
supported
AC fees are positive and significantly related to total
shareholders return.
Comparative
Case Study:
Company A (largest
AC Size) vs.
Company B
(smallest AC Size)
Support
hypotheses
findings
AC size does play a significant role in relation to the
effectiveness of an AC in performing its role in
overseeing the quality of the internal audit function.
Comparative Case
Study:
Company C (most
AC frequency of
meetings) vs.
Company D (least
AC frequency of
meetings)
Support
hypotheses
findings
AC frequency of meetings plays an important part in
relation to the effectiveness of an AC in performing
its role of overseeing the quality of the internal audit
function.

191
7.4 Limitations of the Study
This study has several limitations. There are limitations with the data, the model specification
and the scope for generalizing the results.
First, the data in this study are collected from the use of a questionnaire instrument and from
hand-extracted secondary data in the company annual reports. This data could be subjected to
error and bias. In terms of the primary data obtained using the questionnaire, limitations are
embodied in the design and administration of any field surveys. Because several questions in
the questionnaire are new to this study, their lack of prior testing does present a limitation for
internal validity. However, the questions have been drawn from various literature sources and
pre-tested for their meaningfulness and understandability.
Nevertheless, respondent biases could be present due to problems of acquiescence (i.e.,
second-guessing the responses that the researcher might view as favourable), partitioning (i.e.,
not giving any responses at the extremes of the Likert scales) and ‘halo effect’ (i.e., giving
self-ratings that are inflated). Turning to the administration of the questionnaire, the study
faced practical difficulties in fully identifying and accessing the target population of CIAs.
There is a possibility of lack of control on who completed the questionnaire since it is mailed
to the CFOs of top 300 ASX listed companies, whose names are publicly available, for
forwarding to the company’s CIA. This increased the probability that some responses are the
delegate of the CIA.
Second, the model specification might use variables that do not directly measure the concept
of ‘role effectiveness’ of ACs. Instead various governance characteristics of the AC are
measured. The effectiveness of the AC in fulfilling its roles is inferred from the strength of
the association between these governance characteristics and specific proxy measures on the
quality and independence of the internal audit function and external audit services. The six
AC governance characteristics used to measure AC effectiveness (chair independence,
financial and industry expertise, size, frequency of meetings and charter) are likely to be built
from behavioural and organisational aspects that are not reflected in the proxy measures.
Third, the scope to generalization of the results is limited. The results can be generalized only
to the population from which the sample is drawn. The sample is limited to the top 300 ASX

192
listed companies and to the 2009- 2010 financial year. The year is representative of a period
of financial market downturn. Further, the low response rate to the questionnaire survey
means that sample used in this study may not be representative of the population of CIAs in
the top 300 ASX listed companies.
7.5 Implications of the Study
The findings of this study have important implications for the shareholders and the board of
directors. Other interested parties for which the findings would have implications would
include regulators of corporate governance practices, accounting professional bodies and
academics.
The findings of the study have implications for regulators of corporate governance practices
in terms of the composition and functioning of ACs in Australia. Currently, the formation,
structure and operation of ACs in Australia are regulated by ASX listing rules and ASX CGC
best practice recommendations. The findings of this study will help standard setters and
policy makers to review the success or otherwise of ACs in Australia in fulfilling their roles
especially in the internal and external audit functions. The findings may support the ASX
CGC recommendations to strengthen the internal, external audit and corporate mechanisms
for listed companies in Australia. For example, this appears to be a need for the ASX to
consider special regulations concerning the adequacy of the budget for operating an AC that
listed companies maintain during economic downturn. Also, the findings of the study are
important as they provide new evidence on the extent of effectiveness of ACs in fulfilling
their primary roles. The fact ACs are less effective in areas such as maintaining internal audit
function independence should be a signal to management and regulators.
More generally, the results of this study should provide the accounting professional bodies in
Australia such as the Institute of Internal Auditors Australia (IIA), Institute of Chartered
Accountants Australia (CA) and Certified Practicing Accountant Australia (CPA) with better
understanding regarding the effective practice of ACs in overseeing the quality of internal
and external audit and also ensuring the independence of internal and external auditors. This
improved understanding can lead to accounting professional bodies providing
recommendations to their members on improving the relationship between the ACs, internal
auditors and external auditors.

193
Furthermore, this study has implications to the user of the annual reports especially the
shareholders. To reduce shareholders-managers agency conflicts, an AC that consists of
independent non-executive directors without a day-to-day management responsibility is in a
good position to perform a monitoring function for the shareholders (Goddard and Masters,
2000). The quality of AC members is important because of the significant agency benefit and
costs incurred in operating an AC.
Lastly, the findings of this study can help the board of directors choose the best AC members
in ensuring that AC is at its best in performing its roles as a key corporate governance
mechanism in the company. Moreover, there are implications to the academics of this study
as that it can enrich the literature on AC effectiveness and operations. The findings should not
only benefit readers in understanding the effectiveness of ACs in Australia in performing
their roles but also produce some policy implications that may be applicable to other
countries as well.
7.6 Suggestions for Future Research
This study leaves open a number of opportunities for future research. First, future quantitative
studies may consider using a more refined measure of independence, expertise, diligence and
authority of ACs. A direct measure of role fulfilment effectiveness of ACs could also be
developed. Moreover, this study could extend its database to include an investigation of
smaller companies listed on the ASX or for privately owned companies, or companies
operating in countries with differing regulatory requirements.
Second, the study uses quantitative data (questionnaire data-based sample and secondary
data-based sample) which serves to highlight statistical average relationships between
formally measured variables. This quantitative positivist approach does not reveal the
informal arrangements that exist within ACs and between ACs, the board, the controlling
shareholders, the internal and external auditors, and the top management. A complementary
research approach would be to undertake interpretative qualitative methods, particularly case-
based interviews and observations that could give deeper understanding of behaviours
amongst key organizational players.

194
Third, the theoretical perspective taken in the study is restricted to an economic rationalist,
agency view of shareholders-management relationships. It is beyond the scope of this study
to examine AC effectiveness under institutional theory perspectives, particularly the
perspectives of legitimization and loose coupling. For example, future research could
consider whether the reporting in annual reports of an AC having good governance
characteristics, is only loosely coupled to the real behaviours of members of an AC.
Additionally, future research could consider whether the impacts of behavioural relationships
between the AC and the board, and between the AC and management, are linked to the notion
of the AC’s effectiveness in fulfilling its roles.

195
REFERENCES
Abbott, L.J., & Parker, S. (2000). The effects of audit committee activity and independence
on corporate fraud. Managerial Finance, 26(11), 55-67.
Abbott, L.J., Parker, S., & Peters, G. (2003). An empirical investigation of audit fee, non-
audit fees and audit committees. Contemporary Accounting Research, 20(2), 215-234.
Abbot, L.J., Parker, S., & Peters, G.F. (2004). Audit committee characteristics and
restatements. Auditing: A Journal of Practice & Theory, 23(1), 69-87.
Abbott, L.J., Parker, S., & Peters, G.F. (2010). Serving two masters: the association between
audit committee internal audit oversight and internal audit activities. Accounting Horizons,
24(1), 1-24.
Abbott, L.J., Parker, S., Peters, G.F., & Raghunandan, K. (2003). The association between
audit committee characteristics and audit fees. Auditing: A Journal of Practice & Theory,
22(2), 17-32.
Abbott, L., Parker, S., Peters, G., & Rama, D.V. (2003). Audit committee effectiveness and
internal audit outsourcing. Working paper, USA: University of Memphis.
Abdul Rahman, R., & Mohamed Ali, F.H. (2006). Board, audit committee, culture and
earnings management: Malaysia evidence. Managerial Auditing Journal, 21(7), 783-804.
Aboody, D. (1996). Market valuation of employee stock option. Journal of Accounting and
Economics, 22, 357-391.
Ahmad, Z., & Taylor, D. (2009). Commitment to independence by internal auditors: the
effects of role ambiguity and role of conflict. Managerial Auditing Journal, 24(9), 899-925.
Amir, E., & Lev, B. (1996). Value relevance of non-financial information: the wireless
communication industries. Journal of Accounting and Economics, 22, 3-30.

196
Auditing & Assurance Standards Board (AUASB), Australian Institute of Company Directors
(AICD), & Institute of Internal Auditors Australia (IIA). (2008). Audit committees: a guide to
good practice. Ligare Pty Ltd, Riverwood, NSW.
Ashbaugh, H., LaFond, R., & Mayhew, B.W. (2003). Do nonaudit services compromise
auditor independence? Further evidence. Working paper, USA: University of Wisconsin.
Australian Industry Group (AI). (2010). Australian economic update- September 2010.
Economic Research Note. Australia, viewed 29th
October 2012.
<http://www.aigroup.com.au/portal/binary/com.epicentric.contentmanagement.servlet.Conten
tDeliveryServlet/LIVE_CONTENT/Publications/Reports/2010/Australian_Economic_Update
_September_2010.pdf>
Australian Stock Exchange (ASX). (2001). Guidance Note 9 Disclosures of Corporate
Governance Practices: Lsting Rule 4.10.
Australian Stock Exchange (ASX). (2006). ASX Listing Rules- Chapter 12.
Australian Stock Exchange (ASX). (2010). S&P/ASX Australian indices. Index methodology.
Australia, viewed 8th
August 2010.
<http://www.standardandpoors.com/servlet/BlobServer?blobheadername3=MDT-
Type&blobcol=urldata&blobtable=MungoBlobs&blobheadervalue2=inline%3B+filename%3
DMethodology_SP_Australian_Indices_Web.pdf&blobheadername2=Content-
Disposition&blobheadervalue1=application%2Fpdf&blobkey=id&blobheadername1=content
-type&blobwhere=1243672697462&blobheadervalue3=UTF-8>
Australian Stock Exchange Corporate Governance Council, ASX CGC. (2003). Corporate
governance principles and recommendations of good corporate governance and best
practices recommendations guidelines 1nd
Edition.
Australian Stock Exchange Corporate Governance Council, ASX CGC. (2007). Corporate
governance principles and recommendations of good corporate governance and best
practices recommendations guidelines 2nd
Edition.

197
Ball, R. & Brown, P. (1968). An empirical evaluation of accounting income numbers.
Journal of Accounting Research, 6, 159-178.
Barth, M., Beaver, W., & Landsman, W. (2001). The relevance of the value relevance
literature for financial accounting standard setting: another view. Journal of Accounting and
Economics, 31, 77-104.
Baxter, P., & Cotter, J. (2009). Audit committee and earnings quality. Accounting and
Finance, 49, 267-290.
Beasley, M.S. (1996). An empirical analysis of the relation between the board of director
composition and financial statement fraud. The Accounting Review, 71(4), 443-465.
Beasley, M.S., Carcello, J.V., Hermanson, D.R., & Lapides P.D. (2000). Fraudulent financial
reporting: consideration of industry traits and corporate governance mechanisms. Accounting
Horizons, 14, 14-21.
Beaver, W.H. (2002). Perspective on recent capital market research. The Accounting Review,
77, 453-474.
Becker, C.L., Defond, M.L., Jiambalvo, J., & Subramanyam, K.R. (1998). The effect of audit
quality on earnings management. Contemporary Accounting Research, 15(1), 1-24.
Bedard, J., Chtourou, S.M., & Courteau, L. (2004). The effect of audit committee expertise,
independence, and activity on aggressive earnings management. Auditing: A Journal of
Practice & Theory, 23(2), 13-35.
Benkel,M., Mather, P., & Ramay, A. (2006). The association between corporate governance
and earnings management: the role of independent directors, Corporate Ownership &
Control, 3(4), 65-75.
Berle, A., & Means, G. (1932). The modern corporation and private property. McMillan,
New York.
198
Blue Ribbon Committee on Improving the Effectiveness of Corporate Audit Committees
(BRC). (1999). Report and recommendations of the Blue Ribbon Committee on improving the
effectiveness of corporate audit committees. New York Stock Exchange and the National
Association of Security Dealers, New York, viewed 16th
June 2010.
< http://www.nasdaq.com/about/Blue_Ribbon_Panel.pdf>
Bonazzi, L., & Islam, S.M.N. (2007). Agency theory and corporate governance. A study of
the effectiveness of board in their monitoring of the CEO. Journal of Modelling in
Management, 2(1), 7-23.
Bradbury, M.E., Mak, Y.T., & Tan, S.M. (2006). Board characteristics, audit committee
characteristics and abnormal accruals. Pacific Accounting Review, 18(2), 47-68.
Braiotta, L. (1999). The audit committee handbook, third edition. John Wiley & Sons Inc,
New York, United States of America.
Braiotta Jr., L., & Zhou, J. (2008). An exploratory study of the effects of the European Union
8th
Directive on Company Law on audit committees: evidence from EU companies listed on
the US stock exchanges. Advances in Accounting, incorporating Advances in International
Accounting, 24, 262-271.
Bronson, S.N., Carcello, J.V., Hollingsworth, C.W., & Neal, T.L. (2009). Are fully
independent audit committees really necessary?. Journal Account Public Policy, 28, 265-280.
Brown, S., Lo, K., & Lys, T. (1999). Use of r2 in accounting research: Measuring changes in
value relevance over the last four decades. Journal of Accounting Research, 28, 83-115.
Bushman, R.M., & Smith, A.J. (2001). Financial accounting information and corporate
governance. Journal of Accounting and Economics, 32, 237-333.
Cadbury Committee. (1992). Report of the committee on the financial aspects of corporate
governance. London, viewed 17th
June 2010.
< http://www.uksa.org.uk/Corporate_Governance_Cadbury_1992.pdf>

199
Carcello, J.V., Hermanson, D.R., Neal, T.L., & Riley JR, R.A. (2002). Board characteristics
and audit fees. Contemporary Accounting Research, 19(3), 365-84.
Carcello, J.V., Hermanson, D.R., & Raghunandan, K. (2005). Factors associated with U.S.
public companies’ investment in internal auditing. Accounting Horizons, 19(2), 69-84.
Carcello, J.V., & Neal, T.L. (2000). Audit committee composition and auditor reporting. The
Accounting Review, 75(4), 453-467.
Chan, P., Ezzamel, M., & Gwilliam, D. (1993). Determinants of audit fees for quoted UK
companies. Journal of Business, Finance and Accounting, 20(6), 765-786.
Christopher, J., Sarens, G., & Leung, P. (2009). A critical analysis of the independence of the
internal audit function: evidence from Australia. Accounting, Auditing & Accountability
Journal, 22(2), 220-220.
Chung, R., Firth, M., & Kim, J. (2005). Earnings management surplus free cash flow and
external monitoring. Journal of Business Research, 58, 766-776
Clarke, T. (2004). Theories of corporate governance. Routledge, Great Britain.
Collier, P.A. (1993). Audit committees in major UK companies. Managerial Auditing
Journal, 8(3), 25-30.
Collier, P., & Gregory, A. (1996). Audit committee effectiveness and the audit fee. The
European Accounting Review, 5(2), 177-198.
Collins, D., Maydew, E., & Weiss, I. (1997). Changes in the value-relevance of earnings and
book values over the past forty years. Journal of Accounting and Economics, 24, 39- 79.
Cooley, W.W., & Lohnes, P.R. (1971). Multivariate data analysis. J. Wailey and Sons Inc,
New York.

200
Cooper, B.J. (1993). The audit committee and internal audit. Managerial Auditing Journal,
8(3), 8-10.
Cooper, B.J., Leung, P., & Mathews, C. (1994). Internal audit: an Australian profile.
Managerial Auditing Journal, 9(3), 13-19.
Coulton, J., Ruddock, C., & Taylor, S. (2007). Audit fees, non-audit services and auditor-
client economic bonding. Working paper, University of New South Wales.
Craswell, A.T., & Francis, J.R. (1999). Pricing intial audit engagements: A test of competing
theories. The Accounting Review, 74, 201-216.
Dalton, D.R., Dailey, C.M., Ellstrand, A.E., & Johnson, J.L. (1998). Meta-analytic reviews of
board composition, leadership structure and financial performance. Strategic Management
Journal, 19, 269-290.
Dahmash, F., Durand, R., & Watson, J. (2009). The value relevance and reliability of
reported goodwill and identifiable intangible assets. The British Accouting Review, 41, 120-
137.
Davidson, R., Goodwin-Stewart, J., & Kent, P. (2005). Internal governance and earnings
management. Accounting and Finance, 45, 241- 267.
Davidson, W.N., Xie, B., & Xu, W. (2004). Market reaction to voluntary announcements of
audit committee appointments: the effect of financial experts. Journal of Accounting and
Public Policy, 23, 279-293.
Davis-Friday, P., Eng, L.L., & Liu, C. (2006). The effects of the Asian crisis, corporate
governance and accounting system on the valuation of book and earnings. The International
Journal of Accounting, 41, 22-40.
DeAngelo, L. (1981). Auditor independence, low-balling and disclosures regulation. Journal
of Accounting and Economics, 3(2), 113-127.
201
Dellaportas, S., Leung, P., & Cooper, B.J. (2012). Observations on audit committee
characteristics. Managerial Auditing Journal, 27 (4), viewed 9 July 2013.
<http://www.emeraldinsight.com.ezproxy.lib.rmit.edu.au/journals.htm?issn=0268-
6902&volume=27&issue=4&articleid=17026574&show=html>
Dey, A. (2008). Corporate governance and agency conflicts. Journal of Accounting Research,
46(5), 1143-1181.
DeZoort, F.T. (1997). An investigation of audit committees’ oversight responsibilities.
Abacus, September, 208-227.
DeZoort, F.T., Hermanson, D.R., Archambeault, D.S., & Reed, S. (2002). Audit committee
effectiveness: A synthesis of the empirical audit committee literature. Journal of Accounting
Literature, 21, 38-75.
DeZoort, F.T., & Salterio, S. (2001). The effects of corporate governance experience,
financial-reporting and audit knowledge on audit committee members’ judgements. Auditing:
A Journal of Practice and Theory, 20, 31-47.
Dillman, D.A. (2000). Mail and internet surveys: the tailored design method. John Wiley &
Sons, Inc, New York.
DiMaggio, P.J., & Powell, W.W. (1983). The iron cage revisited: institutional isomorphism
and collective rationality in organizational fields. American Sociological Review, 48, 147-160.
Engel, E., Hayes, R.M., & Wang, X. (2010). Audit committee compensation and the demand
for monitoring the financial reporting process. Journal of Accounting and Economics, 49,
136-154.
Fama, E.F., & Jensen, M.C. (1983). Separation of ownership and control. Journal of Law and
Economics, 26(2), 301-326.

202
Farrrar, J. (2008). Corporate governance. Theories, principles and practice, third edition.
Oxford University Press, Victoria, Australia.
Felo, A.J., Krishnamurthy, S., & Solieri, S.A. (2003). Audit committee characteristics and the
perceived quality of financial reporting: an empirical analysis. Working paper, Penn State
University, Great Valley, PA.
Feltham, G.A., & Ohlson, J.A. (1995). Valuation and clean surplus accountin for operating
and financial activities. Contemporary Accounting Research, 11(2), 689- 735.
Field, A. (2009). Discovering statistics using SPSS, third edition. Sage Publications Ltd,
London, United Kingdom.
Firth, M. (1997). The provision of non-audit services by accounting firms to their audit
clients. Contemporary Accounting Research, 14(2), 1-21.
Francis, J.R. (1984). The effect of audit firm size on audit prices: A study of the Australian
market. Journal of Accounting and Economics, 6, 133-151.
Francis, J.R. (2004). What do we know about audit quality?. The British Accounting Review,
36, 345-368.
Francis, J.R., & Schipper, K. (1999). Have financial statement lost their relevance? Journal of
Accounting Research, 37, 319-352.
Francis, J.R., & Simon, D.T. (1987). A test of audit pricing in the small-client segment of the
U.S. audit market. The Accounting Review, 62, 145-157.
Frankel, R.M., Johnson, F.M., & Nelson, K.K. (2002). The relation between auditors’ fees for
non-audit services and earnings management. The Accounting Review, 77, 71-105.
Goddard, A. R., & Masters, C. (2001). Audit committee, Cadbury Code and audit fees: an
empirical analysis of UK companies. Managerial Auditing Journal, 15(7), 358-371.

203
Goh, B.W. (2009). Audit committees, board of director and remediation of material weakness
in internal control. Contemporary Accounting Research, 26(2), 549-579.
Goodwin-Stewart, J. (2003). The relationship between the audit committee and the internal
audit function: evidence from Australia and New Zealand. International Journal of Auditing,
7, 263-278.
Goodwin-Stewart, J., & Kent, P. (2006). Relation between external audit fees, audit
committee characteristics and internal audit. Journal of Accounting and Finance, 46(4), 387-
404.
Goodwin-Stewart, J., & Kent, P. (2006). The use of internal audit by Australian companies.
Managerial Auditing Journal, 21(1), 81-101.
Goodwin, J., & Seow, J.L. (2002). The influence of corporate governance mechanisms on the
quality of financial reporting and auditing: perceptions of auditors and directors in Singapore.
Accounting and Finance, 42, 195-223.
Goodwin-Stewart, J., & Yeo, T.Y. (2001). Two factors affecting internal audit independence
and objectivity: evidence from Singapore. International Journal of Auditing, 5, 107-125.
Garcia-Sanchez, I., Frias-Aceituno, J.V., & Garcia-Rubio, R. (2012). Determining factors of
audit committee attributes: evidence from Spain. International Journal of Auditing, 16, 184-
213.
Grambling, A.A. (2004). Role of the internal audit function in corporate governance: a
synthesis of the extent internal auditing literature and directions for future research. Journal
of Accounting Literature, 23, 194-244.
Gul, F.A., Lynn, S.G., & Tsui, J.S.L. (2002). Audit quality, management ownership and the
informativeness of accounting earnings. Journal of Accounting, Auditing & Finance, 7(1),
25-49

204
Gwilliam, D., & Kilcommins, M. (1998). The impact of audit firm size and audit committee
on perceptions of audit independence and financial statement reliability in Ireland. The Irish
Accounting Review, 5(1), 23-56.
Habib, A., & Azim, I. (2008). Corporate governance and the value relevance of accounting
information. Evidence from Australia. Accounting Research Journal, 21(2), 167- 194.
Hair, J.F., Anderson, R.E., Tatham, R.L., & Black, W.C. (1995). Multivariate data analysis,
fourth edition. Prentice Hall, Englewood Cliffs, New Jersey, United States of America.
Hansen, S.C. (1997). Designing internal controls: the interaction between efficiency wages
and monitoring. Contemporary Accounting Research, 14(1), 129-163.
Hoitash, R., & Hoitash, U. (2008). The role of audit committees in managing relationships
with external auditors after SOX. Managerial Auditing Journal, 24(4), 368-397.
Holland, D. & Ramsay, A. (2003). Do Australian companies manage earnings to meet simple
earnings benchmarks? Accounting & Finance, 43(1), 41-62.
Institute of Internal Auditors (IIA) (2002a). The IIA’s recommendations to the conference
committee on H.R. Altamonte Springs, FL: The Institute of Internal Auditors.
Institute of Internal Auditors (IIA) (2002b). Recommendations for improving corporate
governance. Altamonte Springs, FL: The Institute of Internal Auditors.
Institute of Internal Auditors (IIA) (2003a). The IIA’s position statement on audit committees.
Altamonte Springs, FL: The Institute of Internal Auditors.
Institute of Internal Auditors (IIA) (2003b). The IIA’s commentary regarding PCAOB
rulemaking docket No.008 . Altamonte Springs, FL: The Institute of Internal Auditors.
Institute of Internal Auditors (IIA) (2010). Frequently asked questions. Altamonte Springs,
FL: The Institute of Internal Auditors.

205
Jaggi, B., & Leung, S. (2007). Impact of family dominance on monitoring of earnings
management by audit committees: evidence from Hong Kong. Journal of International
Accounting, Auditing and Taxation, 16, 27-50.
Jamaluddin, A., Mastuki, N., & Ahmad, A. E. (2009). Corporate governance reform and the
value relevance of equity book value and earnings in Malaysia. Journal of Financial
Reporting and Accounting, 7(2), 41-59.
Jensen, M.C., & Meckling, W.H. (1976). Theory of the firm: managerial behaviour, agency
costs and ownership structure. Journal of Financial Economics, 3, 305-360.
Johnson, E.N., Walker, K.B., & Westergaard, E. (1995). Supplier concentration and pricing
of audit services in New Zealand. Auditing: A Journal of Practice and Theory, 18(6/7), 465-
478.
Kalbers, L.P., & Fogarty, T.J. (1993). Audit committee effectiveness: an empirical
investigation of the contribution of power. Auditing: A Journal of Practice and Theory, 12(1),
24-49.
Kanel, R., Mausbach, B.T., Kudielka, B.M., & Orth-Gomer, K. (2008). Relation of morning
serum cortisol to prothrombotic activity in women with stable coronary artery disease.
Journal Thromb Thrombolysis, 25, 165- 172.
Kaplan, S. (1985). An examination of the effects of environment and explicit internal control
on planned audit hours. Auditing: A Journal of Practice and Theory, Autumn, 12-25.
King, R., & Langli, J. (1998). Accounting diversity and firm valuation. The International
Journal of Accounting, 33(5), 529- 567.
Kleiman, R.T. (2010). Agency theory. Encyclopaedia of Business Second Edition, viewed
16th
June 2010.
< http://www.referenceforbusiness.com/encyclopedia/A-Ar/Agency-Theory.html>

206
Klein, A. (2002). Audit committee, board of director characteristics, and earnings
management. Journal of Accounting and Economics, 33, 375-400.
Kraja, A.T., Corbett, J., Ping, A., Lin, R.S., Jacobsen, P.A., Crosswhite, M., Borecki, I.B., &
Province, M.A. (2007). Rheumatiod arthritis, item response theory, blom transformation, and
mixed models. BMC Proceedings, 1(1), 1- 6.
Krishnan, J. (2005). Audit committee quality and internal control: an empirical analysis. The
Accounting Review, 80(2), 649-675.
Krishnan, G.V., & Visvanathan, G. (2008). Does the SOX definition of an accounting expert
matter? The Association between audit committee directors’ accounting expertise and
accounting conservatism. Contemporary Accounting Research, 25(3), 827-857.
Lary, A. M., & Taylor, D.W. (2011). Governance characteristics and role effectivnes of audit
committees. Managerial Auditing Journal, 27(4), 336-354.
Lev, B., & Zarowin, P. (1999). The boundries of financial reporting an how to extend them.
Journal of Accounting Research, 37(2), 353-383.
Lifschutz, S., Jacobi, A., & Feldshtein, S. (2010). Corporate governance characteristics and
external audit fees: a study of large public companies in Israel. International Journal of
Business and Management, 5(3), 109-116.
Lin, J.W., Li, J.F., & Yang, J.S. (2006). The effect of audit committee performance on
earnings quality. Managerial Auditing Journal, 21(9), 921-933.
Low, L., Tan, P.H., & Koh, H.C. (1990). The determinant of audit fees: An analysis in
Singapore context. Journal of Business, Finance and Accounting, 17(2), 285-295.
Magena, M., & Pike, R. (2004). Shareholding of audit committee members, audit committee
size and expertise and the quality of interim financial reporting. Working paper, Bradford
University, USA.

207
Machuga, S., & Teitel, K. (2009). Board of director characteristics and earnings quality
surrounding implementation of a corporate governance code in Mexico. Journal of
International Accounting, Auditing and Taxation, 18(1), 1-13.
McHugh, J., & Raghunandan, K. (1994). Hiring and firing the chief internal auditor. The
Internal Auditor, 51(4), 34-40.
McHugh, J., & Raghunandan, K. (1994). Internal auditors’ independence and interactions
with audit committees: Challenges of form and substance. Advances in Accounting, 12, 313-
333.
Menon, K., & Williams, J.D. (1994). The use of audit committees for monitoring. Journal of
Accounting and Public Policy, 13(2), 121-139.
Miller, S.E. (2009). Governance mechanisms as moderators of agency costs in a pre-SOX
environment. Journal of Business & Economics Research, 7(10), 15-32.
Munro, L.A., & Buckby, S. (2008). Audit committee regulation in Australia: how far have we
come? Australian Accounting Review, 18(44), 310-323.
Mutchler, J., Chang, S., & Prawitt, D. (2001). Independence and objectivity: a framework for
internal auditors. The Institute of Internal Auditors Research Foundation, Altamonte Springs,
Florida.
O’Sullivan, N. (1999). Board characteristics and audit pricing post-cadbury: a research note.
The European Accounting Review, 8(2), 253-263.
Palmer, R.E. (1997). Audit committees: are they effective? An auditor’s view. Journal of
Accountancy, 114, 76-9.
Palmrose, Z.V. (1986). Audit fees and auditor size. Journal of Accounting Research, 24, 97-
110.

208
Pararit, T., & Ussahawanitchakit, P. (2012). Roles of audit committee effectiveness in
financial information usefulness of Thai-listed firms. Journal of International Finance &
Economics, 85-102.
Peasnell, K.V., Pope, P.F., & Young, S. (2005). Board monitoring and earnings management:
do outside directors influence abnormal accruals?. Journal of Business Finance & Accounting,
32(7&8), 1331-46.
Piot, C., & Janin, R. (2007). External Auditors, audit committees and earnings management
in France. European Accounting Review, 16(2), 429-454.
Prakash, M., & Venable, C.F. (1993). Auditee incentives for auditor independence: the case
of non-audit services. The Accounting Review, 68(1), 113-133.
Psaros, J. (2009). Australia corporate governance. A review and analysis of key issues.
Pearson Education Australia, New South Wales, Australia.
Raghunandan, K., Rama, D.V., & Scarbrough, P. (1998). Accounting and audit knowledge
level of Canadian audit committees: some empirical evidence. Journal of International
Accounting, Auditing & Taxation, 7(2), 181-194.
Raghunandan, K., Read, W.J., & Rama, D.V. (2001). Audit committee composition, “gray
directors,” and interaction with internal auditing. Accounting Horizons, 15(2), 105-118.
Rainsbury, E.A., Bradbury, M., & Cahan, S.F. (2009). The impact of audit committee quality
on financial reporting quality and audit fees. Journal of Contemporary Accounting &
Economics, 5, 20-33.
Reitenga, A.L., & Tearney, M.G. (2003). Mandatory CEO retirements, discretionary accruals,
and corporate governance mechanisms. Journal of Accounting, Auditing & Finance, 18(2),
255-280.

209
Rezaee, Z., & Lander, G.H. (1993). The internal auditor’s relationship with the audit
committee. Managerial Auditing Journal, 8(3), 35-40.
Razaee, Z., Olibe, K.O., & Minmier, G. (2003). Improving corporate governance: the role of
audit committee disclosure. Managerial Auditing Journal, 530-537.
Safieddine, A. (2009). Islamic financial institutions and corporate governance: new insights
for agency theory. Corporate Governance: An International Review, 17(2), 142-158.
Saleh, N.M., Iskandar, T.M., & Rahmat, M.M. (2007). Audit committee characteristics and
earnings management: evidence from Malaysia. Asian Review of Accounting, 15(2), 147-163.
Sarens, G., De Beeldle, I., & Everaert. (2009). Internal audit: a comfort provider to the audit
committee. The British Accounting Review, 41, 90-106.
Scarbrough, P., Rama, D.V., & Raghunandan, K. (1998). Audit committe composition and
interaction with internal auditing: Canadian evidence. Accounting Horizons, 12(1), 51-62.
Schneider, A., & Wilner, N. (1990). A test of audit deterrent to financial reporting
irregularities using the randomised response technique. The Accounting Review, 65(3), 668-
681.
Simon, D.T. (1995). The audit sevices market: Additional empirical evidence. Auditing: A
Journal of Practice and Theory, 5(1), 71-78.
Simunic, D.A. (1980). The pricing of audit services: Theory and evidence. Journal of
Accounting Research, 18, 161-190.
Singh, H., & Newby, R. (2010). Internal audit and audit fees: further evidence. Managerial
Auditing Journal, 25(4), 309-327.
Stevens, J.P. (2002). Applied multivariate statistics for social sciences, fourth edition.
Hillsdale, NJ, Erlbum.

210
Stewart, J., & Subramaniam, N. (2010). Internal audit independence and objectivity:
emerging research opportunities. Managerial Auditing Journal, 25(4), 328-360.
Taylor, M.H. (1997). The market for audit services in Japan. Pacific Accounting Review, 9(2),
59-74.
Van der Zahn, M., & Tower, G. (2004). Audit committee features and earnings management:
further evidence from Singapore. International Journal of Business Governance and Ethics, 1,
233- 257.
Van Peursem, K.A. (2005). Conversations with internal auditors. Managerial Auditing
Journal, 20(5), 489-512.
Verschoor, C.C. (1992). Internal auditing interactions with the audit committee. Internal
Auditing, 7(4), 20-23.
Watts, R.L., & Zimmerman, J. (1986). Positive Accounting Theory, Prentice-Hall,
Englewood Cliffs.
Xie, B., Davidson III, W.N., & DaDalt, P.J. (2003). Earnings management and corporate
governance: the role of the board and the audit committee. Journal of Corporate Finance, 9,
295-316.
Yang, J.S., & Krishnan, J. (2005). Audit committees and quarterly earnings management.
International Journal of Auditing, 9, 201-219.
Yatim, P., Kent, P., & Clarkson, P. (2006). Governance structures, ethnicity, and audit fees of
Malaysian listed firms. Managerial Auditing Journal. 21(7), 757-782.
Zaman, M., Hudaib, M., & Haniffa, R. (2011). Corporate governance quality, audit fees and
non-audit fees. Journal of Business Finance & Accounting. 38(1) & (2), 165-197.

211
Zaman, M., & Sarens, G. (2013). Informal interactions between audit committees and
internal audit functions. Exploratory evidence and directions for future research. Managerial
Auditing Journal. 28(6), 495-515.
Zhang, Y., Zhou, J., & Zhou, N. (2007). Audit committee quality, auditor independence, and
internal control weakness. Journal of Accounting and Public Policy, 26, 300-327.

212
APPENDIX
Appendix A: List of Sampled Companies
No ASX Code Company Name
1 ABP Abacus Property Group
2 ACR Acrux Ltd
3 ADU Adamus Resources Ltd
4 ABC Adelaide Brighton Ltd
5 ABY Aditya Birla Minerals Ltd
6 AGK AGL Energy Ltd
7 ALS Alesco Corporation Ltd
8 AWC Alumina Ltd
9 AMC Amcor Ltd
10 AMP AMP Ltd
11 AMX Ampella Mining Ltd
12 ANN Ansell Ltd
13 ANZ ANZ Banking Group Ltd
14 APA APA Group
15 APN APN News & Media Ltd
16 AQA Aquila Resources Ltd
17 ARU Arafura Resources Ltd
18 AAD Ardent Leisure Group
19 ALL Aristocrat Leisure Ltd
20 AIO Asciano Ltd
21 ASZ ASG Group Ltd
22 APZ Aspen Group
23 AZT Aston Resources Ltd
24 AJA Astro Japan Property Group
25 ASX ASX Ltd
26 AGO Atlas Iron Ltd
27 AUT Aurora Oil & Gas Ltd
28 ASL Ausdrill Ltd
29 AAX Ausenco Ltd
30 AAC Australian Agricultural Company Ltd
31 API Australian Pharmaceutical Industries Ltd
32 ASB Austal Ltd
33 AUN Austar United Communications Ltd
34 ANG Austin Engineering Ltd
35 ALZ Australand Property Group
36 AWE AWE Ltd
37 BND Bandanna Energy Ltd
38 BOQ Bank of Queensland Ltd
39 BPT Beach Energy Ltd
40 BDR Beadell Resources Ltd
41 BEN Bendigo & Adelaide Bank Ltd

213
No ASX Code Company Name
42 BHP BHP Billiton Ltd
43 BBG Billabong International Ltd
44 BTA Biota Holdings Ltd
45 BSL BlueScope Steel Ltd
46 BLY Boart Longyear Ltd
47 BLD Boral Ltd
48 BOW Bow Energy Ltd
49 BKN Bradken Ltd
50 BXB Brambles Ltd
51 BRM Brockman Resources Ltd
52 CAB Cabcharge Australia Ltd
53 CTX Caltex Australia Ltd
54 CPB Campbell Brothers Ltd
55 CFE Cape Lambert Resources Ltd
56 CNX Carbon Energy Ltd
57 CVN Carnarvon Petroleum Ltd
58 CRZ Carsales.com Ltd
59 CCV Cash Converters International Ltd
60 CAH Catalpa Resources Ltd
61 CNP Centro Properties Group
62 CER Centro Retail Group
63 CFU Ceramic Fuel Cells Ltd
64 CDI Challenger Diversified Property Group
65 CIF Challenger Infrastructure Fund
66 CGF Challenger Ltd
67 CHC Charter Hall Group
68 CQO Charter Hall Office REIT
69 CQR Charter Hall Retail REIT
70 CLO Clough Ltd
71 CCL Coca-Cola Amatil Ltd
72 COH Cochlear Ltd
73 COK Cockatoo Coal Ltd
74 CBA Commonwealth Bank of Australia
75 CPU Computershare Ltd
76 CEU ConnectEast Group
77 CQT Conquest Mining Ltd
78 CWN Crown Ltd
79 CSV CSG Ltd
80 CSL CSL Ltd
81 CSR CSR Ltd
82 CUS Customers Ltd
83 DTE Dart Energy Ltd
84 DJS David Jones Ltd
85 DXS DEXUS Property Group

214
No ASX Code Company Name
86 DML Discovery Metals Ltd
87 DOW Downer EDI Ltd
88 DUE DUET Group
89 DLX DuluxGroup Ltd
90 ESG Eastern Star Gas Ltd
91 ELD Elders Ltd
92 EHL Emeco Holdings Ltd
93 ERA Energy Resources of Australia Ltd
94 EWC Energy World Corporation Ltd
95 ENV Envestra Ltd
96 EXT Extract Resources Ltd
97 FXJ Fairfax Media Ltd
98 FKP FKP Property Group
99 FWD Fleetwood Corporation Ltd
100 FXL FlexiGroup Ltd
101 FLT Flight Centre Ltd
102 FMS Flinders Mines Ltd
103 FGE Forge Group Ltd
104 FMG Fortescue Metals Group Ltd
105 FGL Fosters Group Ltd
106 GXY Galaxy Resources Ltd
107 GBG Gindalbie Metals Ltd
108 GCL Gloucester Coal Ltd
109 GFF Goodman Fielder Ltd
110 GMG Goodman Group
111 GPT GPT Group
112 GNC GrainCorp Ltd
113 GRR Grange Resources Ltd
114 GRY Gryphon Minerals Ltd
115 GUD GUD Holdings Ltd
116 GWA GWA Group Ltd
117 HVN Harvey Norman Holdings Ltd
118 HIL Hills Holdings Ltd
119 HZN Horizon Oil Ltd
120 IIN iiNet Ltd
121 ILU Iluka Resources Ltd
122 IMD Imdex Ltd
123 IMF IMF (Australia) Ltd
124 IPL Incitec Pivot Ltd
125 IRN Indophil Resources NL
126 IDL Industrea Ltd
127 IFN Infigen Energy stp
128 IOF Investa Office Fund
129 IAG Insurance Australia Group Ltd

215
No ASX Code Company Name
130 IAU Intrepid Mines Ltd
131 IVC InvoCare Ltd
132 IFL IOOF Holdings Ltd
133 IRE IRESS Market Technology Ltd
134 IVA Ivanhoe Aust
135 JBH JB Hi-Fi
136 KZL Kagara Ltd
137 KAR Karoon Gas Australia Ltd
138 KCN Kingsgate Consolidated Ltd
139 LEI Leighton Holdings Ltd
140 LLC Lend Lease Group
141 LNC Linc Energy
142 LYC Lynas Corporation Ltd
143 MCC Macarthur Coal Ltd
144 MAH Macmahon Holdings Ltd
145 MQA Macquarie Atlas Roads Group
146 MQG Macquarie Group Ltd
147 MAP MAp Group
148 MCE Matrix Composites & Engineering Ltd
149 MMS McMillan Shakespeare Ltd
150 MCP McPhersons Ltd
151 MML Medusa Mining Ltd
152 MEO MEO Australia Ltd
153 MRM Mermaid Marine Australia Ltd
154 MSB Mesoblast Ltd
155 MTS Metcash Ltd
156 MNC Metminco Ltd
157 MIO Miclyn Express Offshore Ltd
158 MRE Minara Resources Ltd
159 MCR Mincor Resources NL
160 MDL Mineral Deposits Ltd
161 MIN Mineral Resources Ltd
162 MBN Mirabela Nickel Ltd
163 MGR Mirvac Group
164 MPO Molopo Energy Ltd
165 MND Monadelphous Group Ltd
166 MGX Mount Gibson Iron Ltd
167 MMX Murchison Metals Ltd
168 MYR Myer Holdings Ltd
169 NAB National Australia Bank Ltd
170 NVT Navitas Ltd
171 NCM Newcrest Mining Ltd
172 NXS Nexus Energy Ltd
173 NDO Nido Petroleum Ltd

216
No ASX Code Company Name
174 NFE Northern Iron Ltd
175 NUF Nufarm Ltd
176 OKN Oakton Ltd
177 OST OneSteel Ltd
178 ORI Orica Ltd
179 ORG Origin Energy
180 OZL OZ Minerals Ltd
181 PBG Pacific Brands Ltd
182 PDN Paladin Energy Ltd
183 PNA PanAust Ltd
184 PAN Panoramic Resources Ltd
185 PPX PaperlinX Ltd
186 PPT Perpetual Ltd
187 PRU Perseus Mining Ltd
188 PXS Pharmaxis Ltd
189 PLA Platinum Australia Ltd
190 PMV Premier Investments Ltd
191 PRY Primary Health Care Ltd
192 PRG Programmed Maintenance Services Ltd
193 QAN Qantas Airways Ltd
194 QBE QBE Insurance Group Ltd
195 RMS Ramelius Resources Ltd
196 RHC Ramsay Health Care Ltd
197 REA REA Group Ltd
198 RRL Regis Resources Ltd
199 RXM Rex Minerals Ltd
200 RHG RHG Ltd
201 RIO Rio Tinto Ltd
202 RIV Riversdale Mining Ltd
203 ROC Roc Oil Company Ltd
204 SAI SAI Global Ltd
205 SFR Sandfire Resources NL
206 STO Santos Ltd
207 SAR Saracen Mineral Holdings Ltd
208 SDM Sedgman Ltd
209 SEK SEEK Ltd
210 SVW Seven Group Holdings Ltd
211 SIP Sigma Pharmaceuticals Ltd
212 SLR Silver Lake Resources Ltd
213 SGM SIMS Metal Management Ltd
214 SKE Skilled Group Ltd
215 SMX SMS Management & Technology Ltd
216 SHL Sonic Healthcare Ltd
217 SPN SP AusNet

217
No ASX Code Company Name
218 SKI Spark Infrastructure Group
219 SFH Specialty Fashion Group Ltd
220 SPT Spotless Group Ltd
221 SBM St Barbara Ltd
222 SXL Southern Cross Media Group Ltd
223 SGP Stockland
224 SRQ Straits Resources Ltd
225 SGN STW Communications Group Ltd
226 SUN Suncorp Group Ltd
227 SDL Sundance Resources Ltd
228 SUL Super Retail Group Ltd
229 TAH Tabcorp Holdings Ltd
230 TAP Tap Oil Ltd
231 TGR Tassal Group Ltd
232 TTS Tatts Group Ltd
233 TLS Telstra Corporation Ltd
234 TEN Ten Network Holdings Ltd
235 TRS The Reject Shop Ltd
236 TOL Toll Holdings Ltd
237 TOX Tox Free Solutions Ltd
238 TPM TPG Telecom Ltd
239 TSE Transfield Services Ltd
240 TPI Transpacific Industries Group Ltd
241 TCL Transurban Group
242 TRY Troy Resources NL
243 UGL UGL Ltd
244 VBA Virgin Blue Holdings Ltd
245 WTP Watpac Ltd
246 WES Wesfarmers Ltd
247 WSA Western Areas NL
248 WDC Westfield Group
249 WBC Westpac Banking Corporation
250 WEC White Energy Company Ltd
251 WHC Whitehaven Coal
252 WPL Woodside Petroleum
253 WOW Woolworths Ltd
254 WOR WorleyParsons Ltd
255 WTF Wotif.com Holdings Ltd

218
Appendix B: Ethics Approval Letter

219

220
Appendix C: Questionnaire Cover Letter

221
Appendix D: Questionnaire
The Internal Audit Function and the Audit Committee
General Instructions Dear Sir or Madam,
This questionnaire is organised in five sections. It should take you approximately 8 to 10
minutes to complete. Your insight is vital to this research. Please be assured that all responses
will be kept strictly confidential. Thank you.
Option 1:
Complete the questionnaire below and send it back to us in the enclosed postage-paid
envelope.
OR
Option 2:
Complete and submit the questionnaire online. To open and start this survey, please go to this
website: https://www.surveymonkey.com/s/RMIT_IIASurveyInhouse
Section 1: Background
1. Your age group: (Please tick)
BELOW 35
35 TO 44
45 TO 54
55 TO 64
65 OR OLDER
2. Gender:
MALE FEMALE
3. How long have you worked in the internal audit field over your career?
______ Years
4. What is your current job position?
________________________________________________________________
5. What is the name of your company? (Optional)
________________________________________________________________________
(Note: We seek your company name only for purposes of linking data from your
responses with that company’s publicly available published governance data. Please be
assured that you and your company will remain anonymous and not be mentioned by
name in any future published research.)
6. Size of your company based on market capitalization:
ASX TOP 20
ASX 21- 100
ASX 101- 300
ASX 301- 500
ASX BELOW 500

222
7. Industry of your company:
CONSUMER DISCRETIONARY
CONSUMER STAPLES
ENERGY
FINANCIALS
HEALTH CARE
INDUSTRIALS
INFORMATION TECHNOLOGY
MATERIALS
TELECOMMUNICATION SERVICES
UTILITIES
OTHERS
8. How many professional internal audit staff is employed in your company?
________________________________________________________________
9. What is the total annual internal audit budget? (Approximately dollar)
$20,000 AND BELOW
$21,000 TO $50,000
$51,000 TO $100,000
$101,000 TO $200,000
$201,000 TO $500,000
$501,000 TO $1,000,000
$1,001,000 AND ABOVE
Section 2: Internal Audit Function Activities
10. How many total hours per employee (approximately) were devoted to internal audit
services during your company’s most recent financial year?
________________________________________________________________
11. For the total hours indicated in Question 10, what proportion was allocated to each of the
following activities? (Please note that the percentage of hours should add up to 100%):
Activity Description
% of Hours
Deterring and investigating fraud
Maintaining the efficacy of management control systems
Financial statement auditing in collaboration with the external auditors
Evaluating the effectiveness of risk management, including safe
guarding assets
Engaging in board and other corporate governance support work
Other activities
(please specify:_____________________________________)

223
12. To what extent, does your internal audit function: (Please tick)
Never Seldom Sometimes Often Almost Always
Provide a training
ground as part of
employees’ career paths
in the company
Have turnover of staff
moving to other areas of
the company
13. Please indicate your level of agreement with the following statements:
(Please tick and answer in all three columns)
Statement Audit Committee Chief Executive Officer Chief Financial Officer
Your internal audit
function regularly
reports to:
Strongly Disagree
Disagree
Neutral
Agree
Strongly Agree
Strongly Disagree
Disagree
Neutral
Agree
Strongly Agree
Strongly Disagree
Disagree
Neutral
Agree
Strongly Agree
In setting the
internal audit’s
annual budget, there
is substantial
involvement by:
Strongly Disagree
Disagree
Neutral
Agree
Strongly Agree
Strongly Disagree
Disagree
Neutral
Agree
Strongly Agree
Strongly Disagree
Disagree
Neutral
Agree
Strongly Agree
In any decisions to
appoint or replace
the Chief/ Director
of Internal Audit,
substantial influence
would be expected
to come from:
Strongly Disagree
Disagree
Neutral
Agree
Strongly Agree
Strongly Disagree
Disagree
Neutral
Agree
Strongly Agree
Strongly Disagree
Disagree
Neutral
Agree
Strongly Agree

224
14. To what extent, does your internal audit function coordinate with the external auditors in
respect of:
Never Seldom Sometimes Often Almost Always
Areas of internal
audit coverage, other
than financial
statements
Internal audit work
schedule
15. To what extent, does the external auditors have access to:
Never Seldom Sometimes Often Almost Always
Working papers of
your internal audit
function
Most management
reports of your
internal audit
function
Section 3: Audit Committee and the Internal Audit Function
16. How many times a year does you/ your internal audit function meet with the Audit
Committee and how long is the length of the meeting?
Number of meetings a year : _______________________________________
Length of the meetings
(On average, minutes) : _______________________________________
17. In terms of privacy of your meetings with the Audit Committee (chair, individual
members or committee):
All meetings are totally private
All meetings are partially private
Some meetings in a year have private time
No private meetings
18. How do you rate the overall expertise of the Audit Committee members in regards to
accounting, auditing and internal control matters? (Please tick one)
Excellent
Good
Moderate
Poor

225
19. How often does the Audit Committee review or assess the plans of the internal audit
function in terms of its:
Never Seldom Sometimes Often Almost Always
Scheduling of work
projects
Co-ordinating with
the external auditors
20. How often per year does the Audit Committee receive reports from your internal audit
function related to:
None per year 1- 2 per year 3- 5 per year 6 or more per year
Routine internal
audit activities
Special
investigations
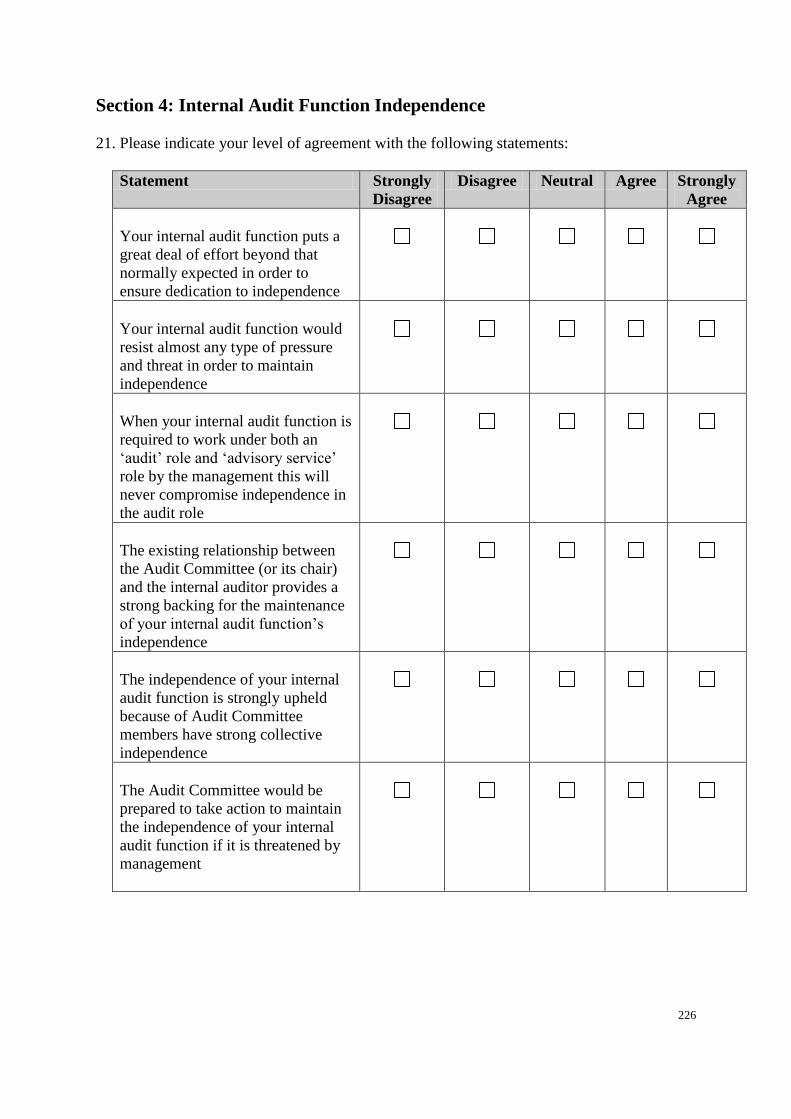
226
Section 4: Internal Audit Function Independence
21. Please indicate your level of agreement with the following statements:
Statement Strongly
Disagree
Disagree Neutral Agree Strongly
Agree
Your internal audit function puts a
great deal of effort beyond that
normally expected in order to
ensure dedication to independence
Your internal audit function would
resist almost any type of pressure
and threat in order to maintain
independence
When your internal audit function is
required to work under both an
‘audit’ role and ‘advisory service’
role by the management this will
never compromise independence in
the audit role
The existing relationship between
the Audit Committee (or its chair)
and the internal auditor provides a
strong backing for the maintenance
of your internal audit function’s
independence
The independence of your internal
audit function is strongly upheld
because of Audit Committee
members have strong collective
independence
The Audit Committee would be
prepared to take action to maintain
the independence of your internal
audit function if it is threatened by
management

227
22. Do you have any comments about your internal audit function, the Audit Committee or
the external auditors in your organisation?
________________________________________________________________________
________________________________________________________________________
________________________________________________________________________
________________________________________________________________________
Thank you for your participation. Your assistance is greatly appreciated.
Please return the questionnaire using the enclosed postage-paid envelope.
Confidentiality will be strictly assured.
SUMMARY REPORT: If you wish to receive a summary of the research findings, kindly
provide your details below or attach your business card:
Name: ________________________________________________________
Email: _________________________________________________________