Rodent Population Dynamics in Uncultivated Fields of ...
99
Louisiana State University LSU Digital Commons LSU Historical Dissertations and eses Graduate School 1956 Rodent Population Dynamics in Uncultivated Fields of Louisiana. Herbert Edwin Shadowen Louisiana State University and Agricultural & Mechanical College Follow this and additional works at: hps://digitalcommons.lsu.edu/gradschool_disstheses is Dissertation is brought to you for free and open access by the Graduate School at LSU Digital Commons. It has been accepted for inclusion in LSU Historical Dissertations and eses by an authorized administrator of LSU Digital Commons. For more information, please contact [email protected]. Recommended Citation Shadowen, Herbert Edwin, "Rodent Population Dynamics in Uncultivated Fields of Louisiana." (1956). LSU Historical Dissertations and eses. 180. hps://digitalcommons.lsu.edu/gradschool_disstheses/180
Transcript of Rodent Population Dynamics in Uncultivated Fields of ...

Louisiana State UniversityLSU Digital Commons
LSU Historical Dissertations and Theses Graduate School
1956
Rodent Population Dynamics in UncultivatedFields of Louisiana.Herbert Edwin ShadowenLouisiana State University and Agricultural & Mechanical College
Follow this and additional works at: https://digitalcommons.lsu.edu/gradschool_disstheses
This Dissertation is brought to you for free and open access by the Graduate School at LSU Digital Commons. It has been accepted for inclusion inLSU Historical Dissertations and Theses by an authorized administrator of LSU Digital Commons. For more information, please [email protected].
Recommended CitationShadowen, Herbert Edwin, "Rodent Population Dynamics in Uncultivated Fields of Louisiana." (1956). LSU Historical Dissertationsand Theses. 180.https://digitalcommons.lsu.edu/gradschool_disstheses/180

RODENT POPULATION DYNAMICS IN UNCULTIVATED FIELDS OFLOUISIANA
A Dissertation
Submitted to the Graduate Faculty of the Louisiana State University and
Agricultural and Mechanical College in partial fulfillment of the requirements for the degree of
Doctor of Philosophyin
The Department of Zoology
byHerbert Edwin Shadowen
A.B., Berea College, 1950 M.S., University of Kentucky, 1951
August, 1956

ACKNOWLEDGMENTS
I wish to express my appreciation to Dr. George H. Lowery, Jr., Director, Museum of Natural Science, Louisiana State University, for his assistance throughout this study.
I also want to thank Dr. Clair A. Brown, Professor of Botany at Louisiana State University, and Dr. John A. Moore, Professor of Botany at Louisiana Polytechnic Institute, for their assistance in the identification of plants. Professors Elllnor H. Behre, Harry J. Bennett,H. Bruce Boudreaux, and J. Harvey Roberts and Mr. Robert J. Newman have made numerous helpful suggestions. My wife has lent untold aid and encouragement.

TABLE OF CONTENTS
CHAPTER
CHAPTER
CHAPTER
CHAPTER
CHAPTER
CHAPTER
I INTRODUCTIONObjective of the study
II HISTORICAL REVIEWMethods of census Direct enumeration Indirect evidence Trap and retrap methodEvaluation of the trap and retrap method
III TECHNIQUES EMPLOYEDDefinitionsSelection of trapping sites Trap spacing and trapping periods Traps and materials Weighing and marking animals
IV GENERAL DISCUSSION OF ANIMALS OBSERVEDRodents observed Other animals observed
V DISCUSSION OF INFORMATION OBTAINEDPopulation composition Time of activity and frequency of
recapture Weight range and growth rate Population age and breeding season Sex ratios Population density Home range and territoriality
VI SUMMARY BIBLIOGRAPHYBIOGRAPHY

LIST OF TABLES
TableI The vegetation of the quadratsII Total captures of each species during each
trapping period at Kleinpeter with the percentage of total capture in parentheses
III Total captures of each species during each trapping period on the University plot with the percentage of total capture in parentheses
IV Summary of Sigmodon and Reithrodontomys trapping on the Kleinpeter plot showing initial captures and recaptures by trapping periods
V Summary of Sigmodon and Reithrodontomys trapping on the University plot showing initial captures and recaptures by trapping periods
VI Frequency of recapture on the Kleinpeter plotVII Frequency of recapture on the University plot
VIII Weight range and average weight of allSigmodon hispidus taken throughout the study based on the initial weight taken
IX Weight range and average weight of allReithrodontomys fulvescens taken throughout the study based on the initial weight taken
X Weight range and average weight of allReithrodontomvs humulis taken throughout the study based on the initial weight taken
XI Percentage distribution of immature and adult male Sigmodon hispidus by trappingperiods on Kleinpeter plot
<
XII Percentage distribution of immature andadult female Sigmodon hispidus by trapping periods on Kleinpeter plot
iv
Page10
33
3*+
35
36
39
i+O
i+l
1+2
*+3
i+5
1+6
TableXIII Percentage distribution of immature and adult
male Sigmodon hispidus by trapping periods on University plot
XIV Percentage distribution of immature and adult female Sigmodon hispidus by trapping periods on University plot
XV Percentage distribution of Sigmodon hispidus by sex and trapping period on the Kleinpeter plot
XVI Percentage distribution of Sigmodon hispidus by sex and trapping period on the University plot
XVII Percentage distribution of Reithrodontomvs fulvescens by sex and trapping period on the Kleinpeter plot
XVIII Percentage distribution of Reithrodontomys fulvescens by sex and trapping period on the University plot
XIX Percentage distribution of Reithrodontomys humulis by sex and trapping period on the Kleinpeter plot
XX Percentage distribution of Reithrodontomys humulis by sex and trapping period on the University plot
XXI Average daily density per acre on theKleinpeter plot based on the total number of each species trapped divided by the number of days in each trapping period
XXII Average daily density per acre on theUniversity plot based on the total number of each species trapped divided by the number of days in each trapping period
XXIII Average density per acre on the Kleinpeterplot based on initial captures for each period
XXIV Average density per acre on the Universityplot based on initial captures for' each period
Page
*+7
1*8
50
51
52
53
5^
55
59
60
61
62v

TableXXV The average minimum home ranges and average
major axes of Sigmodon hispidus on the two plots with the extremes in parentheses
Page
68
vi

LIST OF FIGURES
Figure1 The Minimum Home Ranges of Female Sigmodon
hispidus for the Months of November, January, and February
2 The Minimum Home Ranges of Female Sigmodon hisnidus from April through July
3 The Minimum Home Ranges of Male Sigmodon hispidus from April through July
vii
Page
70
71
72

LIST OF ILLUSTRATIONS
PlateI.
II.
PagePhotograph of the General Area of the Two Plots 13 Photograph of the Traps Used in the Study 18
viii

ABSTRACT
This study was undertaken in an effort to accumulate information concerning small-mammal populations, home ranges, territories, and life histories. Live traps, constructed of inch mesh wire, were placed at marked intervals in two uncultivated fields near Baton Rouge, Louisiana. The quadrats were 1.67 acres and 2 .9 8 acres in size, and 100 traps, placed in rows of ten, were used on each plot. The trapping periods varied from two to 16 days. The trapped rodents were weighed to the nearest tenth of a gram. They were marked for later recognition by punching holes in their ears according to an established numbering system. Bait consisted of peanut butter and rolled oats. The field work was begun in November, 195**-> and terminated in November,1955.
The following species were trapped more than once and are listed in descending order according to number of captures: Sigmodon hispidus. Reithrodontomys fulvescens«Reithrodontomys humulis. Crvptotis parva, Oryzomys palustris. and Mus muscuius. Over 75 per cent of the total captures consisted of the first two species named.
Sigmodon hispidus and Crvptotis parva were active both day and night. Reithrodontomys fulvescens and Reithrodontomys humulis were seldom trapped during the day. Some Sigmodon hispidus births occurred throughout the year,
ix

but most reproduction of this species took place from April to September with the peak in late spring, and the sex ratio was essentially equal. The number of male Keithrodontomys fulvescens was considerably higher than the number of females.
The average weight of Sigmodon hispidus was 79*1 grams with a range of 11 to 223 grams. The adult average weight was 106.8 grams. The average weight of Reithrodontomys fulvescens was 9*6 grams with extremes of •.0 and lb. 5 grams. All weight averages were based on the initial capture of each animal.
The highest recorded populations for the entire study, based on all initial small-mammal captures, were 5^.05 mammals per acre on the Kleinpeter plot and 22.78 mammals per acre on the University plot. The peak recorded Sigmodon hispidus density was 22.97 rats per acre in November, 195*+» at the beginning of the study. On both plots the low point in population size occurred in late summer and early fall. The peak densities of Reithrodontomys fulvescens and Reithrodontomys humulis were 18.92 mice per acre and 8.11 mice per acre respectively.
The minimum home range and the major axis of the home range were determined for all Sigmodon hispidus and Reithrodontomys fulvescens trapped three or more times.The results were as follows with the minimum home range

average listed first followed by the average major axis of the home range: male Sigmodon hispidus - 1+921+.2 squarefeet, 137*3 feet; female Sigmodon hispidus - *+798.9 square feet, 1*45.8 feet; male Reithrodontomys fulvescens - 1 2 ,3 8 3 .9
square feet, 221.*+ feet; female Reithrodontomys fulvescens - 13,065.*+ square feet, and 210.5 feet. The size of the home range was larger in winter -than in summer.
The points of capture of each animal were marked on charts, and the charts were superimposed upon each other in an effort to determine the extent of territoriality. There was little evidence of territoriality at any time of the year by either Sigmodon hispidus or Reithrodontomys fulvescens.
xi

CHAPTER I INTRODUCTION
Several investigations have been conducted in recent years in efforts to determine the structure and magnitude of populations and the heme ranges and territories of several species of animals. Each of these studies has usually concentrated on gaining some specific information about a particular species. The importance of such work wi.ll be briefly mentioned. For centuries people throughout the world have been interested in the population structure and distribution of various animals. Such information can be of value to workers in the fields of ecology, zoogeography, game management, agriculture, and related fields. Correct and adequate population data are essential in establishing programs for the maintenance, increase, or decrease of particular species. Hut it is only through studies carried on in various parts of the country that a complete picture can be obtained with respect to any widespread species.
In this study two uncultivated fields have been selected, and an attempt has been made to observe rodent population dynamics by trapping, marking, releasing, and later retrapping the animals. All rodents found on the two plots have been studied, and additional notes have been made on other species seen in the vicinity and on disturbances and weather conditions.

ObjectivesThe objectives of this study were as follows: to
determine the composition of the population in the two uncultivated fields; to observe any changes that might occur in the number cf species or number of individuals; to attempt to ascertain the cause of any change that might occur to make observations regarding home ranges and territoriality of the rodents involved in the study; and to record any information discovered concerning life histories.

CHAPTER II HISTORICAL REVIEW
One of the first requisites of a study of this type is a complete literature survey of related experiments and observations in order to learn about other workers1 techniques, results, and recommendations for improvement. The literature dealing with population structure and change is voluminous.
Eany noted workers have contributed to the area of population cycle studies in efforts to elucidate cyclic phenomena. Cyclic studies usually extend over several years and deal with the increase and decrease in numbers of animals. In contrast, this study is concerned not with cycles but with short range population changes taking place in a small area and extending over a period of several months. Rethods of Census
Several methods are employed in counting or sampling the animals of a region, and many types of animals have been investigated. The four groups of animals that have received most attention have been insects, birds, game mammals, and rodents. Three basic types of census were listed and discussed by Leopold (1936). They were as follows: directenumeration of entire areas or samples of them; ratios, based on trapping, banding, and later recapture of sample individuals; and observations of the condition and density

of populations through the use of indirect evidence.Direct enumeration
■This method is used when the animal in question is large and easily observed or when the entire population or a segment of it is being eliminated, or at least temporarily removed from an area. Such a census of necessity has to be rapid and complete to prevent capture of other members of the species that tend to move into the vacated area Other factors, such as sudden environmental changes and the varying abilities of workers to catch or observe all members of the species, lessen the value of this type of census.Indirect evidence
The method of indirect observation is often used by wildlife workers with satisfactory results. Greffenius (1939) attempted to determine the relative abundance of Kicrotus pennsylvanicus by observing oatmeal bait lines. Pellet counts, pellet contents, track counts, den numbers, types and amounts of food consumed, and other observable factors have little significance to the novice, but are often used by field technicians in determining the structure of wildlife populations. Observation of fecal pellets and nest contents of owls in the northern part of the United States is a reliable method of indicating the relative size of microtine populations. Southern, Watson, and
Chitty (19^6 ) observed nocturnal animals by means of an infra-red teloscope, and Southern (1955) increased our knowledge of trap success by utilizing the visible red rays of automobile head lamps in nocturnal observations.Tran and retran method
The idea of setting up ratios, based on live-trap- ping, marking, releasing, and retrapping individuals, is by no means a new method and is being used more frequently at the present time. One of the first to use this method was C. G. J. Peterson in 1889 in studies of the growth and mi- gratioh of fish. In 1930 Lincoln estimated the total duck population of North America by catching, banding, and releasing ducks and setting up a ratio based on the number of banded and unbanded ducks killed by hunters. This method of estimating the size of a population is referred to as the Lincoln Index (1929). Jackson used the same method in 1939 in estimating the density of tsetse flies. Schnabel (1 9 3 8) estimated the total number of fish in a lake by utilizing data obtained by repeated sampling. The number of studies making use of the recapture method has greatly increased during the first half of the present century.Many of the pertinent investigations will be referred to in this paper. For those who desire to pursue the subject further Mohr (19^3) has summarized small mammal censuses up to 19*+3 » and in another publication (19^7 ) gives tables

showing the results of most of the small-mammal censuses that have been made.
Various techniques have been employed in efforts to arrive at more accurate conclusions when using the trap and retrap method. One of the most publicized methods was that of Godfrey (195^)• Tubes of cobalt were attached to the legs of voles, and later movements were traced by means of a Geiger-Mu]ler counter. Although the animals were not recaptured, their presence could be detected.Evaluation of the trap and retrap method
The recapture method, or trap and retrap method, has both advantages and disadvantages when compared with other methods of population study. Some of the disadvantages are as follows: trapping may disrupt normal population movements; it may alter feeding habits; some animals appear to be more susceptible to trapping than others; certain members of the population may prevent others from entering the traps; the movements of the worker about the field may cause a population shift; differences in trapping techniques may bring about erroneous conclusions, especially when two or more workers are taking part in the study; the young animals may die during the absence of one or both of the parents; and the traps themselves may be a source of error. On the other hand trapping, marking, and releasing animals affords the worker an opportunity to study a population over a

7period of time without eliminating the population. Information concerning growth rates and distance of movements can be obtained repeatedly with the same individuals until a true concept is obtained. Needless to say, a certain amount of population disturbance and the elimination of a few animals are inevitable. If great care is taken to cause the least possible disturbance, however, information can be obtained that cannot be gathered by any other method yet devised.
CHAPTER III TECHNIQUES EMPLOYED
Several factors enter into a survey of this nature, the major points being the location of desirable trapping plots, the size of the plot, the spacing of traps, the type of trap, the use of bait, the length of trapping period, the method of marking and releasing the trapped animals, and the analysis of data obtained. Workers often differ on the methods to use, but the objective is always the same - to increase the knowledge of animal populations and movements.Definitions
The terms density, home range, and territory will be used many times in this paper. Density refers to the number of individuals occupying a given area. Home range is the area traversed by an animal carrying on its normal activities. Territory is that area occupied and defended by an animal against encroachment by other members of the same species.Selection of trapping sites
The selection of a trapping site depends upon the type of information one wishes to obtain or upon the particular animal the worker desires to study. The objectives of the present study have already been stated. The following localities were selected. The first quadrat, which
8

will be referred to as the University plot, had several desirable features. It was located on the Louisiana State University farm just outside of Baton Rouge. The latitude and longitude were as follows: 3 0°2 3 '3 7 " and 9 1 ° H ,08".The tract that included the plot consisted of six acres of uncultivated land, which was surrounded by land either under cultivation or being used as pasture. The terrain was slightly rolling, and drainage was poor so that water covered one end of the plot following heavy rains. Soil analysis revealed that the pH v/as 6.0. The amount of available potassium, calcium, and magnesium w as average, and the surface soil v/as deficient in phosphorus. Because of poor drainage the land had not been cultivated for several years, and a variety of plants grew in the area. The major vegetation consisted of goldenrod (Solidago S£.), vervain (Verbena littoralis), and blackberry (Rubus bifrons). A list of the vegetation found on each plot is given in Table I, and photographs of the two plots are shown on Plate I.
The second quadrat, which will be referred to as the Kleinpeter plot, v/as located ten miles from Baton Rouge near the small dairy center of Kleinpeter. The latitude and longitude were 30°20ll+1+" and 91°02'0lf" respectively. The plot was located within a large uncultivated field of approximately 20 acres. The land was slightly rolling and had last been cultivated in 19 *+. The soil had a pH of o,8 and

TABLE IThe Vegetation on the Quadrats
Plants found on both quadratsSolldago sp. Goldenrod Verbena littoralis Vervain Ambrosia artemisiifolia Common Ragweed Paspalum urvillei Vasey-grassIpomoea hederacea Morning-gloryPersicaria longistylum Smartweed Baccharis halimifolia Sea-myrtle Sida spinosa Prickly Mallow Kubus trivialis Southern Dewberry Rubus bifrons Blackberry Lythrum lanceolatum LoosestrifeIva ciliata Sumpweed Ampelopsis arborea Pepper-vine
Plants found on the Kleinpeter quadrat Quercus nigra Water-OakGnaphalium obtusifolium CudweedDiodia virginiana Buttonweed Eupatorium capillifolium Dog-fennel Helenium tenuifolium Sneezeweed Lippia lanceolata Fog-fruit Dichondra repens Choisy Andropogon virginicus Broom sedge
10

Lonicera .japonica Honeysuckle Elephantopus s p . Elephant footCroton canitatus HogwortKumex acetosella Sheep-sorrelLespedeza hirta Bush-clover Solanum carollhense Horse nettle Cassia fasciculata Partridge-pea Cirsium horridulum Common thistle Croton capitatus Hogwort
Plants found on the University quadratCampsis radicans Trumpet-flov/er Melothria pendula Cornus drummondi DogwoodPassiflora incarnata Apricot-vine Acer negundo Boxelder Ambrosia trifida Giant Ragweed Cephalanthus occidentalis Buttonbush Cyperus virens Umbrella-sedge Rhus radicans Poison Ivy Arundinaria gigantea Large Cane Ouercus phellos Willow-Oak Sambucus canadensis Common Elder Liauidambar stvraciflua Sweet Gum Sorgum halpense Johnson-grass Carva aquatica Bitter pecan
11

Parthenocissus quinguefolia Virginia CreeperVernonia altlssima IronweedFraxinus sp. AshDesmodium sp. Tick-trefoilSpilanthes repens SpilanthesGerardia sp, GerardiaCaperonia castanaefolia Caperonia
12

PLATE IPhotographs of the Two Trapping Areas
13

was deficient in phosphorus and potassium. The principal vegetation was broom sedge (Andropogon virginicus), goldenrod (Solidago sjs.), and vervain (Verbena littoralis). Small-mammal movements were restricted to some extent on the University plot because the area was partially surrounded by cultivated land, but on the Kleinpeter plot the population had ample opportunity to move in any direction because the surrounding vegetation was similar to that of the plot. The Kleinpeter plot could have been more closely observed had it been located nearer the University, but I deemed it essential to select sites on which people seldom traveled.Trap spacing and trapping periods
The distance between traps and the length of trapping periods are matters of great importance. The traps should be spaced close enough that all the rodents in the area may be trapped, and in addition there should be several traps within the home range of each animal. Odum (1955)j in his long-range study of Sigmodon hispidus populations, used -J- acre quadrats containing ten to 20 traps for a period of four years and then switched to the use of a double trapline. Goodnight and Koestner (19*+2) used an area 62£ meters long and ten meters wide in studying small- mammal populations and reported that live traps and snap traps were equally effective. Townsend (1935) trapped

15areas as small as one tenth of an acre. The studies mentioned above were all conducted for the purpose of determining population density. Dice (1950) placed traps 200 feet apart in studying dispersal distance of deermice.
The following investigations were made with at least part of the objective being to determine home range. Morris (1 9 5 5)) using a trapping period of three nights, employed 6*+ traps in an eight by eight grid of 2 .2 8 acres and then increased it to 195 traps **5 feet apart on 7*82 acres. York (19^9) used plots 900 by 900 feet with live traps set 100 feet apart in determining the density of heteromyid rodents in Texas. Swartz (19^1) scattered live traps over 100 acres of land in studying the cottontail rabbit. Yeager (1953)) in studies of chipmunks, placed 30 to 50 live traps 15 to 18 feet apart in areas of two to three acres. Burt (19^0) used plots of 1.8 acres and 3.72 acres in studies of small mammals, and Abegg (1939)> doing similar work, arranged the traps in a square ten paces apart.
Thus there are differences of opinion concerning the best spacing of traps in home range studies. Hayne (1 9 5 0, page 39) has the following comment concerning trapping:
Perhaps the home range of an animal cannot be determined by means of a grid setting of traps, where an investigator may either set the traps so closely that the more distant wanderings of the animals are less likely to be recorded by captures, or, on the other hand, he may set the traps so widely separated that the animal will be captured only infrequently.

16In contrast to the above quotation Bole (19395 page 7*0 states:
. . . In general, the larger the quadrat the more accurate the results, and that quadrats 150 feet or 50 meters on a side or circular units of corresponding area are still small enough to be easily operated and are large enough to provide a high degree of accuracy, and hence should be considered.the standard sizes for population investigations of mammals whose home ranges are of the same size or smaller than that of the quadrat.
Blair (19^1) suggests that the plot be ten to 20 times the expected size of the home range.
After studying other workers' techniques and after trapping in the vicinity of the proposed’quadrats, I selected the following plot sizes. The University farm quadrat covered an area of 1.67 acres and the traps v’ere placed 30 feet apart. Although the plot had to be shifted because of cultivation of one small portion of the area, the same dimensions were maintained throughout the study. At all times on both plots 100 traps, placed in rows of ten, were used. At the beginning of the survey the Kleinpeter plot covered .71*- acres with the traps 20 feet apart, but in March the area was increased to 2.9$ acres by placing the traps ^0 feet apart. The increase in size was made for the following reasons: doubling the number of traps for a two-dayperiod revealed no increase in the number of rodents taken; the apparent home range of Siemodon hispidus necessitated an increase; and I desired to compare the results obtained

17from the small area with those from the larger tract.
The length of the trapping periods varied from two to 16 days because of weather conditions and my schedule of work. This time variation was unavoidable but had no undesirable effects on the investigation.Traps and materials
The same basic type of trap was used throughout the survey except for the so-called clean-up period at the end of the study in which snap traps were also employed. Two sets of live traps were constructed. The accompanying photograph (Plate II) shows the two types of traps. In the first group of 100 traps the sides, top, and bottom were constructed of 3/8 inch cypress, and the dimensions were ten by three by three inches. The door, which was made of light-weight metal, operated from a hinge and was pushed open by the animal when entering. The rear of the trap was covered with inch wire mesh - large enough to allow sufficient ventilation and small enough to contain the smallest rodent. The excessive dampness of the region, however, caused some of the traps to become defective. Swelling occurred when the cypress became saturated with water, and the door failed to open and close properly. Some of the rodents, particularly Oryzomys palustris. were able to escape when the size of the door was decreased or when warping occurred. This problem was solved by constructing
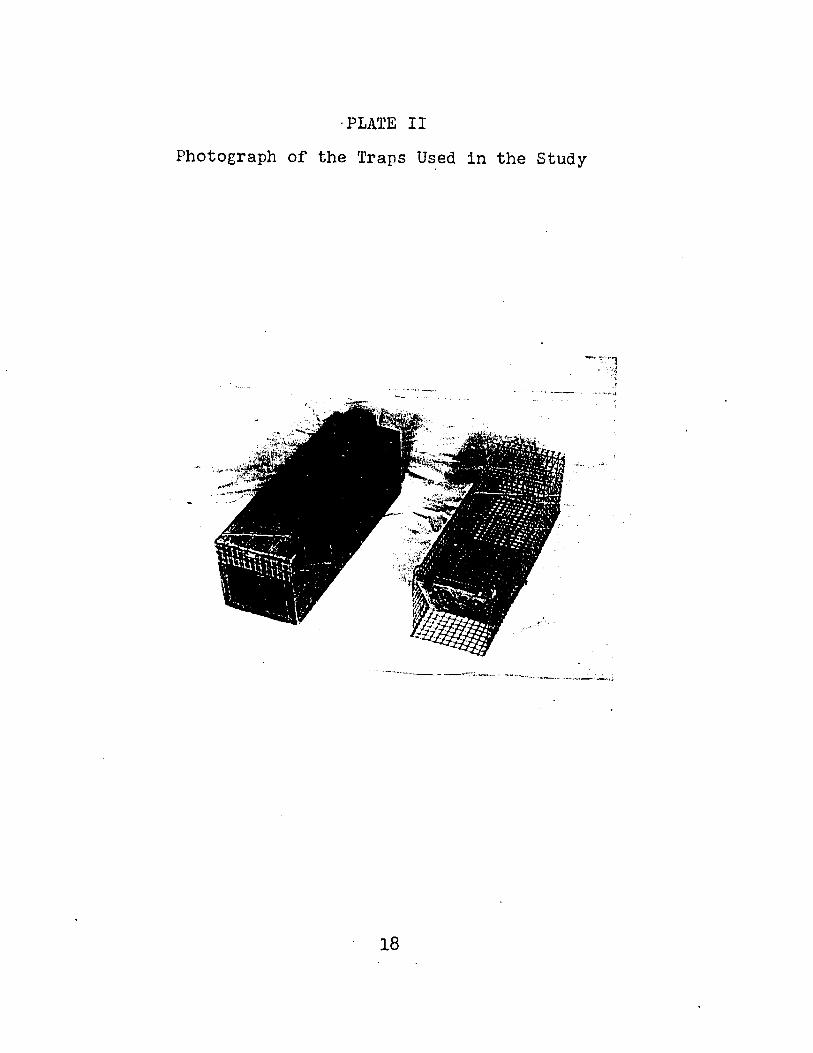
•PLATE IIPhotograph of the Traps Used in the Study-
18

another group of trap's in which the cypress was replaced with £ inch mesh wire. The free-swinging door was replaced by one that dropped into position behind the animal when the animal stepped on a treadle inside the trap. The chief drawback of the wire traps was the frequent repairs that had to be made because of damage in moving them from one plot to the other and damage by some of the larger rodents. This repair work could have been avoided by using a heavier type of mesh wire. In addition, the trap might have been improved by constructing the roof of material that would protect the animal from the rays of the sun and the heavy precipitation in this part of the United States.
The results were similar with those traps in which the door stood open and those in which the rodent pushed the door open when entering, A factor of consideration in both traps was that they permitted the capture of more than one rodent. This occurred several times during the study.
The use of bait in live-trapping experiments is sometimes criticized on the grounds that a true picture of population size, home range, and territory cannot be obtained if additional food is introduced. Bole (1939) reported that studies of Peromyscus leucopus, in which baited and unbaited quadrats were used, revealed no differences in

20the number of animals trapped. Stickel's results (19^8) differ somewhat from those of Bole in that some animals were attracted by bait. Chitty and Kempson (19^9) advocate prebaiting for small mammals. It seems logical, however, that prebaiting would help bring about the development of trap habit, which should be prevented if possible. In my preliminary observations concerning the use of bait, the number of Cryptotis parva trapped was greatly increased by the addition of bait; and the number of Sigmodon hispidus and Orvzomvs palustris trapped was also increased, but to a lesser extent. The bait used throughout this study consisted of rolled oats and peanut butter. Bait was usually placed in the traps twice a day - early in the morning and late in the afternoon. This routine was necessary because of the tremendous number of sowbugs and insects, particularly ants and crickets. Following a suggestion by Dr. 0. W. hosewall, I placed a ring of ten- per cent chlorodane powder around each trap. This procedure was highly effective against ants but had no effect on sowbugs.Weighing and marking animals
The animals were removed from the traps by placing a plastic bag over the entrance of the trap, turning the trap upside down, and blowing into the trap at the end opposite the bag. Weights were taken to the nearest tenth

21of a gram while the animals were in the bags, and then the weight of. the bag was subtracted. The rodents were released where trapped. Burt (1937) advocated leaving a trap unset for-one night following a capture. This procedure was followed by me only when the same animal had been taken in the same trap two nights in succession.
In order that the rodents could be identified when recaptured, they were marked by punching holes in the ears with a scissor-type poultry punch. The method of numbering each animal by the position of the holes did not originate with me, but is an established procedure for later identification of small mammals. This method obviously could not be used in numbering shrews. Therefore a toe- clipping method was employed. Because of the sporadic trapping of shrews and the high mortality rate of those trapped, the information gathered concerning them had little statistical significance and was therefore not analyzed.

CHAPTER IV GENERAL DISCUSSION OF ANIMALS OBSERVED
Rodents observedThe most abundant rodent on both the Kleinpeter and
University plots was Sigmodon hisnidus hisridus Say and Ord, the Cotton Rat. This is a common rodent of the southeastern United States and is found from North Carolina to Florida and westward into Louisiana. Several extensive studies have been made of the Cotton Rat (Svihla 1929» Clark 1936, Abegg 1939) Meyer and Meyer 1 9 ^ } Sealander and Walker 1955) and Odum 1955)• The usual habitat of this animal is overgrown fields, preferably broom sedge. Svihla (1929) notes that Cotton Rats are common in the cane fields and coastal marsh-. lands of Louisiana. Phillips (1936), Hamilton (19*+3)) and Sealander and Walker (1955) report distinct runways, and I made this same observation in north Louisiana and in the bluegrass section of Kentucky. In this study, although Cotton Rats were trapped in all parts of both plots, few runways were seen. The absence of runways may be explained by the fact that most of the vegetation was tall and coarse. Several nests were observed, most of them in cup-shaped depressions in the earth or in clumps of broom sedge slightly above ground level. They were crudely constructed and were lined with bits of vegetation.
The number of young in a litter of Cotton Rats22

varies from three to six, and they are able to leave the nest in five or six days (Svihla 1929). Each weighs six to eight grams at birth and is weaned when about ten days old after gaining approximately a gram per day. According to Meyer and Meyer (19^) the growth rate is constant for 100 days. They also report from laboratory studies that Cotton Rats begin breeding at *+0 to 50 days of age, when the females weigh 62 to 87 grams. Odum (1955) concludes that females may breed when approximately 60 grams in weight but are not fully mature until they reach 80 grams.Ke reports that breeding begins at two months of age and that few individuals live longer than six months.Sealander and Walker (1955) classify Sigmodon hispidus on the basis of weight as follows: juvenile, 3*5 to 11 grams;subadult, 12 to *+6 grams; and adult, *+7 or more grams. In this study I have considered all Cotton Rats weighing 60 or more grams to be mature. Although it is difficult to determine pregnancy in live-trapping work, the swollen appearance of the abdomen and mammary glands caused me to belive that several females were sexually mature at 60 grains of weight. Of a total of 17 female Cotton Rats found dead in traps or eliminated at the end of the study, four contained embryos. The litter sizes were two, four, six, and six. Each of the four pregnant females weighed more than 80 grams. In addition, a litter of six was born in one of the

2b
live traps. Clark (1936) reports that the estrous cycle averages eight days in length, with extremes of five and nine, and Calahane (19^7) states that a litter of young can be produced 27 days after copulation.
Studies have been made of Sigmodon hispidus in captivity to determine if it could be useful as a laboratory animal. I kept several of the rodents in captivity for varying lengths of time. At the end of three months they appeared to be as nervous and pugnacious as when first captured and did not hesitate to bite, even when being handed food. The four incisors are sharp and capable of inflicting a deep wound.
The rodents that ranked second and third in abundance on the plots were Reithrodontomys fulvescens aurantius (Allen), the Fulvous Harvest Mouse, and Reithrodontomys humulis humulis (Audubon and Bachman), the Eastern Harvest Mouse. Much less has been written about Harvest Mice than about Cotton Rats.
Adults of the two species of Harvest Mice mentioned above may be separated on the basis of tail length and coloration. Reithrodontomys fulvescens has a tail length of
to four inches and a gray belly, grayish-brown back, and bright fulvous sides. Reithrodontomys humulis has a tail length of 1 b/5 to 2\ inches, and is a smaller and darker mouse without the fulvous coloration. It is extremely

25difficult to determine the species of immature Harvest Mice.
Three nests apparently constructed by Harvest Mice were found on the plots. They were smaller and much more compact than those of the Cotton Rat and measured approximately three inches in diameter. The nests were located a few inches above the ground in clumps of broom sedge and were lined with fine vegetation.
Cahalane (19^7) reports that members of the genus Keithrodontomys have litters consisting of two to four young, each weighing approximately 1.13 grams at birth.Their weight is tripled in ten days, and they are weaned at two weeks of age. In five weeks they have reached the adult weight of 9*5 grams, and they may mate before attaining three months of age. Two of eight Reithrodontomys fulvescens that died in the traps were pregnant females. Their weights were 10.5 grams and 1^.5 grams, and each contained four embryos. In addition, one female of this species gave birth to a litter of three in one of the live traps. Only one female Reithrodontomys humulis examined internally was pregnant. On August 6 this female, weighing eight grams, was found dead in a trap and contained five embryos. No attempt has been made to separate immature from mature Harvest Mice in this study. With one exception all Harvest Mice collected weighed five or more grams.
Harvest Mice are not as pugnacious as Cotton Rats

26and can sometimes be handled and fed by hand without their attempting to bite. Their actions are unpredictable, however, and any sudden movement in the vicinity will cause them to become highly excited and scamper about with great speed and agility.
In addition to Cotton Rats and Harvest Rice, other rodents were collected. Only two White-footed Mice of the genus Peromvscus were taken during the study. On May 2*f, a female Peromvscus leucopus leucopus (Rafinesque) weighing 15*5 grams was trapped on the Kleinpeter plot, and on April 5 a male Peromyscus gossypinus gossypinus (Le Conte) weighing 2b grams was trapped on the University plot. The almost complete absence of any wooded areas near the plots probably accounts for the scarcity of mice of the genus Peromyscus.
Kus musculus domesticus Rutty presented a peculiar trapping pattern. From November 11 to August 26 only one House Mouse was trapped. From August 26 until the end of the study on November 25, 16 House Mice were trapped.During the course of the study a new home was constructed within 200 yards of the Kleinpeter plot, and there were negro tenant houses within 150 yards of the University plot. These were possibly the sources of the Mus populations. Twelve of this species were collected from the University plot.

Rice Rats, Oryzomys palustris texensls Allen, were collected on the University plot soon after the study began, but three months passed before they were trapped on the Kleinpeter plot. The University plot was more favorable to Rice Rats because of a large ravine that extended the entire width of one end of the plot, and it was in the vicinity of this depression that most of the captures were made. A total of 20 Rice Hats were trapped on the University plot. Thirteen were males, six were females, and the sex of one specimen was not determined. The average weight, based on the first time that each animal was trapped, was M+.71*- grams and the range was 13 to 66.5 grams. Rice Rats are chiefly nocturnal. Only one rat was trapped during the daytime hours. No nests known to be those of Rice Rats were found on the plots.
None of the females examined internally contained embryos, and therefore no information was obtained concerning litter size or weights. According to Svihla (1931)> the gestation period of Oryzomys palustris is 25 days, and the females may mate within ten hours after the birth of their young. The litter size is three to five, and the weight of the young at birth is 2.35 to **.0 grams. An adult female may produce eight to nine litters a year, and the young Rice Rats are ready to mate at 50 days of age. This is truly a prolific animal.
Other animals observedExcluding rodents the most abundant mammal trapped
was Cryptotis parva parva (Say), the Little Shrew. This species, which is widely distributed throughout the state of Louisiana (Lowery 19*+3)> was much more abundant on the Kleinpeter plot than on the University plot. On the latter plot one male specimen was collected on June 23, and no more were trapped until November 2b. On that day and the day following, 11 shrews were trapped. The complete absence followed by sudden and substantial occurrence is an odd phenomenon and is indicative at least of mass movement. Of the total of 12 shrews, ten were females and two were males. The average weight was *+.73 grams and the range was 3*5 to 5*5 grams.
Specimens of Cryptotis parva were trapped regularly on the Kleinpeter plot during late autumn and early spring, but from April 30 to August 2b no shrews were trapped.There are three possible explanations for this: the population was at a very low ebb; the population shifted into another area; the presence of other sources of food caused a lack of interest in the peanut butter and rolled oats in the live traps. It may be that shrews are not attracted by the bait itself but by the insects that accumulate at the bait. From November 11, 195*+> to May 1, 1955? 37 shrews were trapped, and from August 2*+ to November 25, 1955? H shrews were trapped. Thus a total of *f8 shrews were

trapped on the plot. Of this total, 32 were females, 11 were males, and the sex was not determined in the case of five. The Little Shrew is not entirely nocturnal. During one period when the traps were being operated on a 21+-hour basis 2k shrews were taken at night and six were trapped during the day.
Little information was gained concerning Cryptotis parva for the following reasons: over 60 per cent of theshrews were dead when removed from the live traps so that little recapture data could be obtained; the animal is difficult to mark for later identification; and few were captured more than once. Attempts to observe the Little Shrew in captivity were unsuccessful because of the high mortality rate. Whem more than one shrew was placed in the same observation cage, fighting erupted. Soon one shrew would be killed and devoured by the victor.
One male Blarina brevicauda minima Lowery, weighing six grams, was found dead in a trap on the University plot on June 23. Miscellaneous animals taken in the live traps included the following: two Field Sparrows (Spizellapusilla); a White-throated Sparrow (Zonotrichia albicollis) two Yellow-breasted Chats (Icteria virens); a Kentucky Warbler (Oporornis formosus); a Common Yellowthroat (Geothlypis trichas); a Carolina Wren (Thryothorus ludovicianus); a Common Opposum (Didelphis virginiana);

an Eastern Cottontail Rabbit (Sylvilagus floridanus); two Blacksnakes (Coluber constrictor); a Hog-nosed Snake (Heterodon platyrhinos); a Large-headed Skink (Eumeces laticeps); and a Southern Toad (Bufo terrestris). Rabbits and quail were frequently observed on the plots. Animals seen that could be considered rodent predators were Redtailed Hawks (Buteo .lamaicensls), Sparrow Hawks (Falco sparverius). Barred Owls (Strix varia). Loggerhead Shrikes (Lanius ludovicianus), and several species of nonpoisonous snakes. Stomach analyses were not made and therefore the exact foods of the animals on the plots were not determined.

CHAPTER V DISCUSSION OF INFORMATION OBTAINED
Population compositionOne of the most interesting aspects of the study
was the population composition. Preliminary trapping revealed the major species present on the two plots, but it was only by periodic trapping and final compilation of data that a lucid picture was obtained of the relative number of each species.
The size of the small-mammal population at the plot at Kleinpeter greatly exceded that of the University plot, even during the time when the former plot included .7^ acres compared to the 1.67 acres in the University plot. A larger population was anticipated on the Kleinpeter plot because of the vegetation, location, and lack of isolating factors. Broom sedge made up a large part of the vegetation at Kleinpeter, and it is known that Sigmodon hispidus populations tend to be high in this type of habitat. The University plot had low areas that were sometimes flooded during heavy rains. As previously mentioned the University plot was bordered on three sides by cultivated land and pasture so that the small-mammal population was isolated to some extent.
On the basis of initial captures, there was a greater number of Sigmodon hispidus than of any other specie

32On the Kleinpeter plot 119 Sigmodon hispidus. 80 Reithrodontomys fulvescens. and 21 Reithrodontomys humulis were trapped, and on the University plot 75 Sigmodon hispidus. 36 Reithrodontomys fulvescens. and three Reithrodontomys humulis were trapped. The total captures of each species and the percentage that each species made up of the total small-mammal captures were determined for each of the plots. The results were as follows, with the Kleinpeter plot captures listed first: Sigmodon hispidusA 6 A l A per cent), 223 (5^.8 per cent); Reithrodontomys fulvescens 3 8^ (3 5 .6 per cent), 107 (26.3 per cent); Reithrodontomys humulis 178 (16.5 per cent), seven (1.7 per cent); Cryptotis parva 55 (5.1 per cent), 12 (2.9 per cent); Oryzomys palustris ten (.9 per cent), *+5 (11.1 per cent); and Mus musculus five (.5 per cent), 13 (3*2 per cent). This information is summarized in Tables II through V. Densities are discussed later.
Thus it is seen that Sigmodon hispidus ranked first on both plots in number present and in number of recaptures. Reithrodontomys fulvescens was the second most common animal trapped. At times on both plots — February to May on the Kleinpeter plot and March and May on the University plot — the Fulvous Harvest Mouse recaptures, and also initial captures during certain periods, exceded those of the Cotton Rat. Re ithr od ont omy s humulis ranked

TABLE IITotal Captures of each Species During each Trapping Period at Kleinpeter
with the Percentage of Total Capture in ParenthesesTrapping Period Siemodon
hispidusR. fulvescens R. humulis Orvzomvs
palustrisCryptotis
parvaMus
musculusTotal
Nov 8 - Nov 13 1*1 (75-9) 0 0 0 13 (21*.1 ) 0 5k
Jan 9 - Jan 22 1 3 0(5 2.6 ) 59(23.9) 1*7(19.0) 0 11 A.5) 0 2k7
Feb Ik -Feb 27 k8 (2 8.7 ) 80(1*7.9) 3 8 (2 2 .8 ) 0 1 (0 .6 ) 0 167Mar I1* -Kar 25 kl (2*+A) 95(56.5) 2 (11*. 3) 1 (0 .6 ) 6 (3.6) 1 (0 .6 ) 168Apr 20 - May 3 86 AO.O) 8 2 (3 8 .1 ) 29(13-5) 5(2.3) 13 (6 .1 ) 0 215Kay 20 -June 3 38 0*1.3) 31(33.7) 22(23.9) 1 (1 .1 ) 0 0 92June29 -July 8 15 (39.5) 16(1*2.1) 7(18 A) 0 • 0 0 38Aug k - Aug 12 29 (6 7 A) 7(16.3) 7(16.3) 0 0 0 **3Aug2*f - Sept 1 10 (1*1.7) 2 (8 .3 ) 3(12.5) 0 8 (33.3) 1 A.2) 2i*Oct 9 - Oct 10 0 1(33 A) 0 0 1 (33-3) 1(33-3) 3Nov2l+ - Nov 25 8 (29.6) 11(1*0.8) 1 (3*7) 3(11.1) 2 (7 A) 2 (7 A) 27
Total kk6 0*1.i*) 381*(3 5 .6 ) 1 7 8(1 6 .5) 10 (0.9) 55 (5.1) 5 (0.5) 1078

TABLE IIITotal Captures of each Species During each Trapping Period on the University Plot
with the Percentage of Total Capture in ParenthesesTrapping Period Sigmodon
hispidusR. fulvescens R. humulis Oryzomys
palustrisCryptotis Mus
parva muscuiusTotal
Jan 25 - Feb 5 28(62.2) 12 (26.7) 3 (6.7) 2 0*A) 0 0 **5Feb 28 - Mar11 1^(2 9 .8 ) 25 (53.2) 3 (6A) 5 (10.6) 0 0 b?
Apr b - Apr 19 67(68.b) 21 (21.if) 1 (1.0) 9 (9.2) 0 0 98May 5 - May l*f 19(39.6) 26 (5^.2) 0 3 (6.2) 0 0 b8
Junel5- June28 63(6if.3) 11 (11.2) 0 23 (23.5) 1 (1.0) 0 98Julyl9- July2*f 7(77.8) 2 (22.2) 0 0 0 0 9Aug 15 - Aug23 8(88.9) 0 0 1 (11.1) 0 0 9Septl8 - Oct 5 70*1-2) ‘ 7 0*1.2) 0 0 0 3 (17.6) 17Oct 9 - Oct 10 1(20.0) 1 (20.0) 0 1 (20.0) 0 2 o
•o 5Nov 2b- Nov 25 9(29.0) 2 (6.5) 0 1 (3-2) 11(35.5) 8 (2 5 .8 ) 31
Total 223(5^.8) 107 (26.3) 7 (1.7) ■*+5 (11.1) 12(2.9) 13 (3.2) b07
Co-r

TABLE IVSummary of Sigmodon and Reithrodontomys Trapping on the Kleinpeter Plot ______ Showing Initial Captures and Recaptures by Trapping Periods______
Trapping PeriodSigmodon hisnidus Initial Recap- Total Capture ture
Reithrodontomys Initial Recap- Capture ture
fulvescensTotal
R.InitialCapture
humulisRecapture
Total
Nov8 - Novl3(6)* 11 30 bl 0 0 0 0 0 0
Jan9 - Jan2 2 (l*+) 9 121 130 11 1*8 59 6 1*1 b?
Feblb- Feb27(llO 1 b7 b8 9 71 80 2 36 38Marl1*- Mar25(12) 2b 17 bl 28 67 95 3 21 2l*Apr20- May 3(12) 29 57 86 7 75 82 b 25 29May20- June3(12) 13 25 38 6 25 31 2 20 22
June29-July8 (6 ) 11 i* 15 b 12 16 1 6 7Aug 1*- Aug12 (9) 6 23 29 2 5 7 2 5 7Aug2^- Septl (8 ) 7 3 10 2 0 2 1 2 3Oct 9- Oct 10(2) 0 0 0 1 0 1 0 0 0
Nov21f -Nov 25(2) 8 0 8 10 1 11 0 1 1
Total 119 32 7 Mf6 80 301* 381* 21 157 178
* The numbers in parentheses are the actual number of trapping days in each period.

TABLE VSummary of Sigmodon and Reithrodontomys Trapping on the University Plot
______________ Showing Initial Captures and Recaptures by Training Periods_______________Sigmodon hispidus Reithrodontomys fulvescens R. humulis
Trapping Period Initial Recap- Total Initial Recap- Total Initial Recap- TotalCapture ture Capture ture Capture tureJan25 - Feb5(12)* 9 19 28 8 b 12 2 1 3Feb28 - Mar11(12) 7 7 lb 9 16 25 1 2 3Apr b - Apr19(16) 19 b8 67 if 17 21 0 1 1
May 5 - MaylU- (9 ) 15 19 V 22 26 0 0 0
Junel5-June28(10) 21 b2 63 2 9 11 0 0 0
Julyl9-July2lf (5) 0 7 7 0 2 2 0 0 0
Aug 15- Aug23 (7) If b 8 0 0 0 0 0 0
Septl8 - 0ct5 (7) 1 6 7 6 1 7 0 0 0
Oct 9 - OctlO (2) 1 0 1 1 0 1 0 0 0
Nov 2b -Nov25 (2) 9 0 9 2 0 2 0 0 0
Total 75
i00■a
1
223 36 71 107 3 ~ b ~ ~ 7* The numbers in parentheses are the actual number of trapping days in each period.
u>ON

third in number of captures at Kleinpeter, but the total was less than half that of Heithrodontomys fulvescens*Only seven captures of Reithrodontomys humulis were made on the University plot during the study. Trapping of Orvzomvs palustris varied with weather conditions. Heavy rains caused flooding of low areas and, in so doing, forced the rodents to higher ground. It was under such flooded conditions that most of the captures of Rice Rats occurred. The semiaquatic conditions that prevailed at times on the University plot were favorable to Rice Rats, and they ranked third in-number of captures. Few House Kice were trapped; they became numerous only near the end of the study.Time of activity and frequency of recapture
During the winter and spring some information concerning time of activity was obtained, but accumulation of this type of information ceased when warmer weather and an accompanying higher mortality rate necessitated leaving the traps unset through the greater part of the day. The following trapping results were obtained during that part of the year when the traps were examined and reset at 8 a.m. and if p.m. During a 2*f-day period on the University plot, 15 Sigmodon hispidus and one Reithrodontomys fulvescens were in the traps at *f p.m., and 27 Sigmodon hispidus and 35 Reithrodontomys fulvescens were in the traps at 8 p.m.

At Kleinpeter, during a ^O-day period, 80 Sigmodon hispidus and 22 Reithrodontomys fulvescens were trapped during the day, and 139 Sigmodon hispidus and 212 Reithrodontomys fulvescens were in the traps at 8 a.m.Thus Cotton Rats are active both day and night, whereas Fulvous Harvest Mice are active primarily at night.
An animal is said to have formed the trap habit when it returns time after time to the same trap or nearby trap in order to obtain food or shelter, as the case may be. Trap habit is difficult to determine. One female Cotton Rat was trapped 36 times during the study, but seldom appeared in the same trap on two consecutive days. Tables VI and VII give the frequency of recapture of Sigmodon hispidus, Reithrodontomys fulvescens and Reithrodontomys humulis on the two plots.Weight range and growth rate
Whenever conditions permitted, the trapped animals were weighed to the nearest half gram. Tables VIII, IX, and X give the weight range and average weights of all Sigmodon and Reithrodontomys taken throughout the study.The Cotton Rats varied greatly in weight, the range of all specimens trapped being from 11 to 223 grams, with an average weight of 79»1 grams. The average weight of adults was 106.6 grams with a range of 60 to 223 grams. The average weight of adult males, 1 0 7 .5 grams, was slightly more than

TABLE VI.frequency of Recapture on the Kleinpeter PlotNumber of Times
Caught
12I■5678910
II 12 l1*1516 171920 21 22303132 36
Total Captures
Male Female Total fulvescens Male Female Total Male
humulisFemale Total
Total
37 20 57 18 9 27 3 2 5 892 9 11 6 2 8 2 0 2 216 12 18 5 3 8 0 1 1 270 7 7 5 1 6 2 0 2 156 3 9 l 2 3 0 0 0 122 1 3 2 1 3 2 1 3 92 0 2 ** 2 6 0 0 0
y
80 0 0 3 3 6 0 0 0 60 3 3 2 1 3 1 0 1 70 0 0 1 0 1 0 1 1 20 3 3 1 0 1 0 1 1 50 0 0 1 2 3 0 0 0
y
30 0 0 2 0 2 0 1 1 30 0 0 0 0 0 0 1 1 1 '1 0 1 0 0 0 0 0 0 10 0 0 0 1 1 0 0 0 10 0 0 0 0 0 1 0 1 10 0 0 1 0 1 ■ 0 0 0 10 1 1 0 1 1 0 0 0 22 0 2 0 0 0 0 0 0 20 0 0 0 0 0 1 0 1 11 0 1 0 0 0 0 0 0 10 0 0 0 0 0 1 0 1 10 1 1 0 0 0 0 0 0 1’ — — — — — •- — - - — — -. — — — . . . . . . . . . B» . . .206 2b0 233 151 38** 117 61 178 1008

TABLE VIIFrequency of Recapture on the University Plot
Number of Times Sigmodon hispidus Reithrodontomys Reithrod ontomysCaught fulvescens humulls Total
Male Female Total Male Female Total Male Female Total1 19 19 38 13 b 20* 582 5 5 10 b if 1 1 2 163 b 2 6 2 b 6 1 1 13b 5 5 2 2 75 5 2 7 1 1 86 1 2 3 37 1 1 18 1 1 19 1 1 1 1 2
10111213 1 1 1 1 2Ilf151617 1 1 1181920 1 1 126 1 1 1
Total Captures 79 lMf 223 36 68 107* 2 5 7 337* The Reitbrodontomys fulvescens total includes three mice for which the sex was not determined.

TABLE VIIIWeight Range and Average Weight of all Slgmodon hispidus Taken Throughout the Study-
Based on the Initial Weight Taken*
Kleinpeter Plot University Plot TotalNumber Average Weight Number Average Weight Number Average WeightTrapped in Grams Trapped in Grams Trapped in Grams
Immature Kales 26 29.8(16.0-55.0) 9 ^•5.6(19.5-55.0) 35 33.9(16.0-55.0)Adult Males 28 108.3(65.5-16^.5) 23 1 0 6.U-(6 3 .0-1 9 1.0 ) 51 107.5(63.0-191.0)Total Males 5^ 70.5(16.0-16^.5) 32 89.3(19.5-191.0) 86 77*5(16.0-191.0)Immature Females 25 31.^(11.0-53.5) 9 ^0.2(26.0-55.5) 3^ 33.7(11.0-55.5)Adult Females 33 1 0 0.1 (6 0 .0-1 7 1.0 ) 29 1 1 3.3 (6 1 .5-2 2 3.0 ) 62 1 0 6.3 (6 0 .0-2 2 3.0 )Total Females 58 7 0 .5 (1 1 .0-1 7 1.0 ) 38 9 6 .0 (2 6 .0-2 2 3-0 ) 96 8 0 .6 (1 1 .0-2 2 3.0 )Total Immatures 51 30.6(11.0-55.0) 18 1+2.9(19.5-55.5) 69 33.8(11.0-55.5)Total Adults 61 1 0 3.9 (6 0 .0-1 7 1.0 ) 52 1 1 0.3 (6 1 .5-2 2 3.0 ) 113 1 0 6.8 (6 0 .0-2 2 3.0 )Total 112 7 0 .5 (1 1 .0-1 7 1.0 ) 70 93.0(19.5-223.0) 182 7 9 .1 (1 1 .0-2 2 3.0 )* The weights of seven animals on the Kleinpeter plot and five animals on the
University plot were not determined.
-rH

TABLE IXWeight Range and Average Weight of all Reithrodontomys fulvescens Taken Throughout the
Study Based on the Initial Weight Taken*
Kleinpeter Plot University Plot TotalNumberTrapped
Average Weight in Grams
NumberTrapped
Average Weight in Grams
NumberTrapped
Average Weight in Grams
Males 50 9.50*.O-13.O) 19 10.0(5.5-11.5) 69 9.6 (i+.0-13.0)
Females 27 9.5(5.0-11*.5) 12 10.0(7.5-13.0) 39 9.6(5.0-11*.5)
Total 77 9.5(**.0-lif. 5) 31 10.0(5.5-13.0) 108 9.6(lf.0-l1+.5)
* The weights of three animals on the Kleinpeter plot and five animals on theUniversity plot were not determined.
-rro
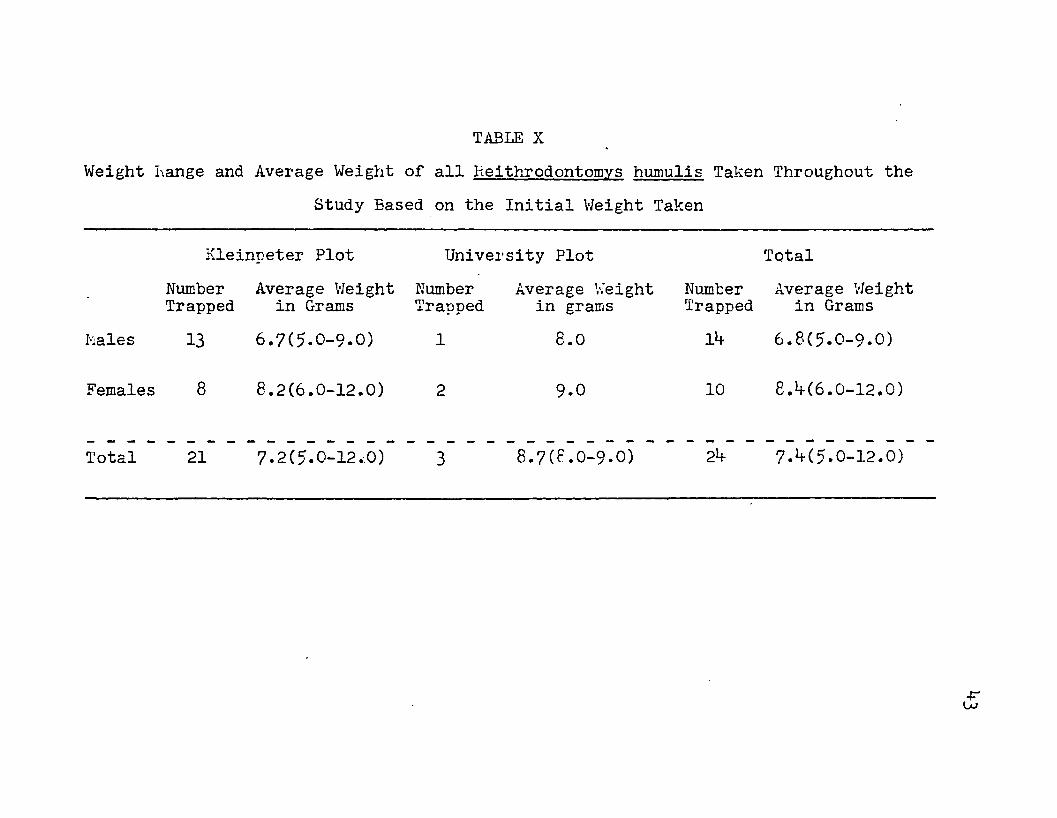
TABLE XWeight Lange and Average Weight of all Reithrodontomys humulis Taken Throughout the
Study Based on the Initial Weight Taken
Kleinpeter Plot University Plot TotalNumberTrapped
Average Weight in Grams
NumberTrapped
Average Weight in grams
NumberTrapped
Average Weight in Grams
Males 13 6.7(5.0-9.0) 1 8.0 l*f 6.8(5.0-9.0)
Females 8 8.2(6.0-12.0) 2 9.0 10 8.if (6.0-12.0)
Total 21 7.2(5.0-12.0) 3 8.7(f.0-9.0) 2*f 7A(5.0-12.0)
-rL*J

Mfthat of the females, which was 106.3 grams. The weight of Cotton Rats sometimes changes as much as six grams over a 2*+-hour period, particularly during the hot summer months. Unfortunately not enough animals were trapped over a long period of time to give a definite growth rate pattern. On the basis of a small amount of data, however, the following information was obtained. Cotton Rats begin entering the traps at approximately 20 grams of weight, and they gain about 20 grams a month until they reach 60 grams.After that the growth rate drops to approximately 12 grams a month until they reach the weight of 80 grams.
The average weight of 108 Reithrodontomys fulvescens was 9*0 grams and the weight range was *+.0 to l*+.5 grams. The average weight of 2b Reithrodontomys humulis was 7 »b grams, which was more than two grams lighter than the average weight of Reithrodontomys fulvescens. The weight range was 5*0 to 12.0 grams. The weights of the two species of Reithrodontomys seldom fluctuated more than a gram a day.Population age and breeding season
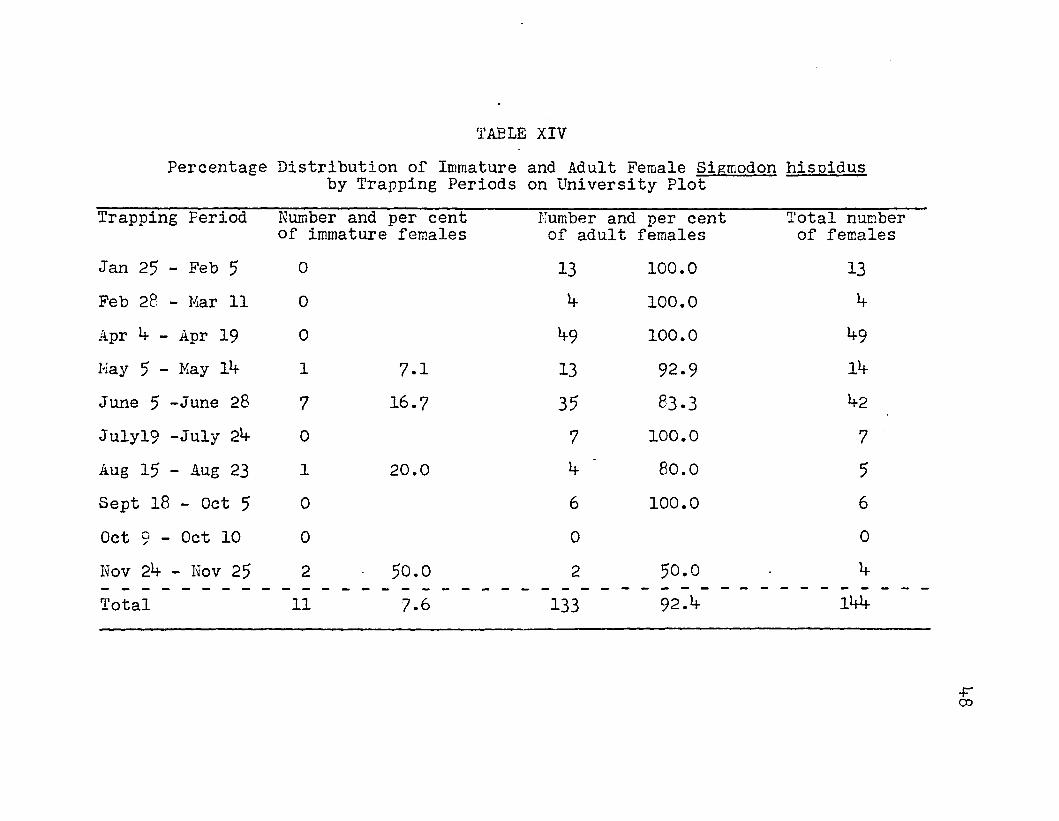
The only species in which an attempt v/as made to determine the number of immature and adult animals was Sigmodon hispidus. As previously stated all Cotton Rats weighing 60 or more grams were considered as adults. Tables XI through XIV give the percentage distribution of immature arid adult

TABLE XIPercentage Distribution of Immature and Adult Male Sigmodon hispidus
by Trapping Periods on Kleinpeter PlotTrapping Period Number and Fer cent
of Immature MalesNumber and
of Adultper cent Males
Total Number of Males
Nov 8 - Nov 13 19 79.2 5 20.8 2*fJan 9 - Jan 22 3 ^•3 66 95.7 69Feb Ilf - Feb 27 0 27 10C.0 27Mar 1*+ - Mar 25 0 15 100.0 15Apr 20 - May 3 30 71.^ 12 2 8 .6 *f2May 20 - June 3 5 71.^ 2 2 8 .6 7June 29- July 8 ' 1 20.0 V 80.0 5Aug If - Aug 12 1 16.7 5 83.3 6Aug 2b- Sept 1 if 80.0 l 20.0 5Oct 9 - Oct 10 0 0 0Nov 2*f - Nov 25 If 66.7 2 33.3 6Total 67 32.5 139 6 7.5 206
-Fvn

TABLE XIIPercentage Distribution of Immature and Adult Female Sigmodon hispidus
by Trapping Periods on Kleinpeter PlotTrapping Period Number and
of Immatureper cent Females
Number and of Mature
per cent Females
Total Number of Females
Nov 8 - Nov 13 5 29. 12 7 0 .6 17Jan 9 - Jan 22 0 61 100.0 61Feb l f - Feb 27 0 21 100.0 21Mar l5* - Mar 25 0 26 100.0 26Apr 20 - May 3 15 3^.1 29 65.9 MfMay 20 - June 3 21 67.7 10 32.3 31June 29- July 8 6 60.0 If VO.O 10Aug ’+ - Aug 12 10 ^3.5 13 56.5 23Aug 2b - Sept 1 2 ifO.O 3 60.0 5Oct 9 - Oct 10 0 0 0
Nov 2 f - Nov 25 2 100.0 0 2
Total 61 2 5 - 179 7^.6 2*f0

TAELE XIIIPercentage Distribution of Immature and Adult Male Sigmodon hisridus
by Trapping Periods on University PlotTrapping Period Number and per cent
of immature malesNumber and
of adultper cent males
Total number of males
Jan 25 - Feb 5 1 6.7 lb 93.3 15Feb 28 - Mar 11 3 3 0 . 0 7 7 0 . 0 10
Apr b - Apr 19 0 18 1 0 0 .0 18
May 5 - May l1* 0 5 1 0 0 .0 5June 5 -June 28 5 2 3 .8 16 7 6 .2 21
July19 -July 2b 0 0 0
Aug 15 - Aug 23 1 33.3 2 66.7 3Sept 18 - Oct 5 0 1 1 0 0 .0 1
Oct 9 - Oct 10 0 1 1 0 0 .0 1
Nov 2b - Nov 25 b 8 0 .0 1 2 0 .0 5Total lb 17.7 65 82.3 79
-r
TAELE XIVPercentage Distribution of Immature and Adult Female Sigmodon hisnidus
by Trapping Periods on University PlotTrapping Period Number and
of immatureper cent females
Number and of adult
per cent females
Total number of females
Jan 25 - Feb 5 0 13 100.0 13Feb 28 - Mar 11 0 b 100.0 b
Apr - Apr 19 0 b9 100.0 b9
May 5 - May l*f 1 7.1 13 92.9 lb
June 5 -June 28 7 16.7 35 83.3 b2
Julyl9 -July 2b 0 7 100.0 7
Aug 15 - Aug 23 1 20.0 if 80.0 5Sept 18 - Oct 5 0 6 100.0 6Oct 9 - Oct 10 0 0 0Nov 2b - Nov 25 2 5 0 .0 2 5 0 .0 ifTotal 11 7.6 133 92 A lbb
-rCO

1*9Cotton Hats by sex and by trapping periods for each of the plots. On the Kleinpeter plot 67 of 206 males were immature, and 61 of 2*f0 females were immature. Only three immature specimens were trapped between January 9 and April 20, and only 13 immature specimens v/ere taken from August 2If to the end of the study in November. Thus most of the immature Cotton Rats were trapped between April 20 and August 12. The single trapping period in which the greatest number of captures of immature specimens occurred was the period from April 20 to May 3, during which time **5 Cotton Hats weighing less than 60 grams were taken.
A much smaller percentage of immature Cotton Rats were trapped on the University plot. Fourteen of 79 males were immature, and 11 of l^1* females were immature. Of a total of 25 immature rats 15 were trapped between May 5 and August 23.
From the information above it appears that a few Cotton Rats in this section of Louisiana breed throughout the year, that most of the reproduction occurs from April to September, and that the peak in reproduction occurs in late spring.Sex ratios
There was considerable variation in the sex ratios of rodents on the plots. Tables XV through XX give the percentage distribution of Sigmodon hispidus and the two

TABLE XVPercentage Distribution of Sigmodon hisnidus by Sex and Trapping Period
on the Kleinpeter PlotTrapping Period Number
of MalesPer cent Males
Number of Females
Per cent Females
Total
Nov8 - Nov 13(6 days) 2b 58.5 17 bl.5 l+lJan9 - Jan 22(lb days) 69 53.1 61 ^6.9 130Febl*+- Feb 27(lb days) 27 56.2 21 -3.8 be
Marl^ -Mar 25(12 days) 15 36.6 26 62.b bl
Apr20 - May 3(12 days) b2 bB.S ¥+ 51.2 86May20 - June3(12 days) 7 18 A 31 81.6 38Jun29- July 8(6 days) 5 33.3 10 66.7 15Aug ^ - Augl2(9 days) 6 20.7 23 79.3 29Aug21f- Sept 1(8 days) 5- 5 0 .0 5 5 0 .0 10Oct 9 - 0ctl0(2 days) 0 0 0Nov21+ - Nov25(2 days) 6 75.0 2 25.0 8Total 206 1+6.2 2^0 53.8 ¥+6

TAELE XVIPercentage Distribution of Sigmodon hispidus \>y Sex and Trapping Period
on the University PlotTrapping Period Number
of MalesPer cent
MalesNumber
of FemalesPer cent Females
Total
Jan 25 - Feb 5(12 days) 15 53.6 13 b6.b 28
Feb 28 - Mar 11(12 days) 10 71.:b b 2 8 .6 lb
Apr ^ - Apr 19(16 days) 18 26.9 b9 73.1 67May 5 - May 1^(9 days) 5 26.3 lb 73.7 19Junel5 -June 28(10 days) 21 33.3 b2 66.7 63July 19 -July 2*f(5 days) 0 7 100.0 7Aug 15 - Aug 23(7 days) 3 37.5 5 62.5 8Sept 18 - Oct 5(7 days) 1 1^.3 6 85.7 7Oct 9 - Oct 10(2 days) 1 100.0 0 1Nov 2b - Nov 25(2 days) 5 • 55.6 tf V + A 9Total 79 35.^ Ibb 6^.6 223

TABLE AVIIPercentage Distribution of Beithrodontomys fulvescens by Sex and Trapping Period
on the Kleinpeter PlotTrapping Period Number
of MalesPer cent
MalesNumber
of FemalesPer cent Females
Total
Nov 8 - Nov 13(6 days) 0 0 0Jan 9 - Jan 22(l*f days) 28 V7.5 31 52.5 59Feb l*f - Feb 27(l*f days) Mf 55.0 36 if 5-0 802viar l*f - Mar 26(12 days) 71 7b.7 2b 25.3 95Apr 20 - May 3(12 days) >+0 b8.8 b2 51.2 82
May 20 - June 3(12 days) 22 71.0 9 29.0 31June29 - July 8(6 days) 12 75.0 if 25.0 16Aug b - Aug 12(9 days) 7 100.0 0 7Aug 2b- - Sept 1(8 days) 1 5 0 .0 1 5 0 .0 2Oct 9 - Oct 10(2 days) 1 100.0 0 1Nov 2b - Nov 25(2 days) 7 6 3 .6 b 3 6 A 11Total 233 60.7 151 39.3 38b
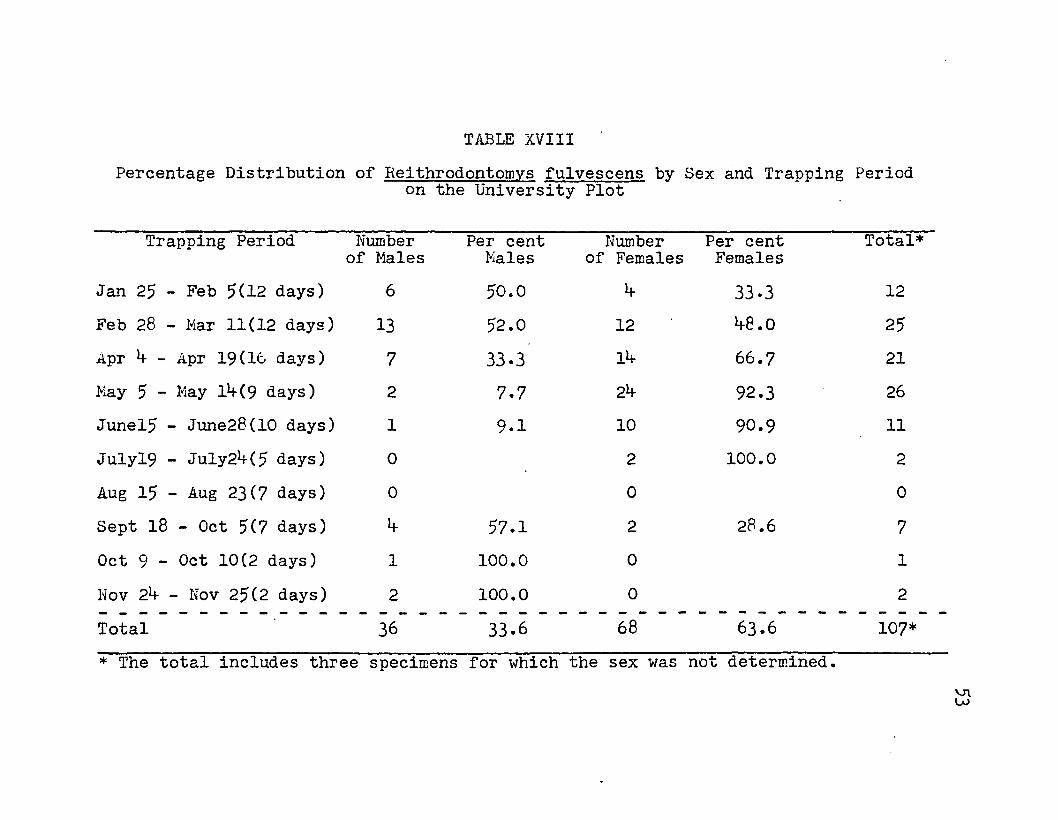
TABLE XVIIIPercentage Distribution of Reithrodontomys fulvescens by Sex and Trapping Period
on the University Plot
Trapping Period Number of Males
Per cent Males
Number of Females
Per cent Females
Total*
Jan 25 - Feb 5(12 days) 6 5 0 .0 1+ 33.3 12Feb 28 - Mar 11(12 days) 13 52.0 12 bB.O 25Apr b - Apr 19(16 days) 7 33.3 1*+ 6 6 .7 21May 5 - May 1^(9 days) 2 7-7 2b 92.3 26Junel5 - June28(10 days) 1 9*1 10 90.9 11Julyl9 - July2V(5 days) 0 2 100.0 2Aug 15 - Aug 23(7 days) 0 0 0Sept 18 - Oct 5(7 days) 1+ 57.1 2 2 8 .6 7Oct 9 - Oct 10(2 days) 1 100.0 0 1Nov 2b - Nov 25(2 days) 2 100.0 0 2Total 36 33.6 68 6 3 .6 107** The total includes three specimens for which the sex was not determined.

TABLE XIXPercentage Distribution of Reithrodontomys humulis by Sex and Trapping Period
on the Kleinpeter PlotTrapping Period Number
of MalesPer cent
MalesNumber
of FemalesPer cent Females
Total
Nov 8 - Nov 13(6 days) 0 0 0Jan 9 - Jan 22(1*+ days) 26 55.3 21 bb.7 b7
Feb l1* - Feb 27(1*+ days) 38 100.0 0 38Mar 1^ - Mar 26(12 days) 22 91.7 2 8.3 2b
Apr 20 - May 3(12 days) 17 58.6 12 bl.b 29May 20 - June 3(12 days) 8 36.^ lb 6 3 .6 22June 29 -July 18(6 days) 3 ^2.9 b 57.1 7Aug b - Aug 12(9 days) 1 1^.3 6 85.7 7Aug 2b - Sept 1(8 days) 2 66.7 1 33-3 3Oct 9 - Oct 10(2 days) 0 0 0Nov 2b - Nov 25(2 days) 0 1 100.0 1Total 117 6 5.7 61 3 ^ .3 178

TABLE XXPercentage Distribution of Reithrodontomys humulis by Sex and Trapping Period
on the University PlotTrapping Period Number
of MalesPer cent
MalesNumber
of FemalesPer cent Females
Total
Jan 25 - Feb 5(12 days) 2 6 6 .7 1 33.3 3Feb 28 - Mar 11(12 days) 0 ' 3 1 0 0 .0 3Apr •’+ - Apr 19(16 days) 0 1 1 0 0 .0 1
May 5 - hay l*f(9 days) 0 0 0
June 15 -June 28(10 days) 0 0 0
July 19 -July 2 M 5 days) 0 0 0
Aug 15 - Aug 23(7 days) 0 0 0
Sept 18 - Oct 5(7 days) 0 0 0
Oct 9 - Oct 10(2 days) 0 0 • 0
Nov 2*+ - Nov 25(2 days) 0 0 0
Total 2 2 8 .6 5 7 1 . 7
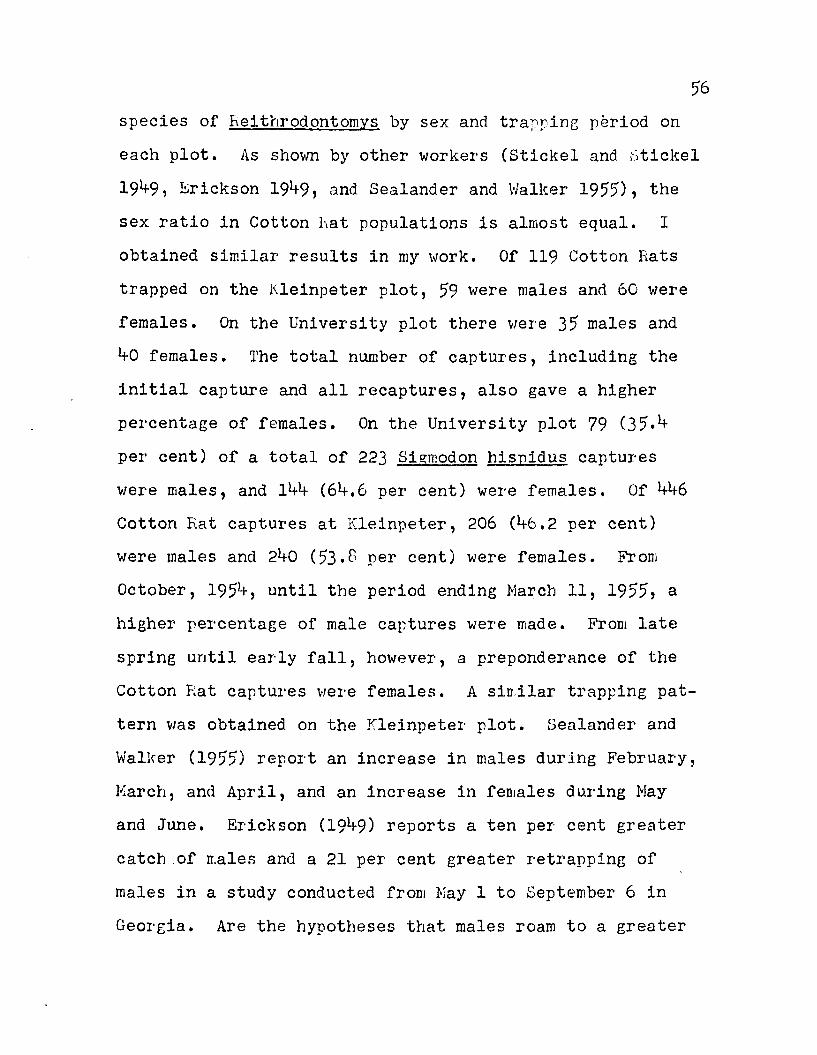
species of Reithrodontomys by sex and trapping period on each plot. As shown by other workers (Stickel and Stickel 19^9, Erickson 19^9> and Sealander and Walker 1955)? the sex ratio in Cotton Rat populations is almost equal. I obtained similar results in my work. Of 119 Cotton Rats trapped on the Kleinpeter plot, 59 were males and 60 were females. On the University plot there were 35 males and *+0 females. The total number of captures, including the initial capture and all recaptures, also gave a higher percentage of females. On the University plot 79 (35**+ per cent) of a total of 223 Sigmodon hisnidus captures were males, and lMf (6^.6 per cent) were females. Of M+6 Cotton Rat captures at Kleinpeter, 206 (bt.2 per cent) were males and 2^0 (53*$ per cent) were females. From October, 195*+5 until the period ending March 11, 1955> a higher percentage of male captures were made. From late spring until early fall, however, a preponderance of the Cotton Rat captures were females. A similar trapping pattern was obtained on the Kleinpeter plot. Sealander and Walker (1955) report an increase in males during February, March, and April, and an increase in females during May and June. Erickson (19*+9) reports a ten per cent greater catch of males and a 21 per cent greater retrapping of males in a study conducted from May 1 to September 6 in Georgia. Are the hypotheses that males roam to a greater

extent and that females are restricted in their movements during the season of reproduction correct? The information obtained by my trapping does not agree with this. Isthe female not more active during that period when she isproviding nourishment for herself and her young? And in this greater activity is she not more susceptible to trapping than the male? These are factors worthy of consideration in sex ratio studies.
The sex ratio of Heithrodontomys fulvescens « based on initial captures, was 65.8:3^.2 on the Kleinpeter plot and 60.6:39.^ on the University plot. Based on total captures, however, the sex ratio on the Kleinpeter plot was 71.8:28.2 and on the other plot it was 3^.6:65.1+. Thefallacy of basing sex ratios on total captures may befurther pointed out by noting that the greatest number of times any male Harvest Mouse was trapped was nine, whereas one female Harvest Mouse was trapped 12 times and another was taken 26 times. The other small mammals were not trapped in sufficient numbers to consider the sex ratios. Population density
The population size of each species varies from locality to locality, from season to season, and from year to year. The variation is caused by several factors such as disease, predators, the abundance of food, and climatic conditions. There is no standardized method of interpreting

recapture information, so that tv/o workers using the same recapture data may arrive at population density figures quite dissimilar. The area around the perimeter of quadrats presents problems in interpretation. The addition of rims, or buffer zones, has been used in density calculation by some workers (Dice 1938? Burt 19li-0, Blair 19*+1> and Stickel 19^6). Most population studies are based on the assumption that all animals on the plot will eventually appear in the traps. As mentioned previously, Southern (1955) has pointed out the existence of a hierarchy among certain rodents in which some members of the population prevent other members from entering the traps. If this is true of all rodent populations a new method must be devised to obtain accurate density data.
For comparative purposes two methods have been used in determining density in this study. The results of these two methods may be compared by observing Tables XXI through XXIV. In the first method the daily densities per acre, based on the total captures of each species during each period divided by the number of days in the period, were determined. This method is subject to considerable error for the following reasons: many animals are trapped onlyone or two days during the period while others are trapped almost every day; some animals after being trapped several times do not appear in the traps again for several days or

TABLE XXIAverage Daily Density Per A.cre on the Kleinpeter Plot Eased on the Total Number of
each Species Trapped Divided by the Number of Days in each Trapping Period*Trapping Period Sigmodon
hispidusReithrodontomys
fulvescensReithrodontomys
humulisTotal of all small
mammalsNov 8 - Nov 13 ^.73 0 0 7.66Jan 9 - Jan 22 6.85 5.01 ^.05 16.99Feb l b - Feb 27 3 ^ 7 6.57 2.80 12.93Mar I1*- Mar 25 .90 2.57 .67 ^.36Apr 20 - May 3 2.12 2.2 7 HCO• 5.70May 20- June 3 1.06 .8 7 .61 2.57June29- July 8 .81* 1.90 .3 9 2.12Aug If - Aug 12 1.08 .26 .2 6 1.60Aug2*f - Sept 1 .b2 .08 .1 3 1.01
2.39 2.06 l.C-8 5.99* These averages are based only on the results of nocturnal trapping.
v-nvO
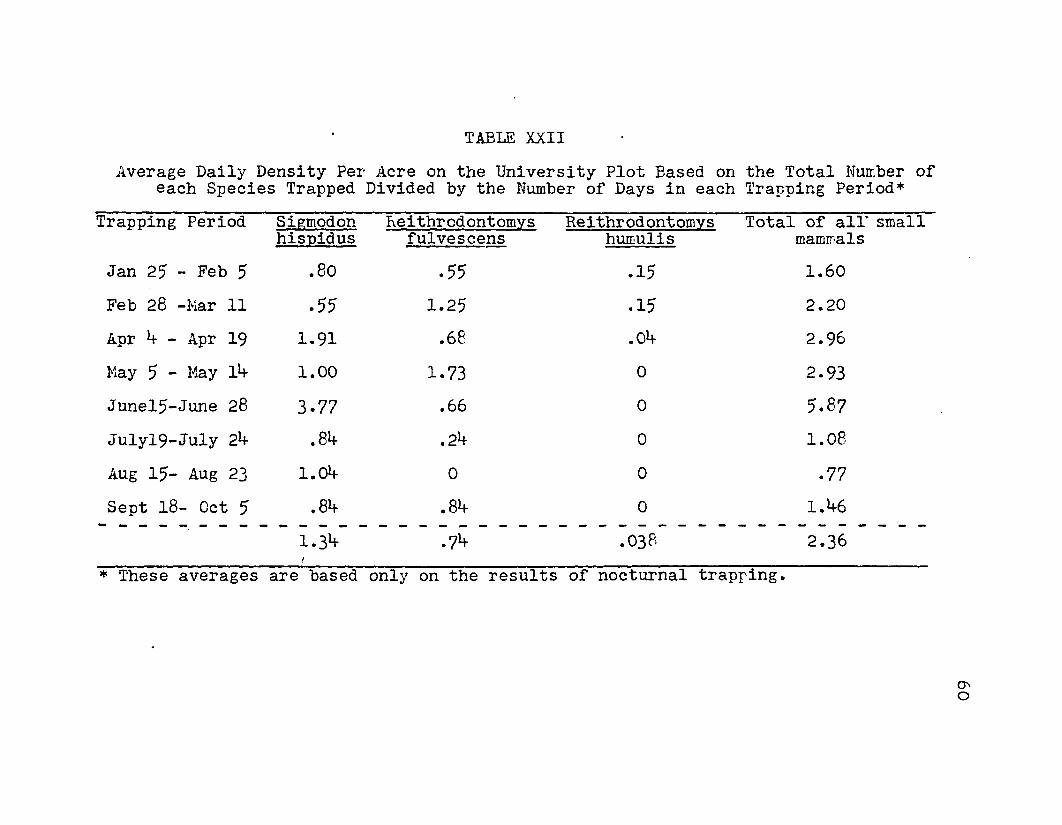
TABLE XXIIAverage Daily Density Per Acre on the University Plot Based on the Total Number of
each Species Trapped Divided by the Number of Days in each Trapping Period*Trapping Period Sigmodon
hisnidusReithrodontomys
fulvescensHe ithr od ont omys
humulisTotal of all* small
mammalsJan 25 - Feb 5 .8 0 • 55 .15 1.60Feb 28 -Mar 11 .55 1.25 .15 2 .2 0
Apr *+ - Apr 19 1.91 .68 .01+ 2 .9 6
May 5 - May lb 1 .0 0 1.73 0 2.93Junel5-June 28 3.77 .6 6 0 5.87Julyl9-July 2b .81+ .2*+ 0 1 .0 8
Aug 15- Aug 23 1 .01+ 0 0 .77Sept 18- Oct 5 .81+ .81+ 0 1 A 6
1.3^/ • lb .038 2.36* These averages are based only on the results of nocturnal trapping.
O'*o

TABLE XXIIIAverage Density Per Acre on the Kleinpeter Plot Based on Initial Captures
for each PeriodTrapping Period Sigmodon
hisnidusReithrodontomys
fulvescensReithrodontomys
humulisTotal of all Small
mammalsNov 8 - Nov 13 22.97 0 0 36. if 9Jan 9 ~ Jan 22 20.27 l*f. 86 8.11 5^.05Feb Ih- Feb 27 12.16 18.92 6.76 39.19Mar 1*+- Mar 25 9.39 10.07 2.02 23.83Apr 20 - May 3 10.07 7.0*f 3.02 2 2 .8 2
May 20- June 3 7.0*t if.69 2.68 lifA3June29- July 8 ^.73 03 1.68 1 0 A 0
Aug if - Aug 12 3.69 1.00 1.00 5.71Aug2*f - Sept 1 3.35 0.33 1.00 7.72Oct 9 - Oct 10 0 0.33 0 1.00Nov21+ - Nov 25 2.68 3-69 0.33 9.06
O'H

TABLE XXIVAverage Density Per Acre on the University Plot Based on Initial Captures
for each PeriodTrapping Period Sigmodon
hispidusReithrodontomys
fulvescensReithrodontomys
humulisTotal of all small
mammalsJan 25 ~ Feb 5 5.39 1+.79 1.20 12.57Feb 28- Mar 11 ^.79 5.98 .60 13.77Apr if - Apr 19 13.77 if.79 .60 22.78May 5 - May lif ^•79 3-59 0 10.12Junel5-June 28 15.57 if.19 0 23.95Julyl9-July 2b 1.80 1.20 0 2.99Aug 15- Aug 23 3.59 0 0 if.19Sept 1 8- Oct 5 1 .8 0 if.19 0 7.78Oct 9 - Oct 10 .60 .60 0 2.99Nov 2b- Nov 25 5.39 1.20 0 18.56
oro

63weeks; and a distorted result is obtained by dividing the number of captures by the number of days in the period.The second method, which is the more accurate of the two, is based on all initial captures far each period. It is easily seen that the first method described above is of little value, and therefore the results obtained by using the latter method will be used in the following discussion. Any animal that appears in a trap during any given trapping period is considered an integral part of the population of the plot for that particular period.
Publications by Bole (1939) and Blair (19*+8) give the densities of several small mammals. Stoddard in 1932 reported that the density of Sigmodon hisrddus was sometimes as high as *+0 rats per acre, which is considerably higher than the density reported here. Odum (1955) found that the autumn density of Cotton Rats was higher than the spring density in six of seven years of study, and Komerek (1 9 3 7) also reported a high autumn peak.
The highest recorded Sigmodon hispidus population density on the Kleinpeter plot was 22.97 rats per acre in November, 195*+) and the peak on the University plot was 15*57 rats per acre in June, 1955* On both plots the lowest recorded Cotton Rat populations were in the latter part of summer and early fall. One would expect the density peak to occur at the time of peak in reproduction or shortly

6^thereafter, but previous trapping experience has taught me the difficulty of catching rodents during the summer months. Perhaps some other factor, such as availability of food at various times of year, is responsible for this perplexity.
No mice of the genus Reithrodontomys were trapped on the Kleinpeter plot during the month of November, but in January the peak density of 8.11 mice per acre was obtained for Reithrodontomys humulis. and in February the peak density of 18.92 mice per acre was recorded for Reithrodontomys fulvescens. On the University plot Reithrodontomys humulis reached a peak of 1.20 mice per acre in January, and the only months in which this species appeared were January, March, and April. The greatest Reithrodontomys fulvescens density on the University plot was 5*98 mice per acre in March.
In recalling Tables II and III it may be noted that the total captures during July, August, September, and October were low when compared with the rest of the year, and captures from January through June were high. The highest recorded density during the entire study for the Kleinpeter plot, based on all initial small-mammal captures, was 5^.05 mammals per acre in January. The highest recorded density on the University plot v/as 22.78 small mammals per acre in April. Thus the population density of the University plot was low as anticipated.

Home range and territorialityIn the study of home range and territoriality only
those mammals trapped three or more times will be considered. There are several methods of determining home range; the most frequently used methods are minimum home range, minimum home range plus an estimate, and greatest distance between captures. Two procedures were used in this study. The minimum home range was obtained by connecting the points of capture and measuring the enclosed area, and the major axis of the home range was obtained by determining the greatest distance between points of capture.
On the University plot eight female Heithrodontomys fulvescens were trapped three or more times for a minimum home range average of 8900 square feet and extremes of 900
and *+5,*+00 square feet. The major axis of the home range varied from 67 to 361 feet with an average of 180.8 feet. Three male Reithrodontomys fulvescens were trapped three or more times for a minimum home range average of 1 2 ,3 0 0
square feet and a major axis average of 262.7 feet. There was much overlapping of range and no evidence of territoriality on the part of either males or females. At Kleinpeter the average home range of 17 female Fulvous Harvest Mice was 15,270.6 square feet with extremes of 1600 and 6^,800 square feet, and the major axis averaged 226.3 feet with a range of 28 to *+56 feet. The average

66home range of 28 males trapped three or more times was 1 2 ,3 9 2 .8 square feet with a range of 600 to 38,*+00 square feet, and the major axis averaged 2 1 7 .5 feet with extremes of 20 and 509 feet. Here again I could see no evidence of territoriality at any time of the year. In studying territoriality the points of capture for each animal were recorded on a chart, and the charts were superimposed upon each other.
The number of Heithrodontomvs humulis trapped three or more times was so small that little reliability can be placed on the results obtained, but they will be briefly mentioned. The minimum home range average for six females was 1 3 ,9 0 0 square feet with extremes of 1600’and 31>200
square feet, and the major axis average v/as 2 0 5 .1 feet with extremes of 72 and 369 feet. The minimum home range average of eight males was 19,850 square feet with extremes of 5600 and 55,200 square feet, and the major axis averaged 179*5 feet with a range of 57 to *+82 feet.
Although home range studies of species of the genus Reithrodontomys have been neglected, such is not the case with Sigmodon hisnidus. Howell (195*+) reported the home range of the males to be 0.*+5 to 1.27 acres and that of the females 0.22 to O .7 8 acres. Abegg (1939) tentatively arrived at a home range diameter of less than 30 yards with the home ranges of the males slightly larger than those of

67females. Re further concluded that only the breeding females had territories.
On the Kleinpeter plot the minimum home range average of 31 female Cotton Rats was 5012.9 square feet with extremes of *f00 and *+0,000 square feet, and the major axis averaged 1^9*0 feet with extremes of *+5 and 379 feet. The minimum home range average of 20 males was 55*+0.0 square feet with extremes of POO and 28,800 square feet, and the major axis averaged 1^9A feet with extremes of 20 and 358 feet. On the University plot 16 females had a minimum home range average of U-386-A square feet with a range of ^50 to 15700 square feet, and the major axis average was 139• *+ feet with extremes of 67 and 283 feet. The minimum home range average of 11 male Cotton Rats was 3 8 0 ^ .5
square feet with extremes of *+50 and 17100 square feet, and the major axis average was 1 1 5 .2 feet with extremes of k2 and 210 feet. This information concerning the Cotton Rat is more easily seen in Table XXV.
To summarize the home range data, the minimum home range average of 1+921+.2 square feet for male Cotton Rats was slightly larger than the female home range of V 7 9 8 .9
square feet, but the female major axis average of lU-5.8 feet was larger than that of the males, which was 137*3
feet. The minimum home range averages of male and female Reithrodontomys fulvescens were 12383*9 square feet and

68TABLE XXV
The Average Minimum Home Ranges and Average Major Axes of Sigmodon hispidus on the Two Ilots with the
Extremes in Parentheses
Minimum home range Major axisKleinpeter
females 5 0 1 2 .9 (^00-^-0,000) 1^9.0 (>+5-379)males 55^0.0 (800-28,800) l>+9.b (20-358)
Universityfemales (>+50-15,700) 139.>+ (67-283)males 380>+.5 (>+50-1 7 ,1 0 0) 115-2 (>+2-210)

6913065.*+ square feet respectively, and the major axis averages were 221.k and 210.5 feet. Thus, on the basis of trapping information obtained in this study, the minimum home range of the Fulvous Harvest House is more than tv/ice that of the Cotton Rat.
I am aware that discrepancies exist in the home range data included in this study. Basing the home range on all animals trapped three or more times presents considerable error; basing it on four or more captures would have increased the size of the home range. This method, however, is more accurate than that of major axis method, which assumes a circular home range for all animals trapped.
Some interesting data concerning territoriality, or the lack of it, is given in figures 1 through 3. Figure 1 shows the minimum home ranges of adult female Cotton Rats taken during the months of November, January, and February on the Xleinpeter plot. Figure 2 shows the minimum home ranges of adult females taken during April, May, June, and July. By comparing these figures one might assume the presence of territoriality during spring and summer.Figure 3, however, shows the minimum home ranges of adult male Cotton Rats during these same breeding months, and there appears to be an indication of territoriality here also. Could it be that territoriality does not exist and that these differences in seasonal trapping patterns are
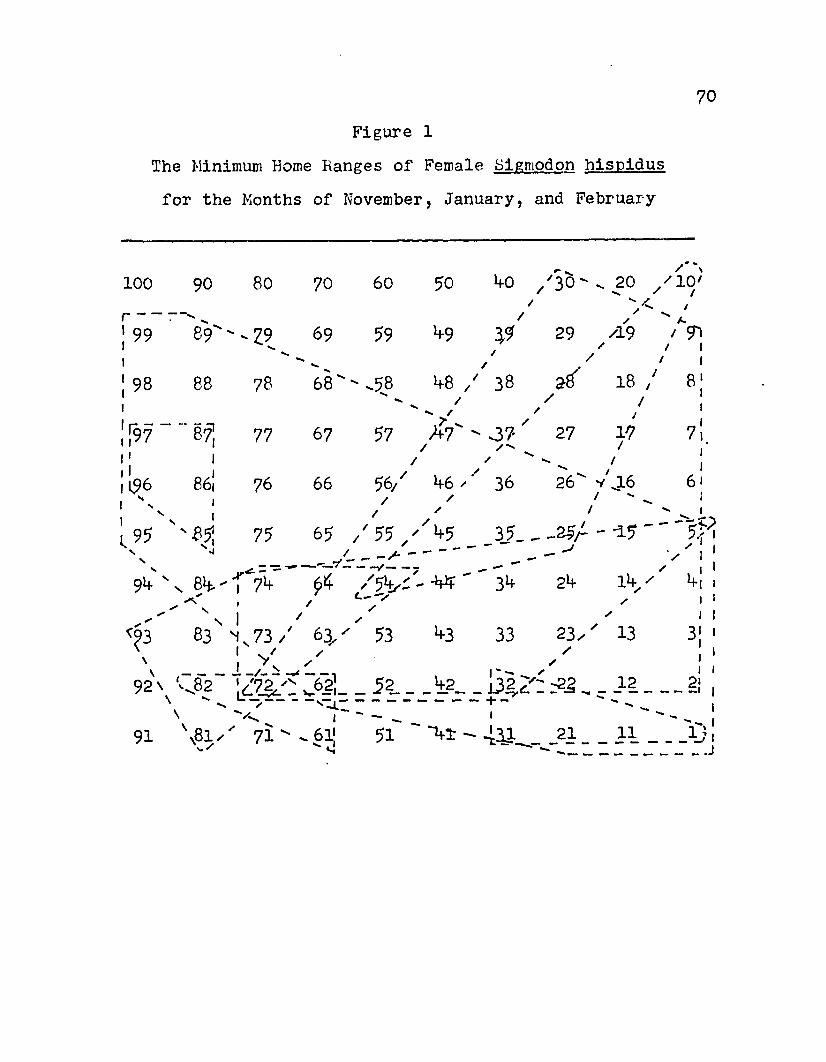
Figure 1The Minimum Home Ranges of Female Sigmodon hispidus for the Months of November, January, and February

71Figure 2
The Minimum Home Ranges of Female Slgmodon hispidus from April through July
100 ;90) 80 70 60 50
99 \89 " *79^ ^69^ [59
98\\88- *78| 68
" 4- _ fT•[58/
/
' *+8i
97\\
87 !\ 77i x 1 ' 1'iz6'! ^ 75|
67'Vi•57 k?\
|96|
86 66ii[_56 1*6]
i95 85 6?" ^4>511!9>t 7k 6** 5^
93 83 73 63 53 ( } }
92 82 72 62 52 k2
91 81 71 61 51 (k fVM .
1*0 30
29
20 /lO I / /
/ I19// 9
( i
- 3 8 . ^ 2 8 '8
/ 3 7
36
✓ i2 7 / 0.7
.3^%
33~
32
26
25
2^
23“1
/'7/
16 I /6l I
15 '/• 5 '/
lk I '\k,'s I , V-7IV
; f22 U2// 2
11

72Figure 3
The Minimum Home Ranges of Male Sigmodon hispidus from April through July
100 90 80
99 89 ,79/
/
98 88 / 78)/ /I /
97 8? ^ 7/ 7 / '
96 ' 86 7 76' / /
/ /
95 / $ 75./ '
r 9j4- / 8M- 7*+7 /
7 // 93/ 83 73
70
69
68
67
66
60 50 »+o 30 /20’
59 / 9/
58 ; y8 / /
57/ 'V7 /I
- /?6 / ^67 "
/ t> 7 I• 3 9S 29 ' 19'1 1 1 / /
. ! / 1
!38; 2 8 / jfe/ /
37 27 /17'' Ur,36 .. - 26 16/
; •' J35 / 2? A5/
; / /6 lf / iflf* ;
@ )/ '53 ^3 '/ /
(J92lx .8%'- -72"
(jlT
" "6e ' 7 52 >+27 /
/ /
" 761}) 51 ^1— -*■ — y-
3^f; ;2*f / lM-/ 7 7
3/i / 23/ 13_ i. - *----/ //3 2/ 22 12
31 21 11
10
9
8
7
6
5
i*
3
2
1

caused by the food factor and a corresponding home range increase and decrease? Many animals are more easily trapped in the nonbreeding season during the winter when the food supply is at low ebb and the animals must of necessity move about more. Foraging movements are much less pronounced in summer with its abundant food supply, except for those animals that store food. The factor of demand and supply of food plus the presence of greatly overlapping ranges at any time of the year tend to cast doubt on the existence of territoriality to any great extent among Sigmodon hispidus and Reithrodontomys fulvescens.

CHAPTER VI SUMMARY
This study concentrated on small-mammal populations and was based on trapping in two uncultivated fields near Baton Rouge, Louisiana. Live-trapping studies were made over a period of a year. Several conclusions were reached and several new areas of investigation were opened up.
For studies of this kind in the south the most practical type of trap is constructed of quarter-inch mesh wire with a nonmetallic roof. The number of animals trapped is increased appreciably by the addition of bait.
The most abundant rodent in the two fields was Sigmodon hispidus. followed by Reithrodontomys fulvescens. More than 75 per cent of the total captures consisted of these two species. Other small mammals, in order of total captures, were Reithrodontomys humulis. Cryptotis parva. Orvzomvs palustris. and Mus museulus.
The presence of Cotton Rats cannot always be detected by observation of runways.
Sigmodon hispidus and Cryptotis parva were active both day and night. The activity of Reithrodontomys fulvescens was restricted primarily to nocturnal movements. Cryptotis parva populations were not stable, and they moved from place to place in considerable numbers.
71*

75Some reproduction of Sigmodon hispidus takes place
throughout the year in Louisiana. The major period of reproduction extends from April to September with the peak occurring in late spring.
The average weight of all Sigmodon hispidus trapped was 79*1 grams with extremes of 11 and 223 grams. The adult average v/eight was 106.8 grams. The average weight of Reithrodontomys fulvescens was ^.6 grams, and the extremes were R.O and lR-,5 grams. The average weight of Pieithrodontomys humulis was 7 A grams, and the extremes were 5.0 and 12.0 grams.
The number of male and female Cotton Rats in a given area is approximately equal. A greater number of males were trapped during late fall and winter, and a greater number of females were trapped during late spring and summer. The number of male Reithrodontomys fulvescens in a given area is apparently considerably higher than the number of females.
The recorded Sigmodon hispidus population on the Kleinpeter plot attained a peak density of 22.97 rats per acre in November. The peak on the University plot was 15*57 rats per acre in June. On both plots the low point in population size occurred in late summer and early fall. The peak density of Reithrodontomys fulvescens was 18.92 mice per acre on the Kleinpeter plot and 5.98 mice per acre on the University plot. The peak density of Reithrodontomys

76humulis was 8.11 mice per acre on the Kleinpeter plot and 1.20 mice per acre on the University plot.
The highest recorded densities for the entire study, based on all initial small-mammal captures, were 5*+-05 mammals per acre on the Kleinpeter plot and 22.78 mammals per acre on the University plot.
The minimum home range and the major axis were determined for all Sigmodon hispidus and Reithrodontomys fulvescens trapped three or more times. The minimum home range average for male Cotton Rats v/as *+92*+.2 square feet, and the major axis averaged 137-3 feet. The minimum home range average for female Cotton Rats was *+798.9 square feet, and the major axis averaged l*+5-8 feet. The minimum home range averages of male and female Reithrodontomys fulvescens were 12,383*9 and 13,065.*+ square feet respectively, and the major axis averages were 221.*+ and 210.5 feet. The minimum home range of Reithrodontomys fulvescens was more than twice that of Sigmodon hispidus.
There was little evidence from this study of the existence of territoriality at any time of the year by any of the species involved. The home range, however, is increased in the winter and decreased in the summer.

SELECTED BIBLIOGRAPHY
Abegg, Roland1939* A preliminary study of the home range and
territory of the Cotton Rat, Sigmodon hispidus hispidus (Say and Ord). Thesis, Louisiana State University.
Adams, L.1951* Confidence limits for the Peterson or Lincoln
index used in animal population studies.Jour. Wildlife Management, 15: 13-19.
Allen, Durward L.19*+9* The purpose of mammal population studies.
Jour.. Mamin., 30: 18-21.Bailey, N. T. J..
1952. Improvements in the interpretation of recaptive data. Jour. Anirn. Ecol., 21: 120-127.
Baker, Kollin H.19^6. A study of rodent populations on Guam,
Mariana Islands. Ecol. Monographs, lb: 393-^ 0 8.
Blair, W. F.19^0. Home ranges and populations of the jumping
mouse. Amer. Mid. Nat., 23: 2M+-250.19*+0. A study of Prairie Deer-mouse populations in
southern Michigan. Amer. Mid. Nat., 2*+: 273-305.19^0. Home ranges and populations of the MeadowVole in southern Michigan. Jour. Wildlife Management, *+: 1^9-161.
19*+1 • Some data on the home ranges and generallife history of the Short-tailed Shrew, Red- backed Vole, and V.roodland Jumping Mouse in northern Michigan. Amer. Mid. Nat., 25: 681-685.
191+1. Techniques for the study of mammal populations. Jour. Mamm., 22: l*+8-l57.
19^2. Size of home range and notes on the lifehistory of the Woodland Deer-mouse and eastern Chipmunk in northern Michigan. Jour. Mamin., 23*. 27-36.
77

7819^8. Population density, life span, and mortality
rates of small mammals in the Blue-grass meadow and Blue-grass field association of southern Michigan. Amer. Midi. Nat., *f0:' 395-^19.1951* Population structure, social behavior, and environmental relations in a natural population of the Beach Mouse, Peromyscus polionotus leucocephalus. Contr. Lab. Vert. Biol., Univ. Mich., ■+&: 1-V7.
Bole, B. P. Jr.1939. The quadrat method of studying small mammal
populations. Scientific Publications of Cleveland Museum of Natural History, 5- 15-77.
Burt, W. H.19*+0. Territorial behavior and populations of some
small mammals in southern Michigan. Mus.Zool. Misc. Publication, Univ. Mich., bj:1-58.
19^9* Territoriality. Jour. Mamm., 30: 25-27.Cahalane, Victor E.
19*+1. A trap-removal census study of small mammals.Jour. Wildlife Management, 5: *4-2-67.
19*+7« Mammals of North America. The MacMillan Co.,New York, N. Y.
Calhoun, J. B.1955* A technique for investigating the distance
parameter of home range. Jour. Mamm., 36:*5-52.
Chitty, Dennis1937* A ringing technique for small mammals.
Journ. of Animal Ecol., 6: 36-53*Chitty, Dennis, and D. A. Kempson.
191+9. Prebaiting small mammals and a new designof live trap. Ecology, 30: 536-5*4-2.
Christian, John.1950. The adreno-pituitary system and population
cycles in mammals. Jour. Mamm., 31s 2*4-7-259.Clark, F. H.
1936. The estrous cycle of the Cotton Rat, Sigmodonhispidus. Contr. Lab. Vert. Genetics, Univ.Mich., 2: 1-2.

79Davis, D. E.
1953* The characteristics of rat populations.Quart. Rev. Biol., 28: 373J+01.
1953* Analysis of home range from recapture data. Jour. Mamm., 3*+- 352-356*
Davis, D. E., J. T. Emlen, and A. W. Stokes.19^8. Studies on home range in the Brown Rat.
Jour. Mamm., 29: 207-225*Dice, L. R.
1923. Some factors affecting the distribution of the Prairie Vole, Forest Deer Mouse, and Prairie Deer Mouse. Ecology, 3: 29-1+7*
1931* Methods of indicating the abundance of mammals. Jour. Mamm., 13: 376-381.
1938. Some census methods for mammals. Jour. Wildlife Management, 2: 119-130.
19^1* Methods for estimating populations of mammals. Jour. Wildlife Management, 5: 398-^07* .
Dice, L. R., and Walter E. Howard1950. Distance of dispersal by Prairie Deermice
from birthplaces to breeding sites. Contr. Lab. Vert. Biol., Univ. Mich., 50: 1-15*
Dice, L. R. and Philip Clark.1953* The statistical concept of home ranges as
applied to the recapture radius of theDeermouse. Contr. Vert. Biol., Univ. Mich.,62: 1-15*
Edwards, R. York1952. How efficient are snap traps in taking small
mammals. Jour. Mamm., 33: 1+97-1+98.Elder, W. H.
1951* Determination of weasel sex ratios by pelt examination. Jour. Wildlife Management,15: 111+-115*
Elton, Charles19^2. Voles, mice, and lemmings. Problems in
Population Dynamics. Oxford University Press, New York, N. Y.
Erickson, Arnold B.19^9* Summer populations and movements of the Cotton
Rat and other rodents on the Savannah River refuge. Jour. Mamm., 30: 133-1^0.

80Evans, F. C.
19^2. Studies of a small mammal population inBagley Wood, Berkshire. Journ. of Animal Ecol., 11: 182-197.
Godfrey, G. K,195^. Tracing field voles with a Geiger-Kuller
counter. Ecology, 35: 5-10.Goodnight, C. J. and E. J. Koestner.
19^2. Winter home ranges of some small Illinois mammals. Jour. Tenn. Acad. Science, 17: 276-279.19^2. Comparison of trapping methods in anIllinois Prairie. Jour. Mamm., 23: l*35-1+36.
Greffenius, K. J.1939. A method for determining the relative abund
ance of Microtus pennsylvanicus. Jour. Wildlife Management, 3: 199-200.
Grinnell, Joseph.191^. An account of the mammals and birds of the
lower Colorada valley. Univ. Calif. Publication Zool., 12: 92.
1939* Effects of a wet year on mammalian populations. Jour. Mamm., 20: 62-61+.
Halloran, A. F.19^2. A surface nest and the young of Sigmodon in
Texas. Jour. Mamm., 23: 91.Hamilton, W. J. Jr.
19^2. Winter reduction of small mammal populations and its probable significance. Amer. Nat.,76: 216-218.
Hanson, Harold C.19l+1+. Small mammal censuses near Prairie Du Sac,
Wisconsin. Trans. Wise. Acad. Science, Arts and Letters, 3 6 : 105-129.
Hatfield, Donald.1 9 3 8. Studies on rodent populations in a forested
area. Jour. Mamm., 19: 207-211.Haugen, Arnold 0.
19^2. Home range of the Cottontail Rabbit. Ecology, 23: 35^-367.

81Hayne, D. W.
19^9* Calculation of size of home range. Jour. Mamm., 30: 1-lP.
19*+9* Two methods for estimating populations from trapping records. Jour. Mamm., 30: 399-bll.
1950. Apparent home range of Microtus in relation to distance between traps. Jour. Mamm., 31s 26-39.
Hickey, Joseph.195^• Mean intervals in indices of wildlife popu
lations. Jour. Wildlife Management, 18: 90-106.Howell, A. B.
1923. Periodic fluctuations in the numbers of small mammals. Jour. Mamm., **: l1+9-l55«
Howell, Joseph C.195*+. Populations and home ranges of small mammals
on an overgrown field. Jour. Mamm., 35s 177-186.
Jackson, C. H. N.1939. The analysis of an animal population. Journ.
of Animal Ecol., 8: 238-2M-6.Jameson, E. W. Jr.
1955. Some factors affecting fluctuations ofMicrotus and Peromyscus. Jour. Mamm., 3 6 : 206-209.
Jordon, James S.19*+8. A midsummer study of the southern Flying
Squirrel. Jour. Mamm., 29: M+- -8.Kendeigh, S. C,
19M+. Homing of Peromyscus maniculatus gracilis.J our. Mamm., 25: ^05- *+06.
Komarek, E. V.1937. Mammal relationships to upland game and
other wildlife. Trans. Second N. A. Wildlife Conference, 561-569.
Lay, D. W. and R. K. Baker.1936. Notes on the home range and ecology of the
Attwater Wood Rat. Jour. Mamm., 19: *+18-^23.

82
Leopold, Aldo.1936. Game Management. Charles Scribner's Sons,
New York, N. Y.19*+3. Lome range. Wisconsin Cons. Bui., 6: 23-2*+.
Leslie, P. H. and D. H. S. Davis.1939* An attempt to determine the absolute number
of rats on a given area. Journ. of Animal Ecol., 8: 9^-113.
Leslie, P. P., D. Chitty and K. Chitty1953* The estimation of population parameters from
data obtained by means of the capture-recap-ture method. Biometriha, U-0: 137-169•
Lincoln, F. C. and o. Prentiss Baldwin.1929- Manual for bird banders. U.S.D.A, I-isc.
Bui. 58.Lowery, G. L. Jr.
19*+3 • Check-list of the nanmals of Louisiana and adjacent waters. Occasional Papers of the Mus. of Sool., L. S. U., 13: 1-257*
MacLulich, D. A.1951* A new technique for animal census, with
examples. Jour. Mamm., 32: 318-328.Kanville, Richard K.
1950. A comparison of trapping methods. Jour.Mamm., 31: 3 7 7-3 8 3 .
McCarley, W. H.±95*+• Fluctuations and structure of Peromyscus
gossypinus populations in eastern Texas.Jour. Mamm., 35: 526-532.
Mohr, Carl 0.19^3• A summary of North America small-mammal
censuses. Amer. Midi. Nat., 29: 5^5-587*19*+7. Table of equivelent populations of North
America small mammals. Amer. Midi. Nat.,37: 223-2^9.
Morris, R. F.1955* Population studies of some small forest
mammals in eastern Canada. Jour. Mamm.,36: 21-35.

Murie, 0. J.' and Adolph Murie1931* Travels of Peromyscus. Jour. Mamm., 12:
200-209.1932. Further notes on travels of Peromyscus.
Jour. Mamm., 13: 78-79*Nicholson, A. J.
1933* The balance of animal populations. Journ. of Animal Ecol., 2: 132-178.
Odum, Eugene P.19^+. Notes on sm all mammal pop u la tions at
Mountain Lake, Virginia. Jour. Mamm., 25: tf08-l+10.1955. An e lev en year study o f a Sigmodon p o p u la t io n .
Jour. Mamm., 36: 368- 378.
Park, Thomas1939. Analytical population studies in relation to
general ecology. Amer. Midi. Nat., 21: 235.Phillips, J. F. V.
1931. Quantitative methods in the study of numbers of terrestrial animals in biotic communities: a review, with suggestions. Ecology, 12: 633-6^9.
Phillips, Paul1936. The distribution of rodents in overgrazed
and normal grasslands of central Oklahoma. Ecology, 17: 673-679.
Priddy, Ralph B.19^3. Population levels of small mammals in various
habitats of central New York. Cornell Univ. Abstracts of Theses, 325-328.
Rinker, G. C.19^2. Litter records of some mammals of Meade
County, Kansas. Trans. Kans. Acad. Sci.,^5: 376-378.
Rowan, W.195^. R e f le c t io n s on the b io lo g y o f animal c y c l e s .
Jour. W ild l i f e Management, 18: 52-60.Schnabel, Z. E.
1938. The estimation of the total fish population of a lake. Amer. Mathe. Mon., kj: 3 -8.

81+Sealander, John a. Jr. and Barry Q. Walker
1955* A study of the Cotton Rat in northwestern Arkansas. Ark. Acad, of Sci., 8 : 153-162.
Silvonen, Lauri.195*+. Some essential features of short-term popu- .
lation fluctuations. Jour. Wildlife Management, 18: 38-1+5.
Smith, F. E.1952. Experimental methods in population dynamics:
a critique. Ecology, 33s l+ +l—1+50.Southern, H. N.
1955* Nocturnal animals. Scientific American,193: 8 8-9 8 .
Southern, H. N., J. S. Watson, and Dennis Chitty19^6. Watching nocturnal animals by infrared radi
ation. Journ. of Animal Ecol., 15: 198-202.Stickel, L. F.
I9I+6 . Experimental analysis of methods for measuring small mammal populations. Jour. Wildlife Management, 10: 150-159*
19^6. The source of animals moving into a depopulated area. Jour. Mamm., 27: 301-307*
19^8. The effect of bait in live trappingPeromyscus. Jour. Wildlife Management, 12: 211-212.
19^8. The trapline as a measure of small mammalpopulations. Jour. Wildlife Management, 12: 153-161.
195^* A comparison of certain methods of measuring range of small mammals. Jour. Mamm., 35: 1-15*
Stoddard, H. L.1932. The Bobwhite Quail, its habits, preservation
and increase. Charles Scribner's Sons,New York, N. Y.
Svihla, A.1929* Life history notes on Sigmodon hispidus
hispidus. Jour. Mamm., 10: 352-353*1931* Life history of the Texas Rice Rat. Jour.
Mamm., 12: 238-2^2.

Svihla, R. D.1930. Notes on the Golden Harvest Mouse. Jour.
Mamm., 11: 53-5*+.Swartz, Charles.
19^1. Home range of the Cottontail in central Missouri. Jour. Mamm., 22: 387-391+.
Taylor, W. P.1930. Methods of determining rodent pressure on the
range. Ecology, 11: 523-5^2.Thompson, W. R.
1939* Biological control and the theories of the interactions of populations. Parasitology,
. 31: 299-388.Townsend, M. T.
1935* Studies on some of the small mammals ofcentral New York. Roosevelt Wildlife Annals, ki 1-20.
Williams, Oliven.1955* Home range of Peromyscus maniculatus rufinus
in a ponderosa pine community. Jour. Mamm., 36: 4-2-lf5.
Worth, C. B.1951* Indirect evidence supporting observations on
the range of wild rodents. Jour. Mamm., 32: 76-79.
Yeiger, R. W.1953* Home range, territoriality, and populations
of the Chipmunks in central New York. Jour. Mamm., 3^: J+1+3-1+57»
York, C. L.19*+9* Notes on home ranges and population densities
of two species of heteromyid rodents in south west Texas. Texas Jour. Sci., 1: b2-b6.

BIOGRAPHY
Herbert E. Shadowen was born September 11, 1926, at Fredonia, Kentucky. He attended Masonic Home School in Louisville, Kentucky, through the tenth grade, and completed his high school education at Berea Academy, Berea, Kentucky. After two years of service with the United States Air Force he entered Berea College, Berea, Kentucky, and was graduated in 1950 with the Bachelor of Arts degree in Biology. He then entered the University of Kentucky graduate school and in 1951 received the degree of Master of Science in Zoology. In 1952 he enrolled in the graduate school of Louisiana State University and received an assistantship in the Department of Zoology. He remained in that capacity until 1955 at which time he accepted the position of Instructor in the Department of Zoology at Louisiana Folytechnic Institute, in Huston, Louisiana.
86

EXAMINATION AND THESIS REPORT
Candidate: Herbert E . Shadowen
Major Field: Zoology
Title of Thesis: Rodent Population Dynamics in Uncultivated Fields of Louisiana
Approved:
Major Professor and Chairman
'can of the Graduate School
EXAMINING COMMITTEE:
Date of Examination:
July lb, 1956


![ST. FRANCIS DE SALES - ecatholic-sites.s3.amazonaws.com · himself leaves his fields, his vineyards and his farm uncultivated ? Such is my distress.” [Personal Notes, 10-05-1853]](https://static.fdocuments.net/doc/165x107/5d60bfea88c99336288b6e4b/st-francis-de-sales-ecatholic-sitess3-himself-leaves-his-fields-his-vineyards.jpg)