Rocking Drones with Intentional Sound Noise on Gyroscopic Sensors
17
This paper is included in the Proceedings of the 24th USENIX Security Symposium August 12–14, 2015 • Washington, D.C. ISBN 978-1-931971-232 Open access to the Proceedings of the 24th USENIX Security Symposium is sponsored by USENIX Rocking Drones with Intentional Sound Noise on Gyroscopic Sensors Yunmok Son, Hocheol Shin, Dongkwan Kim, Youngseok Park, Juhwan Noh, Kibum Choi, Jungwoo Choi, and Yongdae Kim, Korea Advanced Institute of Science and Technology (KAIST) https://www.usenix.org/conference/usenixsecurity15/technical-sessions/presentation/son
-
Upload
truongkhue -
Category
Documents
-
view
235 -
download
1
Transcript of Rocking Drones with Intentional Sound Noise on Gyroscopic Sensors
This paper is included in the Proceedings of the 24th USENIX Security Symposium
August 12–14, 2015 • Washington, D.C.
ISBN 978-1-931971-232
Open access to the Proceedings of the 24th USENIX Security Symposium
is sponsored by USENIX
Rocking Drones with Intentional Sound Noise on Gyroscopic Sensors
Yunmok Son, Hocheol Shin, Dongkwan Kim, Youngseok Park, Juhwan Noh, Kibum Choi, Jungwoo Choi, and Yongdae Kim, Korea Advanced Institute of
Science and Technology (KAIST)
https://www.usenix.org/conference/usenixsecurity15/technical-sessions/presentation/son
USENIX Association 24th USENIX Security Symposium 881
Rocking Drones with Intentional Sound Noise on Gyroscopic Sensors
Yunmok Son, Hocheol Shin, Dongkwan Kim, Youngseok Park, Juhwan Noh, Kibum Choi,Jungwoo Choi, and Yongdae Kim
Korea Advanced Institute of Science and Technology (KAIST),Daejeon, Republic of Korea
{yunmok00, h.c.shin514, dkay, raccoon7, juwhan, kibumchoi, khepera, yongdaek}@kaist.ac.kr
Abstract
Sensing and actuation systems contain sensors to ob-serve the environment and actuators to influence it. How-ever, these sensors can be tricked by maliciously fabri-cated physical properties. In this paper, we investigatedwhether an adversary could incapacitate drones equippedwith Micro-Electro-Mechanical Systems (MEMS) gyro-scopes using intentional sound noise. While MEMS gy-roscopes are known to have resonant frequencies that de-grade their accuracy, it is not known whether this prop-erty can be exploited maliciously to disrupt the operationof drones.
We first tested 15 kinds of MEMS gyroscopes againstsound noise and discovered the resonant frequencies ofseven MEMS gyroscopes by scanning the frequenciesunder 30 kHz using a consumer-grade speaker. The stan-dard deviation of the resonant output from those gyro-scopes was dozens of times larger than that of the nor-mal output. After analyzing a target drone’s flight controlsystem, we performed real-world experiments and a soft-ware simulation to verify the effect of the crafted gyro-scope output. Our real-world experiments showed that inall 20 trials, one of two target drones equipped with vul-nerable gyroscopes lost control and crashed shortly afterwe started our attack. A few interesting applications andcountermeasures are discussed at the conclusion of thispaper.
1 Introduction
Sensors are devices that detect physical properties in na-ture and convert them to quantitative values for actua-tors and control systems. In many sensing and actuationsystems, actuations are determined on the basis of infor-mation from sensors. However, these systems can mal-function because of physical quantities that sensors failto measure or measure insensitively. Furthermore, mostsensors cannot distinguish between normal and abnormal
physical properties. Therefore, sensors can measure ma-licious inputs that are intentionally crafted by an attackerin addition to the physical stimuli that the sensors shoulddetect. Because providing detection capabilities for at-tacks against sensors increases production costs, mostcommercial devices with sensors are not equipped withany ability to detect or protect against such attacks.
Recently, many sensor-equipped devices, such assmartphones, wearable healthcare devices, and drones,have been released to make the devices easier and moreconvenient to use. In particular, commercial and open-source drones have been widely used for aerial photog-raphy, distribution delivery [2, 3], and private hobbies.These drones have multiple sensors, such as gyroscopes,accelerometers, and barometers. A gyroscope measureschanges in tilt, orientation, and rotation based on angu-lar momentum. It is thus a core sensor for flight attitudecontrol and position balancing.
To make the flight control modules of drones small,lightweight, and inexpensive, Micro-Electro-MechanicalSystems (MEMS) gyroscopes are used. MEMS gyro-scopes are designed as Integrated Circuit (IC) packages.Each design has a unique mechanical structure in the ICpackage. Depending on the structure of the MEMS gy-roscope, resonance occurs as a result of sound noise atresonant frequencies [37, 38, 39, 49]. This resonancecauses performance degradation of the gyroscope.
The resonant frequencies of MEMS gyroscopes areusually designed to be higher than the audible frequencyband to prevent malfunctioning of the sensing and ac-tuation systems. However, in our experiments, we dis-covered that some MEMS gyroscopes that are popularlyused in commercial drones resonate at audible frequen-cies as well as ultrasonic frequencies. Our experimentswere designed and conducted to analyze how drones areaffected by this phenomenon from an adversary point ofview. The flight control software of our target drone wasalso analyzed to examine the propagation of this phe-nomenon through the whole system. The results of our
882 24th USENIX Security Symposium USENIX Association
real-world experiments and a software simulation showthat this phenomenon could be exploited to launch inca-pacitating attacks against commercial drones.
The contributions of this research to the field can besummarized as follows:
• We found, using a consumer-grade speaker, that theresonant frequencies of several popular MEMS gy-roscopes are not only in the ultrasonic frequencyband but also in the audible frequency band, and weanalyzed their resonant output.
• We investigated the effect of the resonant output ofMEMS gyroscopes on the flight control of dronesvia software analysis and simulations.
• We developed a novel approach to attacking dronesequipped with vulnerable MEMS gyroscopes us-ing intentional sound noise, and we demonstratedthe consequences of our attack in real-world exper-iments 1
This paper is organized as follows: Section 2 outlinessecurity research to date on sensor systems. Section 3provides background information on drone systems andMEMS gyroscopes. Section 4 describes the analyses andexperiments conducted in this study to investigate the ef-fects of sound noise on MEMS gyroscopes. Analysis ofthe flight control software, real-world experiments, andsimulations for attacking drones are described in Sec-tion 5. A discussion of the results and conclusion drawnfrom the results are presented in Sections 6 and 7, re-spectively.
2 Related Work
The security of sensors recently started to draw atten-tion with the introduction of consumer-grade sensing andactuation systems. As this study was focused on inputspoofing attacks on gyroscopes, we review in this sectionprevious researches on 1) privacy issues related to gyro-scopes, 2) resonant frequencies of gyroscopes, 3) secu-rity analyses of commercial drones, and 4) input spoofingattacks on sensing circuitry.Privacy Issues Related to Gyroscopes: Embedded de-vices can be used to record the private information ofusers without their recognition. Because a gyroscope canbe used to measure changes in tilt, orientation, and rota-tion, it can be used to steal a smartphone user’s keystrokeinformation, such as unlock passwords, banking pass-words, and credit card numbers [36, 47]. By exploiting
1A demo video of our attack against the target drone in thereal world is available at https://sites.google.com/site/
rockingdrone/.
the capability of the gyroscopes of smartphones to mea-sure acoustic vibrations at a low frequency band, a newattack was proposed to eavesdrop speech [59]. The fo-cus of these studies differed from that of this paper inthat they examined the use of gyroscopes to extract pri-vate information, without affecting actuation.Resonant Frequencies of Gyroscopes: Resonant fre-quency has been identified as a problem that causesthe performance degradation of MEMS gyroscopes. Ingeneral, the vibrating structures of MEMS gyroscopeshave resonant frequencies. Resonance can occur as aresult of sound noise [37, 38, 39]. Some mechanismsfor mitigating interference from sound have been pro-posed. Roth suggested a simple and cheap defensetechnique that involves surrounding the gyroscope withfoam [49]. Soobramaney proposed the use of an ad-ditional structure in a gyroscope that responds only tothe resonant frequency to cancel out the resonant outputfrom the gyroscope [52]. Using an additional feedbackcapacitor connected to the sensing electrode, the reso-nant frequency and the magnitude of the resonance ef-fect can be tuned [35, 43]. It is widely believed thatmost consumer-grade MEMS gyroscopes have resonantfrequencies. However, these resonant frequencies are of-ten considered to be commercial secrets or are designedto be just higher than the audible frequency range.Security Analysis of Commercial Drones: There werea couple of works on hacking commercial drones. Sam-land et. al. showed that AR.Drone [5] was vulnerableto network attacks due to unencrypted Wireless LAN(WLAN) communication and the lack of authenticationfor Telnet and FTP [50]. Kamkar showed that a dronecan be hijacked by another drone using similar vulnera-bilities [44]. Attacks such as these are focused on hijack-ing network connections or system privileges.Input Spoofing Attacks on Sensing Circuitry: Allsensing and actuation systems have sensing circuitry thatis composed of the sensor itself and a wire that connectsthe sensor to other components of the system. Kune et.al. showed that an adversary can inject an Electro Mag-netic Interference (EMI) signal into the wire connect-ing an analog sensor and Analog-to-Digital Converter(ADC) to fake a sensing signal [45]. By injecting fakewaveforms, the researchers were able to inhibit pacingor induce defibrillation shocks in Cardiac ImplantableElectrical Devices (CIEDs). Without affecting the sen-sor itself, they were able to spoof the sensing signal byinjecting an EMI signal into the sensing circuitry.
It is also possible to affect the sensor itself. For exam-ple, biometric imaging sensors have frequently been tar-geted in sensor spoofing attacks. Tsutomu et al. showedthat a verification rate of more than 68 % could beachieved against 11 different fingerprint systems usingartificial fingers [46]. Galbally et al. fabricated fake
2
USENIX Association 24th USENIX Security Symposium 883
Figure 1: Block diagram of a typical drone system
fingerprints from standard minutiae templates, and morethan 70 % of the fake fingerprints were accepted by thesystem tested [42]. In addition, a method for bypassingthe user authentication of facial cognitive biometric sys-tems was proposed as an example of sensor input spoof-ing against the imaging sensor systems of commerciallaptops [40].
We were able to find only one notable and relevantstudy not related to biometric image sensors. Shoukryet al. injected magnetic fields to spoof the wheel speedof vehicles by placing a magnetic actuator near the Anti-lock Braking System (ABS) wheel speed sensor of whichis also a magnetic sensor also [51]. In other words, theresearchers used the same physical property as that in-tended to be sensed through the sensing channel of thetarget sensor for their spoofing attack. This work is sim-ilar to ours in that it explored intentional interferencewith sensors to cause malfunctioning of actuators How-ever, we investigated whether intentional sound noise atthe resonant frequency of a gyroscope can incapacitatea drone. This means that our attack is an interferenceattack through a channel other than the sensing channelthat has to be insensitive for the gyroscope. Note that aMEMS gyroscope is the most basic sensor used in main-taining a drone in an upright position without any exter-nal torque.
3 Background
In this section, we explain the operation and characteris-tics of the drone considered in this study, its flight controlsystem and a MEMS gyroscope.
3.1 Drone (Multicopter)
A drone is a kind of Unmanned Aerial Vehicle (UAV).Drones are used not only for military purposes but alsofor various non-military purposes such as delivery ser-vices, aerial photography, search and rescue (S&R),crop-dusting, and hobbies. Because of accessibility rea-sons, military drones were not considered in this paper.Many commercial drones have been released in recent
years as the non-military drone market has grown [2, 3].Both finished drones and DIY drones with open-sourcedrone projects for the flight control software are commer-cially available. AR.Drone [5] is a popular commercialfinished drone product. Multiwii [24] and ArduPilot [7]are open-source flight control software used widely withboth DIY and commercial drones. These drones are alsoknown as multicopters (quadcoptors if they have four ro-tors) because they usually have multiple rotors.
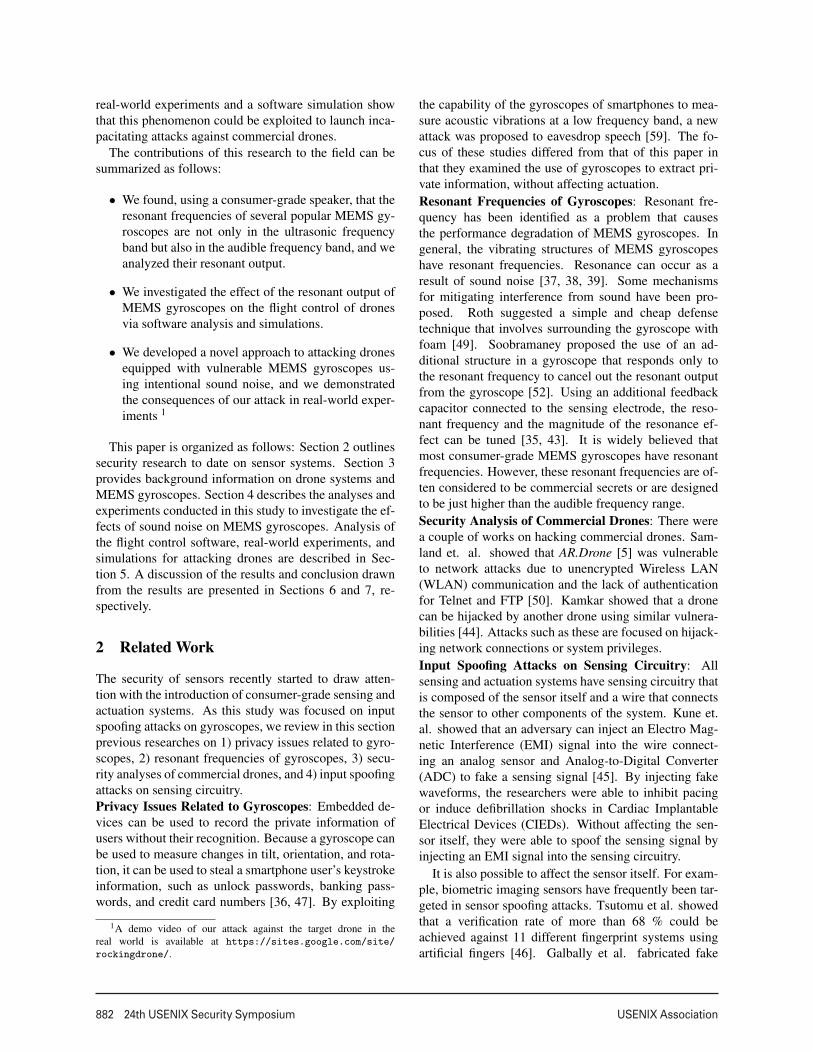
Typically, a drone system consists of multiple rotors,one flight controller, one wireless receiver, and one wire-less transmitter (remote controller). Figure 1 shows ablock diagram of a drone system. The flight controllerreceives control signals from the wireless transmitterthrough the receiver, and manipulates the speed of therotors in accordance with the user’s control supported bythe flight controller.
3.2 Flight Attitude Control
It is very important for the drone flight controller to ad-just each rotor’s speed for horizontally leveling off in theair, because multiple rotors are not always exactly thesame and the center of mass cannot always be ensured.To stabilize a drone’s balance automatically, a flight at-titude control system is implemented in the flight con-trol software. This flight attitude control system com-putes the proper control signal for multiple rotors withalgorithms based on the data from Inertial MeasurementUnits (IMUs), including gyroscopes.
IMUs, which consist of sets of sensors, are funda-mental components of flight control systems for air-craft, spacecraft, and UAVs, including drones. An IMUmeasures the orientation, rotation, and acceleration of adrone, using a combination of a gyroscope and an ac-celerometer, and in some cases also a magnetometer anda Global Positioning System (GPS) [55]. MEMS gy-roscopes are thus necessary components of drones andmust be robust to control drones successfully.
In the case of open-source flight control software [7,24], the most common algorithm for flight attitude con-trol is Proportional-Integral-Derivative (PID) control.The PID control algorithm is a control loop feedbackmechanism that minimizes the difference between thedesired control and the current status. It is made upof three terms: the proportional, the integral, and thederivative terms, denoted by P, I, and D, respectively.The P term applies control to the system in proportionto the difference (error) between the current state and thedesired state to the system. The I term is used to re-duce the steady-state error through proportional controlof the accumulation of past errors. The D term is usedto reduce overshoot and increase stability through pro-portional control of the changing rate of errors. Each
3
884 24th USENIX Security Symposium USENIX Association
term has a gain (GP, GI , and GD) for tuning the controlsystem, and users can change each gain for stability andsensitivity of drones of various types, sizes, and weights.
3.3 MEMS Gyroscope
3.3.1 Operation
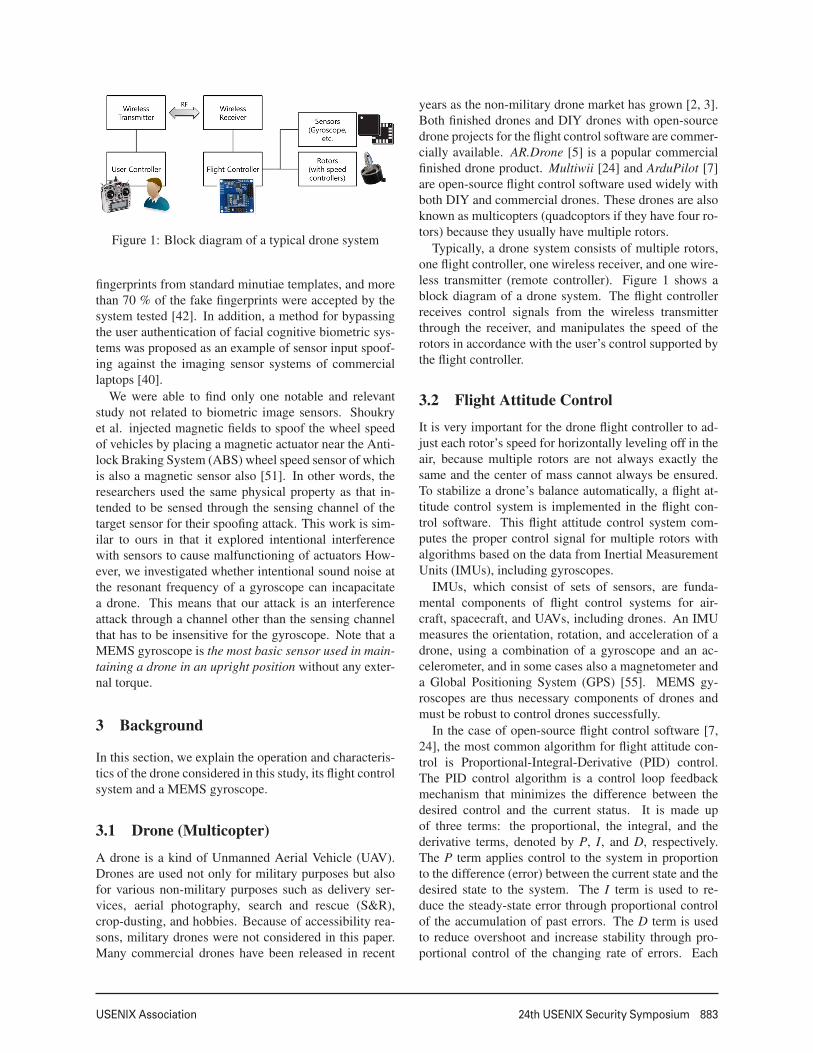
The principle underlying the MEMS gyroscope [1, 9] isthe law of physics known as the Coriolis effect or Corio-lis force. The Coriolis effect is the deflection of a movingobject in a rotating reference frame. This effect appearsonly to an observer in the same rotating reference frame.In the observer’s view, the path of the moving object isobserved to be bent by a fictitious force, i.e. the Corio-lis force. In other words, when an object is moving in arotating container or package, the path of the moving ob-ject is bent in a direction different from the moving direc-tion. Therefore, the observer on the container or packagecan sense this bending. Figure 2 illustrates the conceptof a MEMS gyroscope structure for one axis. To sensemotion with respect to one axis such as Z-axis rotation,there is a mechanical structure called a sensing mass ina MEMS gyroscope. While a sensing mass is continu-ously vibrating at a certain frequency with respect to theX-axis, the Coriolis force is applied in the Y-axis direc-tion as a result of the Z-axis rotation. The amount ofrotation is proportional to the amount of bending.
Figure 3 shows an example of a MEMS gyroscopestructure with three axes. This gyroscope is manufac-tured by STMicroelectronics [10]. In Figure 3, M1through M4 correspond to continuous vibrations of thesensing masses. Bending occurs in the direction orthog-onal to both the vibrating axis and the rotating axis whenthis structure rotates with respect to each axis [10].
MEMS gyroscopes support digital interfaces such asInter-Integrated Circuits (I2Cs) and Serial Peripheral In-terfaces (SPIs) that communicate with the processors ofapplication systems. By reading registers of the gyro-scopes that contain the sensed values, a system’s pro-cessor can calculate the amount of rotation that occurs.The maximum sampling frequency for reading the regis-ters of the MEMS gyroscopes varies from a few hundredto a few thousand samples per second. This means thatgyroscopes cannot sense and recover correctly from fastchanges in rotation over a few kHz without additionalsignal processing, according to the sampling theorem.The sampling theorem defines the minimum samplingfrequency as a frequency higher than 2×B Hz when thegiven signal contains no frequency components higherthan B Hz. If this condition is not satisfied, distortionoccurs in the frequency response. This is referred to asaliasing. Because of the aliasing problem, a frequencyanalysis of the gyroscope output is not very useful.
Figure 2: Concept of MEMS gyroscope structure for oneaxis
Figure 3: Operation of a three-axis MEMS gyro-scope [10] (the X-, Y-, and Z-axes are defined as thepitch, roll, and yaw, respectively.)
3.3.2 Acoustic Noise Effect
The accuracy degradation of MEMS gyroscopes by harshacoustic noise is well known to researchers who havestudied the performance of MEMS sensors [37, 38, 39,49]. A MEMS gyroscope has a resonant frequency thatis related to the physical characteristics of its structure,and high-amplitude acoustic noise at the resonant fre-quency can produce resonance in the MEMS structure.As a result of this resonance, the MEMS gyroscope gen-erates an unexpected output that may cause the relatedsystems to malfunction. To minimize the resonance ef-fect of acoustic noise in daily life, MEMS gyroscopesare typically designed with resonant frequencies abovethe audible frequency limit (i.e., above 20 kHz).
However, we found that some MEMS gyroscopes haveresonant frequencies in both the audible and ultrasonicfrequency ranges, and these sensors generate ghost out-puts with injected sound noise by an attacker. In addi-
4
USENIX Association 24th USENIX Security Symposium 885
Figure 4: Overview of our experiment
tion, these MEMS gyroscopes are widely used in droneflight controllers and smartphones. The accuracy degra-dation problem of MEMS gyroscopes has only been con-sidered in the context of performance issues, but this phe-nomenon can be used as a new attack vector. Therefore,it is important to study this phenomenon as a vulnera-bility that can cause critical loss of control of MEMSgyroscope application systems, such as drones.
4 Analysis of Sound Noise Effects
To explore the effects of sound noise on drones, it isnecessary to identify the resonant frequencies of MEMSgyroscopes used for drones precisely. However, thedatasheets of some MEMS gyroscopes do not includeinformation on their exact resonant frequencies, and theresonant frequencies are even classified in some cases. Asimple and reliable way to find the resonant frequency ofa MEMS gyroscope is exhaustive search, i.e., scanningwith pure single-tone sound over a chosen frequencyband. In this section, the measurement and analysis ofthe effect of sound noise on MEMS gyroscopes are de-scribed.
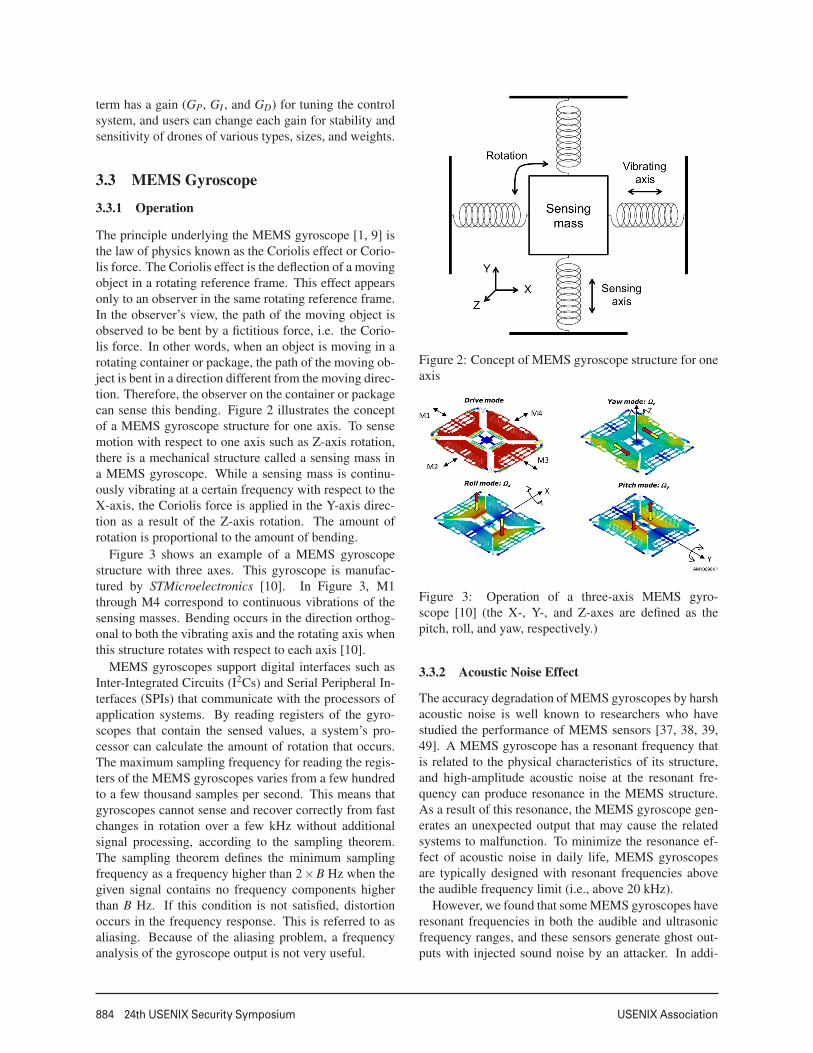
4.1 OverviewAn overview of our experiment is shown in Figure 4.Python scripts to generate sound noise with a single fre-quency and to collect data from the target gyroscopes arerun on a laptop computer. A consumer-grade speakerconnected to the laptop is used as the noise source and isset 10 cm above the top of the target gyroscope. We usedArduino [6], a programmable microprocessor board, toread and write registers of the target sensors. A single-tone sound noise scanning the sound frequency range
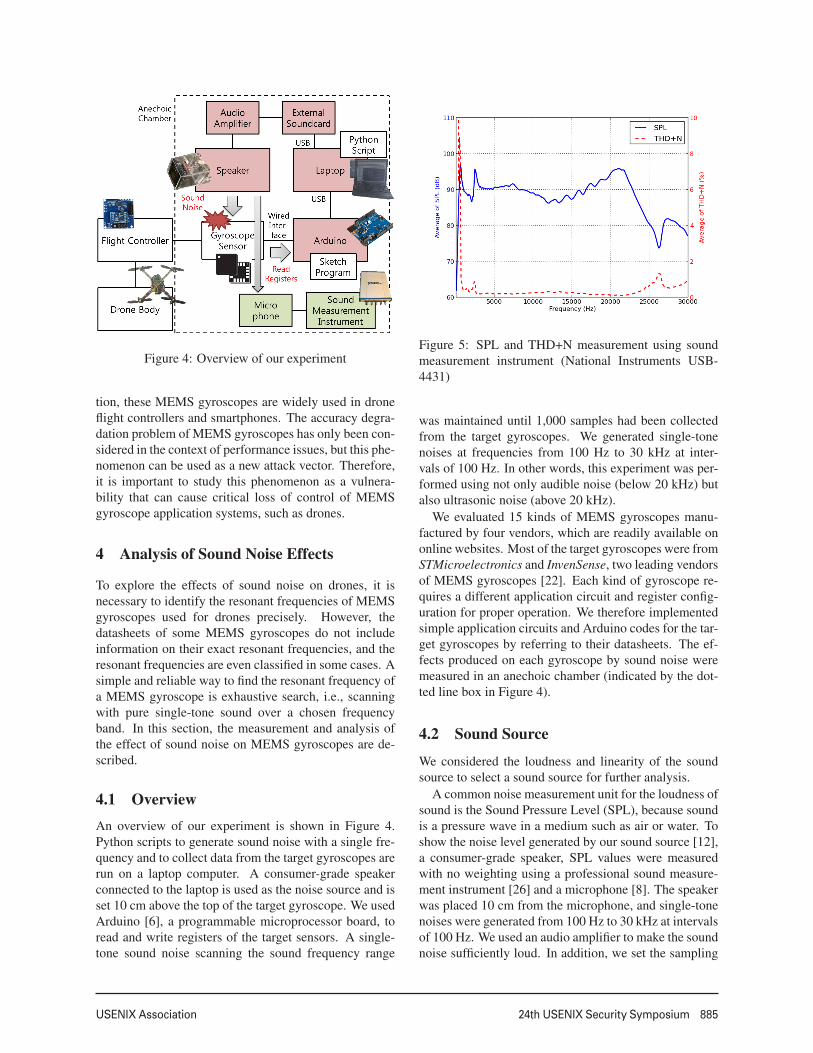
Figure 5: SPL and THD+N measurement using soundmeasurement instrument (National Instruments USB-4431)
was maintained until 1,000 samples had been collectedfrom the target gyroscopes. We generated single-tonenoises at frequencies from 100 Hz to 30 kHz at inter-vals of 100 Hz. In other words, this experiment was per-formed using not only audible noise (below 20 kHz) butalso ultrasonic noise (above 20 kHz).
We evaluated 15 kinds of MEMS gyroscopes manu-factured by four vendors, which are readily available ononline websites. Most of the target gyroscopes were fromSTMicroelectronics and InvenSense, two leading vendorsof MEMS gyroscopes [22]. Each kind of gyroscope re-quires a different application circuit and register config-uration for proper operation. We therefore implementedsimple application circuits and Arduino codes for the tar-get gyroscopes by referring to their datasheets. The ef-fects produced on each gyroscope by sound noise weremeasured in an anechoic chamber (indicated by the dot-ted line box in Figure 4).
4.2 Sound Source
We considered the loudness and linearity of the soundsource to select a sound source for further analysis.
A common noise measurement unit for the loudness ofsound is the Sound Pressure Level (SPL), because soundis a pressure wave in a medium such as air or water. Toshow the noise level generated by our sound source [12],a consumer-grade speaker, SPL values were measuredwith no weighting using a professional sound measure-ment instrument [26] and a microphone [8]. The speakerwas placed 10 cm from the microphone, and single-tonenoises were generated from 100 Hz to 30 kHz at intervalsof 100 Hz. We used an audio amplifier to make the soundnoise sufficiently loud. In addition, we set the sampling
5
886 24th USENIX Security Symposium USENIX Association
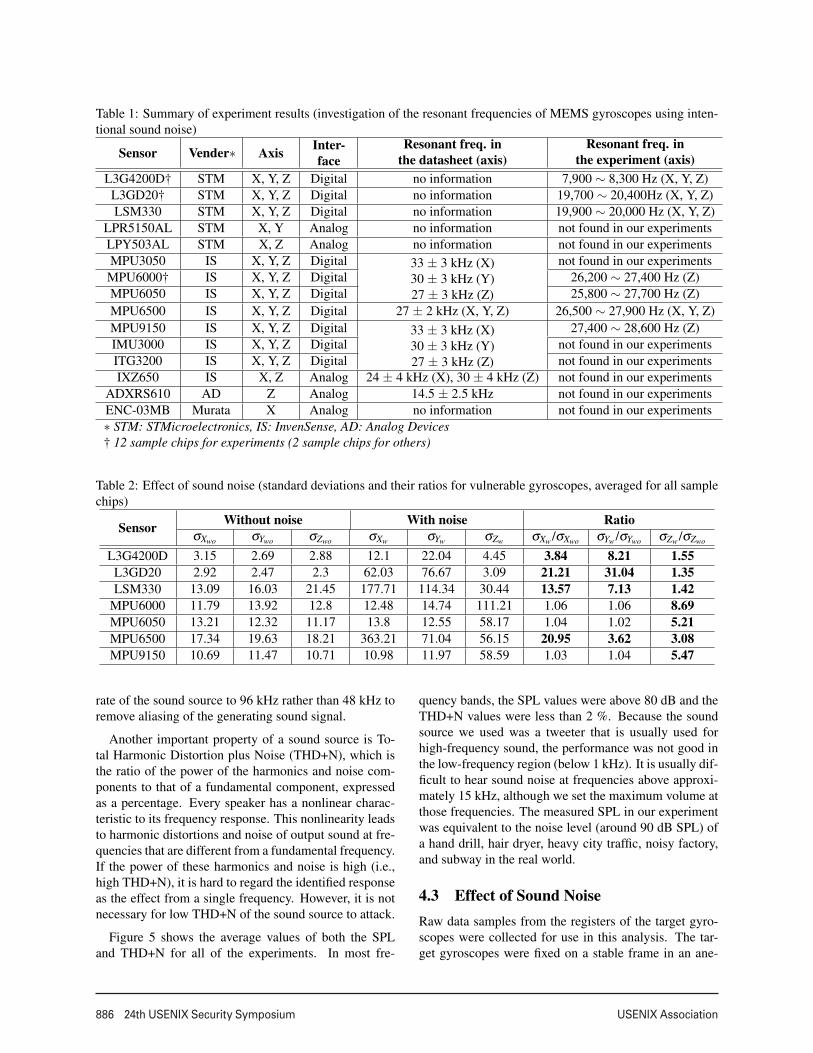
Table 1: Summary of experiment results (investigation of the resonant frequencies of MEMS gyroscopes using inten-tional sound noise)
Sensor Vender∗ Axis Inter-face
Resonant freq. inthe datasheet (axis)
Resonant freq. inthe experiment (axis)
L3G4200D† STM X, Y, Z Digital no information 7,900 ∼ 8,300 Hz (X, Y, Z)L3GD20† STM X, Y, Z Digital no information 19,700 ∼ 20,400Hz (X, Y, Z)LSM330 STM X, Y, Z Digital no information 19,900 ∼ 20,000 Hz (X, Y, Z)
LPR5150AL STM X, Y Analog no information not found in our experimentsLPY503AL STM X, Z Analog no information not found in our experimentsMPU3050 IS X, Y, Z Digital 33 ± 3 kHz (X)
30 ± 3 kHz (Y)27 ± 3 kHz (Z)
not found in our experimentsMPU6000† IS X, Y, Z Digital 26,200 ∼ 27,400 Hz (Z)MPU6050 IS X, Y, Z Digital 25,800 ∼ 27,700 Hz (Z)MPU6500 IS X, Y, Z Digital 27 ± 2 kHz (X, Y, Z) 26,500 ∼ 27,900 Hz (X, Y, Z)MPU9150 IS X, Y, Z Digital 33 ± 3 kHz (X)
30 ± 3 kHz (Y)27 ± 3 kHz (Z)
27,400 ∼ 28,600 Hz (Z)IMU3000 IS X, Y, Z Digital not found in our experimentsITG3200 IS X, Y, Z Digital not found in our experimentsIXZ650 IS X, Z Analog 24 ± 4 kHz (X), 30 ± 4 kHz (Z) not found in our experiments
ADXRS610 AD Z Analog 14.5 ± 2.5 kHz not found in our experimentsENC-03MB Murata X Analog no information not found in our experiments∗ STM: STMicroelectronics, IS: InvenSense, AD: Analog Devices† 12 sample chips for experiments (2 sample chips for others)
Table 2: Effect of sound noise (standard deviations and their ratios for vulnerable gyroscopes, averaged for all samplechips)
Sensor Without noise With noise RatioσXwo σYwo σZwo σXw σYw σZw σXw /σXwo σYw /σYwo σZw /σZwo
L3G4200D 3.15 2.69 2.88 12.1 22.04 4.45 3.84 8.21 1.55L3GD20 2.92 2.47 2.3 62.03 76.67 3.09 21.21 31.04 1.35LSM330 13.09 16.03 21.45 177.71 114.34 30.44 13.57 7.13 1.42
MPU6000 11.79 13.92 12.8 12.48 14.74 111.21 1.06 1.06 8.69MPU6050 13.21 12.32 11.17 13.8 12.55 58.17 1.04 1.02 5.21MPU6500 17.34 19.63 18.21 363.21 71.04 56.15 20.95 3.62 3.08MPU9150 10.69 11.47 10.71 10.98 11.97 58.59 1.03 1.04 5.47
rate of the sound source to 96 kHz rather than 48 kHz toremove aliasing of the generating sound signal.
Another important property of a sound source is To-tal Harmonic Distortion plus Noise (THD+N), which isthe ratio of the power of the harmonics and noise com-ponents to that of a fundamental component, expressedas a percentage. Every speaker has a nonlinear charac-teristic to its frequency response. This nonlinearity leadsto harmonic distortions and noise of output sound at fre-quencies that are different from a fundamental frequency.If the power of these harmonics and noise is high (i.e.,high THD+N), it is hard to regard the identified responseas the effect from a single frequency. However, it is notnecessary for low THD+N of the sound source to attack.
Figure 5 shows the average values of both the SPLand THD+N for all of the experiments. In most fre-
quency bands, the SPL values were above 80 dB and theTHD+N values were less than 2 %. Because the soundsource we used was a tweeter that is usually used forhigh-frequency sound, the performance was not good inthe low-frequency region (below 1 kHz). It is usually dif-ficult to hear sound noise at frequencies above approxi-mately 15 kHz, although we set the maximum volume atthose frequencies. The measured SPL in our experimentwas equivalent to the noise level (around 90 dB SPL) ofa hand drill, hair dryer, heavy city traffic, noisy factory,and subway in the real world.
4.3 Effect of Sound NoiseRaw data samples from the registers of the target gyro-scopes were collected for use in this analysis. The tar-get gyroscopes were fixed on a stable frame in an ane-
6

USENIX Association 24th USENIX Security Symposium 887
(a) Standard deviation of raw data samples for 12 identicalL3G4200D chips (X-axis)
(b) Standard deviation of raw data samples for 12 identicalL3G4200D chips (Y-axis)
(c) Standard deviation of raw data samples for 12 identicalL3G4200D chips (Z-axis)
(d) Raw data samples of one L3G4200D chip with the singletone sound noise at 8,000Hz
Figure 6: Sound noise effect on L3G4200D gyroscopes (all samples were collected as raw data stored in the gyro-scope’s register)
choic chamber, with and without sound noise. Becausethe standard deviation of the raw data samples shouldideally be zero without sound noise when the target gy-roscopes are on the frame, we consider the difference inthe standard deviations with and without sound noise asa criterion for the resonance of the target gyroscopes.
The results of the experiment are summarized in Ta-ble 1. The third and fourth columns indicate the degreesof freedom and the interface type of each gyroscope, re-spectively. The resonant frequencies 2 and axes from thedatasheets [4, 13, 14, 15, 16, 17, 18, 19, 25, 28, 29, 30,31, 32] are listed in the fifth column, and the resonantfrequencies identified in our experiment are listed in thelast column.
2These are described as mechanical frequencies in the datasheetsfor the InvenSense gyroscopes.
Our results show that seven of these gyroscopes (i.e.,vulnerable gyroscopes) resonated at their own resonantfrequencies in response to sound noise. Three of thevulnerable gyroscopes were manufactured by STMicro-electronics, and the others were manufactured by In-verSense. No documentation on the resonant frequen-cies of the tested gyroscopes was available from vendorsother than InvenSense and Analog Devices. We figuredout that the gyroscopes manufactured by STMicroelec-tronics had resonant frequencies in the audible range (al-most below 20 kHz), and that they were affected con-siderably more along the X-axis and Y-axis than alongthe Z-axis. In contrast, the gyroscopes manufactured byInvenSense resonated in the ultrasound range (above 20kHz) and were affected in the Z-axis direction only.
Both keeping resonant frequencies secret and raisingthem to the higher-frequency region are good ways to
7
888 24th USENIX Security Symposium USENIX Association
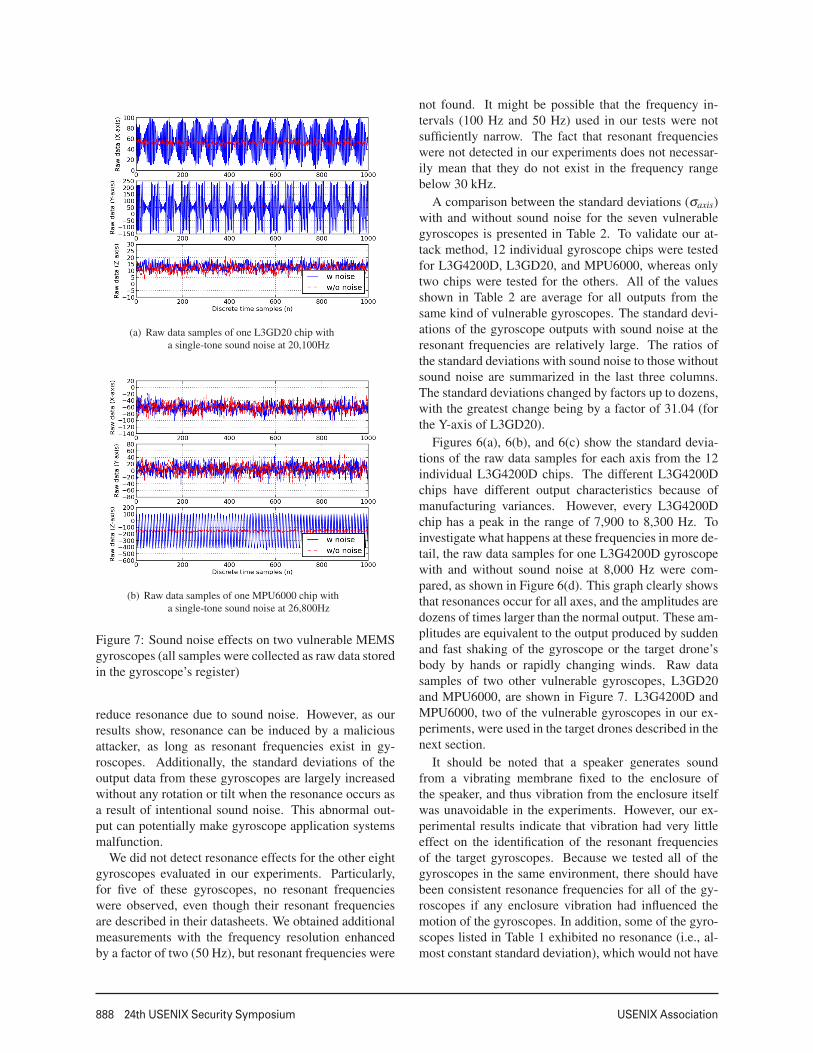
(a) Raw data samples of one L3GD20 chip witha single-tone sound noise at 20,100Hz
(b) Raw data samples of one MPU6000 chip witha single-tone sound noise at 26,800Hz
Figure 7: Sound noise effects on two vulnerable MEMSgyroscopes (all samples were collected as raw data storedin the gyroscope’s register)
reduce resonance due to sound noise. However, as ourresults show, resonance can be induced by a maliciousattacker, as long as resonant frequencies exist in gy-roscopes. Additionally, the standard deviations of theoutput data from these gyroscopes are largely increasedwithout any rotation or tilt when the resonance occurs asa result of intentional sound noise. This abnormal out-put can potentially make gyroscope application systemsmalfunction.
We did not detect resonance effects for the other eightgyroscopes evaluated in our experiments. Particularly,for five of these gyroscopes, no resonant frequencieswere observed, even though their resonant frequenciesare described in their datasheets. We obtained additionalmeasurements with the frequency resolution enhancedby a factor of two (50 Hz), but resonant frequencies were
not found. It might be possible that the frequency in-tervals (100 Hz and 50 Hz) used in our tests were notsufficiently narrow. The fact that resonant frequencieswere not detected in our experiments does not necessar-ily mean that they do not exist in the frequency rangebelow 30 kHz.
A comparison between the standard deviations (σaxis)with and without sound noise for the seven vulnerablegyroscopes is presented in Table 2. To validate our at-tack method, 12 individual gyroscope chips were testedfor L3G4200D, L3GD20, and MPU6000, whereas onlytwo chips were tested for the others. All of the valuesshown in Table 2 are average for all outputs from thesame kind of vulnerable gyroscopes. The standard devi-ations of the gyroscope outputs with sound noise at theresonant frequencies are relatively large. The ratios ofthe standard deviations with sound noise to those withoutsound noise are summarized in the last three columns.The standard deviations changed by factors up to dozens,with the greatest change being by a factor of 31.04 (forthe Y-axis of L3GD20).
Figures 6(a), 6(b), and 6(c) show the standard devia-tions of the raw data samples for each axis from the 12individual L3G4200D chips. The different L3G4200Dchips have different output characteristics because ofmanufacturing variances. However, every L3G4200Dchip has a peak in the range of 7,900 to 8,300 Hz. Toinvestigate what happens at these frequencies in more de-tail, the raw data samples for one L3G4200D gyroscopewith and without sound noise at 8,000 Hz were com-pared, as shown in Figure 6(d). This graph clearly showsthat resonances occur for all axes, and the amplitudes aredozens of times larger than the normal output. These am-plitudes are equivalent to the output produced by suddenand fast shaking of the gyroscope or the target drone’sbody by hands or rapidly changing winds. Raw datasamples of two other vulnerable gyroscopes, L3GD20and MPU6000, are shown in Figure 7. L3G4200D andMPU6000, two of the vulnerable gyroscopes in our ex-periments, were used in the target drones described in thenext section.
It should be noted that a speaker generates soundfrom a vibrating membrane fixed to the enclosure ofthe speaker, and thus vibration from the enclosure itselfwas unavoidable in the experiments. However, our ex-perimental results indicate that vibration had very littleeffect on the identification of the resonant frequenciesof the target gyroscopes. Because we tested all of thegyroscopes in the same environment, there should havebeen consistent resonance frequencies for all of the gy-roscopes if any enclosure vibration had influenced themotion of the gyroscopes. In addition, some of the gyro-scopes listed in Table 1 exhibited no resonance (i.e., al-most constant standard deviation), which would not have
8
USENIX Association 24th USENIX Security Symposium 889
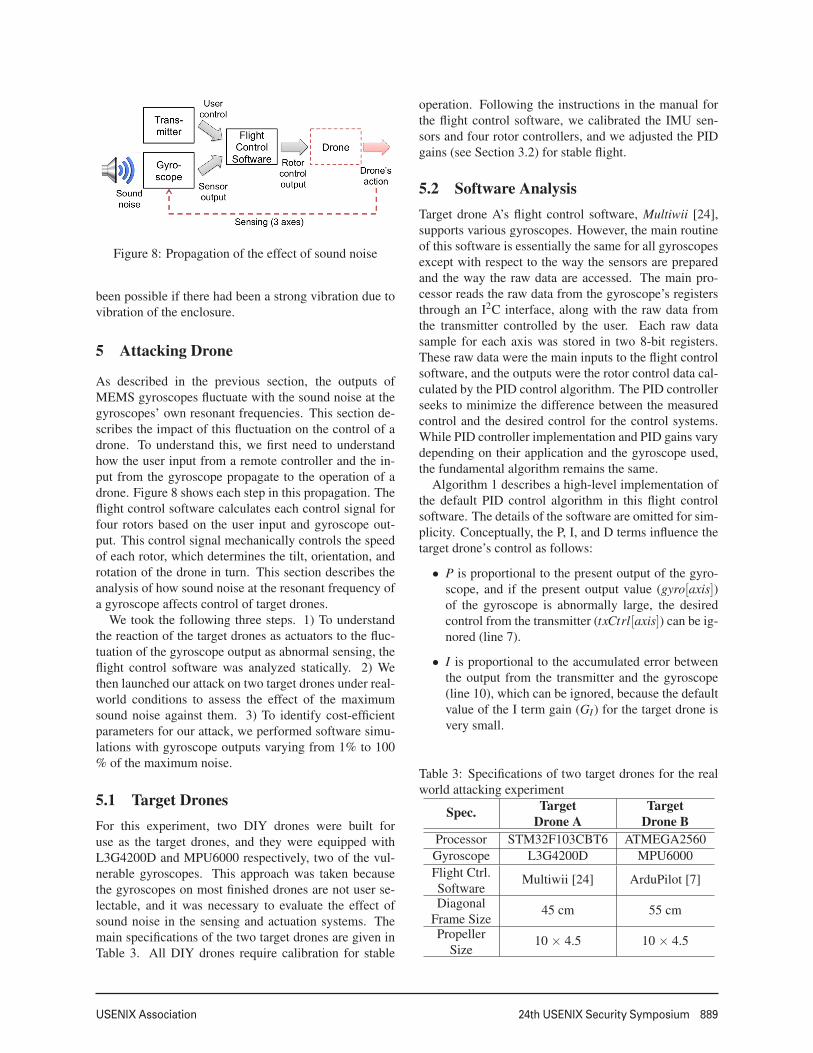
Figure 8: Propagation of the effect of sound noise
been possible if there had been a strong vibration due tovibration of the enclosure.
5 Attacking Drone
As described in the previous section, the outputs ofMEMS gyroscopes fluctuate with the sound noise at thegyroscopes’ own resonant frequencies. This section de-scribes the impact of this fluctuation on the control of adrone. To understand this, we first need to understandhow the user input from a remote controller and the in-put from the gyroscope propagate to the operation of adrone. Figure 8 shows each step in this propagation. Theflight control software calculates each control signal forfour rotors based on the user input and gyroscope out-put. This control signal mechanically controls the speedof each rotor, which determines the tilt, orientation, androtation of the drone in turn. This section describes theanalysis of how sound noise at the resonant frequency ofa gyroscope affects control of target drones.
We took the following three steps. 1) To understandthe reaction of the target drones as actuators to the fluc-tuation of the gyroscope output as abnormal sensing, theflight control software was analyzed statically. 2) Wethen launched our attack on two target drones under real-world conditions to assess the effect of the maximumsound noise against them. 3) To identify cost-efficientparameters for our attack, we performed software simu-lations with gyroscope outputs varying from 1% to 100% of the maximum noise.
5.1 Target DronesFor this experiment, two DIY drones were built foruse as the target drones, and they were equipped withL3G4200D and MPU6000 respectively, two of the vul-nerable gyroscopes. This approach was taken becausethe gyroscopes on most finished drones are not user se-lectable, and it was necessary to evaluate the effect ofsound noise in the sensing and actuation systems. Themain specifications of the two target drones are given inTable 3. All DIY drones require calibration for stable
operation. Following the instructions in the manual forthe flight control software, we calibrated the IMU sen-sors and four rotor controllers, and we adjusted the PIDgains (see Section 3.2) for stable flight.
5.2 Software AnalysisTarget drone A’s flight control software, Multiwii [24],supports various gyroscopes. However, the main routineof this software is essentially the same for all gyroscopesexcept with respect to the way the sensors are preparedand the way the raw data are accessed. The main pro-cessor reads the raw data from the gyroscope’s registersthrough an I2C interface, along with the raw data fromthe transmitter controlled by the user. Each raw datasample for each axis was stored in two 8-bit registers.These raw data were the main inputs to the flight controlsoftware, and the outputs were the rotor control data cal-culated by the PID control algorithm. The PID controllerseeks to minimize the difference between the measuredcontrol and the desired control for the control systems.While PID controller implementation and PID gains varydepending on their application and the gyroscope used,the fundamental algorithm remains the same.
Algorithm 1 describes a high-level implementation ofthe default PID control algorithm in this flight controlsoftware. The details of the software are omitted for sim-plicity. Conceptually, the P, I, and D terms influence thetarget drone’s control as follows:
• P is proportional to the present output of the gyro-scope, and if the present output value (gyro[axis])of the gyroscope is abnormally large, the desiredcontrol from the transmitter (txCtrl[axis]) can be ig-nored (line 7).
• I is proportional to the accumulated error betweenthe output from the transmitter and the gyroscope(line 10), which can be ignored, because the defaultvalue of the I term gain (GI) for the target drone isvery small.
Table 3: Specifications of two target drones for the realworld attacking experiment
Spec. TargetDrone A
TargetDrone B
Processor STM32F103CBT6 ATMEGA2560Gyroscope L3G4200D MPU6000Flight Ctrl.Software
Multiwii [24] ArduPilot [7]
DiagonalFrame Size
45 cm 55 cm
PropellerSize
10 × 4.5 10 × 4.5
9
890 24th USENIX Security Symposium USENIX Association
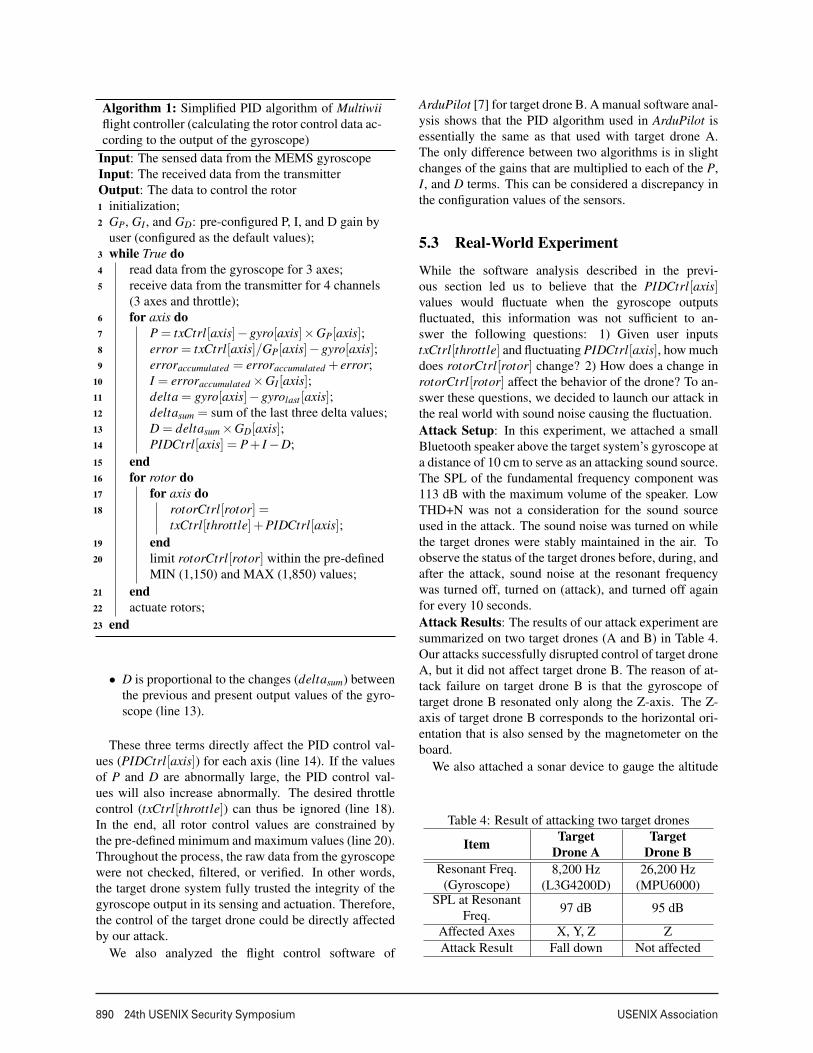
Algorithm 1: Simplified PID algorithm of Multiwiiflight controller (calculating the rotor control data ac-cording to the output of the gyroscope)
Input: The sensed data from the MEMS gyroscopeInput: The received data from the transmitterOutput: The data to control the rotor1 initialization;2 GP, GI , and GD: pre-configured P, I, and D gain by
user (configured as the default values);3 while True do4 read data from the gyroscope for 3 axes;5 receive data from the transmitter for 4 channels
(3 axes and throttle);6 for axis do7 P = txCtrl[axis]−gyro[axis]×GP[axis];8 error = txCtrl[axis]/GP[axis]−gyro[axis];9 erroraccumulated = erroraccumulated + error;
10 I = erroraccumulated ×GI [axis];11 delta = gyro[axis]−gyrolast [axis];12 deltasum = sum of the last three delta values;13 D = deltasum ×GD[axis];14 PIDCtrl[axis] = P+ I −D;15 end16 for rotor do17 for axis do18 rotorCtrl[rotor] =
txCtrl[throttle]+PIDCtrl[axis];19 end20 limit rotorCtrl[rotor] within the pre-defined
MIN (1,150) and MAX (1,850) values;21 end22 actuate rotors;23 end
• D is proportional to the changes (deltasum) betweenthe previous and present output values of the gyro-scope (line 13).
These three terms directly affect the PID control val-ues (PIDCtrl[axis]) for each axis (line 14). If the valuesof P and D are abnormally large, the PID control val-ues will also increase abnormally. The desired throttlecontrol (txCtrl[throttle]) can thus be ignored (line 18).In the end, all rotor control values are constrained bythe pre-defined minimum and maximum values (line 20).Throughout the process, the raw data from the gyroscopewere not checked, filtered, or verified. In other words,the target drone system fully trusted the integrity of thegyroscope output in its sensing and actuation. Therefore,the control of the target drone could be directly affectedby our attack.
We also analyzed the flight control software of
ArduPilot [7] for target drone B. A manual software anal-ysis shows that the PID algorithm used in ArduPilot isessentially the same as that used with target drone A.The only difference between two algorithms is in slightchanges of the gains that are multiplied to each of the P,I, and D terms. This can be considered a discrepancy inthe configuration values of the sensors.
5.3 Real-World Experiment
While the software analysis described in the previ-ous section led us to believe that the PIDCtrl[axis]values would fluctuate when the gyroscope outputsfluctuated, this information was not sufficient to an-swer the following questions: 1) Given user inputstxCtrl[throttle] and fluctuating PIDCtrl[axis], how muchdoes rotorCtrl[rotor] change? 2) How does a change inrotorCtrl[rotor] affect the behavior of the drone? To an-swer these questions, we decided to launch our attack inthe real world with sound noise causing the fluctuation.Attack Setup: In this experiment, we attached a smallBluetooth speaker above the target system’s gyroscope ata distance of 10 cm to serve as an attacking sound source.The SPL of the fundamental frequency component was113 dB with the maximum volume of the speaker. LowTHD+N was not a consideration for the sound sourceused in the attack. The sound noise was turned on whilethe target drones were stably maintained in the air. Toobserve the status of the target drones before, during, andafter the attack, sound noise at the resonant frequencywas turned off, turned on (attack), and turned off againfor every 10 seconds.Attack Results: The results of our attack experiment aresummarized on two target drones (A and B) in Table 4.Our attacks successfully disrupted control of target droneA, but it did not affect target drone B. The reason of at-tack failure on target drone B is that the gyroscope oftarget drone B resonated only along the Z-axis. The Z-axis of target drone B corresponds to the horizontal ori-entation that is also sensed by the magnetometer on theboard.
We also attached a sonar device to gauge the altitude
Table 4: Result of attacking two target drones
Item TargetDrone A
TargetDrone B
Resonant Freq.(Gyroscope)
8,200 Hz(L3G4200D)
26,200 Hz(MPU6000)
SPL at ResonantFreq. 97 dB 95 dB
Affected Axes X, Y, Z ZAttack Result Fall down Not affected
10
USENIX Association 24th USENIX Security Symposium 891
(a) Raw data samples of the gyroscope (b) Received data samples from the transmitter
(c) Rotor control data samples (from the flight control software) (d) Altitude data samples from sonar
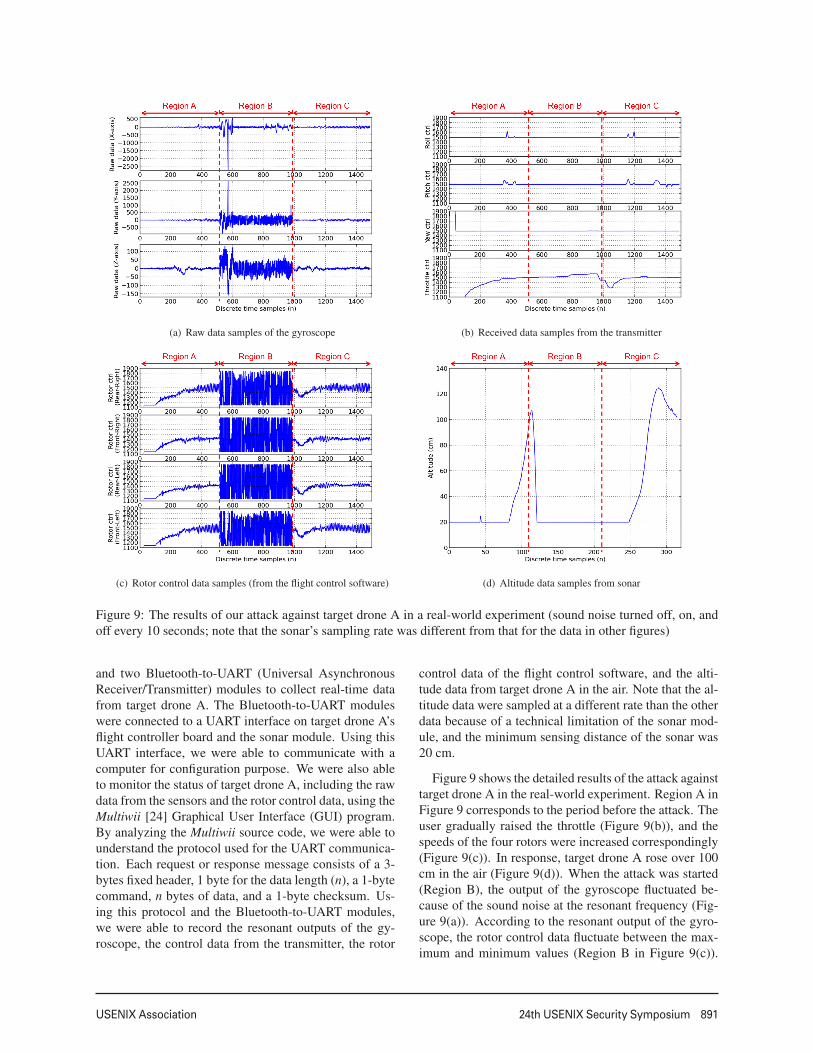
Figure 9: The results of our attack against target drone A in a real-world experiment (sound noise turned off, on, andoff every 10 seconds; note that the sonar’s sampling rate was different from that for the data in other figures)
and two Bluetooth-to-UART (Universal AsynchronousReceiver/Transmitter) modules to collect real-time datafrom target drone A. The Bluetooth-to-UART moduleswere connected to a UART interface on target drone A’sflight controller board and the sonar module. Using thisUART interface, we were able to communicate with acomputer for configuration purpose. We were also ableto monitor the status of target drone A, including the rawdata from the sensors and the rotor control data, using theMultiwii [24] Graphical User Interface (GUI) program.By analyzing the Multiwii source code, we were able tounderstand the protocol used for the UART communica-tion. Each request or response message consists of a 3-bytes fixed header, 1 byte for the data length (n), a 1-bytecommand, n bytes of data, and a 1-byte checksum. Us-ing this protocol and the Bluetooth-to-UART modules,we were able to record the resonant outputs of the gy-roscope, the control data from the transmitter, the rotor
control data of the flight control software, and the alti-tude data from target drone A in the air. Note that the al-titude data were sampled at a different rate than the otherdata because of a technical limitation of the sonar mod-ule, and the minimum sensing distance of the sonar was20 cm.
Figure 9 shows the detailed results of the attack againsttarget drone A in the real-world experiment. Region A inFigure 9 corresponds to the period before the attack. Theuser gradually raised the throttle (Figure 9(b)), and thespeeds of the four rotors were increased correspondingly(Figure 9(c)). In response, target drone A rose over 100cm in the air (Figure 9(d)). When the attack was started(Region B), the output of the gyroscope fluctuated be-cause of the sound noise at the resonant frequency (Fig-ure 9(a)). According to the resonant output of the gyro-scope, the rotor control data fluctuate between the max-imum and minimum values (Region B in Figure 9(c)).
11
892 24th USENIX Security Symposium USENIX Association
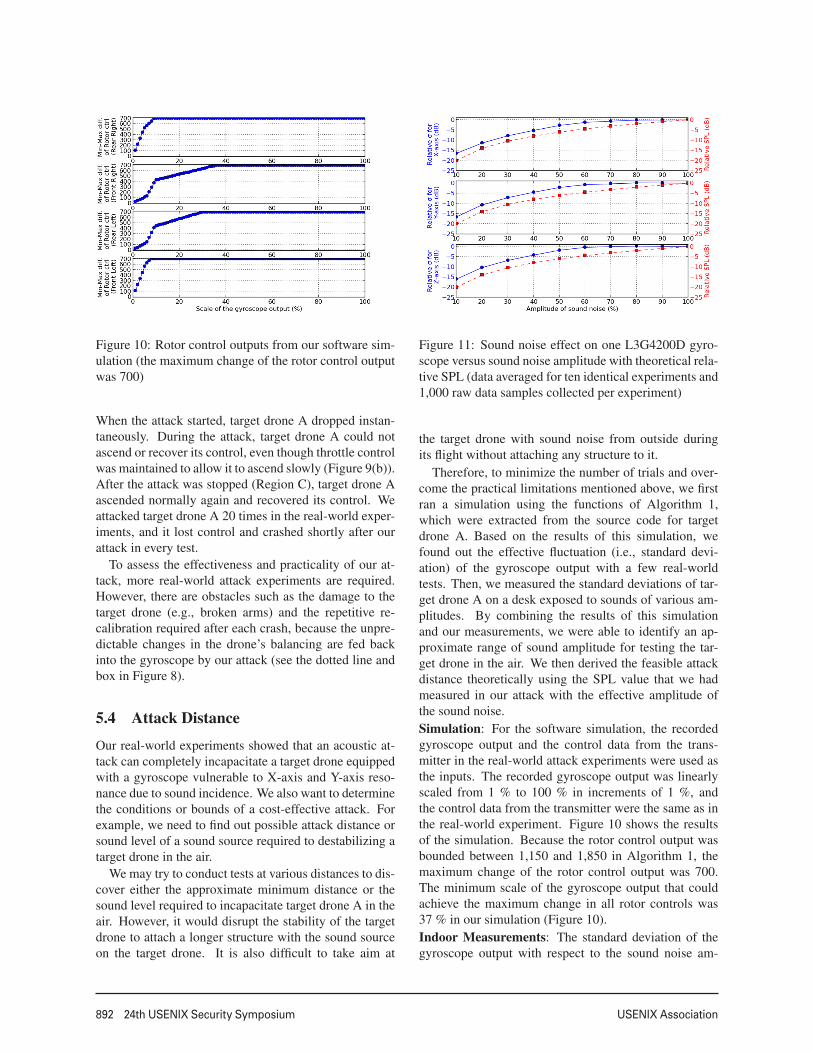
Figure 10: Rotor control outputs from our software sim-ulation (the maximum change of the rotor control outputwas 700)
When the attack started, target drone A dropped instan-taneously. During the attack, target drone A could notascend or recover its control, even though throttle controlwas maintained to allow it to ascend slowly (Figure 9(b)).After the attack was stopped (Region C), target drone Aascended normally again and recovered its control. Weattacked target drone A 20 times in the real-world exper-iments, and it lost control and crashed shortly after ourattack in every test.
To assess the effectiveness and practicality of our at-tack, more real-world attack experiments are required.However, there are obstacles such as the damage to thetarget drone (e.g., broken arms) and the repetitive re-calibration required after each crash, because the unpre-dictable changes in the drone’s balancing are fed backinto the gyroscope by our attack (see the dotted line andbox in Figure 8).
5.4 Attack Distance
Our real-world experiments showed that an acoustic at-tack can completely incapacitate a target drone equippedwith a gyroscope vulnerable to X-axis and Y-axis reso-nance due to sound incidence. We also want to determinethe conditions or bounds of a cost-effective attack. Forexample, we need to find out possible attack distance orsound level of a sound source required to destabilizing atarget drone in the air.
We may try to conduct tests at various distances to dis-cover either the approximate minimum distance or thesound level required to incapacitate target drone A in theair. However, it would disrupt the stability of the targetdrone to attach a longer structure with the sound sourceon the target drone. It is also difficult to take aim at
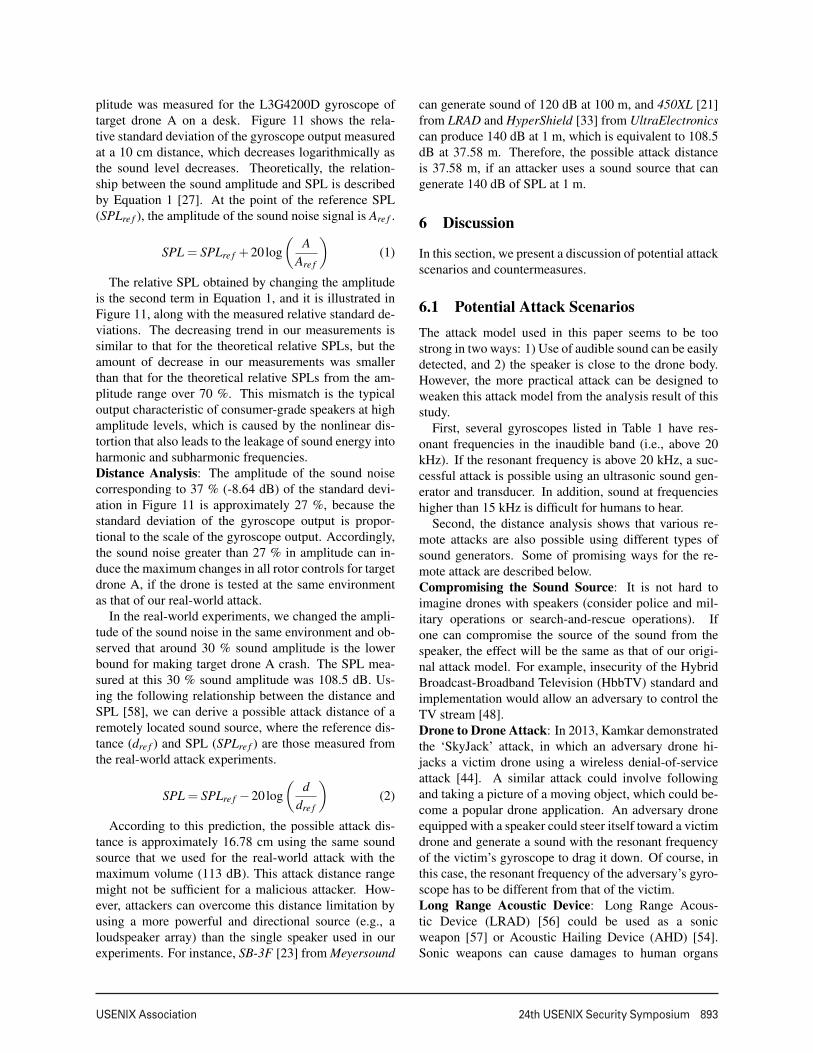
Figure 11: Sound noise effect on one L3G4200D gyro-scope versus sound noise amplitude with theoretical rela-tive SPL (data averaged for ten identical experiments and1,000 raw data samples collected per experiment)
the target drone with sound noise from outside duringits flight without attaching any structure to it.
Therefore, to minimize the number of trials and over-come the practical limitations mentioned above, we firstran a simulation using the functions of Algorithm 1,which were extracted from the source code for targetdrone A. Based on the results of this simulation, wefound out the effective fluctuation (i.e., standard devi-ation) of the gyroscope output with a few real-worldtests. Then, we measured the standard deviations of tar-get drone A on a desk exposed to sounds of various am-plitudes. By combining the results of this simulationand our measurements, we were able to identify an ap-proximate range of sound amplitude for testing the tar-get drone in the air. We then derived the feasible attackdistance theoretically using the SPL value that we hadmeasured in our attack with the effective amplitude ofthe sound noise.Simulation: For the software simulation, the recordedgyroscope output and the control data from the trans-mitter in the real-world attack experiments were used asthe inputs. The recorded gyroscope output was linearlyscaled from 1 % to 100 % in increments of 1 %, andthe control data from the transmitter were the same as inthe real-world experiment. Figure 10 shows the resultsof the simulation. Because the rotor control output wasbounded between 1,150 and 1,850 in Algorithm 1, themaximum change of the rotor control output was 700.The minimum scale of the gyroscope output that couldachieve the maximum change in all rotor controls was37 % in our simulation (Figure 10).Indoor Measurements: The standard deviation of thegyroscope output with respect to the sound noise am-
12
USENIX Association 24th USENIX Security Symposium 893
plitude was measured for the L3G4200D gyroscope oftarget drone A on a desk. Figure 11 shows the rela-tive standard deviation of the gyroscope output measuredat a 10 cm distance, which decreases logarithmically asthe sound level decreases. Theoretically, the relation-ship between the sound amplitude and SPL is describedby Equation 1 [27]. At the point of the reference SPL(SPLre f ), the amplitude of the sound noise signal is Are f .
SPL = SPLre f +20log(
AAre f
)(1)
The relative SPL obtained by changing the amplitudeis the second term in Equation 1, and it is illustrated inFigure 11, along with the measured relative standard de-viations. The decreasing trend in our measurements issimilar to that for the theoretical relative SPLs, but theamount of decrease in our measurements was smallerthan that for the theoretical relative SPLs from the am-plitude range over 70 %. This mismatch is the typicaloutput characteristic of consumer-grade speakers at highamplitude levels, which is caused by the nonlinear dis-tortion that also leads to the leakage of sound energy intoharmonic and subharmonic frequencies.Distance Analysis: The amplitude of the sound noisecorresponding to 37 % (-8.64 dB) of the standard devi-ation in Figure 11 is approximately 27 %, because thestandard deviation of the gyroscope output is propor-tional to the scale of the gyroscope output. Accordingly,the sound noise greater than 27 % in amplitude can in-duce the maximum changes in all rotor controls for targetdrone A, if the drone is tested at the same environmentas that of our real-world attack.
In the real-world experiments, we changed the ampli-tude of the sound noise in the same environment and ob-served that around 30 % sound amplitude is the lowerbound for making target drone A crash. The SPL mea-sured at this 30 % sound amplitude was 108.5 dB. Us-ing the following relationship between the distance andSPL [58], we can derive a possible attack distance of aremotely located sound source, where the reference dis-tance (dre f ) and SPL (SPLre f ) are those measured fromthe real-world attack experiments.
SPL = SPLre f −20log(
ddre f
)(2)
According to this prediction, the possible attack dis-tance is approximately 16.78 cm using the same soundsource that we used for the real-world attack with themaximum volume (113 dB). This attack distance rangemight not be sufficient for a malicious attacker. How-ever, attackers can overcome this distance limitation byusing a more powerful and directional source (e.g., aloudspeaker array) than the single speaker used in ourexperiments. For instance, SB-3F [23] from Meyersound
can generate sound of 120 dB at 100 m, and 450XL [21]from LRAD and HyperShield [33] from UltraElectronicscan produce 140 dB at 1 m, which is equivalent to 108.5dB at 37.58 m. Therefore, the possible attack distanceis 37.58 m, if an attacker uses a sound source that cangenerate 140 dB of SPL at 1 m.
6 Discussion
In this section, we present a discussion of potential attackscenarios and countermeasures.
6.1 Potential Attack ScenariosThe attack model used in this paper seems to be toostrong in two ways: 1) Use of audible sound can be easilydetected, and 2) the speaker is close to the drone body.However, the more practical attack can be designed toweaken this attack model from the analysis result of thisstudy.
First, several gyroscopes listed in Table 1 have res-onant frequencies in the inaudible band (i.e., above 20kHz). If the resonant frequency is above 20 kHz, a suc-cessful attack is possible using an ultrasonic sound gen-erator and transducer. In addition, sound at frequencieshigher than 15 kHz is difficult for humans to hear.
Second, the distance analysis shows that various re-mote attacks are also possible using different types ofsound generators. Some of promising ways for the re-mote attack are described below.Compromising the Sound Source: It is not hard toimagine drones with speakers (consider police and mil-itary operations or search-and-rescue operations). Ifone can compromise the source of the sound from thespeaker, the effect will be the same as that of our origi-nal attack model. For example, insecurity of the HybridBroadcast-Broadband Television (HbbTV) standard andimplementation would allow an adversary to control theTV stream [48].Drone to Drone Attack: In 2013, Kamkar demonstratedthe ‘SkyJack’ attack, in which an adversary drone hi-jacks a victim drone using a wireless denial-of-serviceattack [44]. A similar attack could involve followingand taking a picture of a moving object, which could be-come a popular drone application. An adversary droneequipped with a speaker could steer itself toward a victimdrone and generate a sound with the resonant frequencyof the victim’s gyroscope to drag it down. Of course, inthis case, the resonant frequency of the adversary’s gyro-scope has to be different from that of the victim.Long Range Acoustic Device: Long Range Acous-tic Device (LRAD) [56] could be used as a sonicweapon [57] or Acoustic Hailing Device (AHD) [54].Sonic weapons can cause damages to human organs
13
894 24th USENIX Security Symposium USENIX Association
by inducing intense sound waves at certain frequencies,even if the sound source is not in contact with oppo-nents [41, 53]. AHDs are specially designed loudspeak-ers that communicate over longer distances than normalloudspeakers [21, 23, 33]. In both cases, the most im-portant requirement is a high SPL in a specific frequencyband. Obviously, these technologies could be used to in-crease the range of our attack.Sonic Wall/Zone: Because drones can be made small,they can be difficult to detect using radar. Therefore, itmight be desirable to enforce no-fly zones for drones, asillustrated by recent drone incidents [11, 34]. One mightconsider building a sonic wall or a zone that radiates con-tinuous sound noise (at various frequencies) in a specificarea to enforce the no-fly zone.
6.2 Countermeasures
Several researches that have been conducted to improvethe performance of MEMS gyroscopes in harsh acousticenvironments are discussed below.Physical Isolation: The simplest way to mitigate ourattack is to provide physical isolation from the soundnoise. This is the same concept as shielding againstElectro Magnetic Interference (EMI). For example, theiPhone 5S, which is equipped with an L3G4200D gyro-scope [20], would not be affected by our attack, becauseof the compact casing of the hardware circuit. Surround-ing the gyroscope with foam would also be a simple andinexpensive countermeasure. Foam that is 1 inch thickhas approximately 120 dB insertion loss in SPL [49].
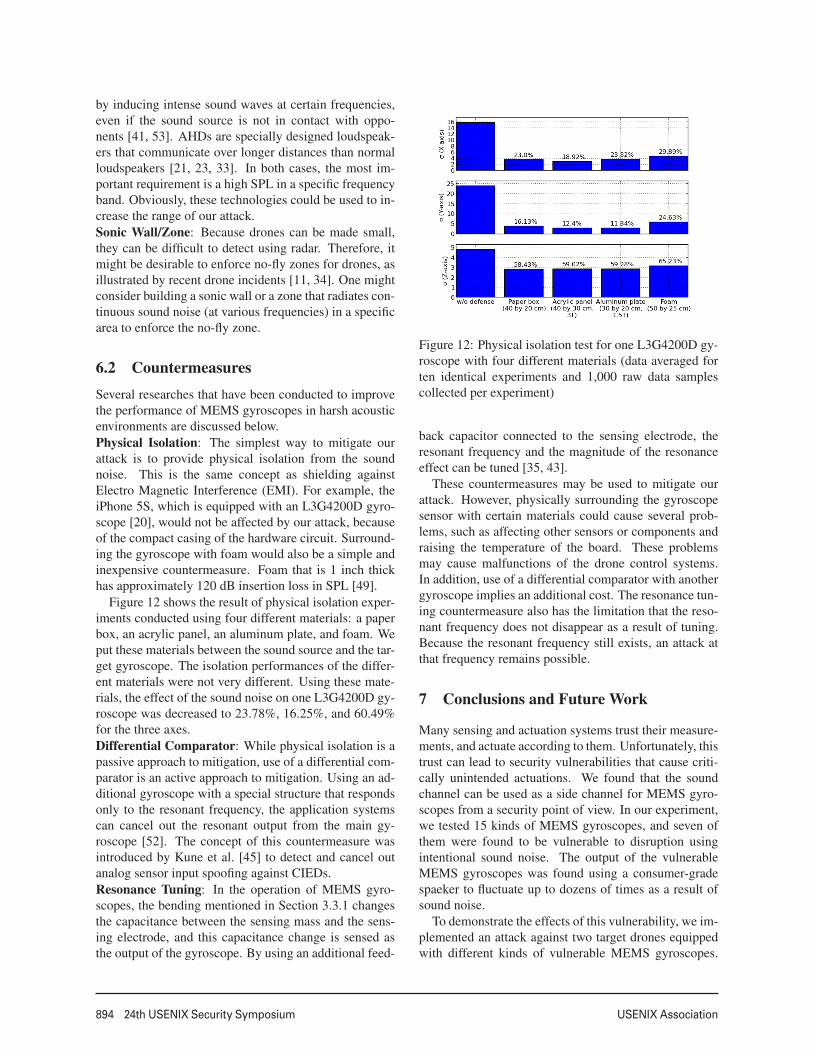
Figure 12 shows the result of physical isolation exper-iments conducted using four different materials: a paperbox, an acrylic panel, an aluminum plate, and foam. Weput these materials between the sound source and the tar-get gyroscope. The isolation performances of the differ-ent materials were not very different. Using these mate-rials, the effect of the sound noise on one L3G4200D gy-roscope was decreased to 23.78%, 16.25%, and 60.49%for the three axes.Differential Comparator: While physical isolation is apassive approach to mitigation, use of a differential com-parator is an active approach to mitigation. Using an ad-ditional gyroscope with a special structure that respondsonly to the resonant frequency, the application systemscan cancel out the resonant output from the main gy-roscope [52]. The concept of this countermeasure wasintroduced by Kune et al. [45] to detect and cancel outanalog sensor input spoofing against CIEDs.Resonance Tuning: In the operation of MEMS gyro-scopes, the bending mentioned in Section 3.3.1 changesthe capacitance between the sensing mass and the sens-ing electrode, and this capacitance change is sensed asthe output of the gyroscope. By using an additional feed-
Figure 12: Physical isolation test for one L3G4200D gy-roscope with four different materials (data averaged forten identical experiments and 1,000 raw data samplescollected per experiment)
back capacitor connected to the sensing electrode, theresonant frequency and the magnitude of the resonanceeffect can be tuned [35, 43].
These countermeasures may be used to mitigate ourattack. However, physically surrounding the gyroscopesensor with certain materials could cause several prob-lems, such as affecting other sensors or components andraising the temperature of the board. These problemsmay cause malfunctions of the drone control systems.In addition, use of a differential comparator with anothergyroscope implies an additional cost. The resonance tun-ing countermeasure also has the limitation that the reso-nant frequency does not disappear as a result of tuning.Because the resonant frequency still exists, an attack atthat frequency remains possible.
7 Conclusions and Future Work
Many sensing and actuation systems trust their measure-ments, and actuate according to them. Unfortunately, thistrust can lead to security vulnerabilities that cause criti-cally unintended actuations. We found that the soundchannel can be used as a side channel for MEMS gyro-scopes from a security point of view. In our experiment,we tested 15 kinds of MEMS gyroscopes, and seven ofthem were found to be vulnerable to disruption usingintentional sound noise. The output of the vulnerableMEMS gyroscopes was found using a consumer-gradespaeker to fluctuate up to dozens of times as a result ofsound noise.
To demonstrate the effects of this vulnerability, we im-plemented an attack against two target drones equippedwith different kinds of vulnerable MEMS gyroscopes.
14
USENIX Association 24th USENIX Security Symposium 895
As a result of a firmware analysis of the target dronesand a simulation of the flight control software output,the control signals of four rotors were found to fluctu-ate up to the maximum value and down to the minimumvalue by the injected gyroscope output. One of the targetdrones, which was equipped with with a small speaker,lost control and crashed in all 20 real-world attack exper-iments. We found in these experiments that an attackerwith only 30% of the amplitude of the maximum soundnoise could achieve almost the same effect at the samedistance.
The countermeasures that are mentioned in the lastsubsection have limitations and require hardware modi-fications and additional materials. Because these mitiga-tions would increase the production costs, it is necessaryto develop a low-cost, software-based defense mecha-nism against sensor attacks for various types of embed-ded devices.
Some MEMS gyroscopes are integrated with ac-celerometers in the same IC package. In our experi-ments, we found that some accelerometers are also af-fected by high-power sound noise at certain frequencies.It would be interesting to further investigate this finding.
Acknowledgements
This work was supported by Samsung Research Fund-ing Center of Samsung Electronics under Project Num-ber SRFC-TB1403-01.
References[1] A Critical Review of MEMS Gyroscopes Technology and Com-
mercialization Status. http://invensense.com/mems/gyro/documents/whitepapers/MEMSGyroComp.pdf.
[2] Alibaba begins drone delivery trials in China. http://www.
bbc.com/news/technology-31129804.
[3] Amazon Prime Air (Amazon.com, Inc.). http://www.amazon.com/b?node=8037720011.
[4] Analog Devices ADXRS610 datasheet. http://www.
analog.com/media/en/technical-documentation/
data-sheets/ADXRS610.pdf.
[5] AR.Drone (Parrot, Inc). http://ardrone2.parrot.com/.
[6] Arduino UNO. http://arduino.cc/.
[7] ArduPilot (open-source drone project). https://github.com/diydrones/ardupilot.
[8] Bruel & Kjær Microphone Unit Type 4189-A-021.http://www.bksv.com/Products/transducers/
acoustic/microphones/microphone-cartridges/4189.
[9] Design and Analysis of MEMS Gyroscopes (Tutorial atIEEE Sensor 2013). http://ieee-sensors2013.org/
sites/ieee-sensors2013.org/files/Serrano_Slides_
Gyros2.pdf.
[10] Everything about STMicroelectronics’ 3-axis digital MEMSgyroscopes. http://www.st.com/web/en/resource/
technical/document/technical_article/DM00034730.
pdf.
[11] German pirate party uses drone to crash angela merkel event.http://www.slate.com/blogs/future_tense/2013/
09/18/german_pirate_party_uses_drone_to_crash_
event_with_chancellor_angela_merkel.html.
[12] Hi-Vi B1S Full Range Loudspeaker. https://www.
madisoundspeakerstore.com/approx-1-fullrange/
hi-vi-b1s-full-range/.
[13] InvenSense IMU3000 datasheet. http://www.invensense.
com/mems/gyro/documents/PS-IMU-3000A.pdf.
[14] InvenSense ITG3200 datasheet. http://www.invensense.
com/mems/gyro/documents/EB-ITG-3200-00-01.1.pdf.
[15] InvenSense IXZ650 datasheet. http://invensense.com/
mems/gyro/documents/PS-IXZ-0650B-00-01.pdf.
[16] InvenSense MPU3050 datasheet. http://www.invensense.
com/mems/gyro/documents/PS-MPU-3000A.pdf.
[17] InvenSense MPU6000/6050 datasheet. http:
//www.invensense.com/mems/gyro/documents/
PS-MPU-6000A-00v3.4.pdf.
[18] InvenSense MPU6500 datasheet. http://www.invensense.
com/mems/gyro/documents/PS-MPU-6500A-01.pdf.
[19] InvenSense MPU9150 datasheet. http://dlnmh9ip6v2uc.
cloudfront.net/datasheets/Sensors/IMU/
PS-MPU-9150A.pdf.
[20] iPhone 5s Teardown. https://www.ifixit.com/Teardown/
iPhone+5s+Teardown/17383.
[21] LRAD 450XL datasheet. http://www.lradx.com/
wp-content/uploads/2015/05/LRAD_Datasheet_450XL.
pdf.
[22] Market share information of MEMS gyroscope in 2013(page 17). http://www.semiconwest.org/sites/
semiconwest.org/files/data14/docs/SW2014_JCEloy_
YoleDeveloppement_0.pdf.
[23] Meyersound SB-3F datasheet. http://www.meyersound.
com/sites/default/files/sb-3f_ppi.pdf.
[24] Multiwii (open-source drone project). https://github.com/
multiwii/baseflight and https://code.google.com/p/
multiwii/.
[25] Murata ENC-03MB datasheet. http://www.mouser.com/
catalog/specsheets/ENC-03M_ref.pdf.
[26] National Instruments USB-4431, Sound and Vibration Data Ac-quisition Instrument. http://www.ni.com/pdf/products/
us/cat_usb4431.pdf.
[27] Relative Sound Pressure according to Amplitude. http://www.indiana.edu/~emusic/acoustics/amplitude.htm.
[28] STMicroelectronics L3G4200D datasheet. http:
//www.st.com/web/en/resource/technical/document/
datasheet/CD00265057.pdf.
[29] STMicroelectronics L3GD20 datasheet. http://www.st.com/st-web-ui/static/active/en/resource/technical/
document/datasheet/DM00036465.pdf.
[30] STMicroelectronics LPR5150AL datasheet. http:
//www.st.com/web/en/resource/technical/document/
datasheet/CD00237211.pdf.
[31] STMicroelectronics LPY503AL datasheet. http:
//www.st.com/web/en/resource/technical/document/
datasheet/CD00237199.pdf.
[32] STMicroelectronics LSM330 datasheet. http://www.st.com/web/en/resource/technical/document/datasheet/
DM00059856.pdf.
15
896 24th USENIX Security Symposium USENIX Association
[33] UltraElectronics HyperShield datasheet. http:
//www.ultra-hyperspike.com/Data/Pages/
26fa8e2abe074313d60fe15a9af35440-HyperShield_
Dat_Sheet.pdf.
[34] White house drone crash described as a u.s. workersdrunken lark. http://www.nytimes.com/2015/01/28/us/
white-house-drone.html.
[35] ADAMS, S., BERTSCH, F., SHAW, K., HARTWELL, P., MAC-DONALD, N. C., AND MOON, F. Capacitance Based TunableMicromechanical Resonators. In International Conference onSolid-State Sensors and Actuators (1995).
[36] CAI, L., AND CHEN, H. On the practicality of motion basedkeystroke inference attack. In Trust and Trustworthy Computing.Springer Berlin Heidelberg, 2012.
[37] CASTRO, S., DEAN, R., ROTH, G., FLOWERS, G. T., ANDGRANTHAM, B. Influence of acoustic noise on the dynamic per-formance of MEMS gyroscopes. In International MechanicalEngineering Congress and Exposition (2007), American Societyof Mechanical Engineers.
[38] DEAN, R. N., CASTRO, S. T., FLOWERS, G. T., ROTH, G.,AHMED, A., HODEL, A. S., GRANTHAM, B. E., BITTLE,D. A., AND BRUNSCH, J. P. A characterization of the perfor-mance of a MEMS gyroscope in acoustically harsh environments.IEEE Transactions on Industrial Electronics 58 (2011).
[39] DEAN, R. N., FLOWERS, G. T., HODEL, A. S., ROTH, G.,CASTRO, S., ZHOU, R., MOREIRA, A., AHMED, A., RIFKI,R., GRANTHAM, B. E., ET AL. On the degradation of MEMSgyroscope performance in the presence of high power acousticnoise. In IEEE International Symposium on Industrial Electron-ics (2007).
[40] DUC, N. M., AND MINH, B. Q. Your face is not your passwordface authentication bypassing Lenovo–Asus–Toshiba. Black HatBriefings (2009).
[41] FOWLKES, J. B., AND HOLLAND, C. K. Section 4: Bioef-fects in tissues with gas bodies. Journal of ultrasound in medicine19 (2000).
[42] GALBALLY, J., CAPPELLI, R., LUMINI, A., MALTONI, D.,AND FIERREZ, J. Fake fingertip generation from a minutiae tem-plate. In International Conference on Pattern Recognition (2008).
[43] JEONG, C., SEOK, S., LEE, B., KIM, H., AND CHUN, K. Astudy on resonant frequency and Q factor tunings for MEMS vi-bratory gyroscopes. Journal of Micromechanics and Microengi-neering 14 (2004).
[44] KAMKAR, S. SkyJack. http://samy.pl/skyjack/, 2013.
[45] KUNE, D. F., BACKES, J., CLARK, S. S., KRAMER, D.,REYNOLDS, M., FU, K., KIM, Y., AND XU, W. Ghost talk:mitigating EMI signal injection attacks against analog sensors.In IEEE Symposium on Security and Privacy (2013).
[46] MATSUMOTO, T., MATSUMOTO, H., YAMADA, K., ANDHOSHINO, S. Impact of artificial gummy fingers on fingerprintsystems. In Electronic Imaging (2002), International Society forOptics and Photonics.
[47] MILUZZO, E., VARSHAVSKY, A., BALAKRISHNAN, S., ANDCHOUDHURY, R. R. Tapprints: your finger taps have finger-prints. In Proceedings of the ACM international conference onMobile Systems, Applications, and Services (2012).
[48] OREN, Y., AND KEROMYTIS, A. D. From the aether to theethernet–attacking the internet using broadcast digital television.In Proceedings of the USENIX Security Symposium (2014).
[49] ROTH, G. Simulation of the Effects of Acoustic Noise on MEMSGyroscopes. Master’s thesis, Auburn University, 2009.
[50] SAMLAND, F., FRUTH, J., HILDEBRANDT, M., HOPPE, T.,AND DITTMANN, J. AR.Drone: security threat analysis andexemplary attack to track persons. In Society of Photo-OpticalInstrumentation Engineers Conference Series (2012).
[51] SHOUKRY, Y., MARTIN, P., TABUADA, P., AND SRIVASTAVA,M. Non-invasive spoofing attacks for anti-lock braking systems.In Cryptographic Hardware and Embedded Systems. Springer,2013.
[52] SOOBRAMANEY, P. Mitigation of the Effects of High Levelsof High-Frequency Noise on MEMS Gyroscopes. PhD thesis,Auburn University, 2013.
[53] TANDY, V., AND LAWRENCE, T. R. The ghost in the machine.Journal of the Society for Psychical Research 62 (1998).
[54] WIKIPEDIA. Acoustic hailing device — wikipedia, the free en-cyclopedia, 2015. [Online; accessed 17-June-2015].
[55] WIKIPEDIA. Inertial measurement unit — wikipedia, the freeencyclopedia, 2015. [Online; accessed 17-June-2015].
[56] WIKIPEDIA. Long range acoustic device — wikipedia, the freeencyclopedia, 2015. [Online; accessed 17-June-2015].
[57] WIKIPEDIA. Sonic weapon — wikipedia, the free encyclopedia,2015. [Online; accessed 17-June-2015].
[58] WIKIPEDIA. Sound pressure — wikipedia, the free encyclopedia,2015. [Online; accessed 17-June-2015].
[59] YAN MICHALEVSKY AND DAN BONEH AND GABI NAKIBLY.Gyrophone: Recognizing speech from gyroscope signals. In Pro-ceedings of the USENIX Security Symposium (2014).
16