Rocking and Sliding Response in the 2014 Cephalonia...
9
1 st International Conference on Natural Hazards & Infrastructure 28-30 June, 2016, Chania, Greece Rocking and Sliding Potential of the 2014 Cephalonia, Greece Earthquakes E. Garini 1 and G. Gazetas Soil Mechanics Laboratory, National Technical University, Athens, Greece ABSTRACT A twin event earthquake sequence of an Mw6.1 on January 26th and an Mw6.0 eight days later on February 3rd shook the island of Cephalonia, triggering damage in structural and harbor infrastructure. The strongest three recordings of the double event are analyzed in this paper: the Chavriata, Lixouri and Argostoli accelerograms. The Lixouri record bears the effects of near-fault directivity, containing acceleration pulses in its normal to the fault (EW) component. The most extensive damage occurred in the numerous cemeteries of the region, with tombstone topplings and large slippages being the most conspicuous. Symmetric and asymmetric sliding of a block resting through Coulomb friction on horizontal or inclined planes and rocking–overturning of rigid blocks, when excited at their base by these records, are studied in the paper. The rocking systems are modeled in 3D, as rigid blocks resting through Coulomb friction on horizontal base. The latter is excited by three component accelerations: two in the horizontal directions and one in the vertical. The rocking, sliding, twisting and overturning of such rigid systems offer a strong indication of the ‘destructiveness potential’ of ground motions, which explain the cemeteries extensive damage. Unilateral and bilateral excitations are studied and the role of vertical acceleration is elucidated. Keywords: 3D rocking, sliding, forward directivity, toppling INTRODUCTION: THE CEPHALONIA DOUBLET EARTHQUAKE RECORDS Cephalonia has suffered numerous earthquakes of large magnitude, 6.0 < MS < 7.5 in the last 500 years (Papazachos & Papazachou, 1997). The seismic sequence of 1953 is the most catastrophic earthquake event ever in Greece, flattening 85 per cent of buildings on the island and killing 500. Thirty years after the destructive sequence of 1953, in 1983 another seismic succession was occurred. After thirty-one years from the sequence of 1983, in 2014, another earthquake-chain had struck in Cephalonia. The first mainshock of Mw = 6.1 occurred on 26 January 2014, in the western part of Cephalonia island. The second mainshock of Mw = 6.0 followed on 3 February, just seven days after the first one. The epicenters of both events are shown in Figure 1. The seismic doublet inflict moderate damage in structural infrastructure, as well as several landslides, rock falls, ground and road crocking, severe liquefaction and quay-wall failures (GEER, 2014). Our team participated in the GEER reconnaissance mission to Cephalonia. In contrast with the overall satisfactory performance of domestic buildings (which were designed with the highest in Greece seismic acceleration of 0.36 g), all the eighteen cemeteries of the triggered region of Paliki (western Cephalonia peninsula) were extensively damaged. Toppling of headstones, breaking of covering tomb slabs, sliding and uplifting of heavy marble ornaments and vases were observed. The extent of the damage in the investigated cemeteries is an evidence of the ground motion severity. 1 Corresponding Author: E. Garini, National Technical University, Athens, Greece, [email protected]
Transcript of Rocking and Sliding Response in the 2014 Cephalonia...
1st International Conference on Natural Hazards & Infrastructure
28-30 June, 2016, Chania, Greece
Rocking and Sliding Potential of the 2014 Cephalonia, Greece
Earthquakes
E. Garini1 and G. Gazetas Soil Mechanics Laboratory, National Technical University, Athens, Greece
ABSTRACT
A twin event earthquake sequence of an Mw6.1 on January 26th and an Mw6.0 eight days later on February 3rd shook
the island of Cephalonia, triggering damage in structural and harbor infrastructure. The strongest three recordings of the
double event are analyzed in this paper: the Chavriata, Lixouri and Argostoli accelerograms. The Lixouri record bears
the effects of near-fault directivity, containing acceleration pulses in its normal to the fault (EW) component. The most
extensive damage occurred in the numerous cemeteries of the region, with tombstone topplings and large slippages
being the most conspicuous. Symmetric and asymmetric sliding of a block resting through Coulomb friction on
horizontal or inclined planes and rocking–overturning of rigid blocks, when excited at their base by these records, are
studied in the paper. The rocking systems are modeled in 3D, as rigid blocks resting through Coulomb friction on
horizontal base. The latter is excited by three component accelerations: two in the horizontal directions and one in the
vertical. The rocking, sliding, twisting and overturning of such rigid systems offer a strong indication of the
‘destructiveness potential’ of ground motions, which explain the cemeteries extensive damage. Unilateral and bilateral
excitations are studied and the role of vertical acceleration is elucidated.
Keywords: 3D rocking, sliding, forward directivity, toppling
INTRODUCTION: THE CEPHALONIA DOUBLET EARTHQUAKE RECORDS
Cephalonia has suffered numerous earthquakes of large magnitude, 6.0 < MS < 7.5 in the last 500 years
(Papazachos & Papazachou, 1997). The seismic sequence of 1953 is the most catastrophic earthquake event
ever in Greece, flattening 85 per cent of buildings on the island and killing 500. Thirty years after the
destructive sequence of 1953, in 1983 another seismic succession was occurred. After thirty-one years from
the sequence of 1983, in 2014, another earthquake-chain had struck in Cephalonia.
The first mainshock of Mw = 6.1 occurred on 26 January 2014, in the western part of Cephalonia island.
The second mainshock of Mw = 6.0 followed on 3 February, just seven days after the first one. The
epicenters of both events are shown in Figure 1. The seismic doublet inflict moderate damage in structural
infrastructure, as well as several landslides, rock falls, ground and road crocking, severe liquefaction and
quay-wall failures (GEER, 2014). Our team participated in the GEER reconnaissance mission to Cephalonia.
In contrast with the overall satisfactory performance of domestic buildings (which were designed with the
highest in Greece seismic acceleration of 0.36 g), all the eighteen cemeteries of the triggered region of Paliki
(western Cephalonia peninsula) were extensively damaged. Toppling of headstones, breaking of covering
tomb slabs, sliding and uplifting of heavy marble ornaments and vases were observed. The extent of the
damage in the investigated cemeteries is an evidence of the ground motion severity.
1 Corresponding Author: E. Garini, National Technical University, Athens, Greece, [email protected]

Our study focus on the sliding and rocking response of simple geometry rigid bodies, triggered by the
recorded ground motions of the 2014 Cephalonia events. A series of three dimensional finite element
analyses are performed utilizing the ABAQUS finite element code. The parameters that are investigated
include: (i) the simultaneous triggering by all three acceleration components (two horizontal and one
vertical), and (ii) the influence of friction coefficient, μ, along the sliding/rocking interface. The need for a
3D modeling stems from the fact that only few results are available accounting for 3D rocking systems (and
it will be described in detail at a next part).
Figure 1. Map of Cephalonia with the EQ epicenters pictured with red stars, while the three recording sites
are shown in blue.
Figure 2. Acceleration time histories the Lixouri, Chavriata and Argostoli records of 2014 EQ events.
(3 February 2014)
M6.1
(26 January 2014)
M6.0
Lixouri
ArgostoliChavriata
(3 February 2014)
M6.1
(26 January 2014)
M6.0
Lixouri
ArgostoliChavriata
-0.8
0
0.8
17 19 21 23 25 27
Lixouri Station LXR1-NS (3 February 2014)
-0.8-0.6-0.4-0.2
00.20.40.60.8
23 28 33
t : s
A : g
Lixouri Station LXR1-EW (3 February 2014)
-0.8
-0.4
0
0.4
0.8
23 28 33
t : s
A : g
Chavriata Station CHV1-NS (3 February 2014)
-0.8
-0.4
0
0.4
0.8
23 28 33
t : s
A : g
-0.8
0
0.8
16 18 20 22 24 26
-0.8
0
0.8
17 19 21 23 25 27
Argostoli Station ARG2-UP (26 January 2014)
-0.8
0
0.8
14 19 24
t : s
V : m/s
Lixouri (3 February)
0.43 g
EW
NS
UP
Lixouri Station LXR1-UP (3 February 2014)
-0.8-0.6-0.4-0.2
00.20.40.60.8
22 27 32
t : s
A : g
0.54 g
0.64 g
0.60 g
0.51 g
A(t
): m
/s2
0.09 g
0.14 g
0.21 g
0.27 g
EW
NS
UP
EW
NS
UP
0.46 g
0.67 g
0.72 g
Chavriata Station CHV1-EW (3 February 2014)
-0.8
-0.4
0
0.4
0.8
23 28 33
t : s
A : g EW
NS
Chavriata Station CHV1-UP (3 February 2014)
-0.8-0.55
-0.3-0.05
0.20.45
0.7
22 27 32
t : s
A : gUP
Chavriata (3 February)Argostoli (3 February)
Argostoli Station ARG2-EW (3 February 2014)
-0.8
-0.4
0
0.4
0.8
23 28 33
t : s
A : g
Argostoli Station ARG2-NS (3 February 2014)
-0.8
-0.4
0
0.4
0.8
23 28 33
t : s
A : g
Argostoli Station ARG2-UP (3 February 2014)
-0.8
-0.4
0
0.4
0.8
23 28 33
t : s
A : g
0.36 g
0.38 g
0.56 g
EW
NS
UP
Argostoli Station ARG2-EW (26 January 2014)
-0.8
-0.4
0
0.4
0.8
14 19 24
t : s
A : g
Argostoli Station ARG2-NS (26 January 2014)
-0.8
-0.4
0
0.4
0.8
14 19 24
t : s
A : g
A(t
): m
/s2
Acceleration Scale
-0.8
-0.4
0
0.4
0.8
0 2 4 6 8 10
-0.8
-0.4
0
0.4
0.8
0 2 4 6 8 10
Time Scale
Lixouri (26 January) Argostoli (26 January)
-0.8
0
0.8
17 19 21 23 25 27
Lixouri Station LXR1-NS (3 February 2014)
-0.8-0.6-0.4-0.2
00.20.40.60.8
23 28 33
t : s
A : g
Lixouri Station LXR1-EW (3 February 2014)
-0.8
-0.4
0
0.4
0.8
23 28 33
t : s
A : g
Chavriata Station CHV1-NS (3 February 2014)
-0.8
-0.4
0
0.4
0.8
23 28 33
t : s
A : g
-0.8
0
0.8
16 18 20 22 24 26
-0.8
0
0.8
17 19 21 23 25 27
Argostoli Station ARG2-UP (26 January 2014)
-0.8
0
0.8
14 19 24
t : s
V : m/s
Lixouri (3 February)
0.43 g
EW
NS
UP
Lixouri Station LXR1-UP (3 February 2014)
-0.8-0.6-0.4-0.2
00.20.40.60.8
22 27 32
t : s
A : g
0.54 g
0.64 g
0.60 g
0.51 g
A(t
): m
/s2
0.09 g
0.14 g
0.21 g
0.27 g
EW
NS
UP
EW
NS
UP
0.46 g
0.67 g
0.72 g
Chavriata Station CHV1-EW (3 February 2014)
-0.8
-0.4
0
0.4
0.8
23 28 33
t : s
A : g EW
NS
Chavriata Station CHV1-UP (3 February 2014)
-0.8-0.55
-0.3-0.05
0.20.45
0.7
22 27 32
t : s
A : gUP
Chavriata (3 February)Argostoli (3 February)
Argostoli Station ARG2-EW (3 February 2014)
-0.8
-0.4
0
0.4
0.8
23 28 33
t : s
A : g
Argostoli Station ARG2-NS (3 February 2014)
-0.8
-0.4
0
0.4
0.8
23 28 33
t : s
A : g
Argostoli Station ARG2-UP (3 February 2014)
-0.8
-0.4
0
0.4
0.8
23 28 33
t : s
A : g
0.36 g
0.38 g
0.56 g
EW
NS
UP
Argostoli Station ARG2-EW (26 January 2014)
-0.8
-0.4
0
0.4
0.8
14 19 24
t : s
A : g
Argostoli Station ARG2-NS (26 January 2014)
-0.8
-0.4
0
0.4
0.8
14 19 24
t : s
A : g
A(t
): m
/s2
Acceleration Scale
-0.8
-0.4
0
0.4
0.8
0 2 4 6 8 10
-0.8
-0.4
0
0.4
0.8
0 2 4 6 8 10
-0.8
-0.4
0
0.4
0.8
0 2 4 6 8 10
Time Scale-0.8
-0.4
0
0.4
0.8
0 2 4 6 8 10
Time Scale
Lixouri (26 January) Argostoli (26 January)

CHARACTERISTICS OF THE SELECTED MOTIONS AND THEIR ELASTIC RESPONSE
SPECTRA
As base excitations are employed five real accelerograms recorded during the two earthquakes at three
different sites on Cephalonia. In particular, the ground motions utilized herein are: (a) the Lixouri and
Argostoli records from the January 26th event, and (b) Lixouri, Argostoli and Chavriata records from the
February 3rd earthquake. Keep in mind that Chavriata station was put in service after the first earthquake,
therefore available recordings exist only for the second event. All the three components of acceleration are
illustrated in Figure 2 (with common acceleration and time scales). Notice from Figure 2, that the
accelerations recorded in Lixouri are quite strong: 0.54 to 0.64 g. The different levels of acceleration
intensity are in full agreement with the damages reported at each site. The horizontal peak ground
acceleration at Chavriata, 0.72 g, was the highest recorded during the doublet.
The Lixouri and Chavriata records from the earthquake of February, are by far the strongest ever recorded in
Greece. They contain large amplitude as well as great period acceleration pulses, a possible indication of
forward directivity effect. Their large period content become evident if we observe their elastic response
spectra. Figure 3 compares the 5%-damped response spectra of the Lixouri EW, and Chavriata NS ground
motions with the spectra of two of the most destructive worldwide accelerograms: the Rinaldi and Takatori
recordings from the 1994 Northridge and 1995 Kobe earthquakes, respectively.The damped elastic response
spectra, in terms of spectral acceleration, SA, offer a complete visual assessment of the potential of a ground
motion to cause large response to (visco)elastic spring–mass systems. Lixouri's spectra are plotted in bold
black line, and Chavriata's in red respectively. It is evident that Lixouri EW spectrum presents a large period
content, especially in the period range of 0.8 to 2 seconds.
Figure 3. Elastic response spectra of the Lixouri and Chavriata ground motions of the February 3rd event and
comparison with the Takatori (1995 Kobe) and Rinaldi (1994 Northridge) spectra.
Seismic behavior of three idealized systems is explored to calculate the potential of a record to inflict excess
irrecoverable displacements. They are to be thought of as analogs of actual inelastic systems:
the sliding of a rigid block on a horizontal base,
the sliding of a rigid block on an inclined (= 30o) base, and
the rocking–uplifting–overturning of a rigid slender block on horizontal base.
The former two systems are characterized by a rigid-plastic symmetric or asymmetric restoring-force versus
displacement relationships obeying Coulomb’s friction law. The latter is characterized by a bilinear
restoring–moment versus rotation relationship, comprising an initial rigid branch and a subsequent branch
descending to zero at the angle of imminent overturning. In Figure 4 are illustrated the three systems and
0
0.5
1
1.5
2
2.5
3
0 0.2 0.4 0.6 0.8 1 1.2 1.4 1.6 1.8 2 2.2 2.4 2.6
Chavriata (NS,February 3rd)
Lixouri (EW, February 3rd)
Takatori (component 0)
Rinaldi (component 228)
T : s
SA : g

their restoring force–displacement relation. The supporting base of each system is subjected to the particular
ground motion under investigation, and the size of the resulting inelastic/nonlinear response serves as an
index of the damage that this motion can inflict on the corresponding class of inelastic systems ― the
“destructiveness” potential of the motion.
Figure 4. The fundamental systems studied herein: (a) ideally rigid-plastic sliding on horizontal plane, (b)
ideally rigid-plastic sliding on inclined plane, and (c) rotational oscillation of a rocking block on rigid base.
SLIDING POTENTIAL OF THE SELECTED MOTIONS
The analysis of the behavior of a block on a horizontal or inclined base which is subjected to motion A(t)
parallel to the plane is obtained from elementary rigid body kinematics along with Newton’s second law of
motion (Newmark, 1964). The critical acceleration which must be exceeded for slippage to be initiated are:
AC = μ g (1)
AC1 = (μ cos β – sin β) g (2a)
AC2 = (μ cos β + sin β) g (2b)
in which AC = the critical acceleration for sliding in either direction of the symmetric system; μ = the
(constant) coefficient of friction; AC1 and AC2 = the critical accelerations for downhill and uphill sliding for
the asymmetric system of a plane inclined at an angle β. Usually AC1 << AC2 and as a result sliding takes
place only downhill. Whenever the base acceleration exceeds AC or AC1 (or, rarely, AC2) slippage of the
block takes place with respect to the base. This slippage lasts only momentarily, thanks to the transient
nature of earthquake shaking; it terminates as soon as the velocities of the base and the block equalize. And
the process continues until the motions of both the block and the base eventually terminate.
A detailed graphical presentation of the solution procedure is given in Figure 5, for the Lixouri EW motion
of February. Yielding on an inclined base with AC = 0.10 g, induced a total slippage of 1.18 m while
symmetric sliding on horizontal plane results in 0.51 m of maximum displacement and only 0.26 m of final
slippage. In asymmetric sliding, yielding displacement is building up at every acceleration cycle, leading to
the final 1.18 m. On the contrary, in symmetric case, displacement on right at one cycle reverts at the next
acceleration pulse and so on, resulting in an almost self-centered position of 0.26 m at the end of the motion.
Figures 6 and 7 illustrate the symmetric and asymmetric sliding spectra, respectively, of a set of Greek
ground motions which consists of: the Chavriata and Lixouri records from the 2014 February event, the
Lefkas records from the 2003 and 1973 earthquakes, the Aegion accelerogram from the 1995 Aegion event,
the Monastiraki and Sepolia records from the 1999 Parnitha EQ, and Kalamata motion from the 1986 EQ.
D
m
β
μ
D
mμ R
θC
D
mg (μ cosβ + sinβ)
F
mg (μ cosβ – sinβ)μ m g
F
D
μ m g
(a) (b) (c)M
θθC– θC
D
m
β
μD
m
β
μ
D
mμ
D
mμ R
θC
R
θC
D
mg (μ cosβ + sinβ)
F
mg (μ cosβ + sinβ)
F
mg (μ cosβ – sinβ)μ m g
F
D
μ m g
F
D
μ m g
(a) (b) (c)M
θθC– θC
M
θθC– θC
M
θθC– θC
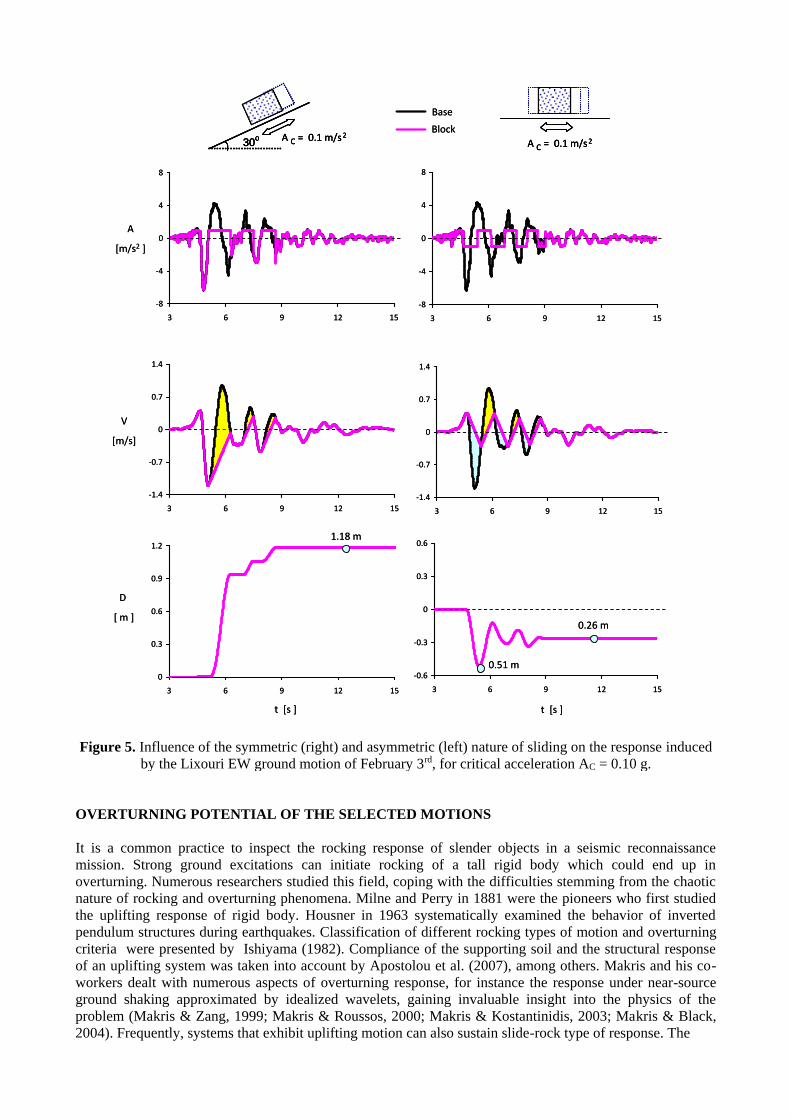
Figure 5. Influence of the symmetric (right) and asymmetric (left) nature of sliding on the response induced
by the Lixouri EW ground motion of February 3rd, for critical acceleration AC = 0.10 g.
OVERTURNING POTENTIAL OF THE SELECTED MOTIONS
It is a common practice to inspect the rocking response of slender objects in a seismic reconnaissance
mission. Strong ground excitations can initiate rocking of a tall rigid body which could end up in
overturning. Numerous researchers studied this field, coping with the difficulties stemming from the chaotic
nature of rocking and overturning phenomena. Milne and Perry in 1881 were the pioneers who first studied
the uplifting response of rigid body. Housner in 1963 systematically examined the behavior of inverted
pendulum structures during earthquakes. Classification of different rocking types of motion and overturning
criteria were presented by Ishiyama (1982). Compliance of the supporting soil and the structural response
of an uplifting system was taken into account by Apostolou et al. (2007), among others. Makris and his co-
workers dealt with numerous aspects of overturning response, for instance the response under near-source
ground shaking approximated by idealized wavelets, gaining invaluable insight into the physics of the
problem (Makris & Zang, 1999; Makris & Roussos, 2000; Makris & Kostantinidis, 2003; Makris & Black,
2004). Frequently, systems that exhibit uplifting motion can also sustain slide-rock type of response. The
-8
-4
0
4
8
3 6 9 12 15
-1.4
-0.7
0
0.7
1.4
3 6 9 12 15
0
0.3
0.6
0.9
1.2
3 6 9 12 15
β
Excitation: LXR-EW
αC = 0.1
β = 30ο
Βase
Block
-8
-4
0
4
8
3 6 9 12 15
-1.4
-0.7
0
0.7
1.4
3 6 9 12 15
-0.6
-0.3
0
0.3
0.6
3 6 9 12 15
1.18 m
0.26 m
Α
[m/s2 ]
V
[m/s]
D
[ m ]
0.51 m
t [s ] t [s ]
30o Α C = 0.1 m/s2
Α C = 0.1 m/s2
-8
-4
0
4
8
3 6 9 12 15
-1.4
-0.7
0
0.7
1.4
3 6 9 12 15
0
0.3
0.6
0.9
1.2
3 6 9 12 15
β
Excitation: LXR-EW
αC = 0.1
β = 30ο
Βase
Block
-8
-4
0
4
8
3 6 9 12 15
-1.4
-0.7
0
0.7
1.4
3 6 9 12 15
-0.6
-0.3
0
0.3
0.6
3 6 9 12 15
-8
-4
0
4
8
3 6 9 12 15
-1.4
-0.7
0
0.7
1.4
3 6 9 12 15
0
0.3
0.6
0.9
1.2
3 6 9 12 15
β
Excitation: LXR-EW
αC = 0.1
β = 30ο
Βase
Block
-8
-4
0
4
8
3 6 9 12 15
-1.4
-0.7
0
0.7
1.4
3 6 9 12 15
-0.6
-0.3
0
0.3
0.6
3 6 9 12 15
1.18 m
0.26 m
Α
[m/s2 ]
V
[m/s]
D
[ m ]
0.51 m
t [s ] t [s ]
30o Α C = 0.1 m/s2
30o
30o Α C = 0.1 m/s2
Α C = 0.1 m/s2Α C = 0.1 m/s2
-8
-4
0
4
8
3 6 9 12 15
-1.4
-0.7
0
0.7
1.4
3 6 9 12 15
0
0.3
0.6
0.9
1.2
3 6 9 12 15
β
Excitation: LXR-EW
αC = 0.1
β = 30ο
Βase
Block
-8
-4
0
4
8
3 6 9 12 15
-1.4
-0.7
0
0.7
1.4
3 6 9 12 15
-0.6
-0.3
0
0.3
0.6
3 6 9 12 15

Figure 6. Symmetric sliding response in terms of yielding displacement, D, versus the coefficient of friction,
μ, for several Greek records.
Figure 7. Asymmetric sliding response for an inclination of 30o, in terms of yielding displacement, D, versus
the coefficient of friction, μ, for several Greek records.
criteria for initiation of sliding, rocking or sliding-and-rocking motion were presented by Shenton (1996) and
later on by Taniguchi (2002). The vast majority of studies on uplifting systems refer to two-dimensional
geometry. However, the phenomenon of a rocking body is a three-dimensional problem. A few results are
available accounting for 3D geometry: Konstantinidis & Makris (2007), Chatzis & Smyth (2012), and Zulli
et al. (2012). The need for further understanding and insight into uplifting response in fully 3D conditions is
evident.
In the present study, a rectangular block with dimensions B (length) x B (width) x H (height) on top of a
rigid base undergoing a three component seismic excitation is examined, as displayed in Figure 8. The
block's dimensions are parametrically varied. The contact between the rigid bodies and their base is
simulated through a frictional interface governed by Coulomb's friction law.
The rocking response of a slender solid block of mass m in non-sliding but tensionless contact with a rigid
base which is subjected to motion A(t) is obtained numerically. The critical acceleration, which must be
exceeded for uplifting of the block from its base to be initiated, is simply:
0
0.1
0.2
0.3
0.4
0.5
0.6
0 0.05 0.1 0.15 0.2 0.25 0.3 0.35 0.4 0.45 0.5
Ac [g]
Dm
ax [
m]
Chavriata (EW) 2014
Lixouri (EW) 2014
Lixouri (NS) 2014
Aegion 1995
Lefkas 2003
Lefkas 1973
Kalamata 1986
Monastiraki 1999
Sepol ia 1999
D [ m ]
μ
μ
D
0
0.1
0.2
0.3
0.4
0.5
0.6
0 0.05 0.1 0.15 0.2 0.25 0.3 0.35 0.4 0.45 0.5
Ac [g]
Dm
ax [
m]
Chavriata (EW) 2014
Lixouri (EW) 2014
Lixouri (NS) 2014
Aegion 1995
Lefkas 2003
Lefkas 1973
Kalamata 1986
Monastiraki 1999
Sepol ia 1999
0
0.1
0.2
0.3
0.4
0.5
0.6
0 0.05 0.1 0.15 0.2 0.25 0.3 0.35 0.4 0.45 0.5
Ac [g]
Dm
ax [
m]
Chavriata (EW) 2014
Lixouri (EW) 2014
Lixouri (NS) 2014
Aegion 1995
Lefkas 2003
Lefkas 1973
Kalamata 1986
Monastiraki 1999
Sepol ia 1999
D [ m ]
μ
μ
D
μ
D
0
0.1
0.2
0.3
0.4
0.5
0.6
0 0.05 0.1 0.15 0.2 0.25 0.3 0.35 0.4 0.45 0.5
Ac [g]
Dm
ax [
m]
Chavriata (EW) 2014
Lixouri (EW) 2014
Lixouri (NS) 2014
Aegion 1995
Lefkas 2003
Lefkas 1973
Kalamata 1986
Monastiraki 1999
Sepol ia 1999
0
0.4
0.8
1.2
1.6
2
0 0.05 0.1 0.15 0.2 0.25 0.3 0.35 0.4 0.45 0.5
Ac [g]
D [
m]
Aegion
CHV_EW
LXR_EW
LXR_NS
Lefkas 2003
Lefkas 1973
Kalamata
Monastiraki
Sepol ia
D [ m ]
μ
0
0.1
0.2
0.3
0.4
0.5
0.6
0 0.05 0.1 0.15 0.2 0.25 0.3 0.35 0.4 0.45 0.5
Ac [g]
Dm
ax [
m]
Chavriata (EW) 2014
Lixouri (EW) 2014
Lixouri (NS) 2014
Aegion 1995
Lefkas 2003
Lefkas 1973
Kalamata 1986
Monastiraki 1999
Sepol ia 1999
30o
μ
D
0
0.4
0.8
1.2
1.6
2
0 0.05 0.1 0.15 0.2 0.25 0.3 0.35 0.4 0.45 0.5
Ac [g]
D [
m]
Aegion
CHV_EW
LXR_EW
LXR_NS
Lefkas 2003
Lefkas 1973
Kalamata
Monastiraki
Sepol ia
D [ m ]
μ
0
0.1
0.2
0.3
0.4
0.5
0.6
0 0.05 0.1 0.15 0.2 0.25 0.3 0.35 0.4 0.45 0.5
Ac [g]
Dm
ax [
m]
Chavriata (EW) 2014
Lixouri (EW) 2014
Lixouri (NS) 2014
Aegion 1995
Lefkas 2003
Lefkas 1973
Kalamata 1986
Monastiraki 1999
Sepol ia 1999
30o
μ
D
30o
30o
μ
D

AC = (B/H) g (3)
in which B = the width and H = the height of the solid block. Under a constant one–directional acceleration
even barely exceeding Ac (i.e., under the action of a pseudostatic inertia force mAC), the block will overturn.
The response and overturning of a given block depend on the amplitude, frequency content, and the sequence
of pulses of the ground motion. And for a given ground motion, the overturning is a function of the
slenderness H/B and the absolute size of the block. It turns out that acceleration levels higher than AC may be
necessary to cause overturning of a block ― in fact much higher, if the motion were dominated by high-
frequency components.
Figure 8. The F.E. model of rigid block on top of rigid base (left) and sketches of block's rotational degrees
of freedom (right).
The material of both structures is marble. The coefficient of friction, μ, at the block-base interface is
parametrically investigated following in-situ measurement: μ = 0.7, 0.6, 0.5, 0.4. Excitation is applied at the
bottom of the rigid base. The two horizontal and the vertical component of the Argostoli, Lixouri and
Chavriata records are imposed. The motions are imposed as recorded, with no modifications accounting for
soil amplification or/and site effects, to study the destructiveness potential of the particular motions.
The body has six degrees of freedom (DoF): the first three are the translational DoF, and the rest three DoF
are the rotational. The rotation of the body is described with the angles of rotation (ϕrx, ϕry, ϕrz) around the
axes (x, y, z) respectively, and they are illustrated in Figure 8. For space limitation reasons, only few
characteristic results will be discussed next.
Figure 9. Rotational response of a 12x12x24 cm3 vase, subjected to Lixouri (3 February) record.
The effect of the vertical acceleration component is shown in Figure 9. Blue solid line displays the rotational
response induced only by the EW horizontal acceleration of the Lixouri record of February 3rd, for a
coefficient of friction μ = 0.5. The red line corresponds to rotational angles triggered by the two horizontal
components, whereas the black one shows the response due to all three acceleration components. In all cases,
the block overturns around x-axis. However, torsional rotation occurs only when both horizontal components
are applied as excitation. When only one of the two horizontal components acts alone, obviously there is no
torsion, as no out-of-plane moments are induced. The presence of vertical acceleration results in earlier
B B
H
φrz
φryφrx
x
y
z
B B
H
B B
H
φrz
φryφrx
φrz
φryφrx
x
y
z
x
y
z
-0.4
-0.2
0
0.2
2 2.2 2.4 2.6 2.8 3 3.2 3.4 3.6 3.8 4 4.2 4.4 4.6 4.8 5
t : s
0
20
40
60
80
2 2.2 2.4 2.6 2.8 3 3.2 3.4 3.6 3.8 4 4.2 4.4 4.6 4.8 5
t : s
0
20
40
60
80
2 2.2 2.4 2.6 2.8 3 3.2 3.4 3.6 3.8 4 4.2 4.4 4.6 4.8 5
t : s
-0.4
-0.2
0
0.2
2 2.2 2.4 2.6 2.8 3 3.2 3.4 3.6 3.8 4 4.2 4.4 4.6 4.8 5
t : s
0
20
40
60
80
2 2.2 2.4 2.6 2.8 3 3.2 3.4 3.6 3.8 4 4.2 4.4 4.6 4.8 5
t : s
0
20
40
60
80
2 2.2 2.4 2.6 2.8 3 3.2 3.4 3.6 3.8 4 4.2 4.4 4.6 4.8 5
t : s
-0.4
-0.2
0
0.2
2 2.2 2.4 2.6 2.8 3 3.2 3.4 3.6 3.8 4 4.2 4.4 4.6 4.8 5
t : s
0
20
40
60
80
2 2.2 2.4 2.6 2.8 3 3.2 3.4 3.6 3.8 4 4.2 4.4 4.6 4.8 5
t : s
0
20
40
60
80
2 2.2 2.4 2.6 2.8 3 3.2 3.4 3.6 3.8 4 4.2 4.4 4.6 4.8 5
t : s
φry [ 0 ] φrz [ 0 ]φrx [ 0 ]
t : s t : s t : s
EWEW + NSEW + NS + UP
0
20
40
60
80
2 2.2 2.4 2.6 2.8 3 3.2 3.4 3.6 3.8 4 4.2 4.4 4.6 4.8 5
t : s
Series1
Series1
Series1
EWEW + NSEW + NS + UP
0
20
40
60
80
2 2.2 2.4 2.6 2.8 3 3.2 3.4 3.6 3.8 4 4.2 4.4 4.6 4.8 5
t : s
Series1
Series1
Series1
-0.4
-0.2
0
0.2
2 2.2 2.4 2.6 2.8 3 3.2 3.4 3.6 3.8 4 4.2 4.4 4.6 4.8 5
t : s
0
20
40
60
80
2 2.2 2.4 2.6 2.8 3 3.2 3.4 3.6 3.8 4 4.2 4.4 4.6 4.8 5
t : s
0
20
40
60
80
2 2.2 2.4 2.6 2.8 3 3.2 3.4 3.6 3.8 4 4.2 4.4 4.6 4.8 5
t : s
-0.4
-0.2
0
0.2
2 2.2 2.4 2.6 2.8 3 3.2 3.4 3.6 3.8 4 4.2 4.4 4.6 4.8 5
t : s
0
20
40
60
80
2 2.2 2.4 2.6 2.8 3 3.2 3.4 3.6 3.8 4 4.2 4.4 4.6 4.8 5
t : s
0
20
40
60
80
2 2.2 2.4 2.6 2.8 3 3.2 3.4 3.6 3.8 4 4.2 4.4 4.6 4.8 5
t : s
-0.4
-0.2
0
0.2
2 2.2 2.4 2.6 2.8 3 3.2 3.4 3.6 3.8 4 4.2 4.4 4.6 4.8 5
t : s
0
20
40
60
80
2 2.2 2.4 2.6 2.8 3 3.2 3.4 3.6 3.8 4 4.2 4.4 4.6 4.8 5
t : s
0
20
40
60
80
2 2.2 2.4 2.6 2.8 3 3.2 3.4 3.6 3.8 4 4.2 4.4 4.6 4.8 5
t : s
-0.4
-0.2
0
0.2
2 2.2 2.4 2.6 2.8 3 3.2 3.4 3.6 3.8 4 4.2 4.4 4.6 4.8 5
t : s
0
20
40
60
80
2 2.2 2.4 2.6 2.8 3 3.2 3.4 3.6 3.8 4 4.2 4.4 4.6 4.8 5
t : s
0
20
40
60
80
2 2.2 2.4 2.6 2.8 3 3.2 3.4 3.6 3.8 4 4.2 4.4 4.6 4.8 5
t : s
-0.4
-0.2
0
0.2
2 2.2 2.4 2.6 2.8 3 3.2 3.4 3.6 3.8 4 4.2 4.4 4.6 4.8 5
t : s
0
20
40
60
80
2 2.2 2.4 2.6 2.8 3 3.2 3.4 3.6 3.8 4 4.2 4.4 4.6 4.8 5
t : s
0
20
40
60
80
2 2.2 2.4 2.6 2.8 3 3.2 3.4 3.6 3.8 4 4.2 4.4 4.6 4.8 5
t : s
-0.4
-0.2
0
0.2
2 2.2 2.4 2.6 2.8 3 3.2 3.4 3.6 3.8 4 4.2 4.4 4.6 4.8 5
t : s
0
20
40
60
80
2 2.2 2.4 2.6 2.8 3 3.2 3.4 3.6 3.8 4 4.2 4.4 4.6 4.8 5
t : s
0
20
40
60
80
2 2.2 2.4 2.6 2.8 3 3.2 3.4 3.6 3.8 4 4.2 4.4 4.6 4.8 5
t : s
φry [ 0 ] φrz [ 0 ]φrx [ 0 ]
t : s t : s t : s
EWEW + NSEW + NS + UP
0
20
40
60
80
2 2.2 2.4 2.6 2.8 3 3.2 3.4 3.6 3.8 4 4.2 4.4 4.6 4.8 5
t : s
Series1
Series1
Series1
EWEW + NSEW + NS + UP
0
20
40
60
80
2 2.2 2.4 2.6 2.8 3 3.2 3.4 3.6 3.8 4 4.2 4.4 4.6 4.8 5
t : s
Series1
Series1
Series1
EWEW + NSEW + NS + UP
0
20
40
60
80
2 2.2 2.4 2.6 2.8 3 3.2 3.4 3.6 3.8 4 4.2 4.4 4.6 4.8 5
t : s
Series1
Series1
Series1
EWEW + NSEW + NS + UP
0
20
40
60
80
2 2.2 2.4 2.6 2.8 3 3.2 3.4 3.6 3.8 4 4.2 4.4 4.6 4.8 5
t : s
Series1
Series1
Series1

toppling of the body. Observe in Figure 9 that for all three components overturning occurs at around 2.7 s,
where with both horizontal components, failure takes place later, at 3.1 s.
Figure 10 portray the effect of friction coefficient, μ. The three rotational angles along the x, y, and z axes for
the Chavriata excitation are presented in Figure 10. Notice, that as μ increases from 0.4 to 0.5 the rotational
response ϕry and ϕrz is increasing too. However, further increase of μ from 0.5 to 0.7 leads to a decrease of
the rotational response. This is just a simple evidence of the chaotic nature of rocking response.
Figure 10. Rotational response of a 12x12x36 cm3 vase subjected to Chavriata (3 February) record, for three
different coefficients of friction.
CONCLUSIONS
The paper investigates the sliding and overturning response of rigid systems excited by ground motions
recorded during the Cephalonia 2014 EQ doublet. Sliding spectra of the studied records give a more
complete picture than the elastic response spectra alone. It was shown that the Lixouri and Chavriata motions
of February event were of substantial damaging potential comparing with a representative set of records from
Greek earthquakes of the last decades. As far as the rocking response is concerned, for the cases presented,
the vertical component of acceleration leads to earlier toppling of the block, and there is no definitive
relation between rocking response and the friction coefficient, μ. An important conclusion of our study is that
the recorded motion in Lixouri, with its strong long-period pulses (an obvious outcome of forward-rupture
directivity), can explain the unprecedented extent of overturning failures observed in the cemeteries of the
region.
REFERENCES
Apostolou M, Gazetas G, Garini E. Seismic response of slender rigid structures with foundation uplifting.
Soil Dynamics and Earthquake Engineering 2007; 27: 642–654.
Chatzis MN, Smyth AW. Modeling of the 3D rocking problem. International Journal of Non-Linear
Mechanics 2012; 47 (4): 85-98.
GEER/EERI/ATC Earthquake Reconnaissance. January 26th/ February 2nd 2014 Cephalonia, Greece events.
Version 1: June 2014.
Housner GW. The behavior of inverted pendulum structures during earthquakes. Bull Seismol Soc Am 1963;
53 (2):404–17.
Ishiyama Y. Motions of rigid bodies and criteria for overturning by earthquake excitations. Earthquake Eng
Struct Dyn 1982; 10:635–50.
Konstantinidis D, Makris N. The dynamics of a rocking block in three dimensions. Proc. of 8th HSTAM
International Congress on Mechanics; Patras, Greece, 2007.
Makris N, Roussos Y. Rocking response of rigid blocks under near-source ground motions. Geotechnique
2000; 50 (3):243–62.
φry [ 0 ] φrz [ 0 ]φrx [ 0 ]
-5
0
5
10
15
20
25
30
35
40
45
50
1.5 2 2.5 3 3.5 4 4.5 5 5.5 6
t : s
0.7
0.6
0.5
0.4 - 0.2
μ = 0.7μ = 0.5μ = 0.4
-5
0
5
10
15
20
25
30
2 2.2 2.4 2.6 2.8 3 3.2 3.4 3.6 3.8 4 4.2 4.4 4.6 4.8 5
t : s
0
20
40
60
80
2 2.2 2.4 2.6 2.8 3 3.2 3.4 3.6 3.8 4 4.2 4.4 4.6 4.8 5
t : s
0
1
2
3
4
5
6
7
8
2 2.2 2.4 2.6 2.8 3 3.2 3.4 3.6 3.8 4 4.2 4.4 4.6 4.8 5
t : s
-5
0
5
10
15
20
25
30
2 2.2 2.4 2.6 2.8 3 3.2 3.4 3.6 3.8 4 4.2 4.4 4.6 4.8 5
t : s
0
20
40
60
80
2 2.2 2.4 2.6 2.8 3 3.2 3.4 3.6 3.8 4 4.2 4.4 4.6 4.8 5
t : s
0
1
2
3
4
5
6
7
8
2 2.2 2.4 2.6 2.8 3 3.2 3.4 3.6 3.8 4 4.2 4.4 4.6 4.8 5
t : s
-5
0
5
10
15
20
25
30
2 2.2 2.4 2.6 2.8 3 3.2 3.4 3.6 3.8 4 4.2 4.4 4.6 4.8 5
t : s
0
20
40
60
80
2 2.2 2.4 2.6 2.8 3 3.2 3.4 3.6 3.8 4 4.2 4.4 4.6 4.8 5
t : s
0
1
2
3
4
5
6
7
8
2 2.2 2.4 2.6 2.8 3 3.2 3.4 3.6 3.8 4 4.2 4.4 4.6 4.8 5
t : st : s t : s t : s-5
0
5
10
15
20
25
30
35
40
45
50
1.5 2 2.5 3 3.5 4 4.5 5 5.5 6
t : s
0.7
0.6
0.5
0.4 - 0.2
μ = 0.7μ = 0.5μ = 0.4
-5
0
5
10
15
20
25
30
35
40
45
50
1.5 2 2.5 3 3.5 4 4.5 5 5.5 6
t : s
0.7
0.6
0.5
0.4 - 0.2
μ = 0.7μ = 0.5μ = 0.4
φry [ 0 ] φrz [ 0 ]φrx [ 0 ]
-5
0
5
10
15
20
25
30
35
40
45
50
1.5 2 2.5 3 3.5 4 4.5 5 5.5 6
t : s
0.7
0.6
0.5
0.4 - 0.2
μ = 0.7μ = 0.5μ = 0.4
-5
0
5
10
15
20
25
30
35
40
45
50
1.5 2 2.5 3 3.5 4 4.5 5 5.5 6
t : s
0.7
0.6
0.5
0.4 - 0.2
μ = 0.7μ = 0.5
-5
0
5
10
15
20
25
30
35
40
45
50
1.5 2 2.5 3 3.5 4 4.5 5 5.5 6
t : s
0.7
0.6
0.5
0.4 - 0.2
μ = 0.7μ = 0.5μ = 0.4
-5
0
5
10
15
20
25
30
2 2.2 2.4 2.6 2.8 3 3.2 3.4 3.6 3.8 4 4.2 4.4 4.6 4.8 5
t : s
0
20
40
60
80
2 2.2 2.4 2.6 2.8 3 3.2 3.4 3.6 3.8 4 4.2 4.4 4.6 4.8 5
t : s
0
1
2
3
4
5
6
7
8
2 2.2 2.4 2.6 2.8 3 3.2 3.4 3.6 3.8 4 4.2 4.4 4.6 4.8 5
t : s
-5
0
5
10
15
20
25
30
2 2.2 2.4 2.6 2.8 3 3.2 3.4 3.6 3.8 4 4.2 4.4 4.6 4.8 5
t : s
0
20
40
60
80
2 2.2 2.4 2.6 2.8 3 3.2 3.4 3.6 3.8 4 4.2 4.4 4.6 4.8 5
t : s
0
1
2
3
4
5
6
7
8
2 2.2 2.4 2.6 2.8 3 3.2 3.4 3.6 3.8 4 4.2 4.4 4.6 4.8 5
t : s
-5
0
5
10
15
20
25
30
2 2.2 2.4 2.6 2.8 3 3.2 3.4 3.6 3.8 4 4.2 4.4 4.6 4.8 5
t : s
0
20
40
60
80
2 2.2 2.4 2.6 2.8 3 3.2 3.4 3.6 3.8 4 4.2 4.4 4.6 4.8 5
t : s
0
1
2
3
4
5
6
7
8
2 2.2 2.4 2.6 2.8 3 3.2 3.4 3.6 3.8 4 4.2 4.4 4.6 4.8 5
t : s
-5
0
5
10
15
20
25
30
2 2.2 2.4 2.6 2.8 3 3.2 3.4 3.6 3.8 4 4.2 4.4 4.6 4.8 5
t : s
0
20
40
60
80
2 2.2 2.4 2.6 2.8 3 3.2 3.4 3.6 3.8 4 4.2 4.4 4.6 4.8 5
t : s
0
1
2
3
4
5
6
7
8
2 2.2 2.4 2.6 2.8 3 3.2 3.4 3.6 3.8 4 4.2 4.4 4.6 4.8 5
t : s
-5
0
5
10
15
20
25
30
2 2.2 2.4 2.6 2.8 3 3.2 3.4 3.6 3.8 4 4.2 4.4 4.6 4.8 5
t : s
0
20
40
60
80
2 2.2 2.4 2.6 2.8 3 3.2 3.4 3.6 3.8 4 4.2 4.4 4.6 4.8 5
t : s
0
1
2
3
4
5
6
7
8
2 2.2 2.4 2.6 2.8 3 3.2 3.4 3.6 3.8 4 4.2 4.4 4.6 4.8 5
t : s
-5
0
5
10
15
20
25
30
2 2.2 2.4 2.6 2.8 3 3.2 3.4 3.6 3.8 4 4.2 4.4 4.6 4.8 5
t : s
0
20
40
60
80
2 2.2 2.4 2.6 2.8 3 3.2 3.4 3.6 3.8 4 4.2 4.4 4.6 4.8 5
t : s
0
1
2
3
4
5
6
7
8
2 2.2 2.4 2.6 2.8 3 3.2 3.4 3.6 3.8 4 4.2 4.4 4.6 4.8 5
t : st : s t : s t : s-5
0
5
10
15
20
25
30
35
40
45
50
1.5 2 2.5 3 3.5 4 4.5 5 5.5 6
t : s
0.7
0.6
0.5
0.4 - 0.2
μ = 0.7μ = 0.5μ = 0.4
-5
0
5
10
15
20
25
30
35
40
45
50
1.5 2 2.5 3 3.5 4 4.5 5 5.5 6
t : s
0.7
0.6
0.5
0.4 - 0.2
μ = 0.7μ = 0.5
-5
0
5
10
15
20
25
30
35
40
45
50
1.5 2 2.5 3 3.5 4 4.5 5 5.5 6
t : s
0.7
0.6
0.5
0.4 - 0.2
μ = 0.7μ = 0.5μ = 0.4
-5
0
5
10
15
20
25
30
35
40
45
50
1.5 2 2.5 3 3.5 4 4.5 5 5.5 6
t : s
0.7
0.6
0.5
0.4 - 0.2
μ = 0.7μ = 0.5μ = 0.4
-5
0
5
10
15
20
25
30
35
40
45
50
1.5 2 2.5 3 3.5 4 4.5 5 5.5 6
t : s
0.7
0.6
0.5
0.4 - 0.2
μ = 0.7μ = 0.5
-5
0
5
10
15
20
25
30
35
40
45
50
1.5 2 2.5 3 3.5 4 4.5 5 5.5 6
t : s
0.7
0.6
0.5
0.4 - 0.2
μ = 0.7μ = 0.5μ = 0.4
Makris N, Zhang J. Response and Overturning of Anchored Equipment under Seismic Excitation. Report
No. PEER- 98/05. Pacific Earthquake Engineering Research Center: University of California, Berkeley,
1999.
Makris N, Konstantinidis D. The Rocking Spectrum and the Limitations of Practical Design Methodologies.
Earthquake Engineering and Structural Dynamics 2003; 32 (2):265-289.
Makris N, Black CJ. Dimensional analysis of rigid-plastic and elastoplastic structures under pulse-type
excitations. Journal of Engineering Mechanics 2004; 130 (9):1006–1018.
Milne J. Experiments in observational seismology. Trans Seismol. Soc. Jpn 1881; 3:12–64.
Newmark NM. Effects of earthquakes on dams and embankments. Geotechnique 1965; 15(2): 139-160.
Papazachos BC, Papazachou CC. 1997. The Earthquakes of Greece. Ziti Publication Co.: Thessaloniki,
1997.
Perry J. Note on the rocking of a column. Trans Seismol. Soc. Jpn 1881; 3:103–116.
Shenton HW. Criteria for Initiation of Slide, Rock, and Slide-Rock Rigid-Body Modes. Journal of
Engineering Mechanics 1996; 122 (7): 690-693.
Taniguchi T. Non-linear response analyses of rectangular rigid bodies subjected to horizontal and vertical
ground motion. Earthquake Engng Struct. Dyn. 2002; 31: 1481–1500.
Zulli D, Contento A, Di Egidio A. 3D model of rigid block with a rectangular base subject to pulse-type
excitation. International Journal of Non-Linear Mechanics 2012; 47 (6): 679-687.