
RockerBox: analysis and filtering of massive proteomics search
41
RockerBox RockerBox Filtering massive Mascot search results at the .dat level
Transcript of RockerBox: analysis and filtering of massive proteomics search
RockerBoxRockerBox
Filtering massive Mascot search results at the .dat
level

ChallengesChallenges
• “Big” experiments• High amount of data• Large raw and .dat files (> 2GB)
• How to handle our results??– The ‘2.2’ peptide summary could not be
made by Mascot– MSQuant couldn’t load the result files

Protein digestion Sample fractionation
Peptide fragmentation NanoLC-MS
Sample
Proteomics workflowsProteomics workflows
CID, ETD, HCDCID, ETD, HCDCID, ETD, HCDCID, ETD, HCD
Trypsin, LysN, LysC, Trypsin, LysN, LysC, Chymo, V8, PepsinChymo, V8, Pepsin
Trypsin, LysN, LysC, Trypsin, LysN, LysC, Chymo, V8, PepsinChymo, V8, Pepsin
SCX, ZIC-HILIC,SCX, ZIC-HILIC,ZIC-cHILIC, Ti-IMACZIC-cHILIC, Ti-IMACSCX, ZIC-HILIC,SCX, ZIC-HILIC,
ZIC-cHILIC, Ti-IMACZIC-cHILIC, Ti-IMACCultured cells, yeast, Cultured cells, yeast, tissue samples, stem tissue samples, stem
cells, …cells, …
Cultured cells, yeast, Cultured cells, yeast, tissue samples, stem tissue samples, stem
cells, …cells, …
Database search, statistical analysis
BoxesBoxes
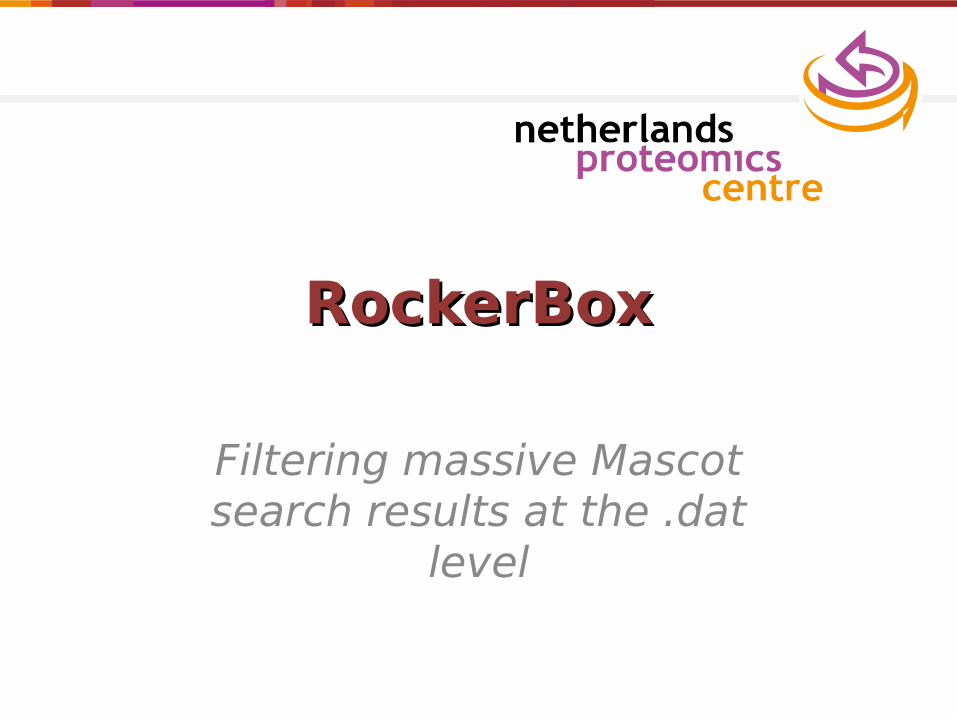
• ‘proteomics’ mass spectrometers– 3 Orbitrap (Thermo)– 2 Orbitrap Velos(Thermo)– Quadropole TOFs (Agilent, Waters and AB
Sciex)– 2 Triple Quad (AB Sciex, Thermo)
• 70 Terabytes of stored data
• Software:– Preprocessing scripts: in-house, MaxQuant,
Proteome Discoverer, Scaffold, MSQuant…– Mascot 2.3 (Linux)

Biological Replica 1 Biological Replica 2
Large MS experimentLarge MS experimentS
lide a
dap
ted
fro
m Javie
r M
uñ
oz
“Big SCX”
40 LC-MS/MS (CID)14 LC-MS/MS (ETD)
PTM ids
“Small SCX”
40 LC-MS/MS (CID)14 LC-MS/MS (ETD)
Protein ids
“Big SCX”
40 LC-MS/MS (CID)14 LC-MS/MS (ETD)
PTM ids
“Small SCX”
40 LC-MS/MS (CID)14 LC-MS/MS (ETD)
Protein ids
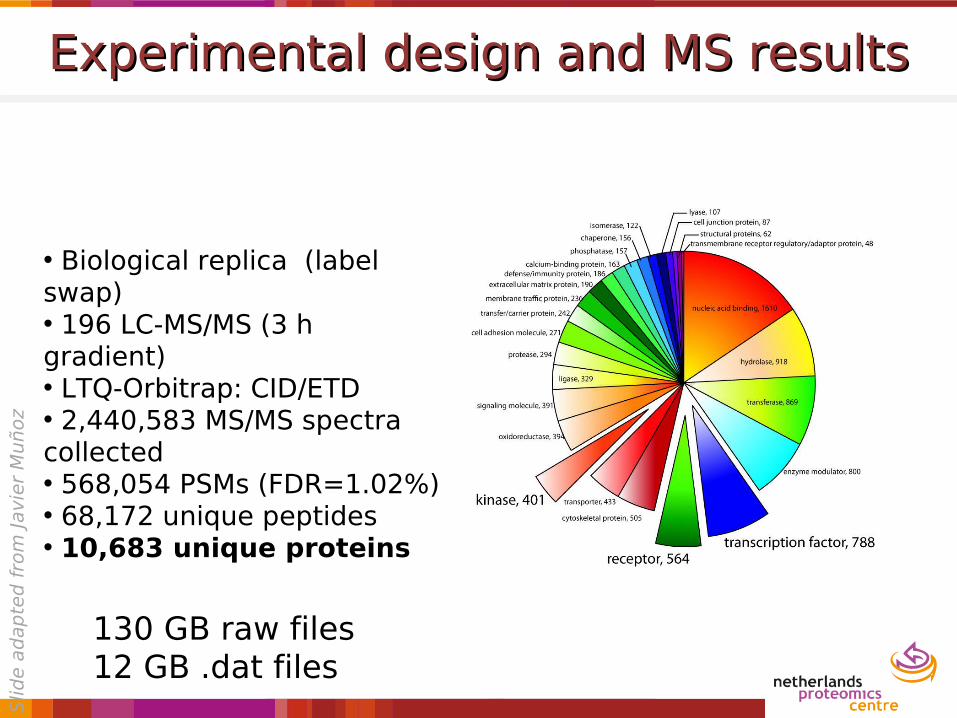
• Biological replica (label swap)• 196 LC-MS/MS (3 h gradient)• LTQ-Orbitrap: CID/ETD• 2,440,583 MS/MS spectra collected• 568,054 PSMs (FDR=1.02%)• 68,172 unique peptides• 10,683 unique proteins
Experimental design and MS resultsExperimental design and MS resultsS
lide a
dap
ted
fro
m Javie
r M
uñ
oz
130 GB raw files12 GB .dat files

ROCKERBOXROCKERBOX
Meeting the challenges

What is RockerBox?What is RockerBox?
• Filtering .dat file peptide spectrum matches (PSMs)
• Charting of search results• Combining .dat files(new)
• Exporting text files with PSMs
• Cross-platform usability (Java)
van den Toorn HW, Muñoz J, Mohammed S, Raijmakers R, Heck AJ, van Breukelen B. RockerBox: analysis and filtering of massive proteomics search results. J Proteome Res. 2011 Mar 4;10(3):1420-4.


CHARTSCHARTS
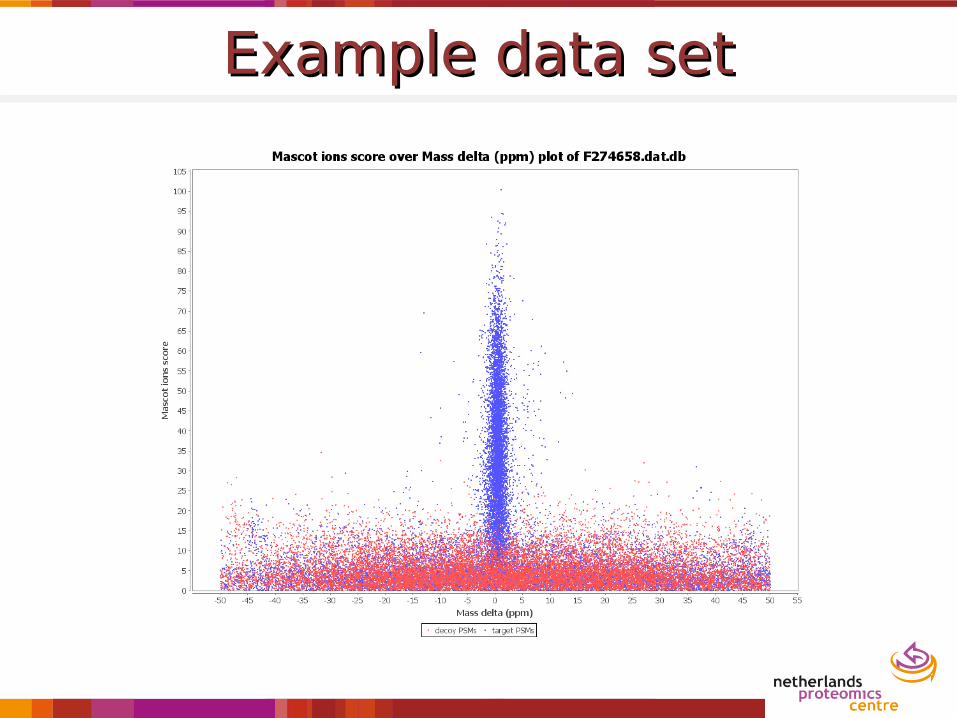
Example data setExample data set

Wide search windowWide search window

TOF: score vs. mass deltaTOF: score vs. mass delta
Sco
re
Mass Delta (ppm)

Retention time
Mass
Delt
a (
ppm
)

Mass-based calibration appliedMass-based calibration applied
Retention time
Mass
Delt
a (
ppm
)

Mass-based calibration appliedMass-based calibration applied
Mass Delta (ppm)
Masc
ot
score
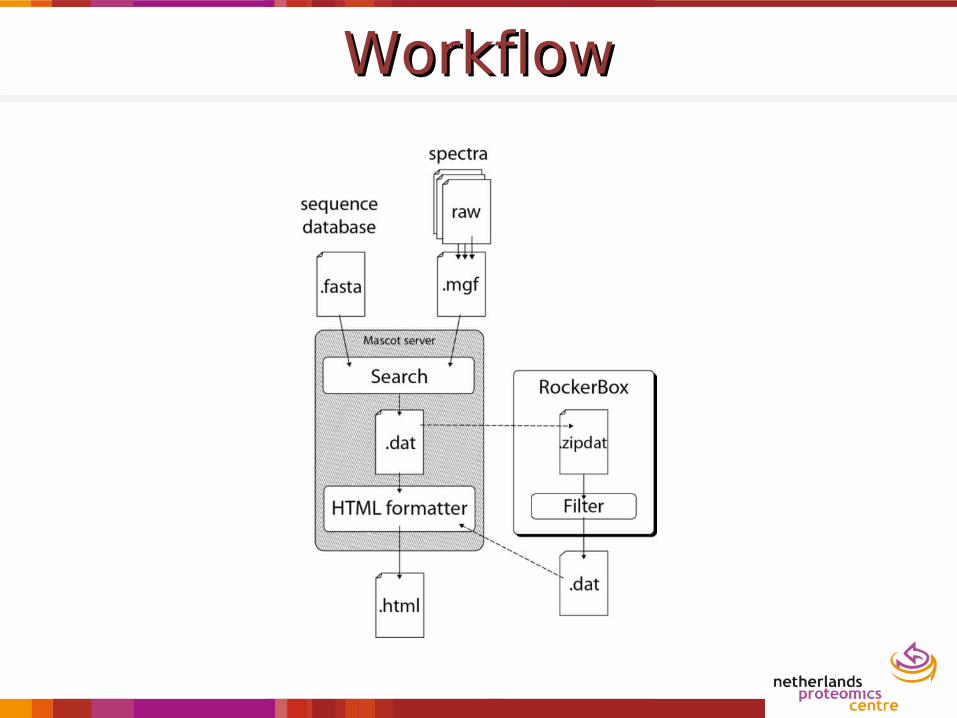
WorkflowWorkflow

Removing PSMs?Removing PSMs?
• Many spectra are not matched to a correct peptide sequence– Low quality real spectra (signal/noise ratio)– Spectra from non-peptide origins– Mixed peptide spectra– Spectra from peptides not in the database
• These low quality matches are abundant– Typically around 50%
• Which PSMs really matter?
ROCKERBOX FILTERING ROCKERBOX FILTERING METHODSMETHODS
An overview

Manual filter: full controlManual filter: full control
• Mascot score• Modifications• Mass delta

Manual filteringManual filtering

Manual filter resultsManual filter results
What’s the FDR?
Is this optimal
?
18853 5335

What’s an FDRWhat’s an FDR
• False Discovery Rate
• The FDR is the proportion of matches in the result set, expected to be false– Usually a percentage

FDR estimation methodsFDR estimation methods
Competitive
• Decoy and target sequences combined in one database
• A spectrum matches either a decoy or a target sequence
Non-competitive
• Search separate Decoy and Target databases
• A spectrum can match both decoy and target sequences
Ts = Accepted target (known) sequencesDs = Accepted decoy (nonsense) sequences
FDRs ≈ Ds/(Ts+Ds)
Ts = Accepted target (known) sequencesDs = Accepted decoy (nonsense) sequences
FDRs ≈ Ds/(Ts+Ds)

Automatic FDR based filteringAutomatic FDR based filtering
• FDR guaranteed• 50% Automatic• Mass window• Different decoy
strategies• Possibility to use
on separate mass spec runs
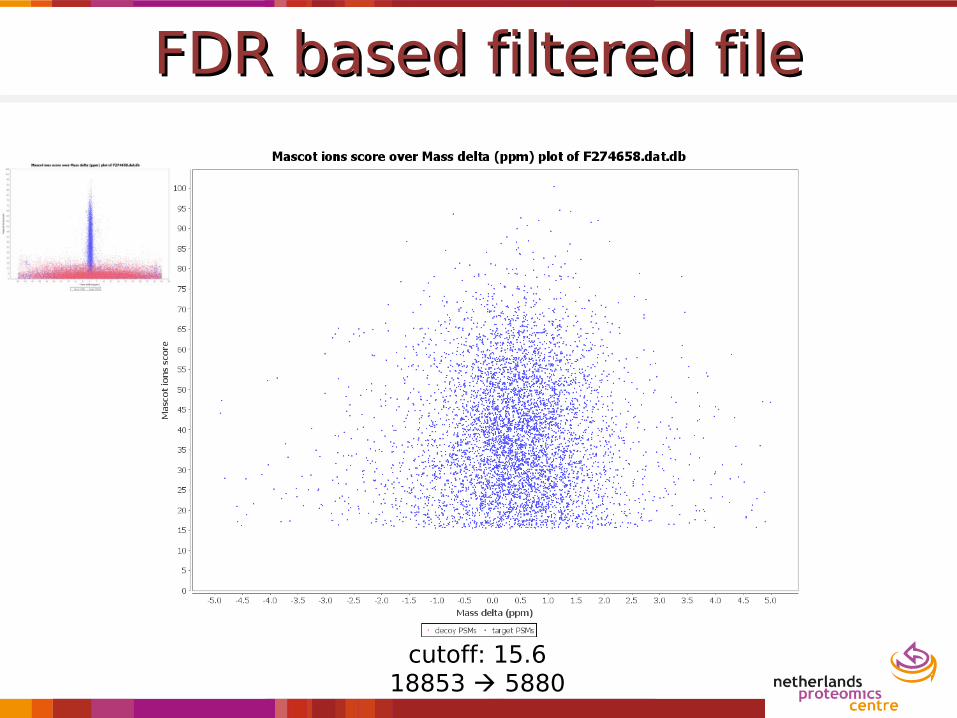
FDR based filtered fileFDR based filtered file
cutoff: 15.618853 5880

Fractions are not the same…Fractions are not the same…
2 P N-Ac 1 P increasing # basic residues

FDR based filtered fileFDR based filtered file
18853 5992

PSM propertiesPSM propertiesFeature Descriptionid Identifier. RockerBox uses the form *db*_querynumber_rank, in which
*db* may be ‘target’ for Mascot automatic decoy real database, ‘decoy’ for Mascot automatic decoy scrambled database or ‘combined’ for a concatenated decoy strategy
label -1 if decoy, 1 if target PSMcharge Precursor chargescore Mascot scoredeltaScore Difference between current rank score and ‘next’ rank scoremr Measured precursor massdeltaM Delta mass between precursor mass and matched peptide massdeltaMPpm deltaM relative to matched peptide massabsDeltaM Absolute value of deltaMabsDeltaMPpm Absolute value of deltaMPpmisoDeltaM Delta mass allowing for 1, 2, 3 or 4 Dalton differenceisoDeltaMPpm isoDeltaM relative to matched peptide massmissedCleavages
Number of missed cleavages
fragMassError* RMS error of the MS2 spectrum to the theoretical spectrumtotalIntensity* Total intensity of the MS2 spectrumintMatchedTot*
Total intensity of matched MS2 peaks
relIntMatchedTot*
intMatchedTot divided by totalIntensity
fracIonsMatched*
Fraction of all MS2 peaks matched
peptide Peptide sequenceproteins The list of proteins from the search database that contain the peptide
sequence
Score
Mass
Fragmentmatching

Using the Percolator algorithmUsing the Percolator algorithm
• Fully automatic• Both decoy
strategies• Different score
outputs• Apply to separate
spectrometry runs

Percolator filtered filePercolator filtered file
18853 6492

Overview of filtering methodsOverview of filtering methods
File Size Number of PSMs
Original .dat 95 MB 18853
Manually filtered 12 MB 5335
FDR 1% 11 MB 5880
FDR 1% per fraction 15 MB 5992
Percolator FDR 1% 15 MB 6671

PHOSPHORYLATION SITE PHOSPHORYLATION SITE COUNTSCOUNTS
Use case
ExperimentExperiment
• Separate distinct peptide populations using SCX
• Enrich Phosphopeptide using Ti-IMAC
• Test in multiple fragmentation methods

Use case: phosphorylation countingUse case: phosphorylation counting
• Houjiang Zhou: which fragmentation method is best
for phosphopeptides
?CID, ETD, HCD
Which unique sites
(protein level)
do I have?
Maximize the number of
phosphopeptides identified
Reliable data with known
FDRI need it
tomorrow, the reviewer is
waiting

Data analysis (WIP)Data analysis (WIP)
• Use RockerBox to filter the .dat file– using Percolator, FDR 1%, with a
minimum Mascot score of 20
• Extract PTM delta scores using RockerBox csv export
• Count the phosphorylated peptides and phosphorylation sites on the proteins

ResultsResults
19,692 uni.phosphopeptides16,624 uni.phosphosites3862 phosphoproteins
0
200
4000
6000
8000
10000
12000
14000
16000
18000
0
500
1000
1500
2000
2500
3000
3500
4000
4500
5000
1 4 5 6 7 8 9 1 0 1 1 1 2 1 3 1 4 1 5 1 6 1 7 1 8 2 1 2 5 2 6 2 7 2 8 2 9 3 0 3 1 3 2 3 3 3 4 3 5 3 6 3 7 3 8 3 9 4 0
ETD
CID Phosphorylation sites
HCD

ConclusionsConclusions
• RockerBox helps to alleviate size problems– Complex research problems can be
addressed more easily
AcknowledgementsAcknowledgements
Lukas KällJavier Muñoz, Reinout Raijmakers,
Shabaz Mohammed
Bas van Breukelen, Albert J.R. Heck