University of Rochester July 28, 2005 steven.manly@rochester

Rochester Preparatory Elementary
School 3
2016-17 ACCOUNTABILITY PLAN
PROGRESS REPORT
Submitted to the SUNY Charter Schools Institute on:
September 15, 2017
By Amy Sponsler, Director of Operations
85 St. Jacob Street, Rochester, NY 14621

INTRODUCTION
Rochester Preparatory Elementary Charter School 3 2016-17 Accountability Plan Progress Report Page 1 of 20
The Directors of Operations prepared this 2016-17 Accountability Progress Report on behalf of the
school’s board of trustees:
Trustee’s Name Board Position
Geoffrey Rosenberger Chair
James Gleason Trustee
Jean Howard Trustee
Jim Ryan Trustee
Ronald Zarella Trustee
Rebecca Sumner Trustee
Joshua Phillips Trustee
James Barger Trustee
Christopher Shaffer has served as the Principal since 2016.

INTRODUCTION
Rochester Preparatory Elementary Charter School 3 2016-17 Accountability Plan Progress Report Page 2 of 20
The mission of True North Rochester Preparatory Charter School ("Rochester Prep") is to prepare all
students to enter and succeed in college through effort, achievement and the content of their
character. All Rochester Prep students will demonstrate excellence in reading, writing, math,
science, and history, while consistently exemplifying the virtues of diligence, integrity,
responsibility, compassion, perseverance and respect.
Rochester Prep ensures that students develop the skills, knowledge, and character necessary to
grant them full access to opportunity and prosperity, including enrollment and success in college.
The school features a rigorous academic program that guides students to meet the highest
standards and at the same time develops young men and women of character and integrity.
School Enrollment by Grade Level and School Year
School
Year K 1 2 3 4 5 6 7 8 Total
2012-13
2013-14
2014-15
2015-16
2016-17 90 90
MATHEMATICS
Rochester Preparatory Elementary Charter School 3 2016-17 Accountability Plan Progress Report Page 1 of 20
ENGLISH LANGUAGE ARTS
Goal 1: English Language Arts
All students at the school will become proficient in reading and writing of the English language.
BACKGROUND
Rochester Prep’s curriculum is developed with the goal of maximizing student academic
achievement through intentional standards-driven teaching and the systematic use of objective
performance data to continually inform decision making. To this end, Rochester Prep middle school
created a scope and sequence for reading and writing and divided the year into units, each
culminating in a formal assessment. During the 2013-2014 school year, Rochester Prep began to
develop its scopes, sequences, and assessments in alignment with the Common Core Learning
Standards. Rochester Prep continued to refine this process during the past three school years.
Each academic year, Rochester Prep uses three formative assessments in ELA, each aligned to state
standards and to the school’s scope and sequence. Starting in August, teachers and administrators
develop curricular strategy, unit plans and daily lessons based upon the scope and sequence. At the
close of each unit, an assessment is administered, graded and data produced so that teachers and
administrators develop action plans based upon objective, standards-driven data. The principal and
leadership team work closely with teachers at every step of this process, giving feedback on daily
lesson plans, curriculum, action plans and the implementation of these plans.
Rochester Prep’s ELA program emphasizes both strong reading and strong writing. In reading the
program emphasizes four key aspects of literacy: decoding, fluency, vocabulary and
comprehension. In the elementary school grades (K-4) there are 3 literacy blocks of 50 minutes
each day and students are broken up into groups based on STEP (Strategic Teaching and Evaluation
of Progress) levels. In the literacy blocks, students focus on reading mastery, guided reading, and
reading comprehension. Students spend 45 minutes writing daily, in addition to the 3 literacy
blocks.
In the middle school grades (5-8), in 2014-2015 we moved away from separate Reading and
Writing classes. Instead, students had a 2 hour English class. This was done again this year as it
aligns more accurately to the Common Core Learning Standards, whereby students’ written work
must be based on a text they have read.
Every year Rochester Prep provides teachers with an intense training program where we instruct
teaching and student behavior management techniques and strategies to employ in their
classrooms and throughout the school. We achieve complete consistency throughout the school
with regard to behavior and academic standards.

MATHEMATICS
Rochester Preparatory Elementary Charter School 3 2016-17 Accountability Plan Progress Report Page 2 of 20
Additionally, all staff meets one day each week to review the past week’s progress and to finalize
preparations for the coming week. Teachers are regularly observed teaching by the school
leadership and receive constant feedback for improvement.
Goal 1: Absolute Measure
Each year, 75 percent of all tested students enrolled in at least their second year will perform at or
above proficiency on the New York State English language arts examination for grades 3-8.
METHOD
The school administered the New York State Testing Program English language arts (“ELA”)
assessment to students in [X] through [Y] grade in April 2017. Each student’s raw score has been
converted to a grade-specific scaled score and a performance level.
The table below summarizes participation information for this year’s test administration. The table
indicates total enrollment and total number of students tested. It also provides a detailed
breakdown of those students excluded from the exam. Note that this table includes all students
according to grade level, even if they have not enrolled in at least their second year (defined as
enrolled by BEDS day of the previous school year).
2016-17 State English Language Arts Exam
Number of Students Tested and Not Tested
Grade Total
Tested
Not Tested1 Total
Enrolled IEP ELL Absent Refused
3
4
5
6
7
8
All
RESULTS
Not applicable.
Performance on 2016-17 State English Language Arts Exam
By All Students and Students Enrolled in At Least Their Second Year
Grades
All Students Enrolled in at least their
Second Year
Percent
Proficient
Number
Tested
Percent
Proficient
Number
Tested
3
4
5
1 Students exempted from this exam according to their Individualized Education Program (IEP), because of English Language
Learners (ELL) status, or absence for at least some part of the exam.

MATHEMATICS
Rochester Preparatory Elementary Charter School 3 2016-17 Accountability Plan Progress Report Page 3 of 20
6
7
8
All
EVALUATION
Not applicable.
ADDITIONAL EVIDENCE
Not applicable.

MATHEMATICS
Rochester Preparatory Elementary Charter School 3 2016-17 Accountability Plan Progress Report Page 4 of 20
English Language Arts Performance by Grade Level and School Year
Grade
Percent of Students Enrolled in At Least Their Second Year
Achieving Proficiency
2014-15 2015-16 2016-17
Percent Number
Tested Percent
Number
Tested Percent
Number
Tested
3
4
5
6
7
8
All
Goal 1: Absolute Measure
Each year, the school’s aggregate Performance Level Index (“PLI”) on the State English language arts
exam will meet the Annual Measurable Objective (“AMO”) set forth in the state’s NCLB
accountability system.
METHOD
The federal No Child Left Behind law holds schools accountable for making annual yearly progress
towards enabling all students to be proficient. As a result, the state sets an AMO each year to
determine if schools are making satisfactory progress toward the goal of proficiency in the state’s
learning standards in English language arts. To achieve this measure, all tested students must have
a PLI value that equals or exceeds the 2016-17 English language arts AMO of 111. The PLI is
calculated by adding the sum of the percent of all tested students at Levels 2 through 4 with the
sum of the percent of all tested students at Levels 3 and 4. Thus, the highest possible PLI is 200.2
RESULTS
Not applicable.
English Language Arts 2016-17 Performance Level Index
Number in
Cohort
Percent of Students at Each Performance Level
Level 1 Level 2 Level 3 Level 4
[?] [?] [?] [?]
PI = [?] + [?] + [?] = [?]
[?] + [?] = ?
PLI = [?]
2 In contrast to SED’s Performance Index, the PLI does not account for year-to-year growth toward proficiency.

MATHEMATICS
Rochester Preparatory Elementary Charter School 3 2016-17 Accountability Plan Progress Report Page 5 of 20
EVALUATION
Not applicable.
Goal 1: Comparative Measure
Each year, the percent of all tested students who are enrolled in at least their second year and
performing at proficiency on the state English language arts exam will be greater than that of all
students in the same tested grades in the school district of comparison.
METHOD
A school compares tested students enrolled in at least their second year to all tested students in the
public school district of comparison. Comparisons are between the results for each grade in which
the school had tested students in at least their second year at the school and the total result for all
students at the corresponding grades in the school district.3
RESULTS
Not applicable.
2016-17 State English Language Arts Exam
Charter School and District Performance by Grade Level
Grade
Percent of Students at Proficiency
Charter School Students
In At Least 2nd Year All District Students
Percent Number
Tested Percent
Number
Tested
3
4
5
6
7
8
All
EVALUATION
Not applicable.
ADDITIONAL EVIDENCE
Not applicable.
English Language Arts Performance of Charter School and Local District
by Grade Level and School Year
3 Schools can acquire these data when the New York State Education Department releases its database containing grade level
ELA and math test results for all schools and districts statewide. The NYSED announces the release of the data on its News
Release webpage.

MATHEMATICS
Rochester Preparatory Elementary Charter School 3 2016-17 Accountability Plan Progress Report Page 6 of 20
Grade
Percent of Students Enrolled in at Least their Second Year Scoring at or
Above Proficiency Compared to District Students
2014-15 2015-16 2016-17
Charter
School District
Charter
School District
Charter
School District
3
4
5
6
7
8
All
Goal 1: Comparative Measure
Each year, the school will exceed its predicted level of performance on the state English language
arts exam by an Effect Size of 0.3 or above (performing higher than expected to a meaningful
degree) according to a regression analysis controlling for economically disadvantaged students
among all public schools in New York State.
METHOD
The SUNY Charter Schools Institute (“Institute”) conducts a Comparative Performance Analysis,
which compares the school’s performance to that of demographically similar public schools
statewide. The Institute uses a regression analysis to control for the percentage of economically
disadvantaged students among all public schools in New York State. The Institute compares the
school’s actual performance to the predicted performance of public schools with a similar
concentration of economically disadvantaged students. The difference between the school’s actual
and predicted performance, relative to other schools with similar economically disadvantaged
statistics, produces an Effect Size. An Effect Size of 0.3, or performing higher than expected to a
meaningful degree, is the requirement for achieving this measure.
Given the timing of the state’s release of economically disadvantaged data and the demands of the
data analysis, the 2015-16 analysis is not yet available. This report contains 2015-16 results, the
most recent Comparative Performance Analysis available.
RESULTS
Not applicable.
2015-16 English Language Arts Comparative Performance by Grade Level
Grade
Percent
Economically
Disadvantaged
Number
Tested
Percent of Students
at Levels 3&4
Difference
between Actual
and Predicted
Effect
Size
Actual Predicted
3
4
5
6
7
MATHEMATICS
Rochester Preparatory Elementary Charter School 3 2016-17 Accountability Plan Progress Report Page 7 of 20
8
All
School’s Overall Comparative Performance:
Write in Comparative Performance Analysis from report here
EVALUATION
Not applicable.
ADDITIONAL EVIDENCE
Not applicable.
English Language Arts Comparative Performance by School Year
School
Year Grades
Percent
Eligible for
Free Lunch/
Economically
Disadvantaged
Number
Tested Actual Predicted
Effect
Size
2013-14
2014-15
2015-16
Goal 1: Growth Measure4
Each year, under the state’s Growth Model, the school’s mean unadjusted growth percentile in
English language arts for all tested students in grades 4-8 will be above the state’s unadjusted
median growth percentile.
METHOD
This measure examines the change in performance of the same group of students from one year to
the next and the progress they are making in comparison to other students with the same score in
the previous year. The analysis only includes students who took the state exam in 2015-16 and also
have a state exam score from 2014-15 including students who were retained in the same grade.
Students with the same 2014-15 score are ranked by their 2015-16 score and assigned a percentile
based on their relative growth in performance (student growth percentile). Students’ growth
percentiles are aggregated school-wide to yield a school’s mean growth percentile. In order for a
school to perform above the statewide median, it must have a mean growth percentile greater than
50.
Given the timing of the state’s release of Growth Model data, the 2015-16 analysis is not yet
available. This report contains 2015-16 results, the most recent Growth Model data available.5
4 See Guidelines for Creating a SUNY Accountability Plan for an explanation.
5 Schools can acquire these data from the NYSED’s Business Portal: portal.nysed.gov.

MATHEMATICS
Rochester Preparatory Elementary Charter School 3 2016-17 Accountability Plan Progress Report Page 8 of 20
RESULTS
Not applicable.
2015-16 English Language Arts Mean Growth Percentile by Grade Level
Grade
Mean Growth Percentile
School Statewide
Median
4 50.0
5 50.0
6 50.0
7 50.0
8 50.0
All 50.0
EVALUATION
Not applicable.
ADDITIONAL EVIDENCE
Not applicable.
English Language Arts Mean Growth Percentile by Grade Level and School Year
Grade
Mean Growth Percentile
2013-14 2014-15
2015-16 Statewide
Median
4 50.0
5 50.0
6 50.0
7 50.0
8 50.0
All 50.0
SUMMARY OF THE ENGLISH LANGUAGE ARTS GOAL
Not applicable.
Type Measure Outcome
Absolute
Each year, 75 percent of all tested students who are enrolled in at least
their second year will perform at proficiency on the New York State English
language arts exam for grades 3-8.
Comparative
Each year, the percent of all tested students who are enrolled in at least
their second year and performing at proficiency on the state English
language arts exam will be greater than that of students in the same tested
grades in the school district of comparison.
Comparative Each year, the school will exceed its predicted level of performance on the

MATHEMATICS
Rochester Preparatory Elementary Charter School 3 2016-17 Accountability Plan Progress Report Page 9 of 20
state English language arts exam by an Effect Size of 0.3 or above
(performing higher than expected to a small degree) according to a
regression analysis controlling for economically disadvantaged students
among all public schools in New York State. (Using 2015-16 results.)
Growth
Each year, under the state’s Growth Model the school’s mean unadjusted
growth percentile in English language arts for all tested students in grades
4-8 will be above the state’s unadjusted median growth percentile. (Using
2015-16 results.)
[Write in optional measure here]
ACTION PLAN
Not applicable.
MATHEMATICS
Goal 2: Mathematics
Students will achieve mastery of skills in Mathematics.
BACKGROUND
Rochester Prep’s Mathematics program emphasizes both strong computational procedures and
problem solving skills. The math program at Rochester Prep takes arithmetic concepts and breaks
them down to concrete, step-by-step approaches toward solving problems. At Rochester Prep,
math instruction incorporates a rigorous balance between mechanics and problem solving.
In the elementary school, there is one 65-minute block of math a day that focuses on number
sense, number systems, and problem-solving. During this block, students chant, act out, and model
math with activities and math manipulatives.
Goal 2: Absolute Measure
Each year, 75 percent of all tested students enrolled in at least their second year will perform at
proficiency on the New York State mathematics examination for grades 3-8.
METHOD
The school administered the New York State Testing Program mathematics assessment to students
in [X] through [Y] grade in April 2017. Each student’s raw score has been converted to a grade-
specific scaled score and a performance level.
The table below summarizes participation information for this year’s test administration. The table
indicates total enrollment and total number of students tested. It also provides a detailed
breakdown of those students excluded from the exam. Note that this table includes all students
according to grade level, even if they have not enrolled in at least their second year.
2016-17 State Mathematics Exam
Number of Students Tested and Not Tested
MATHEMATICS
Rochester Preparatory Elementary Charter School 3 2016-17 Accountability Plan Progress Report Page 10 of
20
Grade Total
Tested
Not Tested6 Total
Enrolled IEP ELL Absent Refused
3
4
5
6
7
8
All
RESULTS
Not applicable.
Performance on 2016-17 State Mathematics Exam
By All Students and Students Enrolled in At Least Their Second Year
Grades
All Students Enrolled in at least their
Second Year
Percent
Proficient
Number
Tested
Percent
Proficient
Number
Tested
3
4
5
6
7
8
All
EVALUATION
Not applicable.
ADDITIONAL EVIDENCE
Not applicable.
Mathematics Performance by Grade Level and School Year
Grade
Percent of Students Enrolled in At Least Their Second Year
Achieving Proficiency
2014-15 2015-16 2016-17
Percent Number
Tested Percent
Number
Tested Percent
Number
Tested
6 Students exempted from this exam according to their Individualized Education Program (IEP), because of English Language
Learners (ELL) status, or absence for at least some part of the exam.

MATHEMATICS
Rochester Preparatory Elementary Charter School 3 2016-17 Accountability Plan Progress Report Page 11 of
20
3
4
5
6
7
8
All
Goal 2: Absolute Measure
Each year, the school’s aggregate Performance Level Index (“PLI”) on the State mathematics exam
will meet the Annual Measurable Objective (“AMO”) set forth in the state’s NCLB accountability
system.
METHOD
The federal No Child Left Behind law holds schools accountable for making annual yearly progress
towards enabling all students to be proficient. As a result, the state sets an AMO each year to
determine if schools are making satisfactory progress toward the goal of proficiency in the state’s
learning standards in mathematics. To achieve this measure, all tested students must have a PLI
value that equals or exceeds the 2016-17 mathematics AMO of 109. The PLI is calculated by adding
the sum of the percent of all tested students at Levels 2 through 4 with the sum of the percent of all
tested students at Levels 3 and 4. Thus, the highest possible PLI is 200.7
RESULTS
Not applicable.
Mathematics 2016-17 Performance Level Index (PLI)
Number in
Cohort
Percent of Students at Each Performance Level
Level 1 Level 2 Level 3 Level 4
[?] [?] [?] [?]
PI = [?] + [?] + [?] = [?]
[?] + [?] = [?]
PLI = [?]
EVALUATION
Not applicable.
Goal 2: Comparative Measure
Each year, the percent of all tested students who are enrolled in at least their second year and
performing at proficiency on the state mathematics exam will be greater than that of all students in
the same tested grades in the school district of comparison.
7 In contrast to NYSED’s Performance Index, the PLI does not account for year-to-year growth toward proficiency.
MATHEMATICS
Rochester Preparatory Elementary Charter School 3 2016-17 Accountability Plan Progress Report Page 12 of
20
METHOD
A school compares the performance of tested students enrolled in at least their second year to that
of all tested students in the public school district of comparison. Comparisons are between the
results for each grade in which the school had tested students in at least their second year at the
school and the total result for all students at the corresponding grades in the school district.8
RESULTS
Not applicable.
2016-17 State Mathematics Exam
Charter School and District Performance by Grade Level
Grade
Percent of Students at Proficiency
Charter School Students
In At Least 2nd
Year All District Students
Percent Number
Tested Percent
Number
Tested
3
4
5
6
7
8
All
EVALUATION
Not applicable.
ADDITIONAL EVIDENCE
Not applicable.
8 Schools can acquire these data when the New York State Education Department releases its database containing grade level
ELA and math test results for all schools and districts statewide. The NYSED announces the release of the data on its News
Release webpage.

MATHEMATICS
Rochester Preparatory Elementary Charter School 3 2016-17 Accountability Plan Progress Report Page 13 of
20
Mathematics Performance of Charter School and Local District
by Grade Level and School Year
Grade
Percent of Students Enrolled in at Least their Second Year Who Are at
Proficiency Compared to Local District Students
2014-15 2015-16 2016-17
Charter
School District
Charter
School District
Charter
School District
3
4
5
6
7
8
All
Goal 2: Comparative Measure
Each year, the school will exceed its predicted level of performance on the state mathematics exam
by an Effect Size of 0.3 or above (performing higher than expected to a meaningful degree)
according to a regression analysis controlling for economically disadvantaged students among all
public schools in New York State.
METHOD
The Institute conducts a Comparative Performance Analysis, which compares the school’s
performance to that of demographically similar public schools statewide. The Institute uses a
regression analysis to control for the percentage of economically disadvantaged students among all
public schools in New York State. The Institute compares the school’s actual performance to the
predicted performance of public schools with a similar concentration of economically
disadvantaged students. The difference between the school’s actual and predicted performance,
relative to other schools with similar economically disadvantaged statistics, produces an Effect Size.
An Effect Size of 0.3, or performing higher than expected to a meaningful degree, is the
requirement for achieving this measure.
Given the timing of the state’s release of economically disadvantaged data and the demands of the
data analysis, the 2016-17 analysis is not yet available. This report contains 2015-16 results, the
most recent Comparative Performance Analysis available.
RESULTS
Not applicable.
MATHEMATICS
Rochester Preparatory Elementary Charter School 3 2016-17 Accountability Plan Progress Report Page 14 of
20
2015-16 Mathematics Comparative Performance by Grade Level
Grade
Percent
Economically
Disadvantaged
Number
Tested
Percent of Students
at Levels 3&4
Difference
between Actual
and Predicted
Effect
Size
Actual Predicted
3
4
5
6
7
8
All
School’s Overall Comparative Performance:
[Write in Comparative Performance Analysis from report here]
EVALUATION
Not applicable.
ADDITIONAL EVIDENCE
Not applicable.
Mathematics Comparative Performance by School Year
School
Year Grades
Percent
Eligible for
Free Lunch/
Economically
Disadvantaged
Number
Tested Actual Predicted
Effect
Size
2013-14
2014-15
2015-16
Goal 2: Growth Measure9
Each year, under the state’s Growth Model, the school’s mean unadjusted growth percentile in
mathematics for all tested students in grades 4-8 will be above the state’s unadjusted median
growth percentile.
9 See Guidelines for Creating a SUNY Accountability Plan for an explanation.
MATHEMATICS
Rochester Preparatory Elementary Charter School 3 2016-17 Accountability Plan Progress Report Page 15 of
20
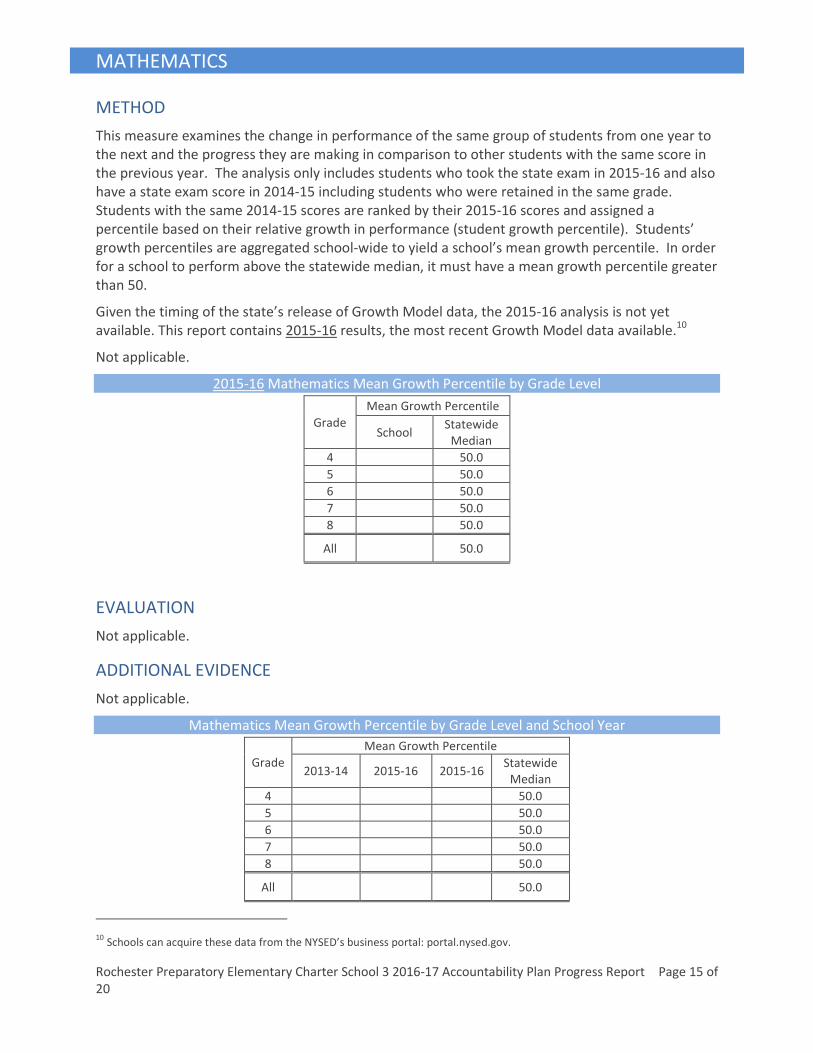
METHOD
This measure examines the change in performance of the same group of students from one year to
the next and the progress they are making in comparison to other students with the same score in
the previous year. The analysis only includes students who took the state exam in 2015-16 and also
have a state exam score in 2014-15 including students who were retained in the same grade.
Students with the same 2014-15 scores are ranked by their 2015-16 scores and assigned a
percentile based on their relative growth in performance (student growth percentile). Students’
growth percentiles are aggregated school-wide to yield a school’s mean growth percentile. In order
for a school to perform above the statewide median, it must have a mean growth percentile greater
than 50.
Given the timing of the state’s release of Growth Model data, the 2015-16 analysis is not yet
available. This report contains 2015-16 results, the most recent Growth Model data available.10
Not applicable.
2015-16 Mathematics Mean Growth Percentile by Grade Level
Grade
Mean Growth Percentile
School Statewide
Median
4 50.0
5 50.0
6 50.0
7 50.0
8 50.0
All 50.0
EVALUATION
Not applicable.
ADDITIONAL EVIDENCE
Not applicable.
Mathematics Mean Growth Percentile by Grade Level and School Year
Grade
Mean Growth Percentile
2013-14 2015-16
2015-16 Statewide
Median
4 50.0
5 50.0
6 50.0
7 50.0
8 50.0
All 50.0
10 Schools can acquire these data from the NYSED’s business portal: portal.nysed.gov.

MATHEMATICS
Rochester Preparatory Elementary Charter School 3 2016-17 Accountability Plan Progress Report Page 16 of
20
SUMMARY OF THE MATHEMATICS GOAL
Not applicable.
Type Measure Outcome
Absolute Each year, 75 percent of all tested students who are enrolled in at least
their second year will perform at proficiency on the New York State
mathematics exam for grades 3-8.
Comparative
Each year, the percent of all tested students who are enrolled in at least
their second year and performing at proficiency on the state mathematics
exam will be greater than that of students in the same tested grades in the
school district of comparison.
Comparative
Each year, the school will exceed its predicted level of performance on the
state mathematics exam by an Effect Size of 0.3 or above (performing
higher than expected to a small degree) according to a regression analysis
controlling for economically disadvantaged students among all public
schools in New York State. (Using 2015-16 school district results.)
Growth
Each year, under the state’s Growth Model the school’s mean unadjusted
growth percentile in mathematics for all tested students in grades 4-8 will
be above the state’s unadjusted median growth percentile.
[Write in optional measure here]
ACTION PLAN
Not applicable.
APPENDIX B: SUMMARY TABLES
Rochester Preparatory Elementary Charter School 3 2016-17 Accountability Plan Progress Report Page 17 of
20
SCIENCE
Goal 3: Science
Students will demonstrate mastery of skills and knowledge in Science.
BACKGROUND
Rochester Prep’s Science curriculum takes a comprehensive instructional look at Science standards
over the course of five grades, 4 through 8. The Science program has expanded in scope and depth
as the school has grown over the past eight years.
Goal 3: Absolute Measure
Each year, 75 percent of all tested students enrolled in at least their second year will perform at
proficiency on the New York State science examination.
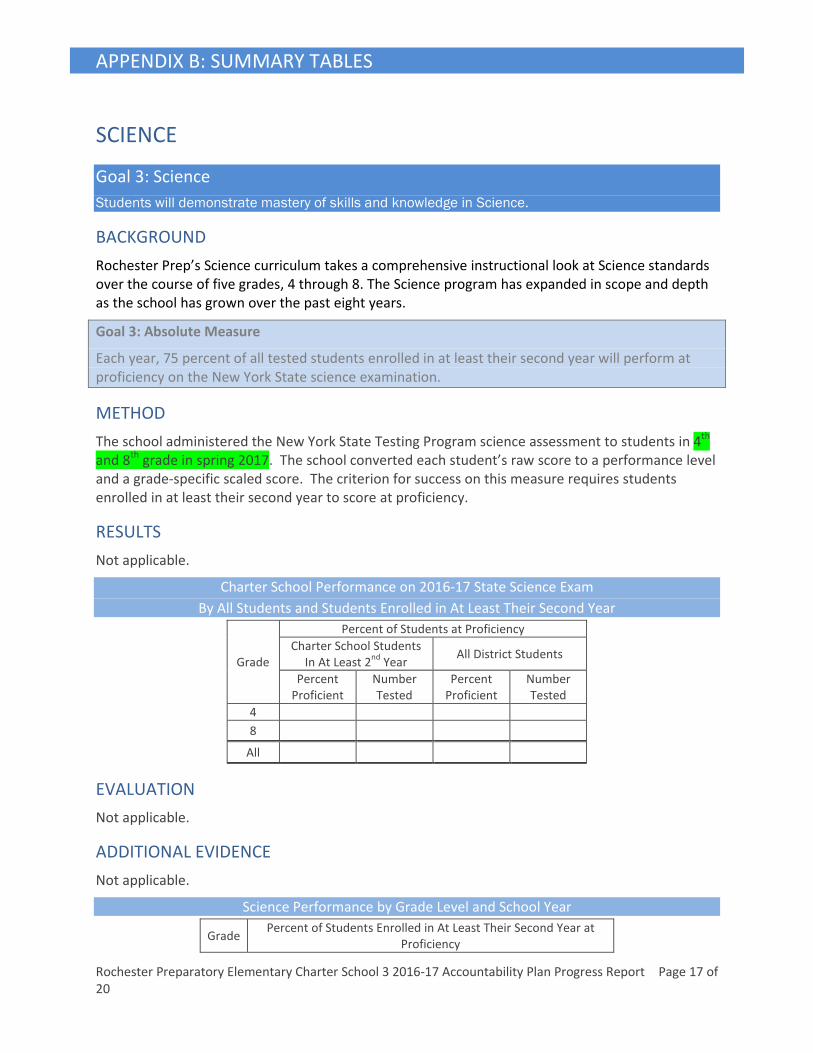
METHOD
The school administered the New York State Testing Program science assessment to students in 4th
and 8th
grade in spring 2017. The school converted each student’s raw score to a performance level
and a grade-specific scaled score. The criterion for success on this measure requires students
enrolled in at least their second year to score at proficiency.
RESULTS
Not applicable.
Charter School Performance on 2016-17 State Science Exam
By All Students and Students Enrolled in At Least Their Second Year
Grade
Percent of Students at Proficiency
Charter School Students
In At Least 2nd
Year All District Students
Percent
Proficient
Number
Tested
Percent
Proficient
Number
Tested
4
8
All
EVALUATION
Not applicable.
ADDITIONAL EVIDENCE
Not applicable.
Science Performance by Grade Level and School Year
Grade Percent of Students Enrolled in At Least Their Second Year at
Proficiency

APPENDIX B: SUMMARY TABLES
Rochester Preparatory Elementary Charter School 3 2016-17 Accountability Plan Progress Report Page 18 of
20
2014-15 2015-16 2016-17
Percent
Proficient
Number
Tested Percent
Number
Tested
Percent
Proficient
Number
Tested
4
8
All
Goal 3: Comparative Measure
Each year, the percent of all tested students enrolled in at least their second year and performing at
proficiency on the state science exam will be greater than that of all students in the same tested
grades in the school district of comparison.
METHOD
The school compares tested students enrolled in at least their second year to all tested students in
the public school district of comparison. Comparisons are between the results for each grade in
which the school had tested students in at least their second year and the results for the respective
grades in the school district of comparison.
RESULTS
Not applicable.
2016-17 State Science Exam
Charter School and District Performance by Grade Level
Grade
Percent of Students at Proficiency
Charter School Students
In At Least 2nd
Year All District Students
Percent
Proficient
Number
Tested
Percent
Proficient
Number
Tested
4
8
All
EVALUATION
Not applicable.
ADDITIONAL EVIDENCE
Not applicable.
Science Performance of Charter School and Local District
by Grade Level and School Year
Grade
Percent of Charter School Students at Proficiency and Enrolled in At Least their
Second Year Compared to Local District Students
2014-15 2015-16 2016-17
Charter District Charter District Charter District

APPENDIX B: SUMMARY TABLES
Rochester Preparatory Elementary Charter School 3 2016-17 Accountability Plan Progress Report Page 19 of
20
School School School
4
8
All
SUMMARY OF THE SCIENCE GOAL
Not applicable.
Type Measure Outcome
Absolute
Each year, 75 percent of all tested students enrolled in at
least their second year will perform at proficiency on the New
York State examination.
Comparative
Each year, the percent of all tested students enrolled in at
least their second year and performing at proficiency on the
state exam will be greater than that of all students in the
same tested grades in the school district of comparison.
[Write in optional measure here]
ACTION PLAN
Not applicable.
NCLB
Goal 4: NCLB
The school will make Adequate Yearly Progress.
Goal 4: Absolute Measure
Under the state’s NCLB accountability system, the school’s Accountability Status is in good standing:
the state has not identified the school as a Focus School nor determined that it has met the criteria
to be identified as school requiring a local assistance plan.
METHOD
Because all students are expected to meet the state's learning standards, the federal No Child Left
Behind legislation stipulates that various sub-populations and demographic categories of students
among all tested students must meet state proficiency standards. New York, like all states,
established a system for making these determinations for its public schools. Each year the state
issues School Report Cards. The report cards indicate each school’s status under the state’s No
Child Left Behind (“NCLB”) accountability system.
RESULTS
Under the state’s NCLB accountability system, Rochester Prep was deemed to be in “Good
Standing.”

APPENDIX B: SUMMARY TABLES
Rochester Preparatory Elementary Charter School 3 2016-17 Accountability Plan Progress Report Page 20 of
20
EVALUATION
The goal has been achieved.
ADDITIONAL EVIDENCE
NCLB Status by Year
Year Status
2014-15
2015-16
2016-17 Good Standing