Roche posts very strong interim results posts very strong interim results Roche Group • Group...
51
Half-Year Report 2005 Roche posts very strong interim results
Transcript of Roche posts very strong interim results posts very strong interim results Roche Group • Group...

Half-Year Report 2005
Roche posts very strong interim results

Innovative solutions spanning the entirehealthcare spectrumOur capabilities in diagnostics and pharmaceuticals enable us to innovateacross the entire healthcare spectrum, from identifying disease pre-dispositions and disease screening in populations at risk to prevention,diagnosis, therapy and treatment monitoring. Hepatitis is one example. Early diagnosis and effective treatment canprevent complications such as liver failure and liver cancer. We supplydiagnostic instruments and tests that can detect hepatitis at a very earlystage of infection. Thanks to a hepatitis genotyping test from Roche,physicians can tailor treatment with innovative medicines like Pegasys tothe infecting viral strain. And once treatment is started, cutting-edgeRoche diagnostics enable physicians to monitor their patients’ responses.
Predisposition Early detection Prevention Diagnosis Therapy Monitoring
Thirty years after receiving a blood transfusion, Parisbusinesswoman Christine Morise was diagnosedwith chronic hepatitis C, caused by a viral infection.Although she had no symptoms, tests later revealedsigns of early liver damage. Further testing showedthat she was infected with genotype 1 of the hepati-tis C virus (HCV), which is particularly hard to fight.Christine was treated with Roche’s Pegasys andCopegus and now leads a virus-free life, whichmeans she can concentrate on her successful real-estate business again.

1Half-Year Report 2005
Table of Contents
Half-Year Report
Key figures 2The first half of 2005 in brief 3Chairman’s letter to shareholders 4
Group and Divisional Results 7Roche Group 7Outlook 7Pharmaceuticals 8Diagnostics 12
Finance 16Financial Review 16Roche Group Interim Consolidated Financial Statements 26Notes to the Roche Group Interim Consolidated Financial Statements 31Review Report of the Group Auditors 45Supplementary Net Income and EPS Information 46Roche Securities 47

2 Half-Year Report 2005
Key figures in millions of CHF
Six monthsended 30 June % change
2005 2004 CHF LC
Sales 16,622 14,526 +14 +17Research and development 2,559 2,361 +8 +11EBITDAa) 5,510 4,755 +16 +19Operating profit before exceptional items 4,373 3,607 +21 +24Operating profit 4,227 3,325 +27 +30Profit from continuing businesses before exceptional itemsb) 3,332 2,604 +28Net income 3,242 3,121 +4Net income attributable to Roche shareholders 2,798 2,911 –4
Core EPSb, c) in CHF 3.69 3.06 +21EPSc) in CHF 3.26 3.40 –4
Research and development as % of sales 15.4 16.3EBITDA as % of sales 33.1 32.7Operating profit before exceptional items as % of sales 26.3 24.8Profit from continuing businesses as % of sales 19.5 20.7Effective tax rate % 24.3 26.5Net income as % of sales 19.5 21.5
30 June 31 December 30 June2005 2004 2004
Net liquidity 13,601 11,708 6,640Total assets 62,748 58,401 58,208Equity 38,833 33,368 31,368Debt 7,832 8,960 11,204Equity ratiod) 62% 57% 54%Debt-equity ratioe) 20% 27% 36%
a) EBITDA: Earnings before exceptional items and before interest and other financing costs, financial income, tax, depreciation andamortisation, including impairment. This corresponds to operating profit before exceptional items and before depreciation andamortisation, including impairment.
b) Profit from continuing businesses before exceptional items and Core EPS are calculated as shown on page 46.c) EPS: Earnings per share and non-voting equity security (diluted). d) Equity ratio: Equity as a percentage of total assets.e) Debt-equity ratio: Debt as a percentage of equity.
LC = local currencies
3Half-Year Report 2005
The first half of 2005 in brief*)
Roche posts very strong interim results
Roche Group• Group sales up 17%. Pharmaceuticals sales grow three times faster than
the global market.• Operating profit rises 30%, outpacing sales growth.• Positive net financial income.• Net income reaches 3.2 billion Swiss francs, surpassing last year’s interim
result, which included substantial exceptional gains.
Pharmaceuticals• Strong sales growth for oncology products and the anti-influenza drug
Tamiflu results in significant additional market share gains.• Avastin, Tarceva and Boniva successfully launched.• Positive results from phase III clinical trials in rheumatoid arthritis and breast,
lung and pancreatic cancers.
Diagnostics• Roche Diagnostics moves into the lead in Japan – now the number-one
supplier of in-vitro diagnostics in all major market regions.• Operating profit margin (before exceptional items) remains significantly
above the industry average.• Launch of next-generation Accu-Chek products off to a strong start.• US marketing clearance of first DNA chip-based test opens the way to
more personalised treatment.
Outlook• Positive outlook for full-year 2005. Forecast for operating profit margin
in the Pharmaceuticals Division (before exceptional items) raised again.
Additional information about Roche is available at http://www.roche.com.
*) All growth rates are based on local currencies.

4 Half-Year Report 2005
Chairman’s letter to shareholders
Your company performed extremely well in thefirst half of 2005. Once again the Roche Groupachieved or exceeded its goals. Sales in localcurrencies were up strongly by 17%, resulting inadditional gains in market share, and we saw anothersignificant improvement in the Group’s earningsperformance.
Operating profit rose 30% in local currencies to4.2 billion Swiss francs, and the Group’s operatingprofit margin increased further. Our improvedearnings performance is also reflected in ourinterim net income. As you know, last year’s resultswere positively impacted by after-tax gains totallingalmost 700 million Swiss francs from the conver-sion and redemption of bonds. Despite these sub-stantial exceptional gains in the prior period, netincome for the first six months of this year wasup 4% from 2004, advancing to 3.2 billion Swissfrancs. This is equivalent to an increase of 28% ona comparable basis.
Most important of all, though, are the very encour-aging data coming out of so many of our clinicaltrials – particularly in oncology. These data signalnew hope for patients with serious illnesses andtheir families and have attracted a great deal ofinterest and attention among medical professionalsand the public.
Sales in the Pharmaceuticals Division advanced22% in local currencies – roughly three times themarket growth rate – and the division’s operatingprofit margin (before exceptional items) increasedsignificantly, rising 2.1 percentage points to 28.5%.Our innovative oncology portfolio was the key fac-tor behind these excellent results. A new generationof more targeted, less toxic anticancer medicines hasenabled Roche, within the space of just a few years,to become the global market leader in oncology.During the first half of 2005 we extended our oncol-ogy leadership by successfully launching Avastin forcolorectal cancer and Tarceva for lung cancer.
Franz B. Humer, Chairman and Chief Executive Officer

5Half-Year Report 2005
Chairman’s letter to shareholders
Roche. Activities in this segment during the firsthalf of the year included initial market launchesof a new generation of Accu-Chek products forimproved diabetes management.
The first half of 2005 saw Roche Diagnostics moveinto the market lead in Japan, making it the number-one supplier of in-vitro diagnostics in all five ofits market regions. As the market leader, RocheDiagnostics is making major contributions today tobetter, more cost-efficient healthcare.
There is no question that the future of healthcarebelongs to targeted approaches that combinemedicines and diagnostic tests. Elecsys proBNP,which is already on the market today, is a primeexample of a test that can significantly reduce thecosts of treatment. It enables physicians to diagnoseheart failure at a very early stage and is also of valuein monitoring patients’ responses to therapy so thatany necessary adjustments can be made promptly.Another example of a targeted healthcare solutionis the AmpliChip CYP450 Test, which received FDAmarketing clearance in January. Using this DNAchip-based test, physicians can predict how rapidlya patient will metabolise certain drugs on the basisof the patient’s genetic profile. This informationcan help physicians in selecting the most appro-priate medicines and dosage regimens for theirpatients. Additional chip-based tests, for earlycancer detection, are currently in late-stage devel-opment.
Roche’s market value is an important indicatorof how well your company is performing. Over thelast three years Roche securities (shares and non-voting equity securities), including dividend yields,have significantly outperformed the average returndelivered by peer pharmaceuticals and diagnosticscompanies. In the first half of this year Roche’smarket value continued to track well ahead of theindustry average.
I would like to take this opportunity to express mythanks to all Roche employees for their dedicationand professionalism. The value they create everyworking day is vital if Roche is to continue to investin developing innovative solutions for importantareas of unmet medical need.
We made important progress with our drug devel-opment pipeline. In May we presented data fromeight successful phase III trials at the annual meet-ing of the American Society of Clinical Oncology(ASCO), the most important gathering of cancerspecialists in the world. Among other things, thesedata show that Herceptin can also offer significantbenefits in early-stage breast cancer followingsurgery. Adding Herceptin to standard therapy inthis setting can reduce the risk of cancer recurrenceby half compared with standard therapy alone. OurHerceptin trials also illustrate an important generalpoint about drug research and development: thejob is not done as soon as your drug has oneapproved indication. Worldwide, approximately13,000 patients have been enrolled in clinical trialsto support supplemental filings for Herceptin inearly-stage breast cancer.
At the same time we are investing heavily inexpanding our biotech manufacturing facilities tomeet the rising demand for our new biopharma-ceuticals. Ongoing projects to increase the Group’sbiotech manufacturing capacity currently representinvestments of over 2.5 billion Swiss francs.
Oncology is not the only therapeutic area whereRoche had some major successes during the firsthalf of this year. Boniva recently became the firstand only once-monthly oral medication approvedby the US Food and Drug Administration (FDA)for osteoporosis. The anti-influenza medicineTamiflu posted impressive sales growth. Sales weredriven in part by seasonal demand, but alsoreflected the active steps being taken to prepare fora possible influenza pandemic. Roche has been indiscussions with numerous governments and hasalready scaled up production capacity for the drugenormously to meet the sharp rise in demand.
Overall, Roche Diagnostics had a successful firsthalf-year despite a difficult market environment.Sales in local currencies rose 4%, in line with globalmarket growth. Divisional profitability remainedhigh for the industry, although the operating profitmargin (before exceptional items) fell 1.3 percent-age points to 22.8% as a result of costs related tolaunch activities. Diabetes care ranks alongside ourhigh-growth molecular diagnostics and immuno-diagnostics franchises as a key business segment for
6 Half-Year Report 2005
Chairman’s letter to shareholders
We remain confident about the outlook for full-year 2005, despite the likelihood of generic compe-tition to Rocephin in the United States. With itsportfolio of innovative medicines, the Pharmaceu-ticals Division is well positioned for future growth.Given our strong first-half performance, we nowexpect our overall results for full-year 2005 toexceed the guidance provided at the end of the firstquarter. In the Pharmaceuticals Division we nowexpect the operating profit margin to be evenhigher than indicated when we revised our outlookearlier this year – with above-market sales growthin the double-digits. We reaffirm our other pre-viously announced expectations for 2005.
You can be assured that Roche will continue to pur-sue its successful strategy of focused innovation –for the benefit of patients, health professionals, ouremployees and you, our shareholders.
Franz B. Humer

7Half-Year Report 2005
restructuring of Group debt. Roche posted a posi-tive financial income for the first half of 2005, withnet income from financial assets and foreignexchange management exceeding financing costs.
Net income for the first six months rose 4% in Swissfrancs to 3.2 billion francs. This more than com-pensated for the exceptional after-tax gain of687 million Swiss francs realised in the first half of2004, primarily on the ‘LYONs IV’ transaction.Excluding exceptional items, profit from continu-ing businesses increased 28%. The Group’s returnon sales margin was 19.5%.
There was a further significant improvement in theGroup’s financial position. The ratio of equity(including minority interests) to total assets is now62%, and over 85% of total assets are financed long-term.
Outlook
Roche is strengthening the outlook for the full yearannounced on 19 April 2005 and now expects theoperating profit margin (before exceptional items)in the Pharmaceuticals Division to be better againthan previously announced.
The Pharmaceuticals Division continues to expectsales in local currencies to grow above the globalmarket average at a double-digit rate. The Diagnos-tics Division expects sales for 2005 to show anotherabove-market increase, with growth in the single-digit range.
The Pharmaceuticals Division now expects its full-year operating profit margin (before exceptionalitems) to be better than the full-year margin for2004. The Diagnostics Division anticipates themargin development to continue towards its goalof achieving an operating profit margin of around23% (before exceptional items) in 2006.
Roche Group
Summary of operating results
The Roche Group posted very strong operatingresults for the first half of 2005, led by its dynamicPharmaceuticals Division. Group sales increasedsignificantly, advancing 17% in local currencies to16.6 billion Swiss francs. Expressed in Swiss francsand US dollars, sales for the period were up 14%and 20%, respectively. The Pharmaceuticals Divi-sion was the key growth driver. Its sales increasedthree times faster than the global market averageand significantly ahead of the growth rates in theUnited States, Europe and Japan, the division’sthree most important markets. In the DiagnosticsDivision sales in local currencies increased 4%, inline with global market growth.
The strong increase in interim sales had a verypositive impact on the Group’s earnings perfor-mance. Operating profit before exceptional itemsrose 24% in local currencies to 4.4 billion Swissfrancs, and the corresponding operating profitmargin improved substantially, rising 1.5 percent-age points to 26.3%. The excellent sales growthmore than offset significantly increased invest-ments in Roche’s strong development pipeline andlaunch and pre-launch activities. For the first time,the operating results for 2005 and for the compara-ble restated period in 2004 include the costs of theGroup’s equity compensation plans for employees,which are recorded as an operating expense. TheGroup’s improved earnings performance reflectsthe significantly higher operating profit marginin the Pharmaceuticals Division. The DiagnosticsDivision’s operating profit margin was downslightly from a year ago as a result of expensesrelated to product launches.
Cash generation from the Group’s business opera-tions remained strong at 6.1 billion Swiss francs,driven by an increase in EBITDA. EBITDA forthe first six months rose 19% in local currencies to5.5 billion Swiss francs, reflecting the success ofRoche’s operating activities.
As anticipated, net financial income showed asignificant improvement over last year, thanks tothe Group’s strong positive cash flow and the
Group and Divisional Results

8 Half-Year Report 2005
Group and Divisional Results
Swiss francs, and the operating profit margin be-fore exceptional items improved significantly, by2.1 percentage points to 28.5%.
OncologyThe division’s oncology portfolio delivered out-standing first-half growth of 36%. All major brandscontributed to this strong performance, whichfurther consolidates Roche’s position as the world’sleading provider of cancer medications.
Over the last four quarters, cumulative worldwidesales of Avastin, for the treatment of colorectalcancer, exceeded one billion Swiss francs. In Januarythe European Commission approved Avastin forthe first-line treatment of patients with advancedcolorectal cancer, and the launch roll-out hascommenced. An extensive programme to evaluateAvastin in a range of cancers is ongoing. Recentphase III results have demonstrated significantclinical benefit in advanced non-small cell lungcancer and metastatic breast cancer, in addition toadvanced colorectal cancer.
Tarceva, a novel targeted drug with proven survivalbenefit in advanced non-small cell lung cancer, waslaunched in the United States last November. Salesin the six months to 30 June exceeded expectations,reaching 145 million Swiss francs. Tarceva wasapproved in Switzerland in March and in Junereceived a positive opinion from the EU’s Com-mittee for Medicinal Products for Human Use(CHMP) for the treatment of non-small cell lungcancer. Based on new data showing significant ben-efits with the drug in pancreatic cancer, an applica-tion for this indication has been submitted in the
Pharmaceuticals
Strong above-market growth continues
The Pharmaceuticals Division posted very stronggrowth in the first half of 2005, with sales up 22%in local currencies (19% in Swiss francs; 25% inUS dollars). This was three times the global marketgrowth rate of 7% and resulted in significantmarket share gains for Roche. Growth was drivenprimarily by strong demand for the division’soncology products, including the new cancer treat-ments Avastin and Tarceva, and for the anti-influenza drug Tamiflu.
Sales gains significantly outpaced market growthin each of the three key regions, North America,Europe and Japan. Divisional operating profitbefore exceptional items grew 32%1) to 3.6 billion
Key figures: Pharmaceuticals Division
% change% change in local As %
In millions of CHF in CHF currencies of sales
Sales 12,652 19 22 100
EBITDA 4,335 21 24 34.3
Operating profit1) 3,608 28 32 28.5
1) Before exceptional items.
Sales by region
Latin America 6% (+17%)
Japan 14% (+20%)
Others 9% (+21%)
Europe 32% (+15%)
North America 39% (+30%)
1) Unless otherwise stated, all growth rates are in localcurrencies.
9Half-Year Report 2005
Group and Divisional Results
Sales of Xeloda continued their strong upwardtrend in the first half of 2005, with growth driven bya steady increase in prescriptions and stabilisationof wholesaler inventories in the United States. InMarch and June, respectively, the EU authoritiesand the US Food and Drug Administration (FDA)approved Xeloda for the adjuvant (after surgery)treatment of colon cancer. The new indication isexpected to further accelerate prescription growth.
Strong sales growth for Bondronat in the six monthsto 30 June was driven by increasing market penetra-tion and the continued roll-out of the product inEurope for the treatment of metastatic bone disease.
AnemiaDespite sustained price pressure in the anemia mar-ket as a whole, sales of NeoRecormon and Epoginfor renal and cancer-related anemia grew steadily.The new prefilled syringe for once-weekly adminis-tration is now the top-selling dosage form ofNeoRecormon for certain cancer-related anemias.Roche expects NeoRecormon sales in cancer-relatedanemia to continue to grow following a recommen-dation by the CHMP to update the product label.As a result, NeoRecormon will be indicated for thetreatment of anemia in patients with all solid andlymphoid cancers receiving any form of chemo-therapy.
US, with a filing in the EU planned later this year.Tarceva is also being tested in a wide range of othertumour settings.
Sales of MabThera/Rituxan, for non-Hodgkin’slymphoma (NHL), remained strong. Particularlygood uptake was achieved outside the United Statesfor the first-line treatment of indolent NHL and foraggressive NHL. Roche plans to file a marketingapplication with the EU authorities in the fourthquarter of 2005 for an additional indication, main-tenance treatment of indolent NHL, based on datashowing that MabThera/Rituxan can dramaticallyimprove progression-free survival in patients withthis form of the disease.
Herceptin, the only targeted treatment for HER2-positive breast cancer, posted significant salesgrowth in the first half of 2005. Demand for theproduct, which is currently approved for first-linetherapy of advanced (metastatic) disease, remainedstrong in all key markets. Following dramaticresults in three landmark clinical trials of the prod-uct as adjuvant treatment in early-stage HER2-positive breast cancer, Roche and Genentech areworking to prepare marketing applications forthis indication. A total of over 8,000 patients wereenrolled in the trials.
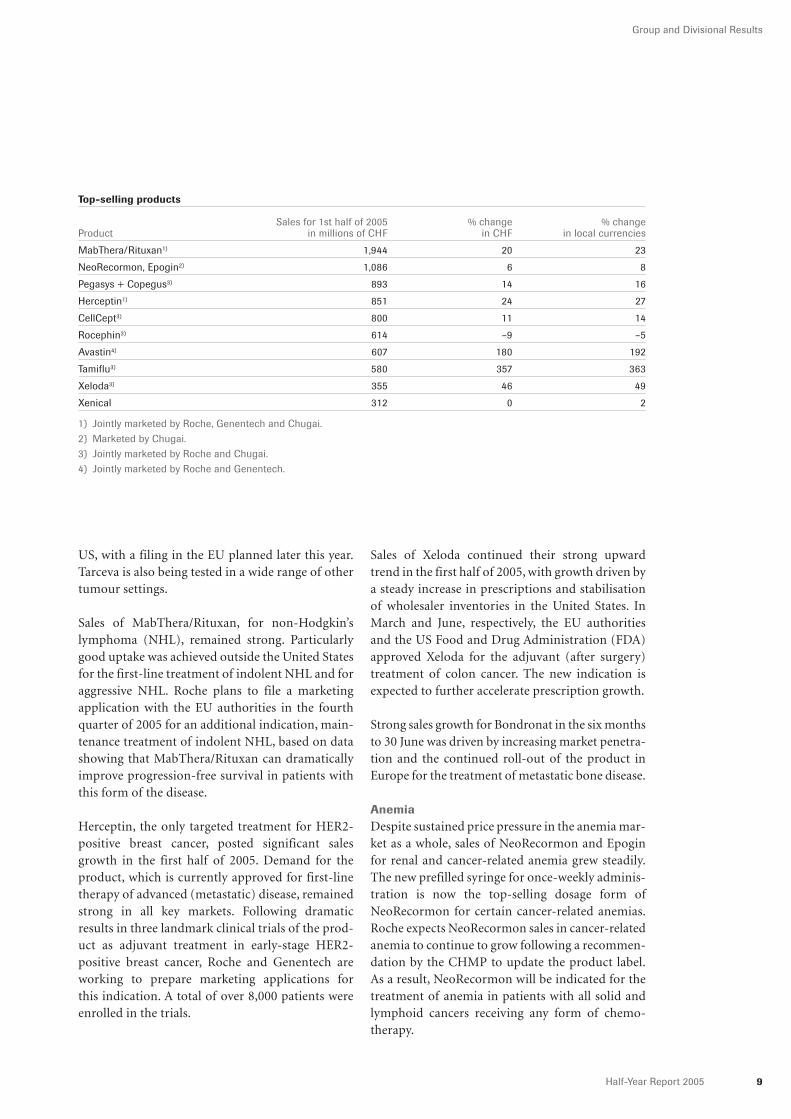
Top-selling products
Sales for 1st half of 2005 % change % changeProduct in millions of CHF in CHF in local currencies
MabThera/Rituxan1) 1,944 20 23
NeoRecormon, Epogin2) 1,086 6 8
Pegasys + Copegus3) 893 14 16
Herceptin1) 851 24 27
CellCept3) 800 11 14
Rocephin3) 614 –9 –5
Avastin4) 607 180 192
Tamiflu3) 580 357 363
Xeloda3) 355 46 49
Xenical 312 0 2
1) Jointly marketed by Roche, Genentech and Chugai. 2) Marketed by Chugai.3) Jointly marketed by Roche and Chugai.4) Jointly marketed by Roche and Genentech.

10 Half-Year Report 2005
Group and Divisional Results
Fuzeon sales continued to increase steadily in thesix months to 30 June, reaching 116 million Swissfrancs. Growth was strongest in key European mar-kets. Roche continues to roll out educational initia-tives for patients and physicians to accelerateuptake of the product.
Other major productsBoniva, the first once-monthly oral bisphospho-nate for the treatment and prevention of osteo-porosis, was approved by the US regulatory author-ities in March and launched in April by Roche andits comarketing partner GlaxoSmithKline. Initialmarket response has been in line with expectations.In June the CHMP recommended EU approval ofonce-monthly oral Bonviva (the product’s trade-mark outside the US). In addition, the US and EUauthorities are currently reviewing marketingapplications for intravenous Bonviva/Boniva, thefirst injectable bisphosphonate for osteoporosis.
Global sales of Xenical returned to growth in a flatmarket. In June the EU authorities approved the useof Xenical in obese adolescents aged twelve yearsand over. Xenical is now the only weight-loss treat-ment in the United States and the EU with labellingthat provides guidance on use in adolescents.
Sales of Rocephin declined only slightly overall,with continuing generic erosion in Europe largely
TransplantationThe Roche Group maintained its global marketleadership in the transplantation market, with theimmunosuppressant CellCept posting double-digitgains globally and in all key regions.
VirologyPegasys, the only pegylated interferon approvedfor the treatment of hepatitis B and hepatitis C,maintained its market leadership and posted solidgrowth in the first half of 2005, helped by furtherregulatory approvals. Pegasys plus Copegus hasnow been approved by both the FDA and the Euro-pean Commission for the treatment of hepatitis Cin patients co-infected with HIV. Pegasys has alsobeen approved for the treatment of hepatitis B inover 40 countries, including the United States, theEU and China.
First-half sales of Tamiflu grew very strongly, drivenby a late but severe flu season and orders of pan-demic readiness supplies. Worldwide sales of thedrug increased more than fourfold, with salesin Japan alone tripling to 263 million Swiss francs.Following warnings by experts about the likelihoodof an influenza pandemic, Roche has worked closelywith a number of countries whose governmentshave agreed to stockpile Tamiflu and is in negotia-tion with several others. Regulatory filings havebeen submitted in Europe and the US for use of theproduct to prevent flu in children aged 1–12 years.
Major regulatory filings in the first half of 20051)
Product Generic name Indication Country
Bonviva/Boniva ibandronate Osteoporosis, i. v. formulation EU, Switzerland
Major approvals in the first half of 20051)
Avastin bevacizumab First-line treatment in combination with chemotherapy
of metastatic colorectal cancer EU
Bonviva/Boniva ibandronate Osteoporosis, oral once-monthly formulation USA
Invirase saquinavir HIV disease, 500 mg formulation EU
Pegasys peginterferon alfa-2a Chronic hepatitis B EU, USA
HCV–HIV co-infection EU, USA,
Switzerland
Tarceva erlotinib Second- or third-line treatment of advanced
non-small cell lung cancer Switzerland
Xeloda capecitabine Adjuvant colon cancer monotherapy EU, USA
Xenical orlistat Adolescent obesity EU
1) Includes supplemental indications.

11Half-Year Report 2005
Group and Divisional Results
In the first half of 2005 Roche Pharmaceuticalscompleted 13 partnering transactions, seven ofwhich were product-related and six research- ortechnology-related. The existing agreement withGlaxoSmithKline covering Xenical in the UnitedStates has been expanded, as a result of which pre-scription Xenical is being promoted using one ofGSK’s US sales forces. In March Roche signedan agreement with Astellas Pharma to copromotethe novel antifungal agent Mycamine (micafunginsodium) in the United States, and the product hasnow been launched.
A state-of-the-art facility for the packaging andstorage of injectable medicines was opened atRoche Mannheim (Germany) in June. At RochePenzberg (Germany) a new facility for the pro-duction of epoetin and CERA has commencedoperation. Construction of Roche’s new biotechmanufacturing facilities in Basel (Switzerland) andPenzberg is progressing as planned. In June Genen-tech agreed to purchase a biologics manufacturingfacility from Biogen Idec. The additional facility,located in Oceanside, California, will help theGroup meet the growing demand for its newbiopharmaceutical products. In February Chugaiannounced plans to restructure and streamline itspharmaceutical manufacturing operations over thecoming five to six years. Production is to be con-solidated from the current five plants to just two,located in Utsunomiya and Fujieda.
Increased transparencyIn April Roche became one of the first health-
care companies to launch a publicly accessibleclinical trial registry and results database(www.roche-trials.com), providing comprehensiveinformation on its clinical trials. The new databaseis designed to offer a high degree of transparencyand enhance communication between Roche,patients and doctors.
Roche supports the revised pharmaceutical mar-keting code developed by the European Federationof Pharmaceutical Industries and Associations. Thenew code, which includes stricter ethical standards,is currently being implemented by the nationalindustry associations and will come into effect bythe end of 2005.
offset by modest gains in the US. Generic pressureis expected to negatively affect total Rocephin salesin the second half of the year after the product’sUS patent expires on 19 July.
Major development activitiesIn addition to the outstanding results achieved inphase III trials with the Group’s cancer drugs (seeOncology, above), significant progress was made inthe development of a number of products in othertherapeutic areas. The clinical development ofCERA, the first continuous erythropoietin receptoractivator for the treatment of anemia in chronickidney disease and in cancer patients continues toprogress. Roche expects to file an application forapproval of CERA in renal anemia in 2006.
Development of MabThera/Rituxan for the treat-ment of rheumatoid arthritis (RA) is progressingaccording to plan. Positive results were achieved ina pivotal phase III trial in patients with an inade-quate response to therapy with current biologicsand in a phase IIb study in patients who had pre-viously failed treatment with one or more diseasemodifying antirheumatic drugs. Global regulatoryfilings are scheduled for the second half of this yearfor the use of MabThera in RA patients with aninadequate response to current biologics.
Development of tocilizumab (previously known asMRA, from our Japanese affiliate Chugai) is ontrack worldwide. International phase III studies inrheumatoid arthritis are well under way. In Aprilthe health authorities in Japan approved the drug,under the product name Actemra, for the treatmentof Castleman’s disease, a rare lymphoproliferativedisorder.
The division currently has 27 projects spanning anumber of major new indications in late-stage clin-ical development and is planning to file nine newmarketing applications over the next 18 months.In addition, twelve marketing applications wereapproved by US or EU regulators during the firsthalf of this year.
Additional information on Roche’s developmentpipeline is available at http://www.roche.com/home/investors/inv_pipeline.htm.
12 Half-Year Report 2005
Group and Divisional Results
gin was down slightly from the previous year. Salesof these products will contribute to acceleratedsales growth in the second half of the year.
Roche Diagnostics moved into the number-oneposition in Japan, the world’s second largest marketfor in-vitro diagnostic products, making it theindustry leader now in all five of its market regions.
Diabetes CareIn the first half of 2005 Diabetes Care began rollingout its new generation of state-of-the-art Accu-Chek products for improved diabetes management.The Accu-Chek Aviva blood glucose monitoringsystem and Accu-Chek Spirit insulin pump weresuccessfully launched in their first European mar-kets. Both devices have received 510K clearancefrom the Food and Drug Administration in theUnited States.
The new, extremely easy-to-use Accu-Chek Com-pact Plus also experienced a very strong marketuptake in Europe. It is the world’s first blood glu-cose monitoring system with an integrated lancingdevice and test strip drum.
The FDA has officially informed Roche Diagnosticsthat it is in agreement with the action initiatedby the division to address deficiencies in the manu-facturing processes and documentation at theBurgdorf site in Switzerland. At the same time the
Diagnostics
Now number one in all market regions
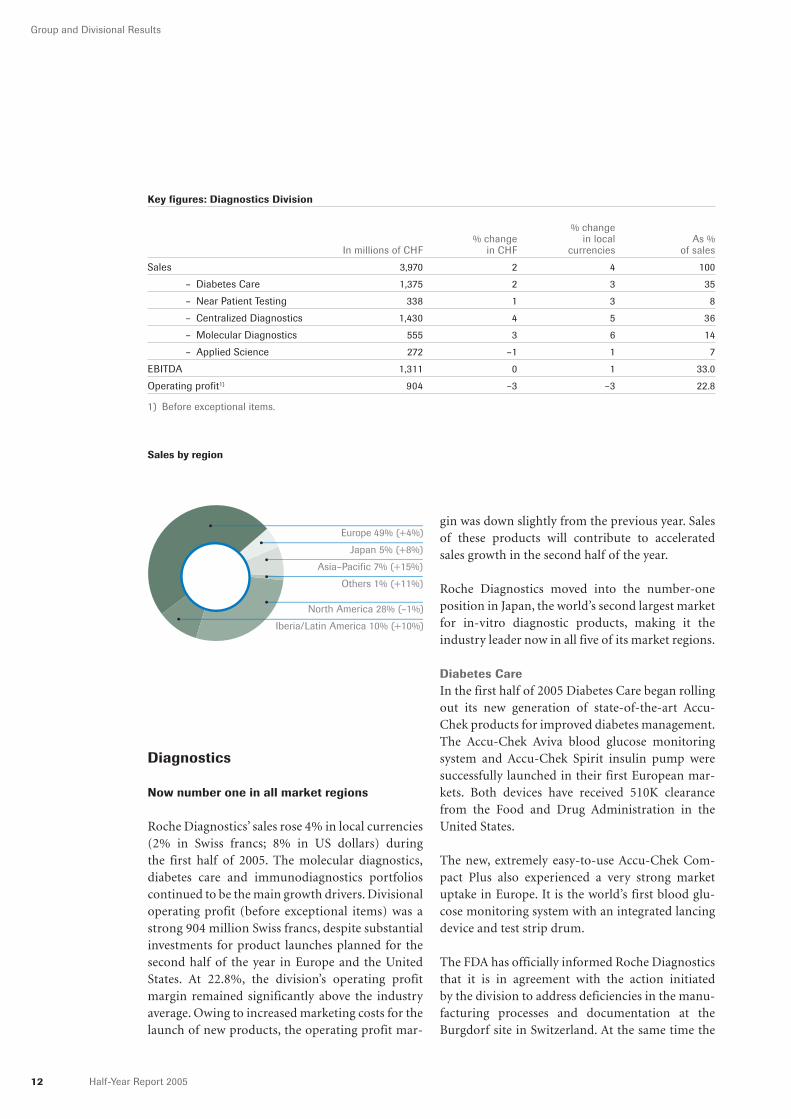
Roche Diagnostics’ sales rose 4% in local currencies(2% in Swiss francs; 8% in US dollars) duringthe first half of 2005. The molecular diagnostics,diabetes care and immunodiagnostics portfolioscontinued to be the main growth drivers. Divisionaloperating profit (before exceptional items) was astrong 904 million Swiss francs, despite substantialinvestments for product launches planned for thesecond half of the year in Europe and the UnitedStates. At 22.8%, the division’s operating profitmargin remained significantly above the industryaverage. Owing to increased marketing costs for thelaunch of new products, the operating profit mar-
Key figures: Diagnostics Division
% change% change in local As %
In millions of CHF in CHF currencies of sales
Sales 3,970 2 4 100
davon – Diabetes Care 1,375 2 3 35
davon – Near Patient Testing 338 1 3 8
davon – Centralized Diagnostics 1,430 4 5 36
davon – Molecular Diagnostics 555 3 6 14
davon – Applied Science 272 –1 1 7
EBITDA 1,311 0 1 33.0
Operating profit1) 904 –3 –3 22.8
1) Before exceptional items.
Sales by region
Europe 49% (+4%)
Japan 5% (+8%)
Asia–Pacific 7% (+15%)
Others 1% (+11%)
North America 28% (–1%)
Iberia/Latin America 10% (+10%)

13Half-Year Report 2005
Group and Divisional Results
Top-selling product lines in the first half of 2005
Sales % change for 1st half of 2005 in local
Product line Market segment Business area in millions of CHF currencies
Accu-Chek Diabetes management Diabetes Care 1,375 3
Cobas Integra1),
Roche Hitachi1) Clinical chemistry Centralized Diagnostics 746 0
Elecsys Immunodiagnostics Centralized Diagnostics 503 16
Amplicor tests,
Cobas Amplicor Clinical molecular diagnostics Molecular Diagnostics 335 4
Cobas AmpliScreen Nucleic acid-based blood screening Molecular Diagnostics 147 8
CoaguChek Coagulation monitoring Near Patient Testing 87 18
1) Excluding HIAs (homogeneous immunoassays).
Major product launches in the first half of 2005
Business area Product
Diabetes Care Accu-Chek Aviva, a high-end successor to the Advantage/Sensor blood glucose
monitoring system
Centralized Diagnostics Cobas Integra 800 HbA1c (glycated hemoglobin) analyser
Molecular Diagnostics AmpliChip CYP450 Test, a DNA chip-based drug metabolism test (US IVD)
Cobas AmpliScreen HCV and HIV-1 Tests for screening organ and tissue donations
(US IVD, new indication)
Cobas AmpliScreen HBV Test for screening donated whole blood, blood components,
source plasma and other tissues from living donors for hepatitis B virus (US IVD)
Cobas AmpliPrep/Cobas TaqMan HIV-1, HCV and HBV Tests, PCR-based assays
for quantitative detection of HIV-1, hepatitis C and hepatitis B
Linear Array HCV Genotyping Test, for determining hepatitis C genotype (CE IVD)
Linear Array HPV Genotyping Test, an assay capable of detecting 37 genotypes of human
papillomavirus (CE IVD)
Applied Science Universal Probe Library for real-time PCR gene expression and LightCycler 2.0 system
for real-time PCR diagnostics (CE IVD)
IVD = for clinical use.CE = European CE (Conformité européenne) mark approval.

14 Half-Year Report 2005
Group and Divisional Results
Early this year the FDA cleared the AmpliChipCYP450 Test for clinical use. This DNA chip-basedtest can contribute to better, more personalised careby helping physicians predict how patients willrespond to certain medicines. Inappropriate treat-ments can thus be avoided right from the start, andsuccessful therapeutic outcomes can be achievedfaster. This will benefit patients while also helpingto reduce healthcare costs.
The FDA approved the AmpliScreen HBV Testas a screening test to detect hepatitis B virus indonated whole blood, blood components, sourceplasma and other tissues from living donors. Theagency also approved expanded use of the CobasAmpliScreen HCV (hepatitis C virus) and HIV-1Tests to screen organ and tissue donations. Theseapprovals will help significantly increase the safetyof tissue and organ transplants.
In May Roche Diagnostics and Applera reached asettlement on outstanding litigation and arbitra-tion relating to the interpretation and performanceof contracts between Roche and Applera for thecommercialisation of PCR and real-time PCR tech-nology.
Roche Diagnostics’ LinearArray HPV GenotypingTest, which received CE mark approval in June,is the first commercially available test capable ofdetecting 37 genetic variants of human papilloma-virus (HPV). HPV infection is recognised as theleading cause of cervical cancer.
In addition, the Linear Array HCV GenotypingTest, for determining the genotype of hepatitis Cviruses, was launched in Europe in June. The testmakes it possible to provide individualised thera-pies tailored specifically to the infecting HCV geno-type.
Applied ScienceRoche Applied Science maintained its market posi-tion. A new addition to the business area’s portfolio,the LightCycler 480 system for high-throughputDNA amplification, is expected to contribute to asignificant increase in sales growth in the secondhalf of this year.
FDA announced that it would be conducting itsre-audit of the site at the end of July 2005.
Near Patient TestingRoche Near Patient Testing maintained its leader-ship in the fiercely competitive point-of-caremarket. The CoaguChek S system (coagulationmonitoring), Accutrend GC and GCT systems(cholesterol monitoring) and Cardiac Reader (eval-uation of suspected myocardial damage) made thebiggest contribution to sales. Sales of Omni S andOmni C blood gas analysers and reagents grewsignificantly faster than the market.
Recent clinical trial data show that self-manage-ment of anticoagulant therapy with the CoaguChekS system reduces the frequency of bleeding compli-cations by up to 70% and mortality after heart valvereplacement by up to 60%. In addition to protect-ing patients from potentially life-threatening risks,CoaguChek S can also help healthcare systemsreduce unnecessary treatment costs.
Centralized DiagnosticsGrowth in this business area was fuelled primarilyby the continued upward trend in immunodiag-nostics sales. Placements of Elecsys instrumentsrose approximately 20% for the period.
Additional data have confirmed the importance ofElecsys proBNP as a prognostic test for cardiovas-cular disease. A major study has now demonstratedthat NT-proBNP is the most reliable marker fordiagnosing heart failure in emergency patients.Another study has shown the clinical value of thisinnovative cardiac marker for stratifying risk inpatients with stable coronary artery disease.
Molecular DiagnosticsRoche Molecular Diagnostics continued to expandits market lead, helped by robust sales of bloodscreening and women’s health products, whichremain the business area’s key growth drivers.
In the roughly five years since Roche Diagnosticsentered the blood screening market, its PCR (poly-merase chain reaction)-based tests have been usedto screen more than 100 million blood donations.This makes PCR the most frequently used bloodscreening technology in the world.

15Half-Year Report 2005
Group and Divisional Results
An agreement signed with 454 Life Sciences (USA)in May of this year marks Roche Diagnostics’ entryinto the high-potential market for DNA sequencingproducts.
16 Half-Year Report 2005
Financial Review
Operating results
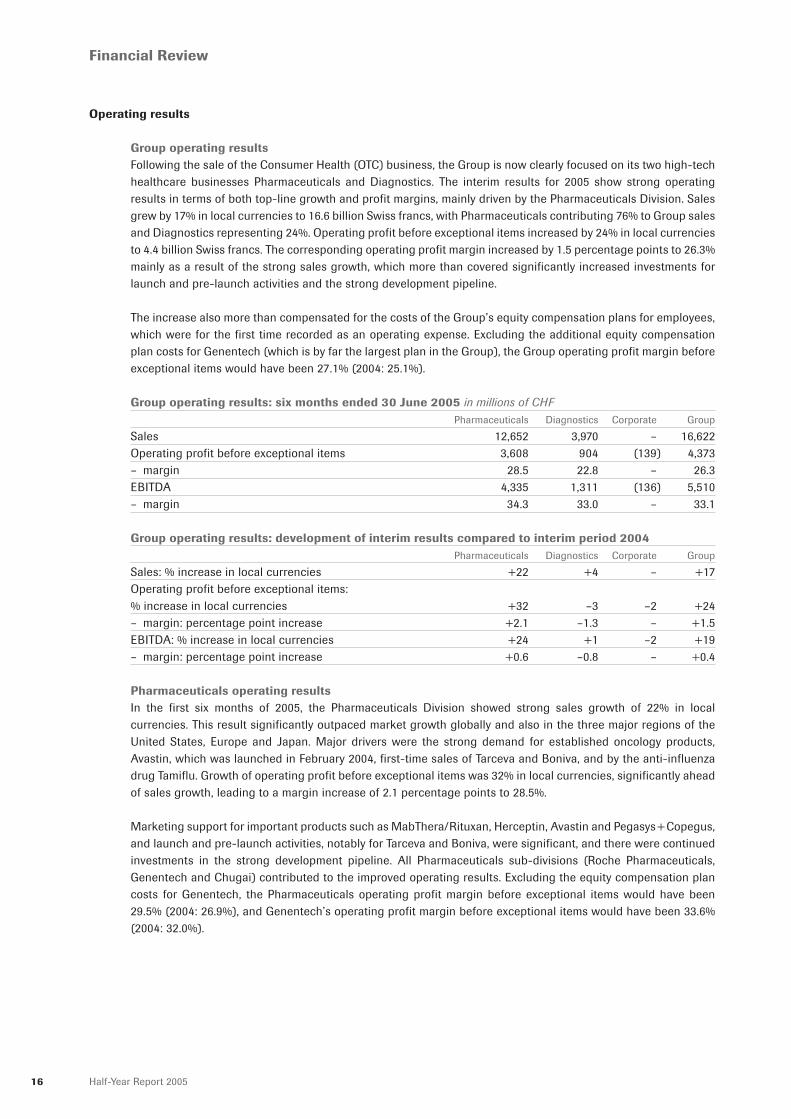
Group operating resultsFollowing the sale of the Consumer Health (OTC) business, the Group is now clearly focused on its two high-techhealthcare businesses Pharmaceuticals and Diagnostics. The interim results for 2005 show strong operatingresults in terms of both top-line growth and profit margins, mainly driven by the Pharmaceuticals Division. Salesgrew by 17% in local currencies to 16.6 billion Swiss francs, with Pharmaceuticals contributing 76% to Group salesand Diagnostics representing 24%. Operating profit before exceptional items increased by 24% in local currenciesto 4.4 billion Swiss francs. The corresponding operating profit margin increased by 1.5 percentage points to 26.3%mainly as a result of the strong sales growth, which more than covered significantly increased investments forlaunch and pre-launch activities and the strong development pipeline.
The increase also more than compensated for the costs of the Group’s equity compensation plans for employees,which were for the first time recorded as an operating expense. Excluding the additional equity compensationplan costs for Genentech (which is by far the largest plan in the Group), the Group operating profit margin beforeexceptional items would have been 27.1% (2004: 25.1%).
Group operating results: six months ended 30 June 2005 in millions of CHFPharmaceuticals Diagnostics Corporate Group
Sales 12,652 3,970 – 16,622Operating profit before exceptional items 3,608 904 (139) 4,373– margin 28.5 22.8 – 26.3EBITDA 4,335 1,311 (136) 5,510– margin 34.3 33.0 – 33.1
Group operating results: development of interim results compared to interim period 2004Pharmaceuticals Diagnostics Corporate Group
Sales: % increase in local currencies +22 +4 – +17Operating profit before exceptional items: % increase in local currencies +32 –3 –2 +24– margin: percentage point increase +2.1 –1.3 – +1.5EBITDA: % increase in local currencies +24 +1 –2 +19– margin: percentage point increase +0.6 –0.8 – +0.4
Pharmaceuticals operating resultsIn the first six months of 2005, the Pharmaceuticals Division showed strong sales growth of 22% in localcurrencies. This result significantly outpaced market growth globally and also in the three major regions of theUnited States, Europe and Japan. Major drivers were the strong demand for established oncology products,Avastin, which was launched in February 2004, first-time sales of Tarceva and Boniva, and by the anti-influenzadrug Tamiflu. Growth of operating profit before exceptional items was 32% in local currencies, significantly aheadof sales growth, leading to a margin increase of 2.1 percentage points to 28.5%.
Marketing support for important products such as MabThera/Rituxan, Herceptin, Avastin and Pegasys+Copegus,and launch and pre-launch activities, notably for Tarceva and Boniva, were significant, and there were continuedinvestments in the strong development pipeline. All Pharmaceuticals sub-divisions (Roche Pharmaceuticals,Genentech and Chugai) contributed to the improved operating results. Excluding the equity compensation plancosts for Genentech, the Pharmaceuticals operating profit margin before exceptional items would have been29.5% (2004: 26.9%), and Genentech’s operating profit margin before exceptional items would have been 33.6%(2004: 32.0%).

17Half-Year Report 2005
Financial Review
Pharmaceuticals Division results in millions of CHF
Six months ended 30 June % change % change2005 2004 (CHF) (local currencies)
Sales 12,652 10,647 +19 +22Royalties and other operating income 542 625 –13 –9Cost of sales (2,858) (2,310) +24 +25Marketing and distribution (3,366) (3,019) +11 +14Research and development (2,215) (2,029) +9 +12General and administration (815) (722) +13 +17Amortisation and impairment of intangible assets (332) (377) –12 –9Operating profit before exceptional items 3,608 2,815 +28 +32– margin 28.5 26.4 +2.1
EBITDA 4,335 3,584 +21 +24– margin 34.3 33.7 +0.6
Sales: The increase in sales was principally driven by 36% local currency sales growth in the oncology franchise,including Avastin, and first-time sales of Tarceva of 145 million Swiss francs. There was also strong growth (50%)in the virology franchise, mainly due to Tamiflu and Pegasys+Copegus, and the transplantation franchise (14%)with products such as CellCept and Valcyte/Cymevene. Boniva contributed first-time sales of 21 million Swissfrancs. A major growth contribution came from strong Tamiflu sales of 580 million Swiss francs compared to127 million Swiss francs in the interim period of 2004. This increase was partially due to the flu outbreak in thefirst quarter of 2005 (most notably in Japan) and partially due to government pandemic purchases.
Royalties and other operating income: The decrease was due to lower gains on product divestments in thefirst half of 2005 (11 million Swiss francs) compared to 215 million Swiss francs in the same period of 2004, whichincluded the disposal of Soriatane. This was partly offset by higher royalty income, notably from Genentech’s newlicence arrangement with ImClone on sales of Erbitux. There was also higher out-licensing income at RochePharmaceuticals, in particular milestone income following the FDA approval for Boniva in the United States.
Cost of sales: The increase of 25% in local currencies is slightly higher than the 22% increase in sales. This isprimarily due to 49 million Swiss francs paid by Genentech to cancel certain manufacturing obligations, togetherwith an increase of royalty expenses to 521 million Swiss francs from 409 million Swiss francs in the interim periodof 2004. These developments were partially compensated for by the sales growth in high-margin products,economies of scale in production and continuing productivity improvements.
Marketing and distribution: These costs increased by 14% in local currencies. This is lower than the growth insales, even taking into account the ongoing strong support for established products and for newly launchedproducts such as Avastin, Xolair, Tarceva, Raptiva and Boniva. Marketing and distribution as a percentage of salesdeclined by 1.8 percentage points to 26.6% compared to the first half of 2004. Excluding the equity compensationplan costs for Genentech, marketing and distribution costs would have also increased by 14% in local currencies.
Research and development: The increase of 12% in local currencies reflects the ongoing clinical developmentof the product pipeline and higher expenses for early-stage projects. Research and development costs as apercentage of sales were 17.5% in the first half of 2005, down 1.6 percentage points from the ratio in thecomparative period. Excluding the equity compensation plan costs for Genentech, research and developmentcosts would have increased by 10% in local currencies.
18 Half-Year Report 2005
Financial Review
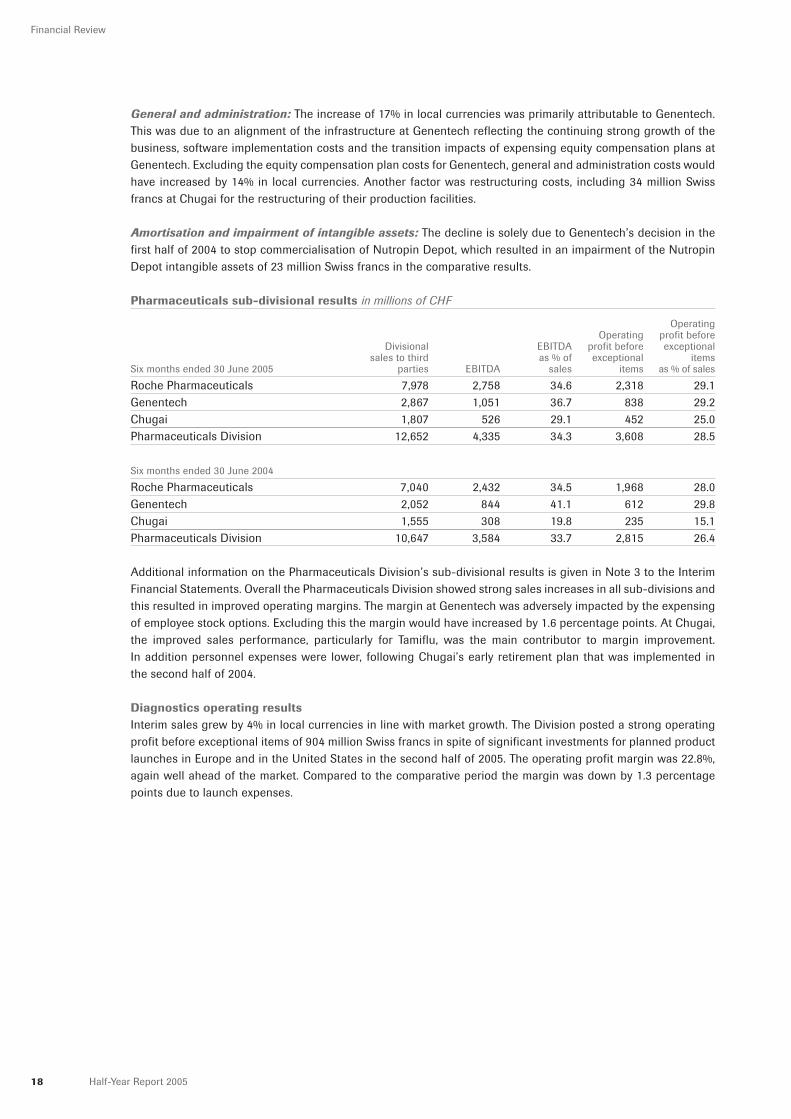
General and administration: The increase of 17% in local currencies was primarily attributable to Genentech.This was due to an alignment of the infrastructure at Genentech reflecting the continuing strong growth of thebusiness, software implementation costs and the transition impacts of expensing equity compensation plans atGenentech. Excluding the equity compensation plan costs for Genentech, general and administration costs wouldhave increased by 14% in local currencies. Another factor was restructuring costs, including 34 million Swissfrancs at Chugai for the restructuring of their production facilities.
Amortisation and impairment of intangible assets: The decline is solely due to Genentech’s decision in thefirst half of 2004 to stop commercialisation of Nutropin Depot, which resulted in an impairment of the NutropinDepot intangible assets of 23 million Swiss francs in the comparative results.
Pharmaceuticals sub-divisional results in millions of CHF
OperatingOperating profit before
Divisional EBITDA profit before exceptionalsales to third as % of exceptional items
Six months ended 30 June 2005 parties EBITDA sales items as % of sales
Roche Pharmaceuticals 7,978 2,758 34.6 2,318 29.1Genentech 2,867 1,051 36.7 838 29.2Chugai 1,807 526 29.1 452 25.0Pharmaceuticals Division 12,652 4,335 34.3 3,608 28.5
Six months ended 30 June 2004
Roche Pharmaceuticals 7,040 2,432 34.5 1,968 28.0Genentech 2,052 844 41.1 612 29.8Chugai 1,555 308 19.8 235 15.1Pharmaceuticals Division 10,647 3,584 33.7 2,815 26.4
Additional information on the Pharmaceuticals Division’s sub-divisional results is given in Note 3 to the InterimFinancial Statements. Overall the Pharmaceuticals Division showed strong sales increases in all sub-divisions andthis resulted in improved operating margins. The margin at Genentech was adversely impacted by the expensingof employee stock options. Excluding this the margin would have increased by 1.6 percentage points. At Chugai,the improved sales performance, particularly for Tamiflu, was the main contributor to margin improvement.In addition personnel expenses were lower, following Chugai’s early retirement plan that was implemented inthe second half of 2004.
Diagnostics operating resultsInterim sales grew by 4% in local currencies in line with market growth. The Division posted a strong operatingprofit before exceptional items of 904 million Swiss francs in spite of significant investments for planned productlaunches in Europe and in the United States in the second half of 2005. The operating profit margin was 22.8%,again well ahead of the market. Compared to the comparative period the margin was down by 1.3 percentagepoints due to launch expenses.

19Half-Year Report 2005
Financial Review
Diagnostics Division results in millions of CHF
Six months ended 30 June % change % change2005 2004 (CHF) (local currencies)
Sales 3,970 3,879 +2 +4Royalties and other operating income 168 165 +2 +5Cost of sales (1,490) (1,450) +3 +5Marketing and distribution (1,043) (981) +6 +8Research and development (344) (332) +4 +5General and administration (191) (195) –2 –1Amortisation and impairment of intangible assets (166) (152) +9 +12Operating profit before exceptional items 904 934 –3 –3– margin 22.8 24.1 –1.3
EBITDA 1,311 1,311 0 +1– margin 33.0 33.8 –0.8
Sales: The sales increase of 4% in local currencies (2% in Swiss francs) represents an impressive result, takinginto account the previous year’s strong first half. The Molecular Diagnostics business (6%) and the Diabetes Care(3%) and Immunodiagnostics (11%) portfolios all made major contributions to growth.
Royalties and other operating income: In the first half of 2005 royalty income increased by 5% in localcurrencies, mainly from the granting of PCR licences. This result was achieved despite the substantial one-offroyalty income from BioVeris of 63 million Swiss francs in the comparative period.
Cost of sales: The increase of 5% in local currencies was slightly more than sales growth. The main reasons forthis were production start-up costs in the United States and higher production costs for products with enhancedcustomer features. The absence of the royalty expenses paid to Igen, which was acquired by the Group during2004, and further improvements in manufacturing productivity partially compensated for this development. Costof sales includes royalty expenses of 113 million Swiss francs (2004: 151 million Swiss francs).
Marketing and distribution: The increase of 8% in local currencies was higher than the increase in sales. Thisis a result of the launch of a number of new Diabetes Care products such as the Accu-Chek Aviva blood glucosemeter in selected European markets and from the pre-launch activities for these products in major Europeanmarkets and in the United States. Therefore, marketing and distribution as a percentage of sales increased by1.0 percentage points to 26.3%.
Research and development: Interim costs grew by 5% in local currencies, slightly more than sales. This is dueto investment in the strong product pipeline and establishing a global clinical trial fund. As a percentage of sales,research and development cost remained basically stable at 8.7%.
General and administration: Interim costs were stable, showing a decrease of 4 million Swiss francs (1% lowerin local currencies).
Amortisation and impairment of intangible assets: The increase is partially due to the amortisation of theintangible assets acquired in the Igen acquisition. The 2005 interim results include a charge of 29 million Swissfrancs compared to 20 million Swiss francs in the 2004 interim results (representing 4 months since acquisition).Amortisation expenses for recently acquired licence rights account for the rest of the increase.
Corporate operating costsGeneral and administration: Costs in the interim period were stable at 139 million Swiss francs (142 millionSwiss francs in 2004).

20 Half-Year Report 2005
Financial Review
Exceptional operating items
Exceptional operating items in millions of CHF
Pharmaceuticals Diagnostics Corporate Roche GroupSix months ended 30 June 2005 2004 2005 2004 2005 2004 2005 2004
Operating profit before exceptional items 3,608 2,815 904 934 (139) (142) 4,373 3,607Amortisation of goodwill – (120) – (162) – – – (282)Major legal cases – – (146) – – – (146) –Changes in Group organisation – – – – – – – –Operating profit 3,608 2,695 758 772 (139) (142) 4,227 3,325
Amortisation of goodwill: Following the International Financial Reporting Standards changes the amortisationof goodwill ceased effective 1 January 2005. No impairments to goodwill were recorded.
Major legal cases: During the interim period provisions for certain litigation and arbitration matters in theDiagnostics Division were increased by 146 million Swiss francs. The provisions recorded are based on currentlitigation and settlement negotiations and recent settlement agreements.
Changes in Group organisation: There were no significant developments in 2005 and no additional income orexpenses were recorded.
Operating profit: Overall operating profit increased by 902 million Swiss francs or 30% in local currencies. Thisreflects the continued improvement in the Group’s operating performance. The additional costs for expensingof Genentech equity compensation plans of 126 million Swiss francs (2004: 45 million Swiss francs) were morethan compensated for by the absence of goodwill amortisation expenses of 282 million Swiss francs.
Non-operating results
Non-operating results in millions of CHF
Six months ended 30 June2005 2004
Operating profit 4,227 3,325
Associated companies – (27)Financial income 241 213Financing costs (187) (383)Exceptional income from bond conversion and redemption – 965Profit before taxes 4,281 4,093
Income taxes (1,040) (1,084)Profit from continuing businesses 3,241 3,009
Profit from discontinued businesses 1 112Net income 3,242 3,121
Attributable to– Roche shareholders 2,798 2,911– Minority interests 444 210

21Half-Year Report 2005
Financial Review
During the interim period, the Group’s treasury operations delivered a positive net financial income, with the netincome from financial assets and foreign exchange management exceeding financing costs by 54 million Swissfrancs. The redemption of the ‘Sumo’ bonds in March 2005 will further reduce borrowing costs. The Group’seffective tax rate was reduced, mainly due to the discontinuation of amortisation of goodwill from 1 January 2005.Profit from continuing businesses increased due to the combination of positive developments on the operating,financial and tax lines, which more than compensated for the exceptional financial income in the interim 2004results. Excluding this after-tax amount of 687 million Swiss francs and other exceptional items, profit fromcontinuing businesses increased by 728 million Swiss francs or 28%. Net income increased by 121 million Swissfrancs to 3.2 billion Swiss francs.
Associated companies: The result of associates was not significant.
Financial income: Financial income showed further improvement. Interim net income from equity securities was122 million Swiss francs compared to 106 million Swiss francs in 2004. Interest income and income from debtsecurities more than doubled to 172 million Swiss francs due to higher holdings and increases in US interest rates.Interim net foreign exchange losses were 65 million Swiss francs compared to gains of 9 million Swiss francs in2004. A full analysis of financial income is given in Note 9 to the Interim Financial Statements.
Financing costs: Total financing costs were 187 million Swiss francs in the interim period, a reduction of 51%.This was mainly due to the retirement of various debt instruments and a reduction in bank borrowings. A fullanalysis of financing costs is given in Note 9 to the Interim Financial Statements.
Exceptional income from bond conversion and redemption: During the interim period of 2004 as part of thecontinuing refinancing and restructuring of the Group’s debt, the ‘LYONs IV’ and ‘LYONs III’ notes were called forredemption and the Group also redeemed part of the ‘Chameleon’ bond by a public tender. A net pre-tax gain of965 million Swiss francs arose from these transactions, primarily from the Group’s partial disposal of its interestin Genentech on the conversion of the ‘LYONs IV’ notes.
Income taxes: The Group’s effective tax rate was 24.3% compared to the 2004 interim rate of 26.5%. The maininfluence was the discontinuation of goodwill amortisation in the 2005 results, which reduced the rate byapproximately 2% in the interim period. The underlying tax rate shows an increase, reflecting the increasingrelative contribution of Genentech and Chugai to the Group’s overall results. A reconciliation of the effective taxrate is given in Note 10 to the Interim Financial Statements.
Profit from continuing businesses: The increase of 8% compared to 2004 is mainly due to the positivedevelopments on the operating, financial and tax lines, which more than offset the exceptional financial incomeof 687 million Swiss francs (after-tax) in the interim 2004 results. Excluding this and other exceptional items, profitfrom continuing businesses increased by 728 million Swiss francs or 28%.
Discontinued businesses: The 2005 results include the operating results for the remaining 2% of the OTC(Consumer Health) business that was transferred to Bayer in the first quarter of 2005. The comparative interimresults include the results of the whole OTC (Consumer Health) business, which was still fully owned by the RocheGroup at 30 June 2004. Further information about discontinued businesses is given in Note 6 to the InterimFinancial Statements.
Net income: In the first half of 2005 Group net income increased by 4% to 3.2 billion Swiss francs and the returnon sales margin was 19.5%. Net income attributable to the Roche shareholders was slightly lower than in thecomparative period (which includes the exceptional financial income of 687 million Swiss francs, after-tax),whereas the share of net income attributable to minorities increased due to the continually improving profitcontribution by Genentech and Chugai. Of net income, 276 million Swiss francs are attributable to Genentechminority interests and 162 million Swiss francs to Chugai minority interests.
22 Half-Year Report 2005
Financial Review
EPS and Core EPS: Diluted EPS decreased by 4% to 3.26 CHF from 3.40 CHF. Again, the increase in overall netincome was offset by the various exceptional items and the increase in net income attributable to minority interests.The Core EPS, which excludes exceptional items and also amortisation of intangible assets, increased by 21% to3.69 CHF from 3.06 CHF. This shows the underlying improvements in the Group’s operating, financial and tax results.Supplementary net income and EPS information is given on page 46. This includes calculations of profit fromcontinuing businesses before exceptional items and Core EPS and reconciles these to the Group’s publishedIFRS results.
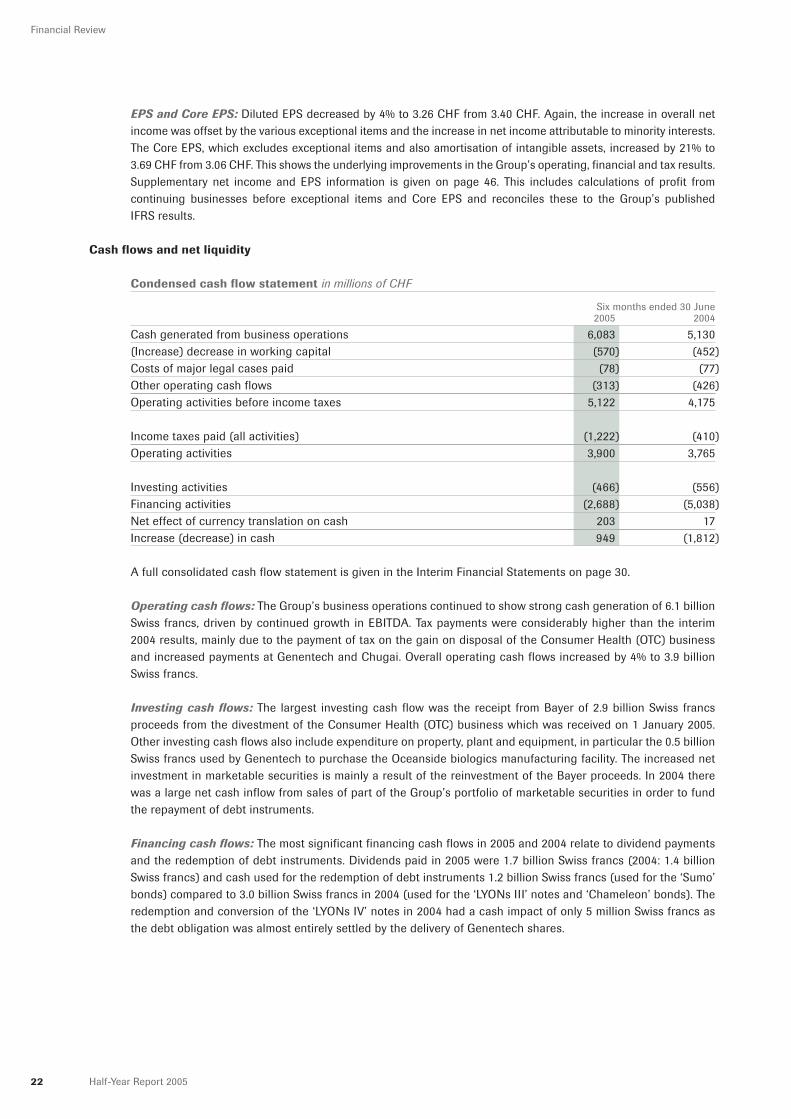
Cash flows and net liquidity
Condensed cash flow statement in millions of CHF
Six months ended 30 June2005 2004
Cash generated from business operations 6,083 5,130(Increase) decrease in working capital (570) (452)Costs of major legal cases paid (78) (77)Other operating cash flows (313) (426)Operating activities before income taxes 5,122 4,175
Income taxes paid (all activities) (1,222) (410)Operating activities 3,900 3,765
Investing activities (466) (556)Financing activities (2,688) (5,038)Net effect of currency translation on cash 203 17Increase (decrease) in cash 949 (1,812)
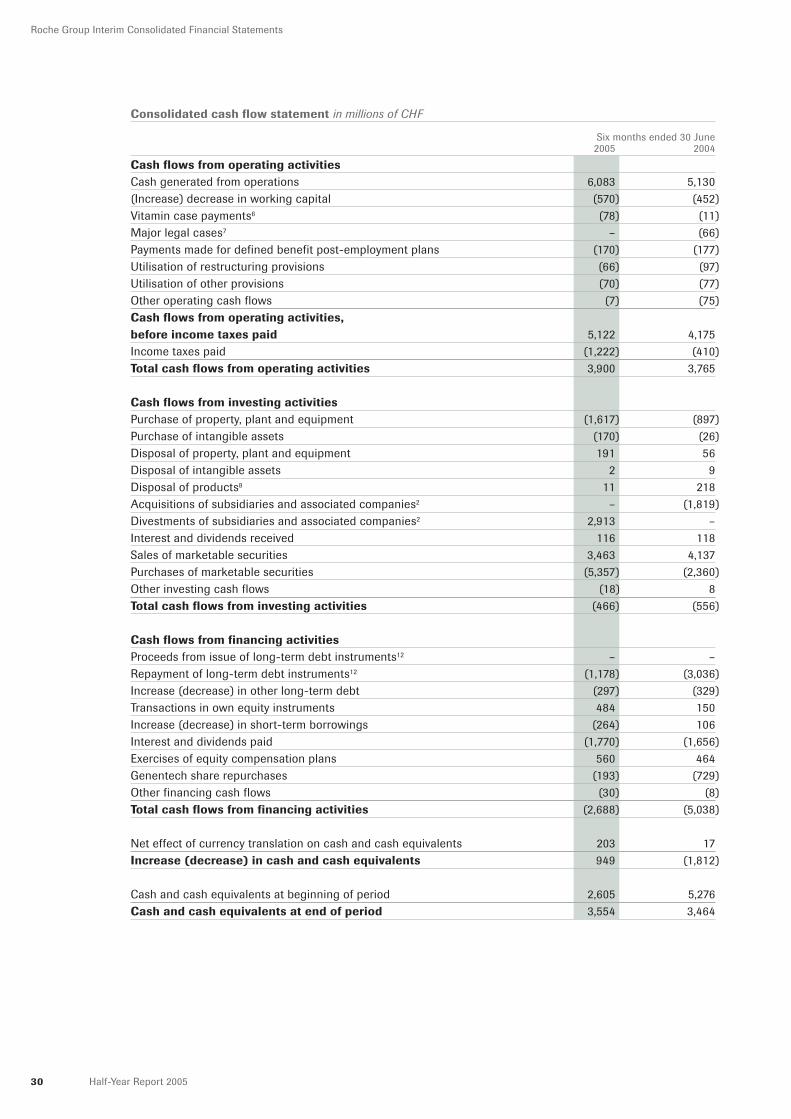
A full consolidated cash flow statement is given in the Interim Financial Statements on page 30.
Operating cash flows: The Group’s business operations continued to show strong cash generation of 6.1 billionSwiss francs, driven by continued growth in EBITDA. Tax payments were considerably higher than the interim2004 results, mainly due to the payment of tax on the gain on disposal of the Consumer Health (OTC) businessand increased payments at Genentech and Chugai. Overall operating cash flows increased by 4% to 3.9 billionSwiss francs.
Investing cash flows: The largest investing cash flow was the receipt from Bayer of 2.9 billion Swiss francsproceeds from the divestment of the Consumer Health (OTC) business which was received on 1 January 2005.Other investing cash flows also include expenditure on property, plant and equipment, in particular the 0.5 billionSwiss francs used by Genentech to purchase the Oceanside biologics manufacturing facility. The increased netinvestment in marketable securities is mainly a result of the reinvestment of the Bayer proceeds. In 2004 therewas a large net cash inflow from sales of part of the Group’s portfolio of marketable securities in order to fundthe repayment of debt instruments.
Financing cash flows: The most significant financing cash flows in 2005 and 2004 relate to dividend paymentsand the redemption of debt instruments. Dividends paid in 2005 were 1.7 billion Swiss francs (2004: 1.4 billionSwiss francs) and cash used for the redemption of debt instruments 1.2 billion Swiss francs (used for the ‘Sumo’bonds) compared to 3.0 billion Swiss francs in 2004 (used for the ‘LYONs III’ notes and ‘Chameleon’ bonds). Theredemption and conversion of the ‘LYONs IV’ notes in 2004 had a cash impact of only 5 million Swiss francs asthe debt obligation was almost entirely settled by the delivery of Genentech shares.

23Half-Year Report 2005
Financial Review
Net liquidity in millions of CHF
30 June 31 December2005 2004 % change
Cash and marketable securities 16,402 12,999 +26Receivable from Bayer Group collected on 1 January 2005 – 2,886 –100Financial long-term assets and restricted cash 1,873 1,999 –6Derivative financial instruments, net 205 (19) –Own equity instruments 2,953 2,803 +5Financial assets 21,433 20,668 +4
Long-term debt (7,354) (6,947) +6Short-term debt (478) (2,013) –76Total debt (7,832) (8,960) –13
Net liquidity 13,601 11,708 +16
Net liquidity increased during the interim period, the main driver being a strong cash inflow from operatingactivities of 3.9 billion Swiss francs. The payment of the dividend reduced net liquidity by 1.7 billion Swiss francs.The purchase of the Oceanside biologics manufacturing facility by Genentech reduced net liquidity by 0.5 billionSwiss francs. The ‘Sumo’ redemption reduces both debt and cash and therefore has no effect on net liquidity.
Balance sheet
Condensed balance sheet in millions of CHF
30 June 31 December2005 2004 % change
Long-term assets 31,802 28,722 +11Current assets 30,946 29,679 +4Total assets 62,748 58,401 +7
Equity 38,833 33,368 +16Non-current liabilities 15,970 14,899 +7Current liabilities 7,945 10,134 –22Total equity and liabilities 62,748 58,401 +7
A full consolidated balance sheet is given in the Interim Financial Statements on page 28.
Long-term assets: The increase in the US dollar to 1.28 against the Swiss franc during the interim period increasedlong-term assets in Swiss franc terms since many of the Group’s production facilities and intangible assets areUS dollar denominated. The purchase of the Oceanside biologics manufacturing facility by Genentech increasedproperty, plant and equipment by 0.5 billion Swiss francs. Following the decision of the California Supreme Court inFebruary 2005 to review the litigation between Genentech and the City of Hope, the surety bond of 0.9 billion Swissfrancs that was posted by Genentech in 2002 has been reclassified from current assets to long-term assets.
Current assets: Current assets decreased by the 1.7 billion Swiss francs cash used for payment of dividends andthe 1.2 billion Swiss francs cash used in the redemption of the ‘Sumo’ bonds.
Equity: The most significant movements were the net income of 3.2 billion Swiss francs, the dividend payment of1.7 billion Swiss francs and currency translation gains of 2.3 billion Swiss francs. Equity compensation plan effectswere 1.3 billion Swiss francs, being mostly cash received from exercises and tax benefits.
Non-current liabilities: The movement in the US dollar rates increased the Swiss franc carrying value of theGroup’s US dollar denominated debt instruments. The provision of 0.8 billion Swiss francs made by Genentech forthe City of Hope litigation has been reclassified from current liabilities to non-current liabilities.
24 Half-Year Report 2005
Financial Review
Current liabilities: The redemption of the ‘Sumo’ bonds reduced short-term debt by 1.2 billion Swiss francs.
Strong financial condition: The Group remains solidly financed, with equity (including minority interests)representing 62% of total assets and 87% of total assets financed long-term.
Financial risks
Foreign exchange risk: During the first half of 2005 the management of exposures has maintained foreignexchange risks at relatively low levels.
Interest rate risk: The Group has further reduced its outstanding debt since the year-end through repayment ofbank debt and the redemption of the ‘Sumo’ bonds. The comparatively small risks from re-pricing or re-financingwere contained at reasonable levels.
Market risk of financial assets: The Group’s financial assets are mostly allocated to highly liquid fixed incomeand money market instruments. The Group has not made any new investments in equity securities.
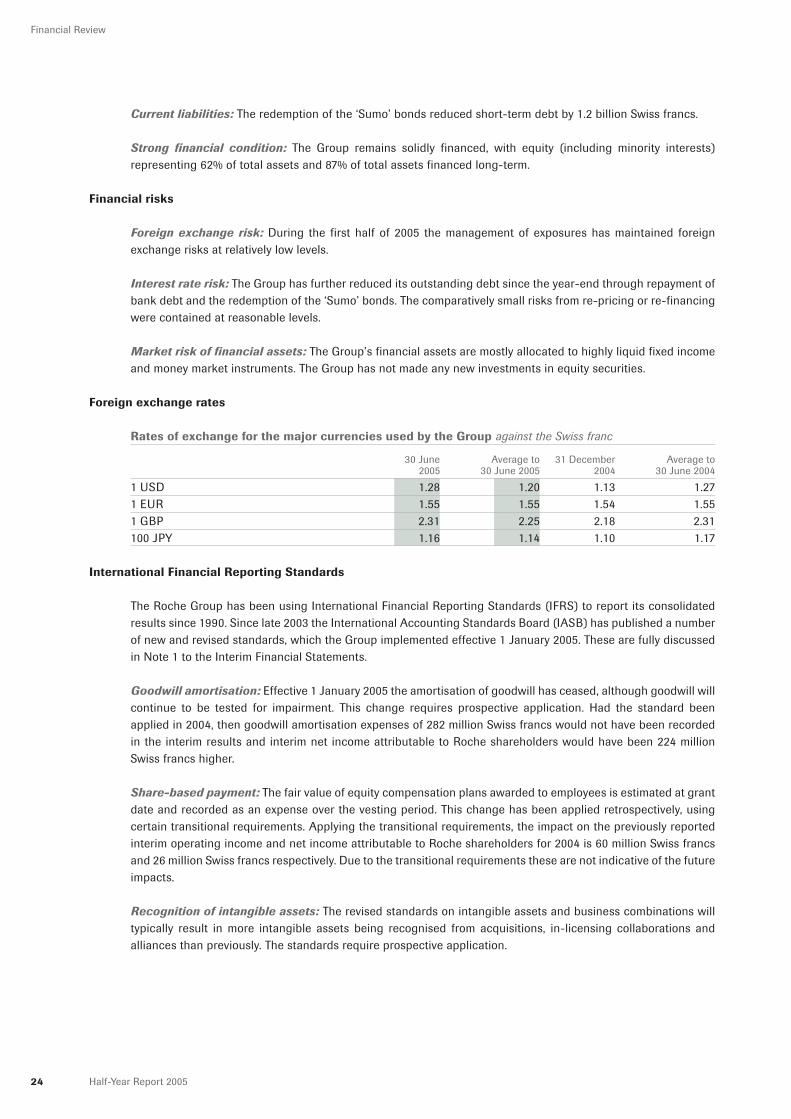
Foreign exchange rates
Rates of exchange for the major currencies used by the Group against the Swiss franc
30 June Average to 31 December Average to2005 30 June 2005 2004 30 June 2004
1 USD 1.28 1.20 1.13 1.271 EUR 1.55 1.55 1.54 1.551 GBP 2.31 2.25 2.18 2.31100 JPY 1.16 1.14 1.10 1.17
International Financial Reporting Standards
The Roche Group has been using International Financial Reporting Standards (IFRS) to report its consolidatedresults since 1990. Since late 2003 the International Accounting Standards Board (IASB) has published a numberof new and revised standards, which the Group implemented effective 1 January 2005. These are fully discussedin Note 1 to the Interim Financial Statements.
Goodwill amortisation: Effective 1 January 2005 the amortisation of goodwill has ceased, although goodwill willcontinue to be tested for impairment. This change requires prospective application. Had the standard beenapplied in 2004, then goodwill amortisation expenses of 282 million Swiss francs would not have been recordedin the interim results and interim net income attributable to Roche shareholders would have been 224 millionSwiss francs higher.
Share-based payment: The fair value of equity compensation plans awarded to employees is estimated at grantdate and recorded as an expense over the vesting period. This change has been applied retrospectively, usingcertain transitional requirements. Applying the transitional requirements, the impact on the previously reportedinterim operating income and net income attributable to Roche shareholders for 2004 is 60 million Swiss francsand 26 million Swiss francs respectively. Due to the transitional requirements these are not indicative of the futureimpacts.
Recognition of intangible assets: The revised standards on intangible assets and business combinations willtypically result in more intangible assets being recognised from acquisitions, in-licensing collaborations andalliances than previously. The standards require prospective application.

25Half-Year Report 2005
Financial Review
Financial instruments: The Group had already fully applied the previous IAS 39 on ‘Financial Instruments’ since2001. The changes to the standards on financial instruments, which require retrospective application, do not havea significant effect.
Equity and minority interests: Minority interests is now included as part of the Group’s equity and not as aseparate category on the balance sheet. This increases the Group’s equity by 5,594 million Swiss francs, appliedretrospectively to 1 January 2004.
Presentation of income statement: Following the above changes the Group has revised the presentation of theincome statement, which now includes a full divisional split of the Group’s operating results. These changes weremade in accordance with the requirements of the new and revised standards and in order to further improvecomparability of results to other healthcare companies and to allow readers to make a more accurate assessmentof the sustainable earnings capacity of the Group. The comparative results in the Interim Financial Statementshave been restated into the new format.
Full details of the changes are given in Note 1 to the Interim Financial Statements. Supplementary presentationmaterials from the investor update held on 8 March 2005 are available on the ‘Investor Relations’ section of theGroup’s website at www.roche.com.

26 Half-Year Report 2005
Roche Group Interim Consolidated Financial Statements
Reference numbers indicate the corresponding Notes to the Interim Consolidated Financial Statements. The InterimConsolidated Financial Statements are unaudited. The Interim Consolidated Financial Statements have been reviewed bythe Group’s auditors and their review report is presented on page 45.
Consolidated income statement for the six months ended 30 June 2005 in millions of CHF Pharmaceuticals Diagnostics Corporate Group
Sales3 12,652 3,970 – 16,622Royalties and other operating income8 542 168 – 710Cost of sales (2,858) (1,490) – (4,348)Marketing and distribution (3,366) (1,043) – (4,409)Research and development3 (2,215) (344) – (2,559)General and administration (815) (191) (139) (1,145)Amortisation and impairment of intangible assets3 (332) (166) – (498)Operating profit before exceptional items3 3,608 904 (139) 4,373
Amortisation of goodwill3 – – – –Major legal cases7 – (146) – (146)Changes in Group organisation2 – – – –Operating profit3 3,608 758 (139) 4,227
Associated companies –Financial income9 241Financing costs9 (187)Profit before taxes 4,281
Income taxes10 (1,040)Profit from continuing businesses 3,241
Profit from discontinued businesses6 1Net income 3,242
Attributable to – Roche shareholders 2,798– Minority interests 444
ContinuingEarnings per share and non-voting equity security businesses Group
Basic (CHF) 3.32 3.32Diluted (CHF) 3.26 3.26

27Half-Year Report 2005
Roche Group Interim Consolidated Financial Statements
Consolidated income statement for the six months ended 30 June 2004 in millions of CHFPharmaceuticals Diagnostics Corporate Group
Sales3 10,647 3,879 – 14,526Royalties and other operating income8 625 165 – 790Cost of sales (2,310) (1,450) – (3,760)Marketing and distribution (3,019) (981) – (4,000)Research and development3 (2,029) (332) – (2,361)General and administration (722) (195) (142) (1,059)Amortisation and impairment of intangible assets3 (377) (152) – (529)Operating profit before exceptional items3 2,815 934 (142) 3,607
Amortisation of goodwill3 (120) (162) – (282)Major legal cases7 – – – –Changes in Group organisation2 – – – –Operating profit3 2,695 772 (142) 3,325
Associated companies (27)Financial income9 213Financing costs9 (383)Exceptional income from bond conversion and redemption9 965Profit before taxes 4,093
Income taxes10 (1,084)Profit from continuing businesses 3,009
Profit from discontinued businesses6 112Net income 3,121
Attributable to – Roche shareholders 2,911– Minority interests 210
ContinuingEarnings per share and non-voting equity security businesses Group
Basic (CHF) 3.34 3.46Diluted (CHF) 3.28 3.40
As disclosed in Note 1, the income statement for 2004 has been restated following the changes in IFRS that were adopted effective1 January 2005. A reconciliation to the previously published income statement is provided in Note 1.

28 Half-Year Report 2005
Roche Group Interim Consolidated Financial Statements
Consolidated balance sheet in millions of CHF
30 June 31 December2005 2004
Long-term assetsProperty, plant and equipment 14,048 12,408Goodwill 5,963 5,532Intangible assets 6,338 6,340Investments in associated companies 54 55Financial long-term assets 1,873 1,227Other long-term assets 560 484Deferred income tax assets 1,356 1,099Post-employment benefits 1,610 1,577Total long-term assets 31,802 28,722
Current assetsInventories 4,931 4,614Accounts receivable 7,664 7,014Current income tax assets 311 159Other current assets 1,638 2,007Marketable securities 12,848 10,394Receivable from Bayer Group collected on 1 January 20056 – 2,886Cash and cash equivalents 3,554 2,605Total current assets 30,946 29,679
Total assets 62,748 58,401
EquityShare capital 160 160Non-voting equity securities (Genussscheine) p.m. p.m.Own equity instruments (3,795) (4,326)Retained earnings 37,571 35,890Fair value and other reserves (1,976) (3,641)Equity attributable to Roche shareholders 31,960 28,083Minority interests 6,873 5,285Total equity 38,833 33,368
Non-current liabilitiesLong-term debt 7,354 6,947Deferred income tax liabilities 3,280 3,564Liabilities for post-employment benefits 2,836 2,744Provisions11 1,570 683Other non-current liabilities 930 961Total non-current liabilities 15,970 14,899
Current liabilitiesShort-term debt 478 2,013Current income tax liabilities 792 947Provisions11 666 1,223Accounts payable 1,635 1,844Accrued and other current liabilities 4,374 4,107Total current liabilities 7,945 10,134
Total equity and liabilities 62,748 58,401
p.m. = pro memoria. Non-voting equity securities have no nominal value.

29Half-Year Report 2005
Roche Group Interim Consolidated Financial Statements
Consolidated condensed statement of changes in equity in millions of CHF
Six months ended 30 June2005 2004
Share capital Balance at 1 January and at period end 160 160
Non-voting equity securities (Genussscheine)Balance at 1 January and at period end p.m. p.m.
Own equity instruments Balance at 1 January (4,326) (4,583)Movements during the period 531 187Balance at period end (3,795) (4,396)
Retained earningsBalance at 1 January – as previously reported 35,890 30,985Changes in accounting policy1 – (126)Balance at 1 January – restated 35,890 30,859Net income attributable to Roche shareholders 2,798 2,911Dividends paid (1,721) (1,414)Equity compensation plans 688 444Genentech and Chugai share repurchases (108) (411)Convertible debt instruments 24 105Balance at period end 37,571 32,494
Fair value and other reserves Balance at 1 January (3,641) (2,992)Changes in accounting policy1 – 186Balance at 1 January – restated (3,641) (2,806)Convertible debt instruments (24) (71)Changes in fair value attributable to available-for-sale investments and qualifying cash flow hedges (14) 127Fair value (gains) losses attributable to available-for-sale investments and qualifying cash flow hedges recognised in the income statement (63) (65)Fair value (gains) losses attributable to qualifying cash flow hedges transferred to adjust the initial measurement of acquisition cost of assets or other carrying amount of hedged assets – 43Deferred income taxes and minority interests 63 (47)Currency translation gains (losses) 1,703 88Balance at period end (1,976) (2,731)
Equity attributable to Roche shareholders 31,960 25,527
Minority interestsBalance at 1 January – as previously reported, restated as equity 5,285 5,594Changes in accounting policy1 – (164)Balance at 1 January – restated 5,285 5,430Net income attributable to minority interests 444 210Dividends paid – Chugai and other minority shareholders (32) (41)Equity compensation plans 653 383Genentech and Chugai share repurchases (85) (318)Convertible debt instruments 8 79Currency translation gains (losses) 600 98Balance at period end 6,873 5,841
Total equity at period end 38,833 31,368
p.m. = pro memoria. Non-voting equity securities have no nominal value.
30 Half-Year Report 2005
Roche Group Interim Consolidated Financial Statements
Consolidated cash flow statement in millions of CHF
Six months ended 30 June2005 2004
Cash flows from operating activitiesCash generated from operations 6,083 5,130(Increase) decrease in working capital (570) (452)Vitamin case payments6 (78) (11)Major legal cases7 – (66)Payments made for defined benefit post-employment plans (170) (177)Utilisation of restructuring provisions (66) (97)Utilisation of other provisions (70) (77)Other operating cash flows (7) (75)Cash flows from operating activities, before income taxes paid 5,122 4,175Income taxes paid (1,222) (410)Total cash flows from operating activities 3,900 3,765
Cash flows from investing activitiesPurchase of property, plant and equipment (1,617) (897)Purchase of intangible assets (170) (26)Disposal of property, plant and equipment 191 56Disposal of intangible assets 2 9Disposal of products8 11 218Acquisitions of subsidiaries and associated companies2 – (1,819)Divestments of subsidiaries and associated companies2 2,913 –Interest and dividends received 116 118Sales of marketable securities 3,463 4,137Purchases of marketable securities (5,357) (2,360)Other investing cash flows (18) 8Total cash flows from investing activities (466) (556)
Cash flows from financing activitiesProceeds from issue of long-term debt instruments12 – –Repayment of long-term debt instruments12 (1,178) (3,036)Increase (decrease) in other long-term debt (297) (329)Transactions in own equity instruments 484 150Increase (decrease) in short-term borrowings (264) 106Interest and dividends paid (1,770) (1,656)Exercises of equity compensation plans 560 464Genentech share repurchases (193) (729)Other financing cash flows (30) (8)Total cash flows from financing activities (2,688) (5,038)
Net effect of currency translation on cash and cash equivalents 203 17Increase (decrease) in cash and cash equivalents 949 (1,812)
Cash and cash equivalents at beginning of period 2,605 5,276Cash and cash equivalents at end of period 3,554 3,464
31Half-Year Report 2005
Notes to the Roche Group Interim Consolidated Financial Statements
Reference numbers indicate the corresponding Notes to the Interim Consolidated Financial Statements.The Interim Consolidated Financial Statements are unaudited. The Interim Consolidated Financial Statements have beenreviewed by the Group’s auditors and their review report is presented on page 45.
1. Accounting policies
Basis of preparation of financial statementsThese financial statements are the unaudited interim consolidated financial statements (hereafter ‘the InterimFinancial Statements’) of Roche Holding Ltd, a company registered in Switzerland, and its subsidiaries (hereafter‘the Group’) for the six-month period ended 30 June 2005 (hereafter ‘the interim period’). They are prepared inaccordance with the International Accounting Standard 34 (IAS 34) ‘Interim Financial Reporting’. These InterimFinancial Statements should be read in conjunction with the Consolidated Financial Statements for the yearended 31 December 2004 (hereafter ‘the Annual Financial Statements’), as they provide an update of previouslyreported information. They were approved for issue by the Board of Directors on 19 July 2005.
The accounting policies used are consistent with those used in the Annual Financial Statements, except wherenoted below. The presentation of the Interim Financial Statements is consistent with the Annual FinancialStatements, except where noted below. Where necessary, the comparatives have been reclassified or extendedfrom the previously reported Interim Financial Statements to take into account any presentational changes madein the Annual Financial Statements or in these Interim Financial Statements.
The preparation of the Interim Financial Statements requires management to make estimates and assumptionsthat affect the reported amounts of revenues, expenses, assets, liabilities and disclosure of contingent liabilitiesat the date of the Interim Financial Statements. If in the future such estimates and assumptions, which are basedon management’s best judgement at the date of the Interim Financial Statements, deviate from the actualcircumstances, the original estimates and assumptions will be modified as appropriate in the period in which thecircumstances change.
The Group operates in industries where significant seasonal or cyclical variations in total sales are notexperienced during the financial year. Income tax expense is recognised based upon the best estimate of theweighted average income tax rate expected for the full financial year.
Changes in accounting policiesIn late 2003 the International Accounting Standards Board (IASB) published a revised version of IAS 32 ‘FinancialInstruments: Disclosure and Presentation’, a revised version of IAS 39 ‘Financial Instruments: Recognition andMeasurement’ and ‘Improvements to International Accounting Standards’, which makes changes to 14 existingstandards. In the first quarter of 2004 the IASB published IFRS 2 ‘Share-based Payment’, IFRS 3 ‘BusinessCombinations’, IFRS 4 ‘Insurance Contracts’, IFRS 5 ‘Non-current Assets Held for Sale and DiscontinuedOperations’, revised versions of IAS 36 ‘Impairment of Assets’ and IAS 38 ‘Intangible Assets’ and furtheramendments to IAS 39. The Group adopted these effective 1 January 2005. A description of these changes andtheir effect on the Interim Financial Statements is given below.
The Group is currently assessing the potential impacts of the new and revised standards that will be effective from1 January 2006.
IAS 8: ‘Accounting Policies, Changes in Accounting Estimates and Errors’. Amongst other matters therevised standard requires that changes in accounting policies that arise from the application of new or revisedstandards and interpretations are applied retrospectively, unless otherwise specified in the transitionalrequirements of the particular standard or interpretation. Previously the Group has applied all changesprospectively, unless otherwise specified in the transitional requirements.
Retrospective application means that the results of the comparative period and the opening balances of thatperiod are restated as if the new accounting policy had always been applied. Prospective application means thatthe new accounting policy is only applied to the results of the current period and the comparative period is notrestated.

32 Half-Year Report 2005
Notes to the Roche Group Interim Consolidated Financial Statements
IFRS 2: ‘Share-based Payment’. Amongst other matters, the new standard requires that the fair value of allequity compensation plans awarded to employees be estimated at grant date and recorded as an expense overthe vesting period. The expense is charged against the appropriate income statement heading. Under the Group’sprevious policy no expenses were recorded for equity-settled equity compensation plans. Expenses for cash-settled equity compensation plans were recorded based on the intrinsic value of the outstanding obligation aspart of ‘Other operating expenses’. The standard also requires retrospective application, within certain transitionalrequirements. Applying the transitional requirements, a pre-tax expense of 197 million Swiss francs has beenrecorded in the interim period (98 million Swiss francs in the restated interim period of 2004). Due to the impactof the transitional requirements these amounts are not indicative of the future expenses for such plans. Expensesfor cash-settled plans totalling 38 million Swiss francs in the interim period of 2004 were reclassified from ‘Otheroperating expenses’.
Expenses for equity compensation plans in interim results in millions of CHF
Retrospective Previously reported Total Total application as ‘Other operating Interim 2004 Interim
of IFRS 2 expenses’ (restated) 2005
Cost of sales 3 2 5 11Marketing and distribution 9 8 17 43Research and development 22 6 28 79General and administration 26 22 48 64Total operating expense 60 38 98 197
The new standard also affects the Group’s effective tax rate, as deferred tax is recorded based on the expectedtax benefits arising from vested awards. In the United States and many other tax jurisdictions the current equityprice is used as an input to the calculation. The impact on the income statement of any income tax benefit iscapped with reference to the IFRS 2 pre-tax expense, with any excess recognised directly in equity.
As a result of the implementation of IFRS 2, net assets on the consolidated balance sheet at 31 December 2004were 75 million Swiss francs higher. This consists of inventories (40 million Swiss francs asset), deferred tax assets(52 million Swiss francs asset) and liabilities for cash-settled equity compensation plans (17 million Swiss francsliability).
Further information on the Group’s equity compensation plans is given in Notes 5, 6 and 12 to the AnnualFinancial Statements.
IFRS 3: ‘Business Combinations’. Amongst other matters, the new standard requires that amortisation ofgoodwill cease from the date of implementation. Goodwill will continue to be tested for impairment. The standardrequires prospective application. Had this standard been applied in the interim period of 2004, then goodwillamortisation expenses of 282 million Swiss francs would not have been recorded. No additional impairment wouldhave been necessary. In addition, together with IAS 38 (revised) ‘Intangible Assets’, this standard will typicallyresult in more intangible assets being recognised from acquisitions than previously and consequently lessgoodwill will arise.
The new standard also affects the Group’s effective tax rate, as no tax benefit was recorded in respect of goodwillamortisation. Based on the Group’s 2004 results, the Group’s effective tax rate is expected to decrease by betweentwo and three percentage points.
IAS 38 (revised): ‘Intangible Assets’. Amongst other matters, the revised standard will typically result in moreintangible assets being recognised from in-licensing arrangements and similar research and developmentalliances. Previously such expenditure would be recorded as research and development expenses. The revisedstandard requires prospective application.

33Half-Year Report 2005
Notes to the Roche Group Interim Consolidated Financial Statements
IAS 32 (revised) and IAS 39 (revised): ‘Financial Instruments’. Since the Group already fully applied theprevious IAS 32 and IAS 39 on ‘Financial Instruments’ the revised standards did not have a significant effect onthe Group’s results and financial position. Amongst other matters, the revised standards require that a significantor prolonged decline in the fair value of available-for-sale financial assets be considered as objective evidence ofimpairment. Under the Group’s previous accounting policy, a decline in fair value of available-for-sale financialassets was considered as objective evidence of impairment where the decline was significant and prolonged.Consequently, the revised standards will typically result in impairment charges being recognised for available-for-sale financial assets at an earlier stage than under the previous accounting policy. The revised standardsrequire retrospective application and this additionally resulted in a restatement of the equity conversion elementsof certain of the Group’s convertible debt instruments in 2004. As a result equity as at 1 January 2004 was reducedby 112 million Swiss francs and an additional pre-tax income of 20 million Swiss francs has been recorded for therestated interim period of 2004.
IAS 1 (revised): ‘Presentation of Financial Statements’. Amongst other matters, the revised standard permitsthe presentation of the results of discontinued businesses as a single amount on the face of the incomestatement. Additionally the revised standard requires that minority interests are included as part of the Group’sequity and not as a separate category on the balance sheet. As a result of this change, and from theimplementation of IFRS 2, the net accounting effect of Genentech and Chugai stock repurchases and stockoptions is recorded to equity and allocated to retained earnings and minority interests based on the relevantownership percentages. Previously these entries were recorded to minority interests. The revised standardrequires retrospective application and accordingly 169 million Swiss francs were reclassified from minorityinterests to retained earnings as at 1 January 2004.
Presentation of income statement: The new and revised standards result in significant changes to the formatand content of the income statement. In addition the Group has made certain presentational changes in order tofurther improve comparability of results to other healthcare companies and to allow readers to make a moreaccurate assessment of the sustainable earnings capacity of the Group. These changes, which have been appliedretrospectively, are listed below.• ‘Royalties and other operating income’ are shown as a separate line after ‘Sales’.• ‘Cost of sales’ includes royalty expenses that are directly linked to goods sold. In the interim period this was
634 million Swiss francs (2004: 560 million Swiss francs).• ‘Other operating expenses’ is removed from the income statement. ‘Administration’ is expanded to ‘General and
administration’ to additionally include ‘Other operating expenses’ other than royalty expenses included in ‘Costof sales’.
• ‘Financial income’ and ‘Financing costs’ are disclosed separately on the face of the income statement. • Capital taxes are reported as part of ‘General and administration’ instead of ‘Financial income’ as previously.
In the interim period this was 18 million Swiss francs (2004: 12 million Swiss francs) and has been included inthe ‘Corporate’ business segment.

34 Half-Year Report 2005
Notes to the Roche Group Interim Consolidated Financial Statements
Restated income statement for the six months ended 30 June 2004 in millions of CHF
As originally Discontinued IAS 32 Other Grouppublished businesses IFRS 2 IAS 39 changes restated
Sales 15,413 (887) – – – 14,526Other operating income and operating expenses (11,853) 724 (60) – (12) (11,201)Operating profit 3,560 (163) (60) – (12) 3,325Financial and non-operating items 727 9 – 20 12 768Profit before taxes 4,287 (154) (60) 20 – 4,093Income taxes (1,148) 42 25 (3) – (1,084)Profit from continuing businesses n/a (112) (35) 17 – 3,009Profit from discontinued businesses n/a 112 – – – 112Net income 3,139 – (35) 17 – 3,121
Attributable to – Roche shareholders 2,920 – (26) 17 – 2,911– Minority interests 219 – (9) – – 210
Earnings per share and non-voting equity securityDiluted – Group (CHF) 3.41 – (0.03) 0.02 – 3.40
Consistent with the presentation in the Annual Financial Statements:• The business segment ‘Chugai OTC’ results for the interim period of 2004 have been reclassified as
discontinued, as this business was sold in the second half of 2004. • A total of 22 million Swiss francs of administration and other costs that were previously allocated to the
Consumer Health (OTC) business in the published 2004 interim results have been reclassified to the businesssegment ‘Corporate’ within the Group’s continuing business results. These items are not transferred with thesale of the business.
In addition provisions for sales returns and sales charge-backs are now classified as provisions and accruedliabilities, respectively. Previously they were reported within accounts receivable. In the 31 December 2004balance sheet a total of 233 million Swiss francs has been reclassified from ‘accounts receivable’ to ‘provisions-current’ (137 million Swiss francs) and ‘accrued and other liabilities’ (96 million Swiss francs). There was noimpact on net income or equity from this reclassification.
Restated equity for 1 January 2004 in millions of CHF
As originally IAS 1 IAS 32 Other Grouppublished (revised) IFRS 2 IAS 39 changes restated
Share capital 160 – – – – 160Own equity instruments (4,583) – – – – (4,583)Retained earnings 30,985 – 3 (298) 169 30,859Fair value and other reserves (2,992) – – 186 – (2,806)Equity attributable to Roche shareholders 23,570 – 3 (112) 169 23,630Minority interests – 5,594 5 – (169) 5,430Total equity 23,570 5,594 8 (112) – 29,060
2. Group organisation
Discontinued businessesThe Consumer Health (OTC) and Vitamins and Fine Chemicals businesses are discussed in Note 6.
2005 acquisitions and divestmentsGlycArt: On 18 July 2005 the Group signed an agreement with the shareholders of GlycArt Biotechnology AG(hereafter ‘GlycArt’) under which the Group will acquire 100% of the share capital of GlycArt. GlycArt is a privatelyowned biotechnology research company based in Schlieren-Zürich in Switzerland. The purchase consideration
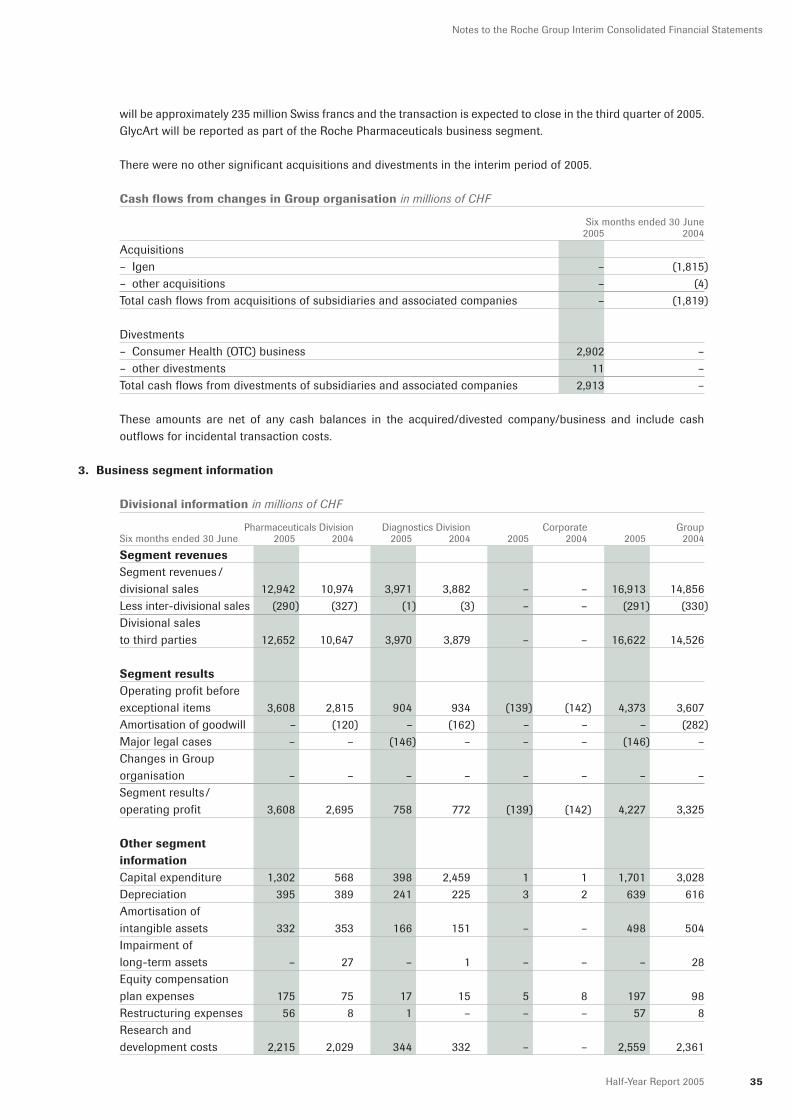
35Half-Year Report 2005
Notes to the Roche Group Interim Consolidated Financial Statements
will be approximately 235 million Swiss francs and the transaction is expected to close in the third quarter of 2005.GlycArt will be reported as part of the Roche Pharmaceuticals business segment.
There were no other significant acquisitions and divestments in the interim period of 2005.
Cash flows from changes in Group organisation in millions of CHF
Six months ended 30 June2005 2004
Acquisitions– Igen – (1,815)– other acquisitions – (4)Total cash flows from acquisitions of subsidiaries and associated companies – (1,819)
Divestments– Consumer Health (OTC) business 2,902 –– other divestments 11 –Total cash flows from divestments of subsidiaries and associated companies 2,913 –
These amounts are net of any cash balances in the acquired/divested company/business and include cashoutflows for incidental transaction costs.
3. Business segment information
Divisional information in millions of CHF
Pharmaceuticals Division Diagnostics Division Corporate GroupSix months ended 30 June 2005 2004 2005 2004 2005 2004 2005 2004
Segment revenuesSegment revenues /divisional sales 12,942 10,974 3,971 3,882 – – 16,913 14,856Less inter-divisional sales (290) (327) (1) (3) – – (291) (330)Divisional sales to third parties 12,652 10,647 3,970 3,879 – – 16,622 14,526
Segment resultsOperating profit before exceptional items 3,608 2,815 904 934 (139) (142) 4,373 3,607Amortisation of goodwill – (120) – (162) – – – (282)Major legal cases – – (146) – – – (146) –Changes in Group organisation – – – – – – – –Segment results /operating profit 3,608 2,695 758 772 (139) (142) 4,227 3,325
Other segment informationCapital expenditure 1,302 568 398 2,459 1 1 1,701 3,028Depreciation 395 389 241 225 3 2 639 616Amortisation of intangible assets 332 353 166 151 – – 498 504Impairment of long-term assets – 27 – 1 – – – 28Equity compensation plan expenses 175 75 17 15 5 8 197 98Restructuring expenses 56 8 1 – – – 57 8Research and development costs 2,215 2,029 344 332 – – 2,559 2,361
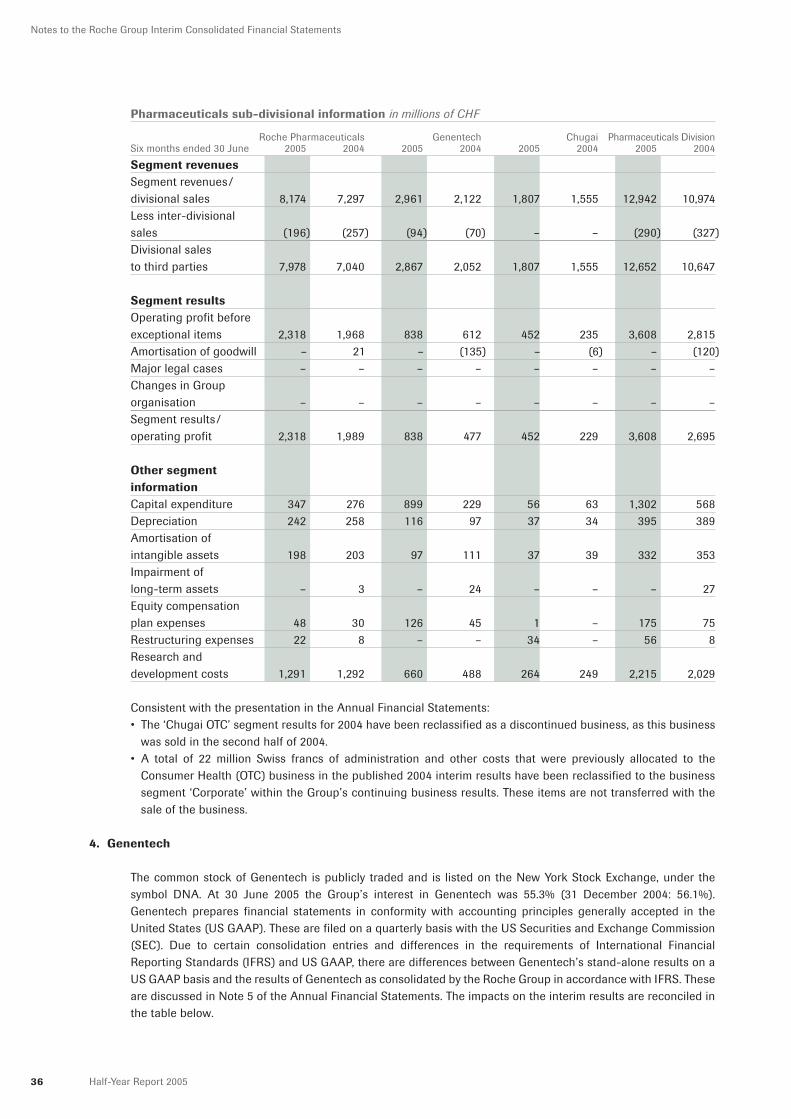
36 Half-Year Report 2005
Notes to the Roche Group Interim Consolidated Financial Statements
Pharmaceuticals sub-divisional information in millions of CHF
Roche Pharmaceuticals Genentech Chugai Pharmaceuticals DivisionSix months ended 30 June 2005 2004 2005 2004 2005 2004 2005 2004
Segment revenues Segment revenues/divisional sales 8,174 7,297 2,961 2,122 1,807 1,555 12,942 10,974Less inter-divisional sales (196) (257) (94) (70) – – (290) (327)Divisional sales to third parties 7,978 7,040 2,867 2,052 1,807 1,555 12,652 10,647
Segment resultsOperating profit before exceptional items 2,318 1,968 838 612 452 235 3,608 2,815Amortisation of goodwill – 21 – (135) – (6) – (120)Major legal cases – – – – – – – –Changes in Group organisation – – – – – – – –Segment results /operating profit 2,318 1,989 838 477 452 229 3,608 2,695
Other segment informationCapital expenditure 347 276 899 229 56 63 1,302 568Depreciation 242 258 116 97 37 34 395 389Amortisation of intangible assets 198 203 97 111 37 39 332 353Impairment of long-term assets – 3 – 24 – – – 27Equity compensation plan expenses 48 30 126 45 1 – 175 75Restructuring expenses 22 8 – – 34 – 56 8Research and development costs 1,291 1,292 660 488 264 249 2,215 2,029
Consistent with the presentation in the Annual Financial Statements:• The ‘Chugai OTC’ segment results for 2004 have been reclassified as a discontinued business, as this business
was sold in the second half of 2004. • A total of 22 million Swiss francs of administration and other costs that were previously allocated to the
Consumer Health (OTC) business in the published 2004 interim results have been reclassified to the businesssegment ‘Corporate’ within the Group’s continuing business results. These items are not transferred with thesale of the business.
4. Genentech
The common stock of Genentech is publicly traded and is listed on the New York Stock Exchange, under thesymbol DNA. At 30 June 2005 the Group’s interest in Genentech was 55.3% (31 December 2004: 56.1%).Genentech prepares financial statements in conformity with accounting principles generally accepted in theUnited States (US GAAP). These are filed on a quarterly basis with the US Securities and Exchange Commission(SEC). Due to certain consolidation entries and differences in the requirements of International FinancialReporting Standards (IFRS) and US GAAP, there are differences between Genentech’s stand-alone results on aUS GAAP basis and the results of Genentech as consolidated by the Roche Group in accordance with IFRS. Theseare discussed in Note 5 of the Annual Financial Statements. The impacts on the interim results are reconciled inthe table below.

37Half-Year Report 2005
Notes to the Roche Group Interim Consolidated Financial Statements
Reconciliation of Genentech resultsSix months ended Six months ended
30 June 2005 30 June 2004USD CHF USD CHF
millions millionsa) millions millionsa)
Operating margin (US GAAP basis) 800 500– redemption costs 69 76– special litigation items 31 27Operating margin (non-US GAAP basis) 900 603
Add (deduct) differences and consolidation entries– add back redemption costs (69) (76)– expenses for equity compensation plans (105) (35)– other differences and consolidation entries (30) (8)Operating profit before exceptional items (IFRS basis) 696 838 484 612
Add (deduct) exceptional items– amortisation of goodwill – (135)– major legal cases – –Segment result /operating profit (IFRS basis) 838 477
Add (deduct) non-operating items (IFRS basis)– financial income and financing costs 20 10– income taxes (234) (212)Net income (IFRS basis) 624 275
Minority interest percentage (average during period) 44.2% 43.1%Income applicable to minority interest (IFRS basis) 276 118
a) Translated at 1.00 USD = 1.20 CHF (2004: 1.00 USD = 1.27 CHF).
Genentech stock repurchases and stock optionsOn 15 June 2005 Genentech announced that its Board of Directors has authorised an extension of the currentstock repurchase programme to repurchase up to a further 2 billion US dollars of Genentech’s common stock fora total of 4 billion US dollars through 30 June 2006. During the interim period Genentech repurchased commonstock worth 161 million US dollars (2004: 576 million US dollars) and exercises from Genentech’s equitycompensation plans resulted in a cash inflow of 465 million US dollars (2004: 367 million US dollars).
Oceanside biologics manufacturing facilityOn 23 June 2005 Genentech completed the purchase of the Oceanside biologics manufacturing facility in SanDiego, California, from Biogen Idec. The purchase cost, including closing costs, was 531 million Swiss francs.
Genentech Senior NotesOn 13 July 2005 Genentech announced the offering of 2 billion US dollars aggregate principal amount of 5-year,10-year and 30-year Senior Notes. The offering was priced on the same day as 500 million US dollars of 4.40%Senior Notes due 2010, 1 billion US dollars of 4.75% Senior Notes due 2015 and 500 million US dollars of 5.25%Senior Notes due 2035. Genentech intends to use the proceeds for reduction or repayment of certain leasearrangements, for funding future capital expenditure, including upgrade, start-up and validation costs atOceanside and for general corporate purposes.

38 Half-Year Report 2005
Notes to the Roche Group Interim Consolidated Financial Statements
5. Chugai
The common stock of Chugai is publicly traded and is listed on the Tokyo Stock Exchange. At 30 June 2005 theGroup’s interest in Chugai was 50.6% (31 December 2004: 50.6%). Chugai prepares financial statements in con-formity with accounting principles generally accepted in Japan (JGAAP). These are filed on a quarterly basis withthe Tokyo Stock Exchange. Due to certain consolidation entries and differences in the requirements ofInternational Financial Reporting Standards (IFRS) and JGAAP, there are differences between Chugai’s stand-alone results on a JGAAP basis and the results of Chugai as consolidated by the Roche Group in accordance withIFRS. These are discussed in Note 6 of the Annual Financial Statements. The impacts on the interim results arereconciled in the table below.
Reconciliation of Chugai results in millions of CHF
Six months ended 30 June2005 2004
Chugai operating profit before exceptional items and before acquisition accounting impacts (IFRS basis) 491 274– depreciation of property, plant and equipment (5) (5)– amortisation of acquisition-related intangible assets (34) (34)Chugai operating profit before exceptional items (IFRS basis) 452 235
Add (deduct) exceptional items– amortisation of goodwill – (6)Chugai segment result /operating profit (IFRS basis) 452 229
Add (deduct) Chugai OTC and non-operating items (IFRS basis)– financial income, financing costs and Chugai OTC 9 14– income taxes (163) (98)Net income (IFRS basis) 298 145
Minority interest calculationAdd back acquisition accounting impact on net income 30 30Net income excluding acquisition accounting 328 175
Minority interest percentage (average during period) 49.4% 49.5%Income applicable to minority interest (IFRS basis) 162 87
Translated at 100 JPY = 1.14 CHF (2004: 100 JPY = 1.17 CHF).
DividendsThe dividends distributed to third parties holding Chugai shares during the interim period totalled 28 million Swissfrancs (2004: 41 million Swiss francs) and have been recorded to equity. Dividends paid by Chugai to Roche areeliminated on consolidation as inter-company items.
Restructuring of production facilitiesOn 28 February 2005 Chugai announced a restructuring of its production facilities, under which five existingplants will be integrated into two facilities within the next five to six years. As part of this restructuring the plantat Kagamiishi was sold during the first half of 2005. Total restructuring costs in the interim period, including theloss on disposal of the Kagamiishi plant, were 34 million Swiss francs.

39Half-Year Report 2005
Notes to the Roche Group Interim Consolidated Financial Statements
6. Discontinued businesses
Results of discontinued businesses in millions of CHFSix months ended 30 June 2005 Six months ended 30 June 2004
Consumer Vitamins Consumer VitaminsHealth and Fine Health and Fine(OTC) Chemicals Total (OTC) Chemicals Total
Segment revenues 25 – 25 888 – 888
Business result (3) (4) (7) 118 (6) 112Gain (loss) on disposal 8 – 8 – – –Profit from discontinued businesses 5 (4) 1 118 (6) 112
Earnings per share and non-voting equity securityBasic (CHF) 0.00 0.13Diluted (CHF) 0.00 0.13
Divestment of Consumer Health (OTC) businessOn 19 July 2004 the Group announced the sale of Roche Consumer Health, its global OTC (over-the-countermedicines) business, to the Bayer Group. The sale also included five production facilities belonging to the RochePharmaceuticals business. Under the agreement with Bayer the majority of local businesses were transferred toBayer at the end of 2004. By 31 December 2004, 98% of the divestment to Bayer was completed, measured interms of Roche Consumer Health sales to third parties. The divestment of the remaining 2% was completed in thefirst quarter of 2005. The calculations of the final amounts arising from the agreed purchase price mechanismsare expected to be completed by the end of 2005. Under the terms of the agreement the majority of cash proceeds,totalling 2,886 million Swiss francs, were transferred to the Group on 1 January 2005. In addition the Groupreceived a further 16 million Swiss francs during the interim period for the remaining part of the divestment thatwas completed in the first half of 2005.
On 30 July 2004 Chugai announced the sale of its OTC business to Lion Corporation. This sale was completedeffective 29 December 2004.
The results of the Consumer Health (OTC) business are shown above. The interim results for 2005 include theremaining part of Roche Consumer Health that was transferred to Bayer in the first quarter of 2005. The 2004interim results include the whole Consumer Health (OTC) business for that period. Cash outflow from operationsof 4 million Swiss francs (2004: cash inflow of 183 million Swiss francs) arises from the operating profit beforeexceptional items and before depreciation, amortisation and impairment. There were no significant investing andfinancing cash flows other than the receipt of the divestment proceeds received from Bayer that are describedabove.
Divestment of Vitamins and Fine Chemicals businessEffective 30 September 2003, after receiving the final regulatory approvals, the Group completed the sale of itsglobal Vitamins and Fine Chemicals business (‘the VFC business’) to the Dutch company DSM. Under the termsof the final purchase agreement with DSM, there were certain agreed purchase price adjustment mechanisms.During the interim period the final amounts arising from these mechanisms were approved by the Group andDSM. No additional cash was transferred between the Group and DSM and no additional amounts were recordedin the Interim Financial Statements. Following the sale of the VFC business, certain assets and liabilities of theVitamins and Fine Chemicals Division, mainly associated with the vitamin case, remain with the Group. During theinterim period expenses of 4 million Swiss francs were recorded (2004: 6 million Swiss francs), which representthe after-tax amortisation of discounted provisions.
Vitamin caseTotal payments in the interim period were 78 million Swiss francs (2004: 11 million Swiss francs), which werecovered by provisions previously made.

40 Half-Year Report 2005
Notes to the Roche Group Interim Consolidated Financial Statements
On 17 January 2003 the District of Columbia Circuit Court of Appeals ruled that non-US plaintiffs may bring claimsin US courts under US anti-trust laws for alleged damages suffered from transactions outside the United States inconnection with the vitamin case. On 14 June 2004 the Supreme Court of the United States nullified the decision ofthe District of Columbia Circuit Court of Appeals in a class action litigation brought on behalf of non-US purchasersof bulk vitamins from Roche and other manufacturers. The Supreme Court remanded the case to the lower court toreview alternative arguments which might permit such claims to proceed in the United States. On remand, on28 June 2005 a panel of the District of Columbia Circuit Court of Appeals ruled unanimously that US courts do nothave jurisdiction over the plaintiffs’ claims and affirmed the initial dismissal of the complaint. Plaintiffs may petitionthe entire District of Columbia Circuit Court of Appeals or the US Supreme Court for further discretionary review.
7. Major legal cases
Diagnostics litigation and arbitration casesDuring the interim period provisions for certain litigation and arbitration matters in the Diagnostics Division wereincreased by 146 million Swiss francs. The provisions recorded are based on current litigation and settlementnegotiations and recent settlement agreements. This additional expense is disclosed separately in the incomestatement due to the materiality of the amount and in order to fairly present the Group’s results.
On 9 May 2005 the Group announced that a settlement agreement had been reached with Applera Corporationwith regard to the outstanding litigation and arbitration related to contractual relationships involving rights to andcommercialisation of polymerase chain reaction (‘PCR’) technology.
Genentech legal casesOn 2 February 2005 the California Supreme Court granted Genentech’s petition seeking a review of the jury verdictand damages awarded to the City of Hope Medical Center by the Superior Court in Los Angeles County, California,in June 2002. It is expected that the resolution of this matter will take more than one year. A full provision has beenrecorded for these awards, and this has now been reclassified from short-term to long-term following theCalifornia Supreme Court decision of 2 February 2005. During the appeals process interest accrues on the totalamount of the damages at a simple annual rate of 10%. During the interim period interest of 30 million Swiss francs(2004: 33 million Swiss francs) was recorded as the time cost of provisions within interest expenses (see Note 9).
On 3 October 2002 Genentech entered into an arrangement with third party insurance companies to post a suretybond of 600 million US dollars in connection with this judgment. As part of this arrangement Genentech pledged630 million US dollars in cash and investments to secure this bond. This was increased in 2004 by 52 million USdollars to 682 million US dollars (874 million Swiss francs). This amount has been reclassified from other currentassets to financial long-term assets following the California Supreme Court decision of 2 February 2005.
Genentech's annual report and quarterly SEC filings contain the detailed disclosures on litigation matters that arerequired by US GAAP. These include further details on the above matters as well as including information on otherlitigation that is not currently as significant as the matters referred to above.
8. Royalties and other operating income
Royalties and other operating income in millions of CHF
Six months ended 30 June2005 2004
Royalty income 563 470Income from out-licensing agreements 127 96Gains on disposal of products 11 215Other 9 9Total royalties and other operating income 710 790
Royalty incomeRoyalty income for the Pharmaceuticals Division was 408 million Swiss francs (2004: 310 million Swiss francs),and for the Diagnostics Division was 155 million Swiss francs (2004: 160 million Swiss francs).

41Half-Year Report 2005
Notes to the Roche Group Interim Consolidated Financial Statements
Income from out-licensing agreementsCertain Group companies, notably Genentech, receive from third parties up-front, milestone and other similarnon-refundable payments relating to the sale or licensing of products or technology. Revenue associated withperformance milestones is recognised based on achievement of the milestones, as defined in the respectiveagreements. Revenue from non-refundable up-front payments and licence fees is initially reported as deferredincome and is recognised in income as earned over the period of the development collaboration or themanufacturing obligation.
Gains on disposal of productsAs part of the continuous realignment of its product portfolio, the Group periodically disposes of product linesthat are no longer considered as core products or priorities within the product development portfolio. Theproceeds are reinvested in the Group’s in-licensing arrangements and other research and development alliancesand collaborations.
On 9 February 2004 the Group announced the sale of the exclusive US rights to Soriatane to ConneticsCorporation. The cash received was 155 million Swiss francs. As the products concerned had no book value thegain on disposal was the same as the cash proceeds and is reported within the operating profit of the ‘RochePharmaceuticals’ segment.
9. Financial income and financing costs
Financial income in millions of CHF
Six months ended 30 June2005 2004
Gains on sale of equity securities 135 107(Losses) on sale of equity securities (25) (7)Dividend income 4 21Gains (losses) on equity derivatives, net 18 –Write-downs and impairments of equity securities (10) (15)Net income from equity securities 122 106
Interest income 175 87Gains on sale of debt securities 41 62(Losses) on sale of debt securities (44) (67)Write-downs and impairments of long-term loans – –Net interest income and income from debt securities 172 82
Foreign exchange gains (losses), net 34 (85)Gains (losses) on foreign currency derivatives, net (99) 94Net foreign exchange gains (losses) (65) 9
Net other financial income (expense) 12 16
Total financial income 241 213
Financing costs in millions of CHF
Six months ended 30 June2005 2004
Interest expense (108) (257)Amortisation of discount on debt instruments (38) (105)Gains (losses) on interest rate derivatives, net (3) 12Time cost of provisions (38) (33)Total financing costs (187) (383)
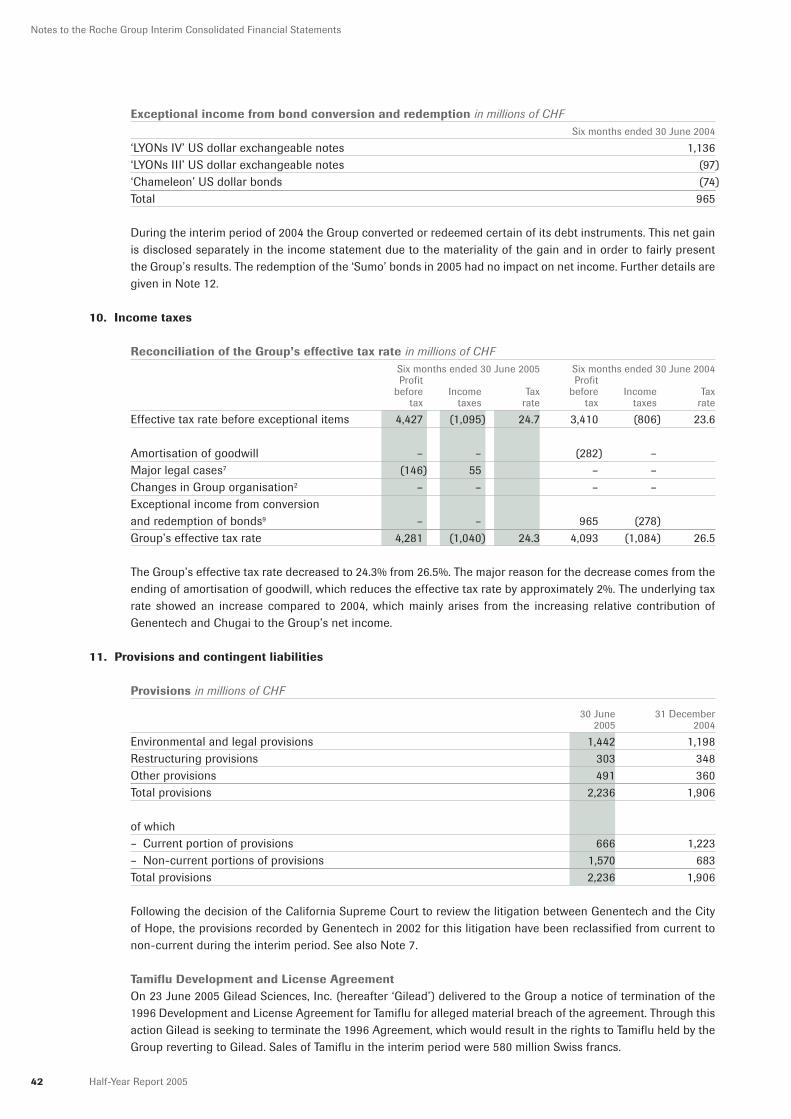
42 Half-Year Report 2005
Notes to the Roche Group Interim Consolidated Financial Statements
Exceptional income from bond conversion and redemption in millions of CHFSix months ended 30 June 2004
‘LYONs IV’ US dollar exchangeable notes 1,136‘LYONs III’ US dollar exchangeable notes (97)‘Chameleon’ US dollar bonds (74)Total 965
During the interim period of 2004 the Group converted or redeemed certain of its debt instruments. This net gainis disclosed separately in the income statement due to the materiality of the gain and in order to fairly presentthe Group’s results. The redemption of the ‘Sumo’ bonds in 2005 had no impact on net income. Further details aregiven in Note 12.
10. Income taxes
Reconciliation of the Group’s effective tax rate in millions of CHFSix months ended 30 June 2005 Six months ended 30 June 2004Profit Profit
before Income Tax before Income Taxtax taxes rate tax taxes rate
Effective tax rate before exceptional items 4,427 (1,095) 24.7 3,410 (806) 23.6
Amortisation of goodwill – – (282) –Major legal cases7 (146) 55 – –Changes in Group organisation2 – – – –Exceptional income from conversion and redemption of bonds9 – – 965 (278)Group’s effective tax rate 4,281 (1,040) 24.3 4,093 (1,084) 26.5
The Group’s effective tax rate decreased to 24.3% from 26.5%. The major reason for the decrease comes from theending of amortisation of goodwill, which reduces the effective tax rate by approximately 2%. The underlying taxrate showed an increase compared to 2004, which mainly arises from the increasing relative contribution ofGenentech and Chugai to the Group’s net income.
11. Provisions and contingent liabilities
Provisions in millions of CHF
30 June 31 December2005 2004
Environmental and legal provisions 1,442 1,198Restructuring provisions 303 348Other provisions 491 360Total provisions 2,236 1,906
of which– Current portion of provisions 666 1,223– Non-current portions of provisions 1,570 683Total provisions 2,236 1,906
Following the decision of the California Supreme Court to review the litigation between Genentech and the Cityof Hope, the provisions recorded by Genentech in 2002 for this litigation have been reclassified from current tonon-current during the interim period. See also Note 7.
Tamiflu Development and License AgreementOn 23 June 2005 Gilead Sciences, Inc. (hereafter ‘Gilead’) delivered to the Group a notice of termination of the1996 Development and License Agreement for Tamiflu for alleged material breach of the agreement. Through thisaction Gilead is seeking to terminate the 1996 Agreement, which would result in the rights to Tamiflu held by theGroup reverting to Gilead. Sales of Tamiflu in the interim period were 580 million Swiss francs.

43Half-Year Report 2005
Notes to the Roche Group Interim Consolidated Financial Statements
The 1996 Agreement specifies a 30/90 day cure period for the breaches alleged by Gilead, and the Group iscurrently in discussions with Gilead to resolve the dispute. If there is no resolution of the dispute, an AlternativeDispute Resolution process can be initiated.
No significant changes in the Group’s contingent liabilities have occurred since the Annual Financial Statements,other than those described above and in Notes 6 and 7.
12. Debt
Redemption of ‘Sumo’ Japanese yen exchangeable notes: On the due date of 25 March 2005 the Groupredeemed these bonds at the original issue amount plus accrued original issue discount (OID). The cash outflowwas 1,178 million Swiss francs. There was no gain or loss recorded for the redemption of these bonds.
Conversion and redemption of ‘LYONs IV’ US dollar exchangeable notes: On 3 March 2004 the Groupexercised its option to call these notes for redemption on 5 April 2004 at the original issue amount plus accruedoriginal issue discount (OID). The effective interest rate of these notes was 4.26%. In the period to 5 April 2004notes with a principal amount of 1,506 million US dollars were called for conversion by the holders and theremaining notes were redeemed for cash on 5 April 2004. A total of 12,999,662 Genentech shares were used tomeet these obligations. As a result the Group’s ownership of Genentech decreased by 2.45% and the Grouprealised a pre-tax gain of 1,136 million Swiss francs on the part disposal of its interest in Genentech andredemption of the remaining notes.
Redemption of ‘LYONs III’ US dollar exchangeable notes: On 5 April 2004 the Group exercised its option tocall these notes for redemption on 6 May 2004 at the original issue amount plus accrued original issue discount(OID). The effective interest rate of these notes was 6.91%. Notes with a principal amount of 3 billion US dollarswere redeemed for cash. The Group realised a pre-tax loss of 97 million Swiss francs on the early redemption ofthe notes.
Partial redemption of ‘Chameleon’ US dollar bonds: On 3 June 2004 the Group announced a tender offer forthe redemption of the ‘Chameleon’ bond. The effective interest rate of these bonds was 6.77%. The tender offerexpired on 23 June 2004 and pricing was on 24 June 2004, at which point bonds with a principal amount of513 million US dollars, representing approximately 51.25% of the outstanding bonds, had been tendered forredemption. Settlement was made on 29 June 2004. The Group realised a pre-tax loss of 74 million Swiss francson the partial early redemption of these bonds.
Cash outflows from repayments and redemptions of debt instruments in millions of CHF
Six months ended 30 June2005 2004
‘Sumo’ Japanese yen exchangeable bonds (1,178) –‘LYONs IV’ US dollar exchangeable notes – (5)‘LYONs III’ US dollar exchangeable notes – (2,316)‘Chameleon’ US dollar bonds – (715)Total cash outflows from repayments and redemptions during the year (1,178) (3,036)
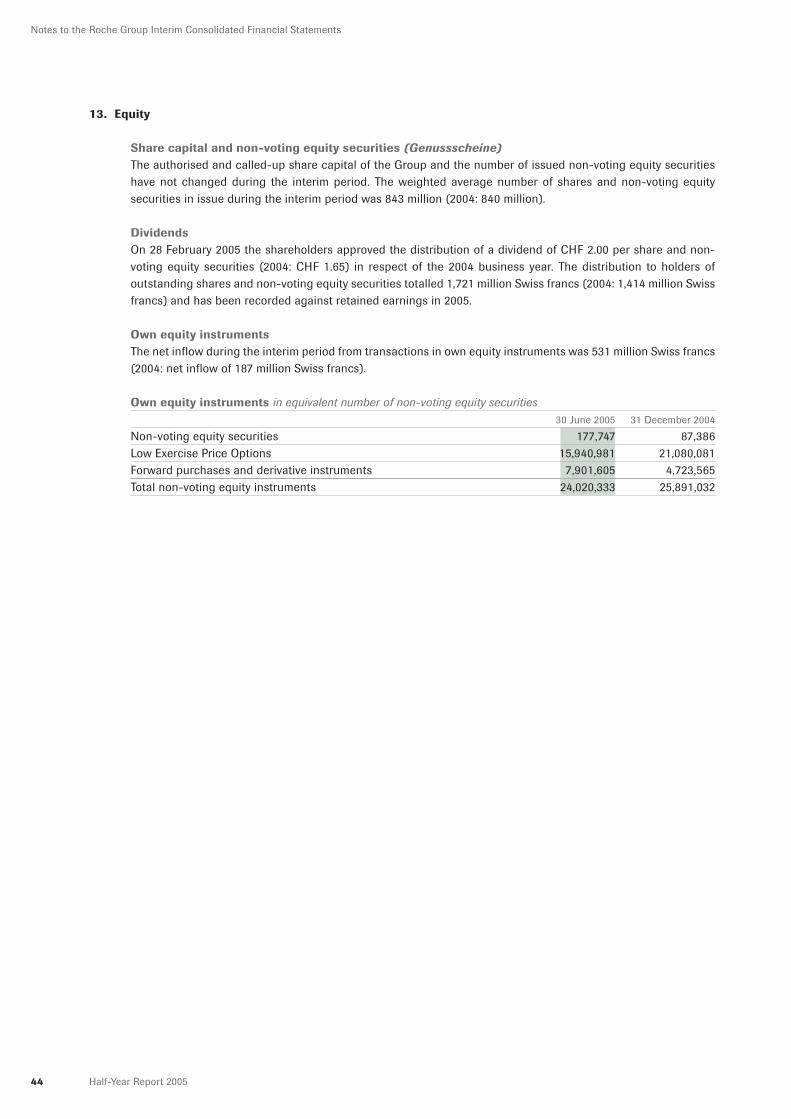
44 Half-Year Report 2005
Notes to the Roche Group Interim Consolidated Financial Statements
13. Equity
Share capital and non-voting equity securities (Genussscheine)The authorised and called-up share capital of the Group and the number of issued non-voting equity securitieshave not changed during the interim period. The weighted average number of shares and non-voting equitysecurities in issue during the interim period was 843 million (2004: 840 million).
DividendsOn 28 February 2005 the shareholders approved the distribution of a dividend of CHF 2.00 per share and non-voting equity securities (2004: CHF 1.65) in respect of the 2004 business year. The distribution to holders ofoutstanding shares and non-voting equity securities totalled 1,721 million Swiss francs (2004: 1,414 million Swissfrancs) and has been recorded against retained earnings in 2005.
Own equity instrumentsThe net inflow during the interim period from transactions in own equity instruments was 531 million Swiss francs(2004: net inflow of 187 million Swiss francs).
Own equity instruments in equivalent number of non-voting equity securities30 June 2005 31 December 2004
Non-voting equity securities 177,747 87,386Low Exercise Price Options 15,940,981 21,080,081Forward purchases and derivative instruments 7,901,605 4,723,565Total non-voting equity instruments 24,020,333 25,891,032

45Half-Year Report 2005
Review Report of the Group Auditors
To the Board of Directors of Roche Holding Ltd, Basel
We have been engaged to review the Interim Consolidated Financial Statements (income statement, balancesheet, condensed statement of changes in equity, cash flow statement and selected explanatory notes on pages26 to 44) of Roche Holding Ltd for the six-month period ended 30 June 2005.
These Interim Consolidated Financial Statements are the responsibility of the Board of Directors. Ourresponsibility is to issue a report on these Interim Consolidated Financial Statements based on our review.
We conducted our review in accordance with the Swiss Auditing Standard 910 and with the International Standardon Review Engagements 2400. A review is limited primarily to inquiries of company personnel and analyticalprocedures applied to financial data and thus provides less assurance than an audit. We have not performed anaudit and, accordingly, we do not express an audit opinion.
Based on our review, nothing has come to our attention that causes us to believe that the Interim ConsolidatedFinancial Statements do not give a true and fair view of the financial position as of 30 June 2005, and the resultsof operations and cash flows for the six-month period then ended in accordance with International AccountingStandard 34 'Interim Financial Reporting'.
KPMG Klynveld Peat Marwick Goerdeler SA
John A. Morris Erik F. J. Willems
Basel, 19 July 2005

46 Half-Year Report 2005
Supplementary Net Income and EPS Information
Profit from continuing businesses before exceptional items and core net income in millions of CHF
Six months ended 30 June2005 2004
Profit from continuing businesses 3,241 3,009Goodwill amortisation – 282Major legal cases 146 –– income taxes (55) –
91 –Changes in Group organisation – –– income taxes – –
– –Exceptional financial income – (965)- income taxes – 278
– (687)Profit from continuing businesses before exceptional items 3,332 2,604
Minority interests– Profit from continuing businesses (444) (204)– Goodwill amortisation – (58)
(444) (262)Net income attributable to Roche shareholders (continuing businesses before exceptional items) 2,888 2,342
Amortisation of intangible assets 498 504– income taxes (179) (181)– minority interests (37) (41)
282 282Core net income 3,170 2,624
EPS (continuing businesses before exceptional items) and Core EPS
EPS (continuing businessesbefore exceptional items) Core EPS
Six months ended 30 June 2005 2004 2005 2004
Net income (millions of CHF) 2,888 2,342 3,170 2,624Elimination of interest expense, net of tax, of convertible debt instruments, where dilutive 23 25 23 25Increase in minority share of net income, net of tax, assuming all outstanding Genentech and Chugai stock options exercised (27) (18) (30) (21)Net income used to calculate diluted earnings per share 2,884 2,349 3,163 2,628
Per share information(millions of shares and non-voting equity securities)Weighted average number of shares and non-voting equity securities in issue 843 840 843 840Adjustment for assumed conversion of convertible debt instruments, where dilutive 14 19 14 19Adjustment for equity compensation plans, where dilutive 1 – 1 –Weighted average number of shares and non-voting equity securities in issue used to calculate diluted earnings per share 858 859 858 859
Earnings per share (diluted) (CHF) 3.36 2.73 3.69 3.06

47Half-Year Report 2005
Roche Securities
Number of shares and non-voting equity securities
30 June 30 June2005 2004
Number of shares 160,000,000 160,000,000 Number of non-voting equity securities 702,562,700 702,562,700 Total 862,562,700 862,562,700
Data per share and non-voting equity security in CHF
Six months ended 30 June2005 2004
Diluted earnings per share and non-voting equity security 3.26 3.40
Stock price of share High 184.90 193.00Low 139.00 163.75Period end 182.50 164.75
Stock price of non-voting equity security High 162.20 140.25Low 120.60 118.75Period end 162.20 124.00
Market capitalisation in millions of CHF
30 June 30 June2005 2004
140,541 110,782
All prices shown are daily closing prices.

48 Half-Year Report 2005
Published byF. Hoffmann-La Roche Ltd 4070 Basel, SwitzerlandTel. +41 (0)61 688 11 11Fax +41 (0)61 691 93 91
Media OfficeCorporate Communications 4070 Basel, SwitzerlandTel. +41 (0)61 688 88 88Fax +41 (0)61 688 27 75
Investor Relations4070 Basel, SwitzerlandTel. +41 (0)61 688 88 80Fax +41 (0)61 691 00 14
World Wide Webhttp://www.roche.com
To order publicationsTel. +41 (0)61 688 83 39Fax +41 (0)61 688 43 43E-mail: [email protected]
Cautionary statement regarding forward-looking statements
This Half-Year Report contains certain forward-looking statements. These forward-looking state-ments may be identified by words such as ‘believes’,‘expects’, ‘anticipates’, ‘projects’, ‘intends’, ‘should’,‘seeks’, ‘estimates’, ‘future’ or similar expressionsor by discussion of, among other things, strat-egy, goals, plans or intentions. Various factors maycause actual results to differ materially in the futurefrom those reflected in forward-looking statementscontained in this Half-Year Report, among others:(1) pricing and product initiatives of competi-tors; (2) legislative and regulatory developmentsand economic conditions; (3) delay or inabilityin obtaining regulatory approvals or bringingproducts to market; (4) fluctuations in cur-rency exchange rates and general financial marketconditions; (5) uncertainties in the discovery,development or marketing of new products or newuses of existing products; (6) increased governmentpricing pressures; (7) interruptions in production;(8) loss of or inability to obtain adequate protec-tion for intellectual property rights; (9) litigation;(10) loss of key executives or other employees;and (11) adverse publicity and news coverage.
All trademarks mentioned enjoy legal protection.The Roche Half-Year Report is published in German (original language) and English.
The Roche Half-Year Report is issued by F. Hoffmann-La Roche Ltd, Basel, Corporate Communications.
Design: Wirz Corporate AG, ZurichSource Associates AG, Zurich
Photos: Roland Tännler, ZurichTypesetting: Stauffer-Febel AG, BaselLithos: Lithoteam AG, Allschwil-BaselPrinters: Kreis Druck AG, BaselBinding: Buchbinderei Grollimund AG, Reinach-Basel

7-000-726