Robust control of hand prosthesis using electromyography ...
51
Robust control of hand prosthesis using electromyography, accelerometers and gyros Viktor Löfving Master’s thesis in Biomedical Engineering Department of Biomedical Engineering Faculty of Engineering, LTH, Lund University Supervisor: Christian Antfolk Examiner: Frida Sandberg January 20, 2017
Transcript of Robust control of hand prosthesis using electromyography ...

Robust control of hand prosthesis
using electromyography,
accelerometers and gyros
Viktor Löfving
Master’s thesis in
Biomedical Engineering
Department of Biomedical Engineering Faculty of Engineering, LTH, Lund University
Supervisor: Christian Antfolk Examiner: Frida Sandberg
January 20, 2017

1
Preface This project was performed at the department of biomedical engineering,
faculty of engineering Lund University during the spring and autumn term
of 2016. The project was supervised by Christian Antfolk and Frida
Sandberg acting as examiner.
This project would not have been possible without the help of several
people, I would like to thank my supervisor Christian Antfolk for valuable
insight and help during the project. In addition, I would also like to thank
all the volunteers who generously gave some of their time to help test the
program created by this project; Tobias Svensson, Ingrid Svensson, Elin
Holmström, William Rosengren, Dzenan Hjadarovic, Paul Lidgard, Johan
Andersson and Oskar Ström.

2
Table of contents Preface .......................................................................................................... 1
Table of contents .......................................................................................... 2
Abstract ........................................................................................................ 3
Background ................................................................................................... 3
Main goals ................................................................................................. 6
Introduction .................................................................................................. 6
The neuromuscular pathway and recording of EMG data ....................... 7
Signal processing ...................................................................................... 9
Classification ........................................................................................... 12
Neural networks .................................................................................. 15
Creating the prosthesis control program ................................................... 18
The MyoTM Armband .............................................................................. 20
Feature selection and extraction ............................................................ 21
Classification ........................................................................................... 22
Additional control ................................................................................... 26
Results ........................................................................................................ 28
Evaluating the effect of position on classification accuracy .................. 28
Evaluating system performance ............................................................. 31
Discussion ................................................................................................... 35
Conclusion .................................................................................................. 37
References .................................................................................................. 39
Appendix..................................................................................................... 42
Myoelektrisk kontroll av handprotes ...................................................... 43
MatLab code ........................................................................................... 45
Table of contents

3
Abstract The goals of this project are to investigate the viability of using the MyoTM
armband developed by Thalmic labs as a tool for myoelectric control of a
hand prosthesis as well as investigate whether the armbands ability to
record its spatial position and orientation can be used to increase the
performance of the prosthesis control program. Using the surface
electrodes, gyroscopes and accelerometers of the MyoTM armband, a
control system for myoelectric control of a hand prosthesis was created
and tested on nine different users. The system recognizes eight different
hand gestures and uses an artificial neural network as classification tool.
The system was evaluated by two main criteria; gesture classification
accuracy and response time. Offline testing showed an average gesture
classification accuracy of over 90%, however, the accuracy was greatly
reduced in online testing and a great variance in accuracy between
different gestures was observed. Likely in large part caused by user
inexperience with the system. The average system response time for all
gestures was in the range of 100-200ms, again, with variations between
gestures.
Using positional data in addition to the myoelectric signals recorded by the
armband showed no significant improvement in accuracy in best case
scenarios and a greatly reduced accuracy in worst case scenarios, while the
use of positional data still has the potential to improve the performance of
a prosthesis control system the wrong approach to do so was likely chosen
in this project and positional data was excluded in the final version of the
program, using instead only myoelectric data for classification.
Background The hand is a complex part of the human anatomy. Consisting of a large
number of small bones, tendons, sinews and muscles it creates a mean for
us to interact with and gain information from our environment throughout
daily life. Using our hands for all manner of different tasks is something we
learn from the moment we are born and it remains a natural way of
interacting with our surroundings for the rest of our lives. Considering this,
it is no great surprise that the loss of a hand or even just parts of it has a

4
great impact on daily life. The loss of a hand results in more than just the
direct loss of function, it also a psychological stress and great effort is
required to adept to this new situation. There are also other consequences,
in many cases persons who lose their hand are unable to continue in their
current profession and are forced to find another or retire entirely [1].
Finding exact numbers on the amount of people currently living with this
kind of limb loss is difficult, an old survey from 1996 that has since stopped
found that approximately 1.2 million Americans were living with the loss of
a limb. Estimations point to a number around 1.6 million in 2005 [2]. A
survey done in Norway and Sweden over a 10 year period showed that the
incidence of partial hand amputation is 1.9 per 100 000 people per year
with a significantly higher risk in left handed persons [3].
In these cases, the only treatment available is the use of a prosthesis to
replace the lost limb and restore some of the lost function of the hand. A
hand prosthesis may be designed in many different ways and their ability
to restore function also varies greatly. Some models are very simple and
have a primarily aesthetic function while doing little to restore the function
of the lost limb. More advanced models can consist of a simple muscle
powered ‘’claw’’ capable of a gripping motion which, while useful, is a far
stretch from the actions a regular hand can perform and often do not
visually resemble a real hand [4, 5], see examples in figure 1. Modern
technology allows for more complex devices using myoelectric control,
recording and using the electric signals of the nervous system to control
motors in the prosthesis, that more accurately mimic a real hand. These
modern models show a promising future for people living with limb loss
although there is still a long road ahead before a prosthesis can function as
a perfect replacement as they still lack many of the functions of a natural
hand. Prosthesis are limited to a smaller number of gestures, control is not
as intuitive as a real hand and is also very limited in feedback to the user
such as touch, heat or cold.

5
Figure 1: A collection of different hand prosthesis. A) Cosmetic prosthesis made from PVC. B) Cosmetic prosthesis made from silicone. C) Body powered hook
prosthesis. D) Hand prosthesis with individually moving thumb and two fingers [6-8].
Naturally, creating a modern hand prosthesis involves many challenges, not
the least of which is creating a method of control that is both intuitive for
the user and accurately interprets the user commands. One approach to
achieve this is utilizing electromyography (EMG) to record the activity of
the muscles in the lower arm related to hand movement. The loss of the
hand does not mean the loss of the signalling pathway of the nervous
system and the muscles in the lower arm related to hand movement can
still be used even if the hand itself is missing. If the pattern of electrical
signals in the remaining muscles of the damaged limb can be read and
interpreted correctly as intended gestures a myoelectric control system
could allow for intuitive control of the prosthesis and while
electromyogram control is a promising field a standard used clinical
solution has yet to be created [9-11]. Myoelectric control typically uses
surface electrodes to record muscle activity and this approach gives rise to
many different factors that affects the performance of an EMG pattern
recognition system [12]. During daily use common sources of error are
displacement of the electrodes or a change in the conductivity of the skin
as a result of humidity caused by sweat or weather conditions. Another
possible interference to the classification is the innervation of muscles not
related to the intended hand gestures that gives rise to signals which are
recorded by the electrodes. This may occur during movements of the arm,
when the arm is held in certain positions or when holding a weight or just
the weight of the prosthesis itself as additional muscles unrelated to hand
movement are activated during these tasks [13-15].

6
Main goals This work was done with two main goals in mind. Firstly, can a functional
hand prosthesis control system be created using a commercial product
such as the MyoTM gesture control armband. If possible, a simple wearable
gadget such as the armband could provide an easy method to don and
remove the electrodes used for prosthesis control. Creating a control
system is also a necessary first step as the second goal involves
improvements on an already functional system.
The second goal of this project is to investigate whether the performance
of a prosthesis control system can be improved by using the position of the
arm in addition to the EMG signals to alleviate the possible interference
from arm position, possibly, if the position of the arm is known to the
control system errors caused by limb position can be removed or alleviated.
To achieve this the MyoTM gesture control armband was used. The armband
is, in addition to the surface electrodes, also equipped with three-
dimensional gyroscopes and accelerometers. These sensors make it
possible for the armband to record additional spatial data which can be
used to complement the EMG data recorded by the electrodes. In the
project, the pitch and roll recorded by the armband were used.
Introduction Performing a moment of the hand involves a long signalling pathway
originating in the central nervous system and terminating in a muscle,
resulting in the contraction of muscle fibres which moves part of the hand
via a tendon. In the case of hand amputation, the hand and parts of the
tendons may be missing but the muscles of the lower arm and the signalling
pathway still remain. A hand prosthesis can therefore be controlled by the
same signal used to control the original hand, provided it can be recorded
and then properly interpreted. In this project a control system for a hand
prosthesis was created by using the MyoTM gesture control armband to
record the electrical signals in the muscles of the lower arm. The eight
surface electrodes on the armband records the pattern of muscle activity
in the lower arm. The control system then classifies the pattern of signals
as a certain hand gesture. If the classification of muscle activity happens in

7
real time and with sufficient accuracy the signals sent to the missing hand
can instead be used to control a prosthesis.
A prosthesis control system consists of several steps before the neural
signals results in movements of the artificial hand. The following section
will give a deeper explanation of the different major steps involved in the
process. From the recording of the muscle activity, signal processing and
feature extraction to the interpretation and classification of the recorded
signal and finally the control system of the potential prosthesis using the
recorded data. Figure 2 gives an overview of the major steps. Initially the
myoelectric data is recorded by surface electrodes. The raw data must
undergo some processing before it can be used for prosthesis control. This
involves dividing it into smaller segments and extracting features that will
be used to what gesture the signals corresponds to.
Figure 2: The four major steps involved in translating muscle activity into a form that can be interpreted by a prosthesis. After recording the signals undergo
several signal processing steps before they can be used for accurate classification.
The neuromuscular pathway and recording of EMG data The basic functional part of the neuromuscular system is the motor unit
(MU) consisting of a neuron end and a muscle fibre [16]. As the command
to use a muscle is initiated in the CNS the signal resulting in a hand
movement begins as a depolarization of the neurons connected to the
muscles controlling hand movement. The depolarization travels along the
neuron axon from the central nervous system to the connection between
the neuron and the muscle fibre, the neuromuscular junction (NMJ),
illustrated in figure 3.

8
Figure 3: The neuromuscular junction where the axon of the motor neuron connects to the muscle cell, Acetylcholine is released from storage vesicles at the end of the axon as the nerve end depolarizes. Acetylcholine binding to receptors
on the muscle cell results in the opening of ion channels that initiate muscle contraction [17].
As the axon end of the neuron depolarizes the neurotransmitter
Acetylcholine is released and diffuses over the synaptic cleft into the
muscle cell starting the response of the muscle cell resulting in muscle
contraction [18]. As the muscle is activated and contracts the electrical
activity can be recorded by electrodes placed on the skin above the muscle.
Placing several of these electrodes on different parts of the arm makes it
possible to measure the activity of the different muscles of the arm in real
time. As each movement of the hand is caused by a different pattern of
muscle activation each movement can be linked to a pattern of electrical
activity as recorded by the electrodes, figure 4 shows the pattern recorded
by eight electrodes placed on the lower arm during two hand gestures
separated by a period of rest.

9
Figure 4: Example of an EMG recording from eight electrodes located on the forearm, time on x-axis and activity on y-axis. The recording shows the different pattern of activity caused by two different gestures separated by periods of rest. When the hand is in rest all channels record a low level of activity. As a gesture is performed the different channels record different levels of activity depending on
the gesture.
Signal processing The raw signal recorded from the electrodes give some information about
the activity of the muscles corresponding to each electrode but in this state
it is too unwieldy to be useful for classification. This is caused by many
different factors such as background noise, electrode displacement, change
is conductivity between the skin and electrode or muscle fatigue [19].
Continuous recording of muscle activity produces large volumes of this
noisy data which would be unsuitable for direct prosthesis control and
several steps of signal processing are necessary. The solution to this is to
segment the data, select one or more specific features of the signal, isolate
them, and use this processed segment for classification. This produces

10
smaller, less noisy data sets that are more suitable to be used for
classification [20].
A great many different features can be used for classification any can be
divided into three categories; time domain, frequency domain and time-
scale domain dependant [21] all giving some information about the nature
of the signal. A relatively straight forward approach to feature extraction is
using the time dependent signal strength as a feature, such as using the
mean absolute value defied (MAV) as:
𝑀𝐴𝑉 =1
𝑁∑|𝑥𝑛|
𝑁
𝑛=1
Where N is the length of the signal and xn represents the EMG signal in a
segment. Using the mean absolute value is a simple way of measuring the
level of muscle activity and is a popular feature to use in myoelectric
control. This was the feature used for all classification in this project. The
mean of a myoelectric signal is close to zero and is not used. Other options
include using the root mean square (RMS) which relates to the constant
force of non-fatiguing muscle contraction.
𝑅𝑀𝑆 = √1
𝑁∑ 𝑥𝑛
2
𝑁
𝑛=1
If the power of the EMG signal is the desired feature the variance (VAR)
may be used:
𝑉𝐴𝑅 =1
𝑁 − 1∑ 𝑥𝑛
2
𝑁
𝑛=1
The standard deviation (SD) of the signal relates to the threshold level of
muscle activation and can also be used.
𝑆𝐷 = √1
𝑁 − 1∑(𝑥𝑛 − �̅�)2
𝑁
𝑛=1
11
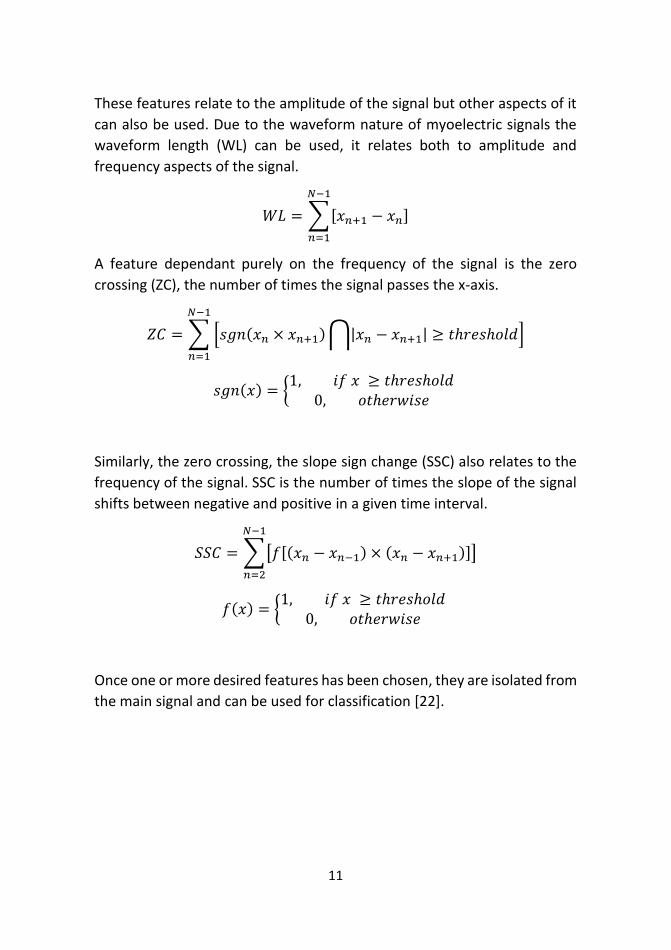
These features relate to the amplitude of the signal but other aspects of it
can also be used. Due to the waveform nature of myoelectric signals the
waveform length (WL) can be used, it relates both to amplitude and
frequency aspects of the signal.
𝑊𝐿 = ∑[𝑥𝑛+1 − 𝑥𝑛]
𝑁−1
𝑛=1
A feature dependant purely on the frequency of the signal is the zero
crossing (ZC), the number of times the signal passes the x-axis.
𝑍𝐶 = ∑ [𝑠𝑔𝑛(𝑥𝑛 × 𝑥𝑛+1) ⋂|𝑥𝑛 − 𝑥𝑛+1| ≥ 𝑡ℎ𝑟𝑒𝑠ℎ𝑜𝑙𝑑]
𝑁−1
𝑛=1
𝑠𝑔𝑛(𝑥) = {1, 𝑖𝑓 𝑥 ≥ 𝑡ℎ𝑟𝑒𝑠ℎ𝑜𝑙𝑑
0, 𝑜𝑡ℎ𝑒𝑟𝑤𝑖𝑠𝑒
Similarly, the zero crossing, the slope sign change (SSC) also relates to the
frequency of the signal. SSC is the number of times the slope of the signal
shifts between negative and positive in a given time interval.
𝑆𝑆𝐶 = ∑[𝑓[(𝑥𝑛 − 𝑥𝑛−1) × (𝑥𝑛 − 𝑥𝑛+1)]]
𝑁−1
𝑛=2
𝑓(𝑥) = {1, 𝑖𝑓 𝑥 ≥ 𝑡ℎ𝑟𝑒𝑠ℎ𝑜𝑙𝑑
0, 𝑜𝑡ℎ𝑒𝑟𝑤𝑖𝑠𝑒
Once one or more desired features has been chosen, they are isolated from
the main signal and can be used for classification [22].

12
Classification Classification is the process of assigning a set of features a class label.
Classification is used in many fields and have countless applications for
example, classifying a tumorous cell as benign or malignant or determining
the species of a flower. In the case of myoelectric control as done in this
project, the features are the MAV values extracted from the recorded EMG
signals and the class labels are the different gestures.
There are a great number of different methods that have been developed
to classify data in this manner each with their own pros and cons making
them suitable for different applications. In order for a method to be able to
correctly classify a data point it must first be presented with a set of data
consisting of a number of correctly classified data points, called a training
set.
A commonly used method is linear discriminant analysis (LDA). LDA
attempts to find a linear combination of the features and combine them
into a single value. The performance of LDA depends on how the features
are combined. Ideally the features should be combined in such a way that
if the classes are projected onto the axis they are seen as clearly separated
tight clusters, see figure 5.

13
Figure 5: Visualization of LDA. The two classes are identified by two features. The two features are combined and the classes are projected onto this new axis
representing the combined features.
LDA is generally suitable is when there are many variables and small sample
sizes. Comparably, quadratic discriminant analysis works similarly but
instead separates the classes on a quadratic surface rather than a linear
line.
A Support vector machine represents the training data as points in space
and divides them with a hyperplane positioned as far away as possible from
the different points. New points are then easily classified simply by which
side of the hyperplane they are positioned. This easily visualized when
dealing with two features and a linear hyperplane, see figure 6. Depending
on the maximum-margin hyperplane algorithm used a non-linear
hyperplane can also be produced if desired.

14
Support vector machines are easily optimized but they do not provide a
probabilistic confidence value of the classification which may be a
drawback in some situations.
Figure 6: Maximum-margin hyperplane and margins for a support vector machine trained with samples from two classes. Samples on the margin are called the
support vectors.
K nearest neighbour is perhaps the most straight-forward classification
method. The class of a new data point is determined simply by directly
comparing its features to already known data points, See figure 7.
Figure 7: Visualization of the k nearest neighbour method. The unclassified data point is compared to k known classes, in this case k=3, and is assigned a class
determined by majority vote.

15
While this method is easy to implement calculations can be slowed by large
numbers of data and larger values of k. It also works best when the
overlapping of classes is as small as possible.
Another common method for classification is to use an artificial neural
network [9, 21]. All classification in this project was done with the use of an
artificial neural network and a more in depth explanation of the method
follows in the next section.
Regardless of the method used a classifier must be able to keep up with the
speed of data recording so that the classification happens in near real-time,
the user should not experience a notable delay between command and
prosthesis movement. The classifier should also be able to cope well with
small variations in the input signal due to the changes that occur in the
extracted features after extended use of the armband caused by a number
of different reasons such as electrode displacement or muscle fatigue,
while a recalibration can be used to correct these errors it is preferable for
the user if the system can perform well without frequent recalibration.
Neural networks An artificial neural network is a program consisting of several nodes
connected in a way resembling neurons in a biological brain. These nodes
are organized in layers and connect to each other with connections of
different weights, positive or negative, much like the neurons of a biological
brain is connected via inhibitory or exhibitory synapses. Each node also has
an activation function, such as a sigmoid function, acting like the activation
threshold in a biological neuron, determining when the signal is passed on
to the next nodes. The number of layers can vary but typically a network
consists of a minimum of an input layer, an output layer and a layer
connecting the two called the hidden layer, illustrated in figure 8. The
number of input nodes corresponds to the number of inputs and the output
nodes to the possible outputs. In the networks created in this project this
means eight inputs when using only EMG signal and ten inputs when using
roll and pitch in addition to the EMG. The weight of the connections and
the activation function of the nodes define the flow of information through
the network and determines the output to an input signal.

16
Figure 8: Visualization of a simple artificial neural network consisting of three layers.
A network is created using a set of input data with corresponding output
data. The data is divided into three sets used for training, validation and
testing respectively with a majority of the data being used for training. The
training set determines the weights between the nodes as the network is
created. A possible mistake when creating a network is overtraining which
causing overfitting by the networks functions making it unsuitable for
handling unknown inputs, see figure 9. To prevent this the validation set is
used. The validation set does not affect the weights of the system but acts
as an indicator of when it is time to stop the training. If additional training
increases the accuracy of the training data set but the accuracy of the
validation set decreases or remains the same the system has started
overfitting and training should cease as overfitting would greatly reduce
the networks performance when faced with input data not from the
training set.

17
Figure 9: Example of overfitting. The blue line is the results of a function overfittted to the data points, while this model agrees with all known data points
it is useless in predicting any new points. The black line, while not fitting any of the point perfectly, is a much better model in this case as it more accurately
shows the trend in the data and can be used to predict new data points. Similarly a neural network overfittted to the training set data will perform poorly when
encountering new inputs [23].
Finally, the testing set is used to estimate the accuracy of the network. This
data set is new to the network and tests its performance when faced with
unknown data, giving an estimation of the networks performance.

18
Creating the prosthesis control program The control system created in this project involves the four major steps
described in the introduction, however several additional steps and
methods were added in order to improve performance and reliability as
well as making the program more intuitive for the user. This section
describes the creation process of the program, the steps involved and the
equipment used.
In any gesture control system, the choice of which gestures to use is an
important one. Using a few distinctly different gestures would make it
easier for the program to distinguish between them but would limit the
usability of the prosthesis. Ideally the prosthesis and control system would
be able to recognize and perform the same movements as a regular hand
but such a system is not possible with current technology. Instead a balance
must be found between system accuracy and number of useful gestures
[24]. Another point to consider is how intuitive the gesture is for the user,
if a gesture is easily recognized by the program but feels awkward or
unnatural to perform it may not be a good choice. Following these criteria
eight gestures were chosen, shown in figure 10.

19
Figure 10: The eight gestures that were chosen for the project.

20
These gestures were chosen as they are all distinguishable from each other
resemble useful everyday gestures. An argument could be made that
gesture 4 and 5 are not very useful, however, the gestures of the prosthesis
does not necessarily have to match those of the user, for example, gesture
5 could translate to a more useful cupping gesture while still being intuitive.
Similarly, gesture 6 is not what most people would do if asked to point, the
motion is exaggerated for easier classification.
The MyoTM Armband All recording of EMG data performed during this work was done using the
MyoTM gesture control armband, shown in figure 11, developed and sold
by Thalmic Labs Inc. The armband is intended to be used for gesture control
of common programs such as Spotify, PowerPoint presentations and a
variety of media player. To fulfil these functions, the armband is able to
recognise four gestures using its own classification system. This
accompanying classification software was not used in this project and the
armband served solely as a recording device.
Figure 11: The MyoTM armband. The eight electrodes are connected via flexible sections that can be stiffened by attaching clips, making the armband able to
snugly fit around the lower arm.

21
The armband is equipped with eight electrodes, a three-axis gyroscope, a
three-axis accelerometer and a three-axis magnetometer. This setup of
sensors allows the armband to determine and report its position in a three-
dimensional space in addition to the EMG data. The armband contains an
ARM Cortex M4 Processor and a rechargeable lithium ion battery allowing
it to be used completely wirelessly, using a Bluetooth connection to either
a Windows PC or MAC. Feedback is given to the user via LEDs and vibration
pulses of varying length [25].
To ensure maximum signals strength the armband is placed around the
thickest part of the upper lower arm.
Feature selection and extraction The armband is capable of recording EMG data at 200 Hz but is limited to
50 Hz when also recording positional data such as pitch, yaw and roll. The
feature chosen for classification was the mean absolute value of the EMG
signal, in tests involving positional data pitch and roll of the armband were
used as features in addition to the EMG. To calculate the mean average,
the stream of recorded EMG signals was segmented, as is often the case,
the choice of segment length is a choice between speed and accuracy. A
longer segment could provide a better mean value and is more resistant to
spikes or dips in the signal but using longer segments would also reduce the
systems response time [26]. To circumvent this to some degree the
segments can be overlapped, see figure 12. When using overlapping longer
segments can be used while having a smaller impact on system response
time.

22
Figure 12: Visualization of overlapping data segmentation. The continuous stream of EMG data is being divided into smaller segments that will be used for
feature extraction.
Following the findings of L Smith et al. [26] in a work determining the
optimal window length and spacing during myoelectric control, the
program uses segments consisting of 30 data points corresponding to a
segment length of 150ms. The segments overlap by five data points which
introduces a delay of 25ms to the system as new data is recorded before
the next segment is sent to classification.
Classification All classification in the system was done using an artificial neural network
created for each user. All neural networks were created in MatLab using
the nprtool interface shown in figure 13 and 14.
Using the MyoTM armband a large set of data was recorded as the user
performed each gesture twice separated by a period of rest. The recorded
training data with corresponding class labels are fed to the network training
tool and randomly divided into the training, validation and test set
consisting of 70%, 15%, and 15% of the total set respectively following the
default settings of the program. The created network consists of eight input
nodes, one for each electrode, a hidden layer consisting of ten nodes and
an output layer consisting of eight nodes, one for each gesture. The number
23
of inputs and output nodes naturally corresponds to the number of inputs
and outputs used while the number of nodes in the hidden layer can be
customized. Ten was found to be a suitable number as adding more nodes
did not cause any significant improvement in performance.
Using the training data, the network goes through many iterations
adjusting the weights between the nodes and improving the classification
accuracy of the training set. This accuracy is continuously compared to the
accuracy of the validation set. When the accuracy of the validation set stops
improving with further iterations the training stops to prevent overfitting.

24
Figure 13: The nprtool MatLab interface. Training of this network has stopped after 99 iterations as the accuracy on the validation set has stopped improving.

25
Figure 14: Receiver operating characteristic plots created after training of the network to give an estimations of the networks performance. This particular
network shows promising results as the ROC curve has an almost ideal shape.
After completed training the network Is saved as a MatLab function by the
network training program and can now be used to classify new inputs.
Producing class label as the network is presented with a new feature
segment involves two steps. Firstly, as the network receives input in the
form of the features extracted from the EMG signal in the previous step
each output node produces a value between zero and one and the signal is

26
classified as the gesture that received an output value of >0.95. If this
requirement is not met i.e. for all classifications were no output node
received a value greater than 0.95 the previous class label is returned. This
requirement on the output creates a more rigid system as the class label is
only changed if the system is very certain of the classification, reducing the
amount of misclassifications at the cost of response time.
This classification is then added to a list consisting of the five latest
classifications and the final class label is the gesture that appears the most
in this list. As the next feature segment is classified the list is updated as
the oldest value is removed and the latest added. This system sacrifices
some response time as a gesture must be classified at least three times to
achieve majority and affect the class label but also makes the system more
robust as it lessens the impact of singular misclassifications.
Additional control At this stage the program records and classifies the EMG data in near real
time. This is enough to control a prosthesis but there is room for several
improvements. For example; the system cannot perform movements at
different speeds or grip strengths and to make the prosthesis remain in a
certain gesture the command to do the desired gesture must be sent
continuously. All this adds up to a control system that is functional but not
very convenient in daily use.
A way to utilize this stream of data to create a more user friendly system is
to implement a finite element machine to control the prosthesis. A finite
state machine is a system consisting of a number of predetermined states,
only one state is active at the time and switches between states is decided
by the input. An example of a simple state machine is a system with two
states, on and off, using a sine function as input and the trigger to go from
the off state to the off state is the input being larger than zero and vice
versa, see figure 15. A system designed this way would continuously switch
between the on and off state as the sine function changes value between
positive and negative.

27
Figure 15: Example of a simple finite state machine consisting of two states. The machine continuously switches between the on and off state as the input signal
changes value.
The state machine used by the control system consists of eight states, one
for each gesture, and uses the class provided by the neural network as
input. The system was designed to use rest as the default state, performing
a different gesture while in the default state switches state to new gesture,
with the exception of gesture 3 which was used to return to the rest state
regardless of current state. Figure 16 provides a visualization of the finite
state machine, showing how the different states relates to each other and
how the input determines the change between states.
Figure 16: Visualization of the finite state machine used by the control system. The machine consists of seven states and the input signal is the class label provided by the classifier. At rest performing a gesture will switch to the
corresponding state and remain there until the command to return to the rest state is given.

28
This setup allows the user to let the prosthesis remain in a certain position
without having to continuously flex the muscles of the lower arm as
relaxing the muscles never switches states. It also reduced the risk of the
prosthesis suddenly performing unintended movements resulting in a
more reliable and user friendly system.
Another factor that could improve user experience and add additional
control is the ability to choose the speed at which the prosthesis performs
the gestures [27]. By enabling the prosthesis to perform gestures at
different speed or stop a gesture before it is completed and remain in that
position a much higher degree of fine control would be reached. This can
be achieved by using proportional control. The sum of the MAV from the
eight electrodes can be normalized and used to decide motor speed in the
prosthesis. This creates a control system were straining the lower arm
harder when doing a certain gesture makes the prosthesis perform the
correlating movement faster.
Results The testing was divided into two major parts, firstly the possible
improvement to classification accuracy by using positional data in addition
to the EMG signals were investigated.
Secondly the performance of the final version of the control system was
tested by nine users, evaluating the accuracy and response time of the
control system when used by a variety of different users with no experience
of the system.
Evaluating the effect of position on classification accuracy To test the impact of using positional data on classification accuracy two
sets of training data were prepared. Both using the eight gestures and
recording both EMG and positional data. The first set was recorded during
a small waving movement of the arm and the second during a larger circular
motion of the arm, see figure 17. With these two sets of data four neural
networks were created, two using the pitch and roll of the armband in

29
addition to the EMG data as input in the training set and two using only
EMG as input.
Figure 17: The small and large movement of the arm used when testing classification accuracy.
The four networks trained with the four training sets were tested
individually. The accuracy test was done by performing the eight gestures
after each other, recording 100 data points per gesture, the 800 data points
are then fed to the classifier and the percentage of correct classifications
was calculated by comparing the classifiers results to the intended
sequence of gestures. The mean accuracy was calculated from three
recordings. This test was done with all networks, once with no movement
of the arm and once with the small or large movement the network had
been trained with, results shown in tables 1-3.

30
Networks trained during small movement
input EMG only EMG and position
Arm movement during test
no movement
movement no movement
movement
Accuracy % 82,3 82,0 89,3 83,3 Table 1: Results using the two networks made from the training set recorded
during small movement of the arm.
Networks trained during large movement
input EMG only EMG and position
Arm movement during test
no movement
movement no movement
movement
Accuracy % 80,7 81,3 82,7 75,3 Table 2: Results using the two networks made from the training set recorded
during large movement of the arm.
An additional test was performed using the two network trained with the
data from the large movement but this time the movement of the arm
during testing was completely different than that from training, presenting
condition the networks were not trained for.
input EMG and position EMG only
Accuracy % 34,0 83,0 Table 3: Results from testing the two networks trained during large movements
with a movement of the arm unfamiliar to the system.

31
Evaluating system performance The final version of the software was evaluated by two criteria;
classification accuracy and response time. The system was tested by nine
different users. During evaluation the finite element machine addition was
not used. Testing procedure began with the training of a neural network
calibrated to each user. Users performed each gesture in order separated
by a period of rest to record the EMG data corresponding to each gesture.
This data was then divided into a training, validation and test set using 70%,
15% and 15% of the total set respectively. Using this data an artificial neural
network was created for each user.
The result of the test data performance evaluation is presented as a
confusion matrix in figure 18. The number in each coloured square
represents the percentage of the total test data set in each target/output
combination. As a period of rest was recorded between each gesture a
perfect confusion matrix would have 50% of the data set in the upper-left
corner, ~7.1% in the remaining green squares and zero in all red squares.
The horizontal light grey section shows the percentage of each input that
was correctly classified and the vertical light grey section shows the
percentage of each class label that was correct. The average accuracy is
given in the lower right corner.
After creation of the network the users were given a few minutes to get
accustomed to the program. During this practice stage classification of
gestures was done in real time and shown to the user as feedback but no
data was recorded.
To test the accuracy of the running system the users were asked to perform
the eight gestures in order while recording the classification. The recorded
classification was then compared to the intended gestures and the
accuracy of the classification calculated. This was repeated three times or
each user, results presented in figure 19.

32
Offline test:
Online test:
Figure 19: Results of the online test performed by the nine users. Bars showing the fraction of correct classifications for each gesture and the standard deviation
for that gesture.
Figure 18: Confusion plot produced by the test data set recorded during neural network training.

33
Finally, the response time of the system tested. Following a similar
approach to Guanglin Li et al. [28] system response time was evaluated by
two criteria: motion selection time and motion completion time. Motion
selection time is defined as the time from onset of motion to the first
correct classification of the movement by the system. See figure 20, while
the hand is in rest the recorded EMG activity is low and a baseline activity
can be determined, marked by the horizontal line in the graph. As a gesture
is performed, the EMG activity increases and the delay from movement
onset to the new gesture being classified can be calculated as the sampling
rate of the system is known.
Figure 20: Graph created during response time testing showing both EMG activity and class label, in this case, a change from rest to gesture 2 (fist). Movement
onset is defined as the point where the EMG activity raises over the rest activity, marked by the horizontal straight line. The time between movement onset and
the first correct classification marks the motion selection time. The motion completion time is defined as correct classification corresponding to one second.
Motion completion time is the time it takes for the system to complete the
intended motion defined as correct classifications corresponding to 1
second. In addition to the unavoidable delay in the system as a result of the
signal processing and computational steps the motion selection time and

34
motion completion time are also increased by misclassifications, see figure
21.
Figure 21: Graph recorded during change from rest to gesture 7 (pinch grip). In this recording both the motion selection time and motion completion time are increased by misclassifications. After movement onset the system incorrectly
classifies the movement as gesture 5 (folded inwards) before the correct classification is made. The motion completion time is also lengthened by a
section incorrectly classified as rest.
Due to the difficulties with reliably performing each gesture the different
users had the response time test was only done on one user. Each gesture
was performed five times from a period of rest and held until the motion
completion time could be determined while the EMG activity and class
labels were continuously recorded. Using the resulting graphs, the mean
motion detection and motion completion time was calculated, presented
in table 4. Note that a response time for gesture 1, rest, cannot be
calculated using this method.

35
gesture 2 3 4 5 6 7 8
Motion selection time (ms)
100 ± 18
120 ± 21
135 ± 65
255 ± 195
135 ± 29
280 ± 191
55 ± 11
Motion completion
time (s)
1 ± 0
1 ± 0
1,09 ± 0,129
1,07 ± 0,157
1 ± 0
1,07 ± 0,095
1 ± 0
Table 4: Results from the motion selection and completion time test.
Discussion As demonstrated by the high accuracy given in the offline test, the use of
the MyoTM armband as the recorder of EMG signals proved successful in
this project. Showing that a commercially available product with a simple
radial distribution of electrodes it capable of distinguishing between, at the
very least, the eight gestures used in the project. However, it should be
noted that no long term tests where the armband was worn for a full day
of use was performed. It is likely that the performance would degrade
during extended use by factors previously mentioned such as electrode
displacement.
The online test introduces the human element into the testing, with the
exception of gesture 1, rest, the accuracy of the system differed widely
between the different users in the online test. As reflected in the large
standard deviation in gestures 2-8. The accuracy of each gesture was
generally either poor, <20%, or good, >80%, with few gestures having a
more average accuracy. While most user had one or more gesture
performing poorly and the others better it was different gestures for
different users, resulting in the large standard deviation. For example, a
common problem was misclassification of gesture 3 as gesture 4 or vice
versa. Resulting in some user having very good accuracy in gesture 3 but
low in gesture 4 and others having the exact opposite.
This is most likely caused by user inexperience with the system, without a
longer training period to get used to use the system many users found it
difficult to reliably quickly switch to a specific gesture, this quickly leads to

36
a large percentage of incorrect classifications as each gesture was only
recorded for 100 data points, 0.5 seconds, during the accuracy test. It
should be noted that the user with greater experience with the program
(the author) achieved >80% accuracy for all gestures, reaching the same
levels of accuracy as the offline test. This was also achieved by one of the
other users. The great difference could also be explained by the short
recording time for each gesture, choosing a longer recording time would
result in a higher calculated accuracy as a greater portion of the data would
be recorded after the user has found the correct gesture. That said, the
system should be able to quickly change between gestures and shorter
recording times creating a stricter test may better represent what is
expected of the system in daily use [28-30].
To avoid a noticeable delay by the user the system response time should at
the very least be no greater than 300ms. Preferably lower, in the 100ms
range [21].
This level of responsiveness was achieved by some gestures while others
took significantly longer, motion selection time varies between 55 and
280ms in the two most extreme cases. The delay is in a large part
determined by the way the system is constructed. Caused by computing
steps and overlapping of segments during recording. This kind of delay is to
a certain degree unavoidable but possible to reduce by using a more
efficient program or shorter segment overlap.
The delay caused by the system should however affect all gestures equally
and cannot be the reason such a large variance in response time is observed
between the different gestures. Instead this delay is most likely a result of
how strict the system is when applying class labels and user error. While a
strict system reduces the amount of misclassification it also demands a
more precise input from the user. While lowering the classification
strictness could improve this response time it is also possible that it could
be reduced with more user experience as the user gains a more intuitive
feel for the system. Another approach would be a change to the training
routine, if the gesture is performed less strictly during training the system
should correctly classify a larger variance in input, provided it is not too
similar to a different gesture.

37
At several points in the system the choice is made between response time
and accuracy, for example the requirement that the output node of the
neural network must have a value of at least 0.95 before creating a new
class label. This rigidity of the system is reflected in the observed motion
completion time which was close to one second for all gesture with very
little variation. By the way the motion completion time was defined it is
natural that a system that is ‘’unwilling’’ to quickly change class labels
would produce short motion completions times.
Using the positional data in addition to the EMG to improve system
accuracy proved a failure. In cases when the arm was moved in in a similar
way to that during training it resulted in no significant improvement of
accuracy. When presented with an arm movement not performed during
training the accuracy was significantly lowered.
This is a result of using the pitch and roll directly as inputs to the neural
network which may have been a poor approach as it necessitates the arm
being moved in all positions expected of daily use during training of the
network. Not doing so results in the network often receiving input values
not present in the training set, significantly lowering performance. A
training routine going through all the expected arm positions during daily
use could be created but as this application of positional data had no
beneficial effect on classification accuracy it is probably better to choose
another approach to this problem altogether.
Conclusion Myoelectric prosthesis control shows great promise in reducing the
negative impacts the loss of a limb can have. While the technology is still
far from perfectly replicating a biological limb prosthetics are capable of
significantly improve the quality of life for people who are affected.
This project aimed to create a functional myoelectric control system and
investigate how the effects of limb position on system accuracy can be
alleviated. While a functional myoelectric control system for a hand
prosthesis using the MyoTM armband was created, attempting to use the

38
positional data provided by the armband did not result in any increase in
accuracy compared to using only the EMG data.
However, this project covered only one approach of utilizing the positional
data and showed that the MyoTM armband can be used for prosthesis
control. The work done during this project could be expanded upon in
different directions in future work. Much can be done to streamline the
system and improve the training routine as well as exploring new ways to
use the positional data made available by the armband.

39
References
1. Burger, H., T. Maver, and Č. Marinček, Partial hand amputation and work. Disability and Rehabilitation, 2007. 29(17): p. 1317-1321.
2. Ziegler-Graham, K., et al., Estimating the Prevalence of Limb Loss in the United States: 2005 to 2050. Archives of Physical Medicine and Rehabilitation, 2008. 89(3): p. 422-429.
3. Atroshi, I. and H.E. Rosberg, Epidemiology of amputations and severe injuries of the hand. Hand clinics, 2001. 17(3): p. 343-50, vii.
4. Belter, J.T., et al., Mechanical design and performance specifications of anthropomorphic prosthetic hands: A review.
5. Yang, J., et al., A multi-fingered hand prosthesis. Mechanism and Machine Theory, 2004. 39(6): p. 555-581.
6. Body-powered hand prosthesis. [cited 2016 26-10]; Available from: http://www.medicalexpo.com/prod/fillauer/product-74954-466476.html.
7. Male APRL Voluntary Closing Hand. [cited 2016 26-10]; Available from: http://fillauer.com/Upper-Extremity-Prosthetics/body-powered-systems/hands-and-gloves/male-hands/male-APRL-voluntary-closing-hand.html.
8. Comparison of mechanical properties of silicone and PVC (polyvinylchloride) cosmetic gloves for articulating hand prostheses. [cited 2016 26-10]; Available from: http://www.rehab.research.va.gov/jour/2013/505/page723.html.
9. Scheme, E. and K. Englehart, Electromyogram pattern recognition for control of powered upper-limb prostheses: State of the art and challenges for clinical use. Journal of Rehabilitation Research & Development, 2011. 48(6): p. 643-659.
10. Parker, P., K. Englehart, and B. Hudgins, Myoelectric signal processing for control of powered limb prostheses. Journal of Electromyography and Kinesiology, 2006. 16(6): p. 541-548.
11. Zecca, M., et al., Control of Multifunctional Prosthetic Hands by Processing the Electromyographic Signal. 2002. 30(4-6): p. 459-485.
12. Castellini, C. and P. Smagt, Surface EMG in advanced hand prosthetics. Biological Cybernetics, 2008. 100(1): p. 35-47.

40
13. Fougner, A., et al., Resolving the Limb Position Effect in Myoelectric Pattern Recognition. IEEE Transactions on Neural Systems and Rehabilitation Engineering, 2011. 19(6): p. 644-651.
14. Scheme, E.J., K.B. Englehart, and B.S. Hudgins, Selective Classification for Improved Robustness of Myoelectric Control Under Nonideal Conditions. IEEE Transactions on Biomedical Engineering, 2011. 58(6): p. 1698-1705.
15. Cipriani, C., et al., The Effects of Weight and Inertia of the Prosthesis on the Sensitivity of Electromyographic Pattern Recognition in Relax State. JPO: Journal of Prosthetics and Orthotics, 2012. 24(2): p. 86-92.
16. Gazzoni, M., D. Farina, and R. Merletti, A new method for the extraction and classification of single motor unit action potentials from surface EMG signals. Journal of Neuroscience Methods, 2004. 136(2): p. 165-177.
17. Jana, D., Neuromuscular junction. Doctor Jana free medical stuff. 18. Wu, H., W.C. Xiong, and L. Mei, To build a synapse: signaling
pathways in neuromuscular junction assembly. Development, 2010. 137(7): p. 1017-1033.
19. Farina, D., R. Merletti, and R.M. Enoka, The extraction of neural strategies from the surface EMG. Journal of Applied Physiology, 2004. 96(4): p. 1486-1495.
20. Reaz, M.B.I., M.S. Hussain, and F. Mohd-Yasin, Techniques of EMG signal analysis: detection, processing, classification and applications. Biological Procedures Online. 8(1): p. 11-35.
21. Asghari Oskoei, M. and H. Hu, Myoelectric control systems—A survey. Biomedical Signal Processing and Control, 2007. 2(4): p. 275-294.
22. Ahsan, M.R., M.I. Ibrahimy, and O.O. Khalifa. Electromygraphy (EMG) signal based hand gesture recognition using artificial neural network (ANN). in Mechatronics (ICOM), 2011 4th International Conference On. 2011.
23. Ghiles, Overfitted data. 24. Castro, M.C.F., S.P. Arjunan, and D.K. Kumar, Selection of suitable
hand gestures for reliable myoelectric human computer interface. BioMedical Engineering OnLine, 2015. 14(1): p. 1-11.
25. MYO armband technical specifications. [cited 2016 13-07]; Available from: https://www.myo.com/techspecs.

41
26. Smith, L.H., et al., Determining the Optimal Window Length for Pattern Recognition-Based Myoelectric Control: Balancing the Competing Effects of Classification Error and Controller Delay. IEEE Transactions on Neural Systems and Rehabilitation Engineering, 2011. 19(2): p. 186-192.
27. Simon, A.M., et al., A Decision-Based Velocity Ramp for Minimizing the Effect of Misclassifications During Real-Time Pattern Recognition Control. IEEE Transactions on Biomedical Engineering, 2011. 58(8): p. 2360-2368.
28. Li, G., A.E. Schultz, and T.A. Kuiken, Quantifying Pattern Recognition—Based Myoelectric Control of Multifunctional Transradial Prostheses. IEEE transactions on neural systems and rehabilitation engineering : a publication of the IEEE Engineering in Medicine and Biology Society, 2010. 18(2): p. 185-192.
29. Ortiz-Catalan, M., et al., Real-Time and Simultaneous Control of Artificial Limbs Based on Pattern Recognition Algorithms. IEEE Transactions on Neural Systems and Rehabilitation Engineering, 2014. 22(4): p. 756-764.
30. Simon, A.M., et al., The Target Achievement Control Test: Evaluating real-time myoelectric pattern recognition control of a multifunctional upper-limb prosthesis. Journal of rehabilitation research and development, 2011. 48(6): p. 619-627.

42
Appendix Presented in this section is the MatLab code written during this project as
well as a summary of the project in the form of a popular science article
written in Swedish aimed at an audience unfamiliar with the field of
myoelectric control.

43
Myoelektrisk kontroll av handprotes Viktor Löfving – Institutionen för biomedicinsk teknik, Lunds Tekniska Högskola.
Handledare: Christian Antfolk, Examinator: Frida Sandberg
Populärvetenskaplig sammanfattning av arbetet: Robust control of hand prosthesis using
electromyogram, accelerometers and gyros.
Att förlora en hand är en stor förlust
och även om allt mer avancerades
proteser tillverkas är de fortfarande
långt ifrån att prestera lika bra som
en riktig hand. För att kunna styra
handproteser på ett intuitivt sätt
används myoelektrisk kontroll. En
metod där man spelar in kroppen
muskelsignaler och översätter dem
till signaler som kan styra t.ex. en
robothand.
Att röra på handen är något vi gör
varje dag utan eftertanke men varje
liten rörelse är resultatet av en lång
signalkedja med ursprung i hjärnan.
Om du vill knyta handen skickas först
en nervsignal ut från hjärnan, denna
signal färdas via långa nervtrådar ut i
armen och når muskler i handen och
underarmen. När musklerna nås av
signalen drar de ihop sig och drar i de
senor som binder samman muskler
och skelett och handen knyts. Det
finns en mängd olika muskler som
påverkar handen och genom att
aktivera dem till olika grad kan vi
utföra alla de gester vi gör med våra
händer varje dag.
Detta innebär att även om man
förlorat handen i t.ex. en olycka eller
sjukdom finns en stor del av system
som styr handen fortfarande kvar.
Man kan skicka muskelsignaler som
påverkar underarmens muskler men
då handen saknas tar det stopp här.
Dessa signaler kan ändå komma till
nytta, när en muskel drar ihop sig
skapas det en liten elektrisk signal
som kan spelas in av en elektrod i
närheten. Genom att fästa flera
elektroder kring de olika musklerna i
armen kan man tolka
muskelsignalerna som skickas och
använda dessa som instruktioner för
hur en konstgjord han skall röra sig.
Om detta lyckas skulle man kunna
skapa en konstgjord hand som styrs
lika naturligt som en riktig då man
använder sig av exakt samma
signaler som innan handen
förlorades. Så pass avancerade
proteser finns ännu inte idag, de är
istället begränsade till ett mindre
antal gester och det är inte alltid
system tolkar signalerna rätt.
Detta projekt delades upp i två
huvuddelar: först och främst
skapades ett enkelt styrsystem som

44
med hjälp av elektroder kring
underarmen kan känna igen åtta
olika gester. Ett vanligt problem med
denna typ av styrsystem är att de får
svårare att tolka nervsignalerna när
rör på armen eftersom elektroderna
som ligger på huden rör sig i
förhållande till musklerna under
huden när armen hålls i olika
positioner.
Som en andra del av projektet
undersöktes därför ifall styrsystemet
kunde förbättras om man använder
sig av mer data än enbart
muskelsignalerna.
För att uppnå detta användes MyoTM
gesture control armband.
Armbandet består av åtta elektroder
men är också utrustat med sensorer
som låter armbandet känna av hur
det är orienterat i rummet. Tanken
är att denna extra data skall kunna
användas för minska problem som
uppstår när armen rör sig mellan
olika positioner.
Figur 1: Armbandet som användes till projektet. Myo gesture control armband,
utvecklat av Thalmic Labs.
Projektet slutade i blandade resultat.
Första delmomentet uppnåddes då
Myo armbandet kunde användas till
att skapa ett fungerande system som
kände igen åtta olika gester.
Systemet testades på nio olika
användare och utvärderades efter
träffsäkerhet och responstid.
Träffsäkerheten var i bästa fall på
över 80 % för alla gester, detta
uppnåddes dock bara av en
användare. Responstiden i systemet
varierade kraftigt mellan de olika
gesterna, målet var att komma
under 100ms vilket enbart
uppnåddes av två gester.
Delmoment två uppnåddes inte.
Under försök där den extra
informationen från armbandet
användes utöver muskelsignalerna
syntes i bästa fall ingen förbättring
av träffsäkerheten och i värsta fall en
markant försämring.

MatLab code The MatLab code written during this project.
%% Create Myo Object
% Instantiates Myo object
if exist('m') == 1
clear
end
m = Myo();
EMGtrain = zeros(5600,8);
ACCtrain = zeros(800,1);
%%
clc;
FileID7 = fopen('PythonVars.txt','wt');
SampleRate = input('Sample rate (0-200Hz): ');
T = input('Duration (s): ');
pythonvars = [SampleRate, T];
fprintf(FileID7,'%d\n',pythonvars);
fclose(FileID7);
eval('!matlab -nodesktop -nosplash -minimize -r "r6 = 1, try,
terminate, catch, try, init_python, catch, exit, end, end" &')
t_initial = clock;
ii = 0;
t = 0;
a3 = [0 0 0 0];
a3_e = [0 0 0];
roll = 0;
pitch = 0;
yaw = 0;
a3_e(end+1,:) = [roll pitch yaw];
a5 = [0 0 0 0 0 0 0 0];
% FileID3 = fopen('Orientation.txt','w');
FileID5 = fopen('Emg.txt','w');
segment = ones(5,1);
export = zeros(30,8);
overlap = 5;
overlapcount = 0;
count = 0;
count2 = 1;
bilder = {'1.jpg', '2.jpg', '3.jpg', '4.jpg', '5.jpg','6.jpg',
'7.jpg', '8.jpg'};
gest = 9;

46
global state;
state = [1 0];
global EMGsum;
performance = [1000,2];
gestgammal = 0;
while t < T
ii = ii+1;
t2 = clock;
t(ii) = etime(t2,t_initial);
% FileID3 = fopen('Orientation.txt');
FileID5 = fopen('Emg.txt');
% Orientation = textscan(FileID3,'%s %s %s %s');
Emg = textscan(FileID5,'%s %s %s %s %s %s %s %s');
% fclose(FileID3);
fclose(FileID5);
[p1,q1] = size(a5);
[p2] = length(Emg{1});
if (p1 < p2);
% FileID3 = fopen('Orientation.txt');
FileID5 = fopen('Emg.txt');
[p5,q5] = size(a3);
[p7,q7] = size(a5);
% Orientation = textscan(FileID3,'%s %s %s
%s','HeaderLines',p5);
Emg = textscan(FileID5,'%s %s %s %s %s %s %s
%s','HeaderLines',p7);
% fclose(FileID3);
fclose(FileID5);
% for i = 1:length(Orientation{1});
% s = {Orientation{1,1}{i,1} Orientation{1,2}{i,1}
Orientation{1,3}{i,1}, Orientation{1,4}{i,1}};
% temp = strtok(s,'[ ]');
% a3(end+1,:) = str2double(temp);
%
% [roll, pitch, yaw] = quat2angle(a3(end,:));
% a3_e(end+1,:) = [roll pitch yaw];
%
% end
for i = 1:length(Emg{1});
s = {Emg{1,1}{i,1} Emg{1,2}{i,1} Emg{1,3}{i,1}
Emg{1,4}{i,1} Emg{1,5}{i,1} Emg{1,6}{i,1} Emg{1,7}{i,1}
Emg{1,8}{i,1}};
temp = strtok(s,'[ ]');
a5(end+1,:) = str2double(temp);
47
end
clc
count = count +1
% Sortera om exportvektorn som skall till classifier, räknar upp
hur många
% datapunkters overlap det är
for i = 1:length(export(:,1))-1;
export(i,:) = export(i+1,:);
export(end,:) = [a5(end,:)];
end
overlapcount = overlapcount + 1;
% Exportera till classifier vilket returnerar en rörelse
if overlapcount == overlap
overlapcount = 0;
count2 = count2 +1;
for i = 1:length(segment(:,1))-1;
segment(i) = segment(i+1);
end
segment(end) = Classifier(export(:,1:8), mode(segment));
% disp(segment);
end
% Classifiern har nu uppdaterat segment vektorn, mode funktionen är
en
% majority vote och säger vilken gest som skall outputas. Gesten
kan nu
% användas av state machine
gest = mode(segment)
% State_machine(gest);
% disp(state);
% ### avkometera detta stycka för att visa bild på class label i
realtid
if gest ~= gestgammal
gestgammal = gest
imshow(bilder{gest}, 'Border', 'tight');
end
% Välj mellan att spara ren class label eller state i performance
vektorn,
% att plottas mot EMGsum.
% performance(count,:) = [state(1) EMGsum];
performance(count,:) = [gest EMGsum];

48
% subplot(1,2,1);
% imshow(bilder{state(1)}, 'Border', 'tight');
% subplot(1,2,2);
% bar(state(2),'r');
% ylim([0 100]);
% drawnow;
% ####TRÄNING####
% Sparar en matris av mätdata som används till träning ~230sec
% [~,do] = max(EMGtarget2(count2,:))
% if mod(count2-1, 200) == 0
% imshow(bilder{do}, 'Border', 'tight');
% pause(1);
% end
%
% EMGtrain2(count2,:) = Trainer(export(:,1:8));
% ####VALIDERING####
% Sparar en matris av mätdata som används till validering ~100sec
% do = ACCtarget(count)
%
% if mod(count-1, 100) == 0
% imshow(bilder{do}, 'Border', 'tight');
% drawnow;
% pause(4);
% end
%
% ACCtrain(count,:) = gest;
%
% --------------------------------------------------------------
end
end
pyquit
disp('Done');
%%
% räkna ut accuracy
AccTester(ACCtrain, ACCtarget)
%%
% plotta EMG/class grafen
hold on
yyaxis left
plot(performance(:,2));

49
refline(0,20);
ylabel('EMG activity');
yyaxis right
plot(performance(:,1), '*');
ylabel('Class label');
function [output] = Classifier(segment, current)
%CLASSIFIER - Får ett segemtn från myo programmet och
klassifiserear det
% Segment vektorn delas upp i åtta signaler, en från varje
elektrod
% olika varianter:
% Mean Absolute value - meanabs();
% Root Mean Square - rms();
% Variance - var();
c1 = meanabs(segment(:,1));
c2 = meanabs(segment(:,2));
c3 = meanabs(segment(:,3));
c4 = meanabs(segment(:,4));
c5 = meanabs(segment(:,5));
c6 = meanabs(segment(:,6));
c7 = meanabs(segment(:,7));
c8 = meanabs(segment(:,8));
% seg = [c1 c2 c3 c4 c5 c6 c7 c8 mean(roll) mean(pitch)];
% seg = [c1 c2 c3 c4 c5 c6 c7 c8 mean(roll)];
seg = [c1 c2 c3 c4 c5 c6 c7 c8];
global EMGsum
EMGsum = sum(seg);
[value,gest] = max(NNviktor3(seg));
output = current;
if value > 0.95
output = gest;
end
function [seg] = Trainer(segment)
%Trainer - Får ett segemtn från myo programmet och gör det redo att
%användas till att träna nätverk
% Segment vektorn delas upp i åtta signaler, en från varje
elektrod
% olika varianter:
% Mean Absolute value - meanabs();
% Root Mean Square - rms();
% Variance - var();
c1 = meanabs(segment(:,1));
c2 = meanabs(segment(:,2));
c3 = meanabs(segment(:,3));
c4 = meanabs(segment(:,4));
c5 = meanabs(segment(:,5));

50
c6 = meanabs(segment(:,6));
c7 = meanabs(segment(:,7));
c8 = meanabs(segment(:,8));
% seg = [c1 c2 c3 c4 c5 c6 c7 c8 mean(roll) mean(pitch)];
% seg = [c1 c2 c3 c4 c5 c6 c7 c8 mean(roll)];
seg = [c1 c2 c3 c4 c5 c6 c7 c8];
function [] = State_machine(gest)
%STATE_MACHINE Summary of this function goes here
% Detailed explanation goes here
% maxvärdet på varje gests EMGsum, för normalisering
a = [1 300 200 300 200 200 300 200];
global state
global EMGsum
ramp = EMGsum/a(state(1));
ramp = ramp*5;
if ramp > 2;
disp('hårt grepp');
else
disp('svagt grepp');
end
if gest == 1
return;
end
if state(2) == 0 && gest ~= 3
state(1) = gest;
state(2) = 1;
return
end
if gest == state(1) && state(2) < 100
state(2) = state(2)+5;
if(state(2) > 100)
state(2) = 100;
end
return
end
if gest == 3 && state(2) >0
state(2) = state(2)-5;
if(state(2) <= 0)
state(2) = 0;
state(1) = 1;
end
return
end
end