Roburstness: Quantifying Robustness of the /t/—/k...
46
Roburstness: Quantifying Robustness of the /t/—/k/ Contrast in Children and Adults By: Allison A. Johnson A thesis prepared in partial fulfillment of the requirements for the degree of MASTER OF SCIENCE (Communication Sciences & Disorders) at the UNIVERSITY OF WISCONSIN-MADISON 2016
Transcript of Roburstness: Quantifying Robustness of the /t/—/k...

Roburstness: Quantifying Robustness of the /t/—/k/ Contrast in Children and Adults
By: Allison A. Johnson
A thesis prepared in partial fulfillment of the requirements for the degree of
MASTER OF SCIENCE
(Communication Sciences & Disorders)
at the
UNIVERSITY OF WISCONSIN-MADISON 2016
TABLE OF CONTENTS
ACKNOWLEDGEMENTS i
ABSTRACT ii
CHAPTER ONE
Introduction 1
CHAPTER TWO
Methods—Data Collection
2.1 Participants 11
2.2 Stimuli 12
2.3 Procedure 14
CHAPTER THREE
Methods—Data Analysis
3.1 Coding 16
3.2 Inter-rater reliability 19
3.3 Spectral analyses 19
3.4 Statistical analyses 21
CHAPTER FOUR
Results
4.1 Adults—Accuracy based on transcription 23
4.2 Adults—Differentiating /t/ and /k/ 23
4.3 Children—Accuracy based on transcription 25
4.4 Children—Differentiating /t/ and /k/ 26
CHAPTER FIVE
Discussion 32
REFERENCES 38
LIST OF TABLES
Table 2.1. Descriptive data for participants
Table 2.2. Maternal education data
Table 2.3. Stimuli: /t/- and /k/-initial words used in the experimental task
Table 4.1. Mean accuracy of the predictions made by Model 1 and Model 2 for adults
Table 4.2 Mean accuracy of the predictions made by Model 1 and Model 2 for children
LIST OF FIGURES
Figure 1.1. Effects of between-category distance and within-category dispersion on discriminability.
Figure 3.1. Stage 1 of coding.
Figure 3.2. Stages 2 and 3 of coding.
Figure 3.3. Stage 4 of coding.
Figure 4.1. Predicted accuracy by central measure, separated for tokens in front- and back-vowel contexts for adults.
Figure 4.2. Predicted accuracy by central measure, separated for tokens in front- and back-vowel contexts for children.
Figure 4.3. Results of Model 1: Predicting target consonant from Centroid measurements
Figure 4.4. Results of Model 2: Predicting target consonant from ERB measurements
Figure 4.5. Predicted accuracy by central measure, separated by vowel context and target consonant for children
i
ACKNOWLEDGEMENTS
It is well known that writing up a thesis is hard work, but it is less obvious how difficult writing the Acknowledgements can be. This work would not have been possible without the personal and professional support from many, many people.
First, I would like to thank my primary mentor and role model, Dr. Jan Edwards, for carrying the torch that guides me in my pursuit of becoming a scholar. Thank you for sharing your knowledge and expertise, while actively cultivating an environment in which I thrive. Your embodiment of academic and human excellence inspires my growth every single day.
Thank you to my committee members, Dr. Mario’s Fourakis and Dr. Gary Weismer for introducing me to the field of acoustic phonetics. Without your command of the literature, talents for imparting knowledge, insightful comments, and collaboration, the potential of this project would not have been realized. I would also like to acknowledge Dr. Mary Beckman and Dr. Benjamin Munson for engaging me in thoughtful discussions and challenging me to think about phonetics and phonological development from both basic and applied scientific perspectives. I was very fortunate to have two additional experts—my honorary committee members—in my corner throughout this process.
It takes a village to raise a researcher, and my village was the Learning to Talk lab. I sincerely appreciate the hundreds of children and their families who participated in our studies; the score of examiners, segmenters, transcribers, and taggers who helped collect data; Patrick Reidy, an indispensable leader on the data analysis team who spent countless hours explaining various statistical and spectral analysis techniques; and our lab administrative team, especially Nancy B. Wermuth for controlling the chaos and coordinating our 3-year adventure while providing a bottomless supply of coffee and snacks to keep the midnight oil burning.
I will be forever grateful for all of the professors and staff in the UW-Madison Communication Sciences and Disorders department who invested time, energy and resources into my education over the past six years. I am especially thankful for Dr. Rita Kaushanskaya for introducing me to the field and inspiring me to become a researcher. Dr. John Westbury also deserves a special Shoutout for introducing me to speech science, donating his library of speech sciences books to me, setting his academic expectations painfully high, and reminding me that education is a life-long endeavor.
Finally, my most heartfelt thank you goes to Jake Cox and my family, Ron and Laurie Johnson, Michael and Jennifer Kilkenny, Tom and Laura Johnson, and the entire Larsen Clan for showing me unconditional love and support. You encouraged me to dream big, and taught me how to achieve goals through patience, hard work, and dedication. Thank you for reminding me that education is earned, not received. I would not be where I am today without your unwavering confidence, and so I dedicate this thesis to you.
This research was financially supported by NIDCD R01 02932 to Jan Edwards, Mary E.
Beckman, and Benjamin Munson, by NICHD P30 HD03352 grant to the Waisman Center, and by T32 Training Grant DC05359-10 “Interdisciplinary Research Training in Speech- Language Disorders” to Susan Ellis Weismer.

ii
ABSTRACT
Children develop speech gradually throughout childhood, and they continue to refine
articulatory movements and phonological productions even after they have acquired a sound or
sound contrast. In research and clinical practice, speech is most often characterized using coarse-
grained transcription methods; however, broad phonemic classifications or simple judgments of
correct/incorrect fail to capture variations in productions. Measureable sub-phonemic differences
in children’s speech, such as covert contrasts, undifferentiated lingual gestures, or intermediate
productions, are difficult to classify using only transcription, but they have been quantified using
fine-grained acoustic or perceptual measures. These subtle differences have important clinical
implications in diagnosis of speech sound disorders, developing focused treatment approaches,
and determining prognosis for therapy.
Many studies in phonetics have searched for acoustic correlates to characterize speech
sounds or phonetic dimensions. The present study directly compared two gradient-scale, central
measures—an acoustic measure (Centroid) and a psychoacoustic measure (Peak ERB)—in their
utility for quantifying robustness of the /t/—k/ contrast in adults (n = 21) and 2-3-year-old
children (n = 163). For adults, both measures were highly successful in differentiating /t/ and /k/,
but Centroid was significantly better than Peak ERB for classifying productions in back-vowel
contexts. Similar results were found for the children. There was also an interaction effect of
target consonant in front-vowel contexts: Centroid better differentiated /t/ and /k/ when the target
consonant was /t/, but Peak ERB better differentiated /t/ and /k/ when the target consonant was
/k/.
Overall, children showed a less robust contrast compared to adults, even for productions
transcribed as correct. These findings provide further evidence that children acquire speech
gradually and continue to refine productions even after sounds are considered acquired. For
children’s productions that were transcribed as correct, the wide range in robustness of contrast
highlights the importance of supplementing transcription with fine-grained measurements to
capture developmentally relevant sub-phonemic differences in children’s speech. Limitations of
the study and future directions are discussed.

1
CHAPTER ONE Introduction
Phonological development is a gradual process, beginning in the first year of life and
continuing throughout childhood. During the course of development, acquisition and mastery of
speech sounds vary both among children (i.e., some children produce sounds earlier than others)
and across sounds (i.e., certain sounds are typically mastered before others). During puberty,
children develop finer neuromuscular control, and the lower face, jaw, tongue, and lips grow
closer to adult-like proportions, contributing to systematically more adult-like speech
productions (Kent, 1976; McLeod & Bleile, 2003; Cheng et al., 2007). Even though young
children’s productions are not completely adult-like, according to normative data for English-
speaking children, most speech sounds are mastered (produced accurately >95% of the time)
before age nine, and the majority are acquired (produced accurately >90% of the time) by age
five (Smit et al., 1990).
Some children develop speech more slowly than others. These children may have sufficient
delays or deviations compared to age-related standards to be considered speech sound disorders
(SSDs). SSD is a broad term encompassing impairments in perception, production, and/or
phonological representations of speech sounds that impact speech intelligibility (e.g., Bernthal,
Bankson, & Flipsen Jr., 2013). SSDs can be motor-, structural-, or sensory-based in etiology,
arising from known medical conditions or syndromes (e.g., apraxia, dysarthria, cleft palate,
hearing impairment, auditory processing disorder). In a majority of cases, however, impairments
are functional in etiology, arising from unknown causes (National Institute on Deafness and
Other Communication Disorders [NIDCD], 2010; NIDCD, 2006; Gierut, 1998). Speech-
language pathologists (SLPs), especially those based in school settings, report that children with

2
speech impairments constitute a major portion of their clinical caseloads (Gierut, 1998; Joffe &
Pring, 2008). Prevalence estimates of speech delay in children range from 2-25%, though most
estimates hover around 5-10% (Law, Boyle, Harris, Harkness, & Nye, 2000). Children with
SSDs are at heightened risk for reading and writing difficulties, and persistent reduced speech
intelligibility interferes with an individual’s social relationships, academic achievement, and
vocational security (McCormack, Harrison, McLeod, & McAllister, 2009).
Reliable identification of SSDs is a critical first step in alleviating the long-term
consequences of reduced speech intelligibility. Decisions about articulation accuracy and the
presence (or absence) of SSDs are generally made using transcription, both clinically and in
research studies (e.g., Smit et al., 1990). An auditory-perceptual judgment of ‘correct’ or
‘incorrect’ is made by a trained listener about the speaker’s productions. Children are diagnosed
with SSDs if they produce a significantly greater number of consonants incorrectly than peers of
the same age and sex in a connected speech sample and on standardized, norm-referenced
assessments of articulation, which typically include single-word productions. During therapy,
clinicians also employ judgments of “correct” and “incorrect” to evaluate a child’s productions,
and once a designated criterion is met (e.g., 9/10 productions transcribed as ‘correct’ in multiple
phonological contexts), the child is said to have acquired that phoneme.
Although transcription provides a relatively quick and ecologically valid method for
describing children’s productions, there are critical shortcomings to these binary, categorical,
perceptual judgments. Children’s developing productions do not proceed categorically from one
sound to another; rather, speech sounds are progressively refined as articulatory movements
become more practiced and precise over time (Edwards, Gibbon, & Fourakis, 1997; Hewlett &
Waters, 2004; Scobbie, Gibbon, Hardcastle, & Fletcher, 2000). The transcription system imposes
3
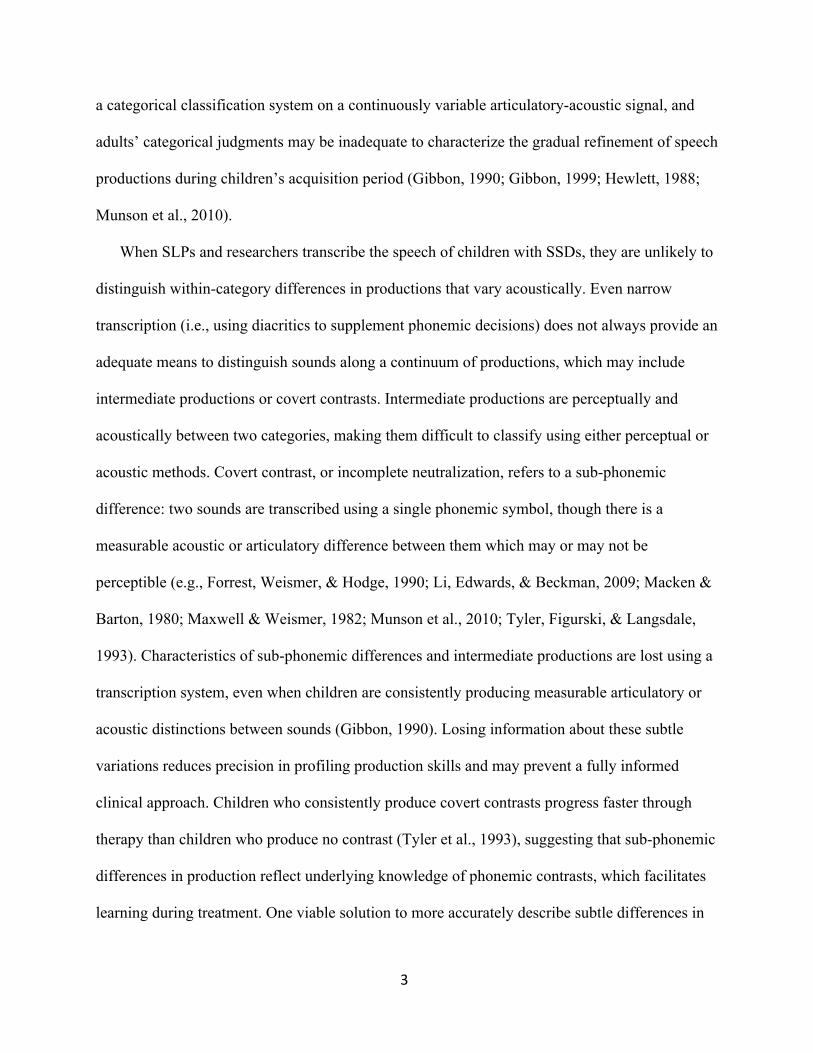
a categorical classification system on a continuously variable articulatory-acoustic signal, and
adults’ categorical judgments may be inadequate to characterize the gradual refinement of speech
productions during children’s acquisition period (Gibbon, 1990; Gibbon, 1999; Hewlett, 1988;
Munson et al., 2010).
When SLPs and researchers transcribe the speech of children with SSDs, they are unlikely to
distinguish within-category differences in productions that vary acoustically. Even narrow
transcription (i.e., using diacritics to supplement phonemic decisions) does not always provide an
adequate means to distinguish sounds along a continuum of productions, which may include
intermediate productions or covert contrasts. Intermediate productions are perceptually and
acoustically between two categories, making them difficult to classify using either perceptual or
acoustic methods. Covert contrast, or incomplete neutralization, refers to a sub-phonemic
difference: two sounds are transcribed using a single phonemic symbol, though there is a
measurable acoustic or articulatory difference between them which may or may not be
perceptible (e.g., Forrest, Weismer, & Hodge, 1990; Li, Edwards, & Beckman, 2009; Macken &
Barton, 1980; Maxwell & Weismer, 1982; Munson et al., 2010; Tyler, Figurski, & Langsdale,
1993). Characteristics of sub-phonemic differences and intermediate productions are lost using a
transcription system, even when children are consistently producing measurable articulatory or
acoustic distinctions between sounds (Gibbon, 1990). Losing information about these subtle
variations reduces precision in profiling production skills and may prevent a fully informed
clinical approach. Children who consistently produce covert contrasts progress faster through
therapy than children who produce no contrast (Tyler et al., 1993), suggesting that sub-phonemic
differences in production reflect underlying knowledge of phonemic contrasts, which facilitates
learning during treatment. One viable solution to more accurately describe subtle differences in
4
children’s productions would be to use a gradient acoustic measure in conjunction with
subjective impressions of speech sounds.
The present study will focus on the place-of-articulation contrast for stop consonants /t/
and /k/. This contrast is produced relatively early in the typical sequence of phonological
development, and these sounds have a significant affect on intelligibility due to their high
frequency in English. According to normative data for speech sound acquisition (using a 90%
criterion), word-initial /t/ is acquired by age three, and word-initial /k/ by age four (Smit et al.,
1990). These norms are clinically relevant as they constitute the recommend ages by which
children should have mastered these sounds. If children are delayed, assessment and intervention
may be warranted.
Many young, typically-developing children exhibit the phonological process of velar
fronting (substituting [t] for /k/, as in “tup” for cup), but persistent velar fronting may be
indicative of a speech delay or disorder. Unfortunately, there is little agreement in the consonant
acquisition literature regarding the exact age of mastery for each speech sound. These variations
in reported ages are due to differences in samples (e.g., age range of children; exclusion criteria
of participants), criterion for determining acquisition (e.g., 75%, 90%, or 100% accuracy may
constitute acquisition), and/or methods of collecting speech data (e.g., sounds in spontaneous
speech or imitation; sounds in isolation or connected speech). Another reason there are
differences is that normative studies in the consonant acquisition literature rely solely on
transcription of consonants as correct or incorrect
Data based on coarse-grained transcription methods may be unsuitable for describing
subtle differences in children’s productions while they are refining articulation abilities. For
example, Todd, Edwards, and Litovsky (2011) found that even when /s/ and /ʃ/ productions from
5
children with cochlear implants were transcribed as “correct,” fine-grained analyses showed
significantly decreased spectral contrasts compared to correct productions by peers with normal
hearing. Furthermore, these acoustic differences had perceptual consequences: /s/- and /ʃ/-initial
words produced by children with cochlear implants were found to be less intelligible than the
same words produced by peers with normal hearing (Kristensen, 2015). Nicholson, Munson,
Reidy, and Edwards (2015) showed that the contrast between correct /s/ and /ʃ/ productions
increased with age when fine-grained measures were used. Reidy (2015) found that spectral
analysis of the /s/—/ʃ/ contrast in English-speaking adults and typically developing 2- to 5-year-
old children revealed differences in anticipatory coarticulation in consonant-vowel sequences
between young children and adults, even for productions that were transcribed as correct.
Hewlett (1988) showed varying levels of coarticulation and differentiation of /t/ and /k/
productions between adults, children with typical development, and a child with phonological
disorder when fine-grained measures were used, even for productions that had been transcribed
as correct. Nittrouer (1995) found that 7-year-old children whose transcribed productions showed
a clear contrast between /s/ and /ʃ/, spectral analyses revealed that their productions were less
differentiated than adults’ productions. However, these children produced /t/ and /k/ with spectral
contrasts similar to the adults, highlighting the fact that some contrasts are developed earlier than
others, and that children produce less robust contrasts initially after a contrast is considered
acquired based on transcription.
Much of this work on the gradual acquisition of speech sounds has focused on the
English /s/— /ʃ/ contrast. This contrast has been conducive to this research for two reasons: it is a
relatively late-acquired contrast, and it can be well-differentiated by a single acoustic or
psychoacoustic parameter (e.g., centroid) The focus of this study is on the acquisition of the
6
/t/—/k/ contrast. This contrast is of interest because it is acquired earlier, so it may be of more
diagnostic importance. However, the /t/—/k/ contrast is also more difficult to differentiate with a
single acoustic parameter, particularly in certain phonological contexts. The dorsal stop /k/ may
be fronted before front vowel contexts, a process called velar softening or velar palatalization
(Guion, 1998; Stevens, 1998). Children with and without phonological disorders also show
varying degrees of coarticulation of /k/ before front vowels, making differentiation of /t/ and /k/
in front-vowel contexts more difficult (e.g., Hewlett, 1988). Using spectral analyses and
individual regression analyses to quantify the /t/—/k/ contrast in 2-3-year-old children, it may be
possible to detect subtle differences in speech productions occurring during the typical course of
development, even before a sound is considered “acquired” based on traditional, coarse-grained
transcription.
Acoustic information in the release burst (specifically, the frequency spectrum) varies as
a function of place of articulation (e.g., Harrington, 2013; Stevens, 1998). Specifically, the size
and shape of the vocal tract in front of the constriction contributes to spectral information in the
sound produced (Jongman, Wayland, & Wong, 2000). Alveolar stop consonants have a relatively
short vocal tract length in front of the constriction, resulting in burst frequencies ranging from
approximately 2,500 - 4,000 Hz. Comparatively, velar stops have a longer vocal tract length,
resulting in lower burst frequencies, ranging from about 1,500 - 2,500 Hz (Reetz & Jongman,
2008; Stevens, 1998). Phonological context also affects spectral information in the consonant
produced, especially for /k/, which coarticulates extensively with the following vowel (i.e., if the
following vowel is a front vowel, burst frequencies will be higher than if the following vowel is a
back vowel) (Guion, 1998; Stevens, 2000).
7
For decades, researchers in phonetics have searched for invariant acoustic correlates to
characterize individual speech sounds or phonetic dimensions, such as place- or manner-of-
articulation. One type of parameterization that has been largely successful in differentiating
place-of-articulation in stop consonants and sibilant fricatives is spectral moments analyses
(Forrest et al., 1988; Harrington, 2013; Jongman et al., 2000). Spectral moments are derived
from statistical moments: each spectrum is treated as a random probability distribution from
which mean, variance, skewness, and kurtosis (the first four spectral moments) can be computed.
These moments capture information about local and global characteristics of the spectrum,
including overall concentration, range, tilt, and peakedness of the energy distribution.
The first spectral moment, spectral mean or Centroid frequency, represents the frequency
at which energy in the spectrum is primarily concentrated, or the average concentration of
energy. As an obstruction in the vocal tract moves forward, the centroid frequency is expected to
increase. Spectral variance (or spectral standard deviation if the square root is taken) represents
the range in energy concentration, or how energy is distributed across frequencies. Some speech
sounds, such as /b/ and /d/ have relatively diffuse spectra, which could be differentiated by the
second spectral moment. However, studies such as Forrest et al., (1988) showed that the second
moment did not add to the discriminability of stop consonants, and it has largely been excluded
from spectral moments analyses of voiceless stop consonants since, though see Nissen and Fox
(2009) for counterexample. Skewness, the third spectral moment, measures asymmetry in energy
distribution of the spectrum, or the spectral tilt. If energy is concentrated in the lower
frequencies, the spectrum will have a negative tilt and positive skewness. The fourth spectral
moment is kurtosis. Positive kurtosis occurs when energy in the spectrum is concentrated in a
peak, whereas negative kurtosis reflects a relatively flat distribution.
8
There has been much research using spectral moments to distinguish sibilant fricatives
(e.g., Forrest et al., 1988; Hazan & Baker, 2011; Holliday, Reidy, Beckman, & Edwards, (2015);
Li et al., 2009; Maniwa & Jongman, 2009; Nissen & Fox, 2005; Shadle & Mair, 1996). Many
research studies have also used spectral moments to characterize place-of-articulation for
voiceless stops in adults and children (e.g., Forrest et al., 1988; Forrest et al., 1990; Marin,
Pouplier, & Harrington, 2010; Nissen & Fox, 2009; Strömbergsson, Saliv, & House, 2015). This
research consistently shows relatively high classification accuracy based on spectral moments,
especially the first moment, Centroid frequency.
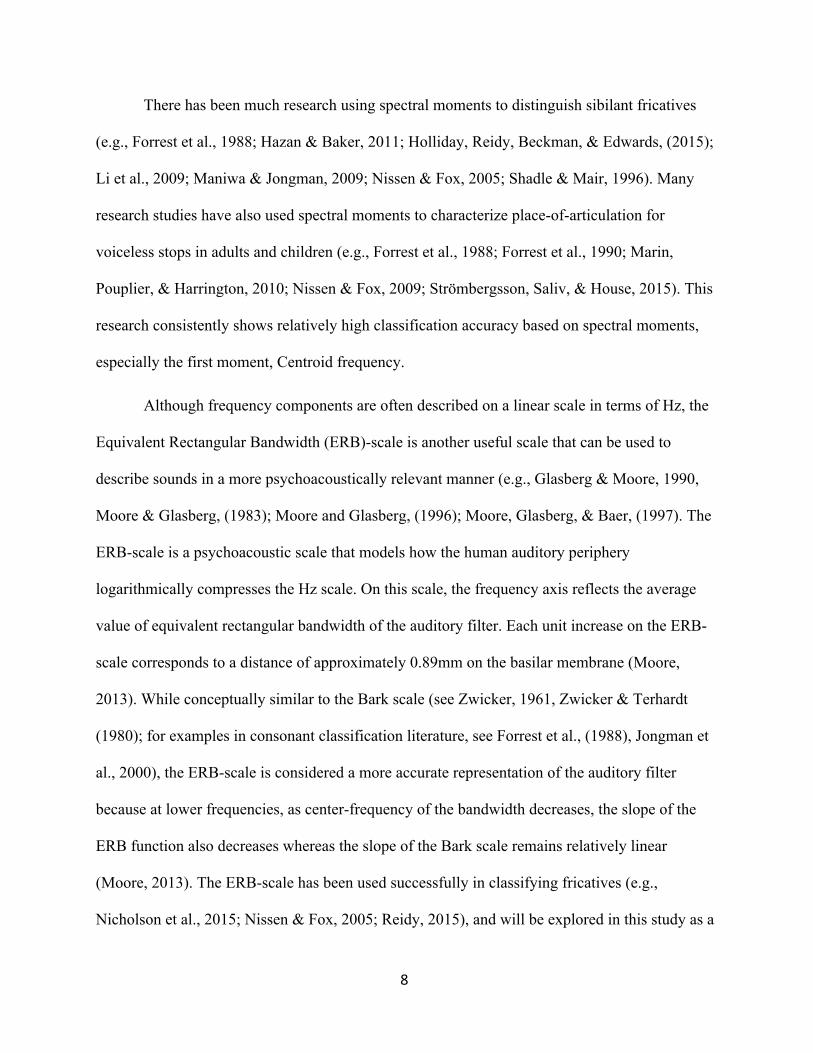
Although frequency components are often described on a linear scale in terms of Hz, the
Equivalent Rectangular Bandwidth (ERB)-scale is another useful scale that can be used to
describe sounds in a more psychoacoustically relevant manner (e.g., Glasberg & Moore, 1990,
Moore & Glasberg, (1983); Moore and Glasberg, (1996); Moore, Glasberg, & Baer, (1997). The
ERB-scale is a psychoacoustic scale that models how the human auditory periphery
logarithmically compresses the Hz scale. On this scale, the frequency axis reflects the average
value of equivalent rectangular bandwidth of the auditory filter. Each unit increase on the ERB-
scale corresponds to a distance of approximately 0.89mm on the basilar membrane (Moore,
2013). While conceptually similar to the Bark scale (see Zwicker, 1961, Zwicker & Terhardt
(1980); for examples in consonant classification literature, see Forrest et al., (1988), Jongman et
al., 2000), the ERB-scale is considered a more accurate representation of the auditory filter
because at lower frequencies, as center-frequency of the bandwidth decreases, the slope of the
ERB function also decreases whereas the slope of the Bark scale remains relatively linear
(Moore, 2013). The ERB-scale has been used successfully in classifying fricatives (e.g.,
Nicholson et al., 2015; Nissen & Fox, 2005; Reidy, 2015), and will be explored in this study as a

9
potential alternative to the linear Hz-scale that may better correspond to the representation of
frequency within the auditory periphery.
One agreed-upon issue with using acoustic measures to characterize the gradual acquisition
of a contrast is that there are no meaningful absolute values. Therefore, it is necessary to develop
way to quantify the acoustic (or psychoacoustic) differences between the two sounds in a
contrast at the individual speaker level, rather than classifying single sounds or dimensions.
Holliday and colleagues (2014) explored several measures to quantify robustness of contrast and
describe differences within and across /s/ and /ʃ/ productions that were transcribed as correct in
both children (2-5-years old) and adults. Four components were explored to quantify Robustness
of Contrast in /s/ and /ʃ/ productions based on Centroid frequency measurements: 1) within-
category dispersion (average standard deviation in Centroid frequencies for each sound-
category); 2) between category distance (difference between the mean Centroid frequencies of
each category); 3) discriminability (between-category distance divided by the square root of the
mean Centroid frequency variances for each category); and 4) percentage of tokens correctly
classified by an individual regression slope, calculated from logistic regressions for each speaker
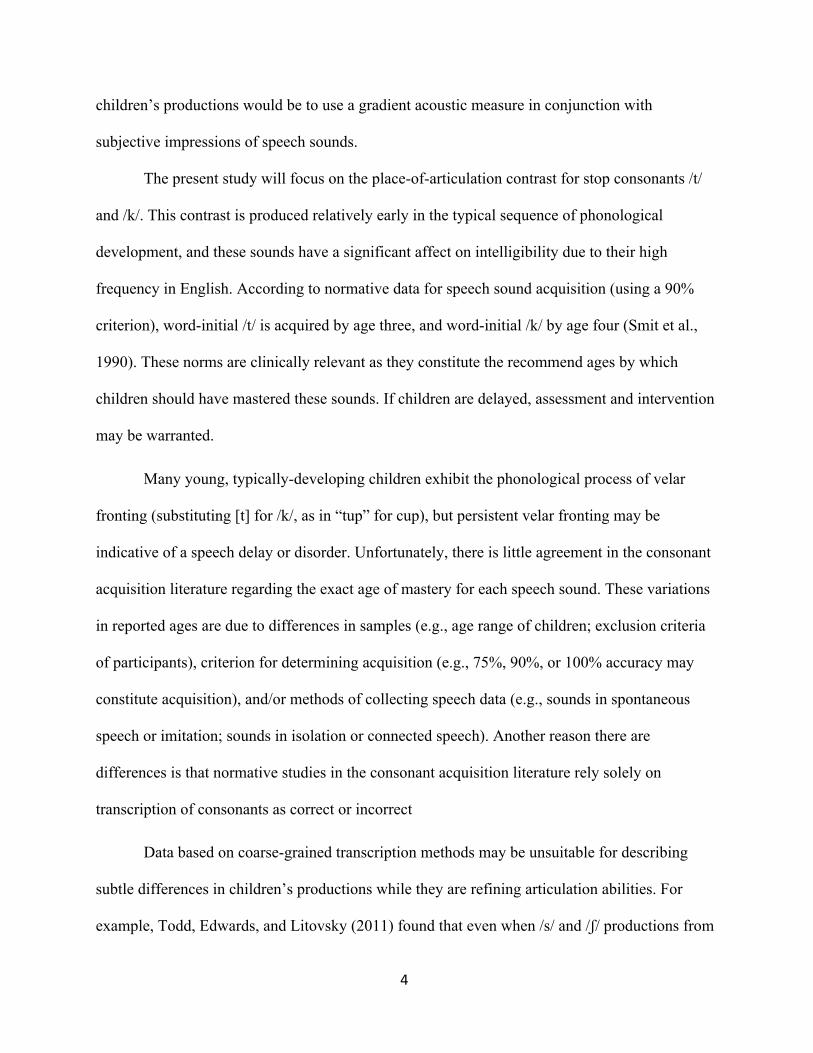
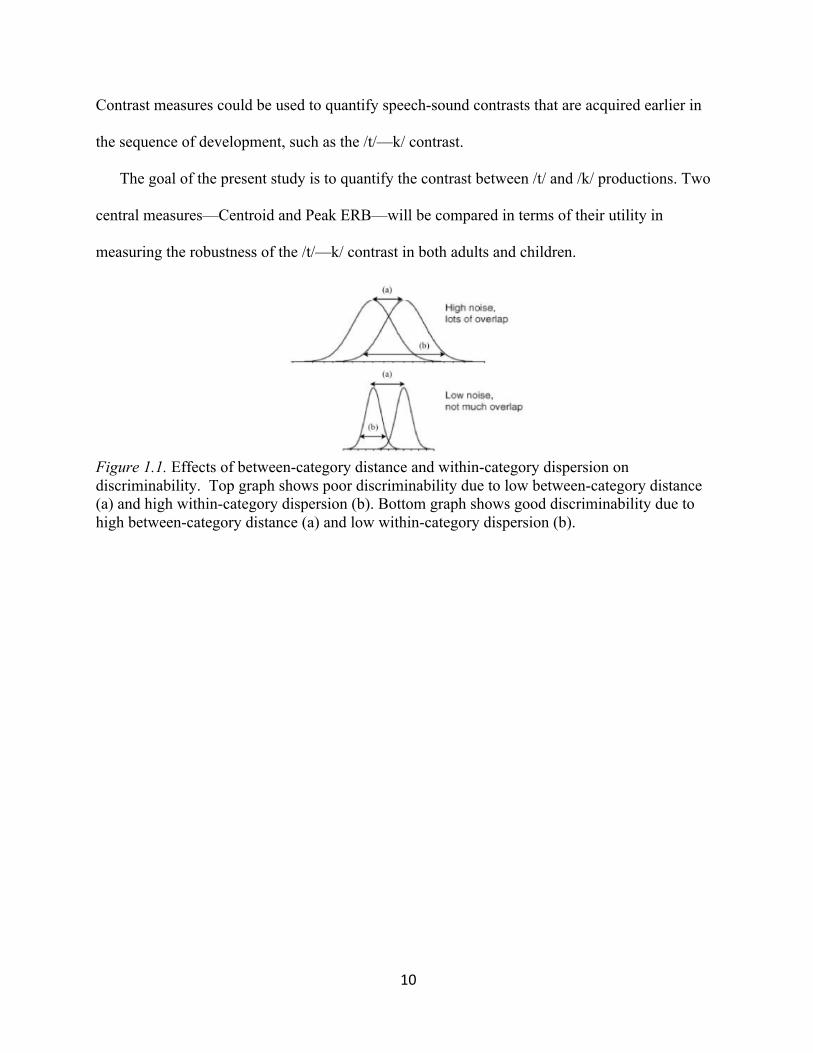
(hereafter, %CP). Figure 1 shows how discriminability is affected by both between-category
distance and within-category dispersion. The authors found that all four contrast measures were
significantly correlated with age, and %CP, between-category distance, and discriminability
were also correlated with receptive vocabulary. Among the four robustness measures, the authors
found that %CP had the strongest correlation with naive listeners’ ratings of perceived goodness.
These results supported an earlier finding by Hazan and Baker (2011) which showed that cross-
category distance and within-category dispersion was not well-correlated with fine-grained
measures of speech perception. Further research is needed to explore how Robustness of
10
Contrast measures could be used to quantify speech-sound contrasts that are acquired earlier in
the sequence of development, such as the /t/—k/ contrast.
The goal of the present study is to quantify the contrast between /t/ and /k/ productions. Two
central measures—Centroid and Peak ERB—will be compared in terms of their utility in
measuring the robustness of the /t/—k/ contrast in both adults and children.
Figure 1.1. Effects of between-category distance and within-category dispersion on discriminability. Top graph shows poor discriminability due to low between-category distance (a) and high within-category dispersion (b). Bottom graph shows good discriminability due to high between-category distance (a) and low within-category dispersion (b).
11
CHAPTER TWO Methods—Data Collection
2.1 Participants
Participants were recruited from greater Madison, WI and Minneapolis, MN communities
through flyers, brochures, public events, and word of mouth. Adult participants included 10
females and 11 males (mean age: 20 years; range: 20-29 years). Child participants included 163
children (81 males and 82 females) who were part of a larger longitudinal project1. Thirteen of
the children spoke African American English (AAE) as their native dialect (6 males and 7
females), and 150 children spoke Mainstream American English (MAE). Dialect status was
inferred during the initial phone interview with the family and confirmed by an AAE-speaking
examiner during the child’s first visit to the lab. All participants were monolingual, native
speakers of English with normal hearing and typical development. Parents reported no
remarkable medical histories or enrollment in speech or language services. Descriptive statistics
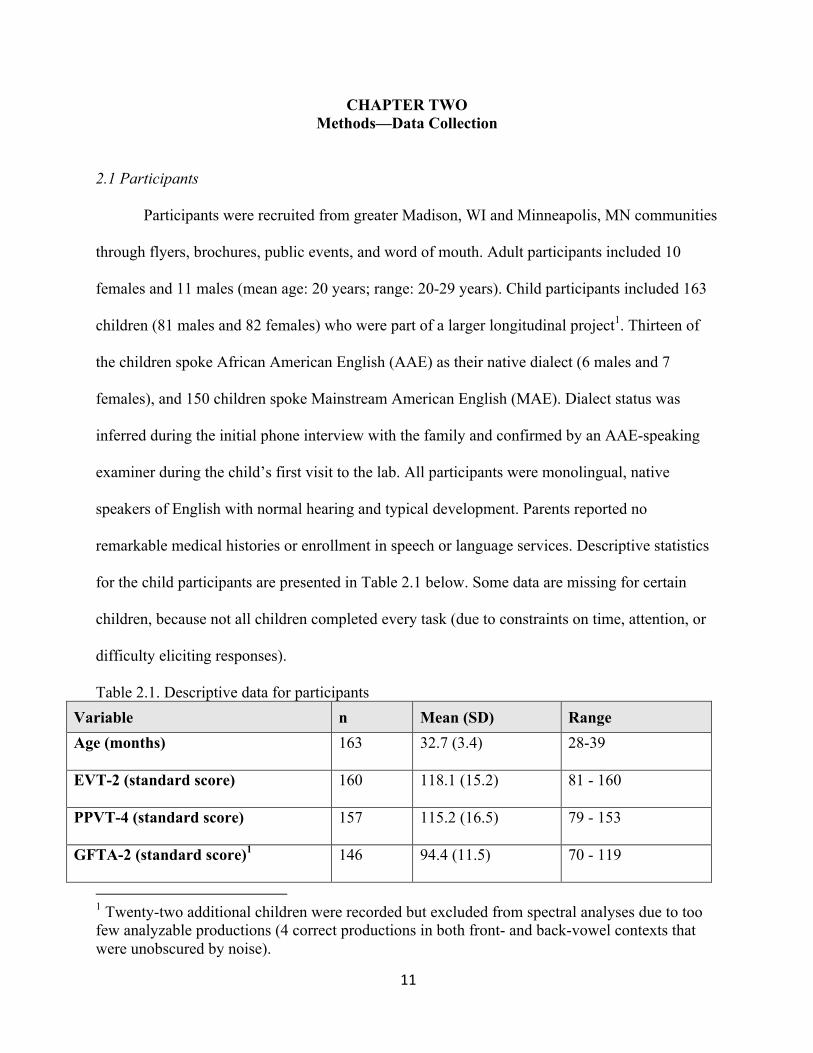
for the child participants are presented in Table 2.1 below. Some data are missing for certain
children, because not all children completed every task (due to constraints on time, attention, or
difficulty eliciting responses).
Table 2.1. Descriptive data for participants Variable n Mean (SD) Range Age (months) 163 32.7 (3.4) 28-39
EVT-2 (standard score) 160 118.1 (15.2) 81 - 160
PPVT-4 (standard score) 157 115.2 (16.5) 79 - 153
GFTA-2 (standard score)1 146 94.4 (11.5) 70 - 119
1 Twenty-two additional children were recorded but excluded from spectral analyses due to too few analyzable productions (4 correct productions in both front- and back-vowel contexts that were unobscured by noise).
12
1For 71 of 146 participants, fewer than the total number of targets (77) could be transcribed because 1) the child did not produce all of the words; 2) there was background noise during a production; or 3) the experimenter spoke over the child. In these cases, the raw score was adjusted for the number of consonants/consonant clusters produced relative to the maximum number, and the standard score was calculated based on this adjusted raw score. The average number of words that could be transcribed overall was 76, only 5 children had fewer than 70 transcribable productions, and the lowest number of transcribable words in the sample was 62.
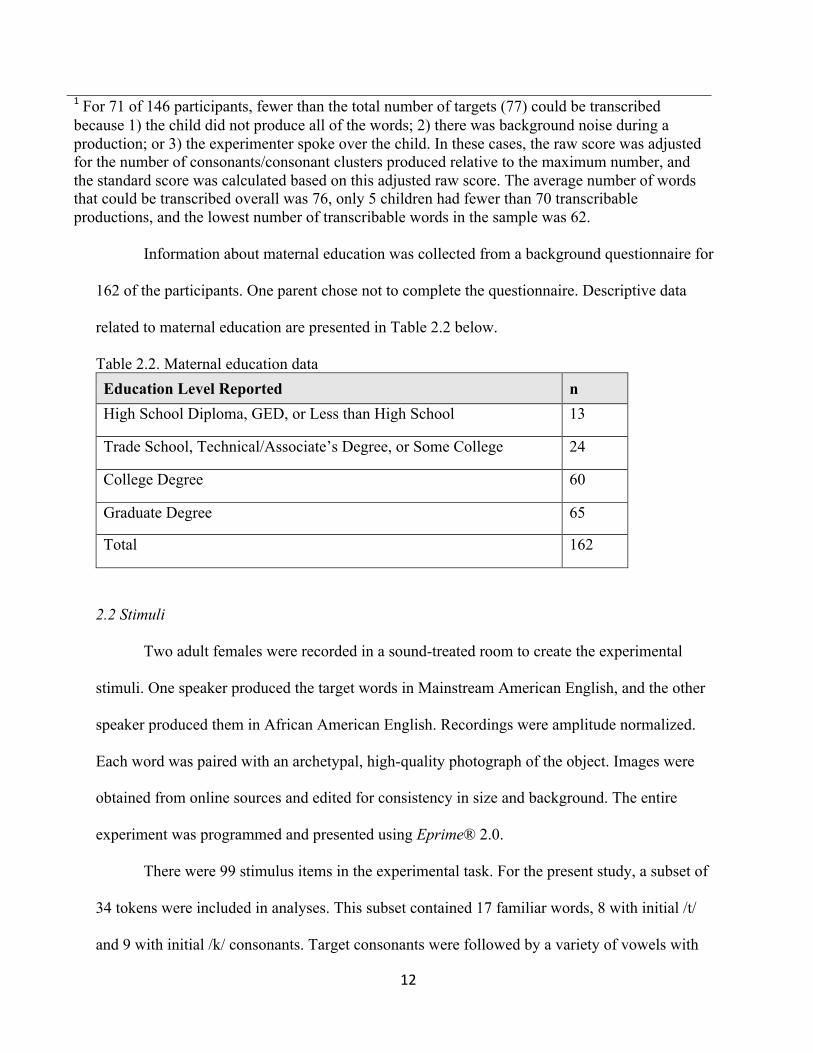
Information about maternal education was collected from a background questionnaire for
162 of the participants. One parent chose not to complete the questionnaire. Descriptive data
related to maternal education are presented in Table 2.2 below.
Table 2.2. Maternal education data Education Level Reported n High School Diploma, GED, or Less than High School 13
Trade School, Technical/Associate’s Degree, or Some College 24
College Degree 60
Graduate Degree 65
Total 162
2.2 Stimuli
Two adult females were recorded in a sound-treated room to create the experimental
stimuli. One speaker produced the target words in Mainstream American English, and the other
speaker produced them in African American English. Recordings were amplitude normalized.
Each word was paired with an archetypal, high-quality photograph of the object. Images were
obtained from online sources and edited for consistency in size and background. The entire
experiment was programmed and presented using Eprime® 2.0.
There were 99 stimulus items in the experimental task. For the present study, a subset of
34 tokens were included in analyses. This subset contained 17 familiar words, 8 with initial /t/
and 9 with initial /k/ consonants. Target consonants were followed by a variety of vowels with
13
relatively even distribution across front- and back-vowel contexts. Each word was repeated once
in order to obtain a reasonably large number of productions (n = 34) per child. Each repetition
was paired with a novel image and a new auditory prompt to keep the task engaging. Words were
selected if 1) they could be represented by an image, and 2) if at least 80% of 30-month old
children understand and produce them (according to normative data from the MacArther-Bates
Communicative Development Inventory (CDI; Fenson et al., 1993)). The /t/- and /k/-initial words
included in the final corpus are presented below in Table 2.3.
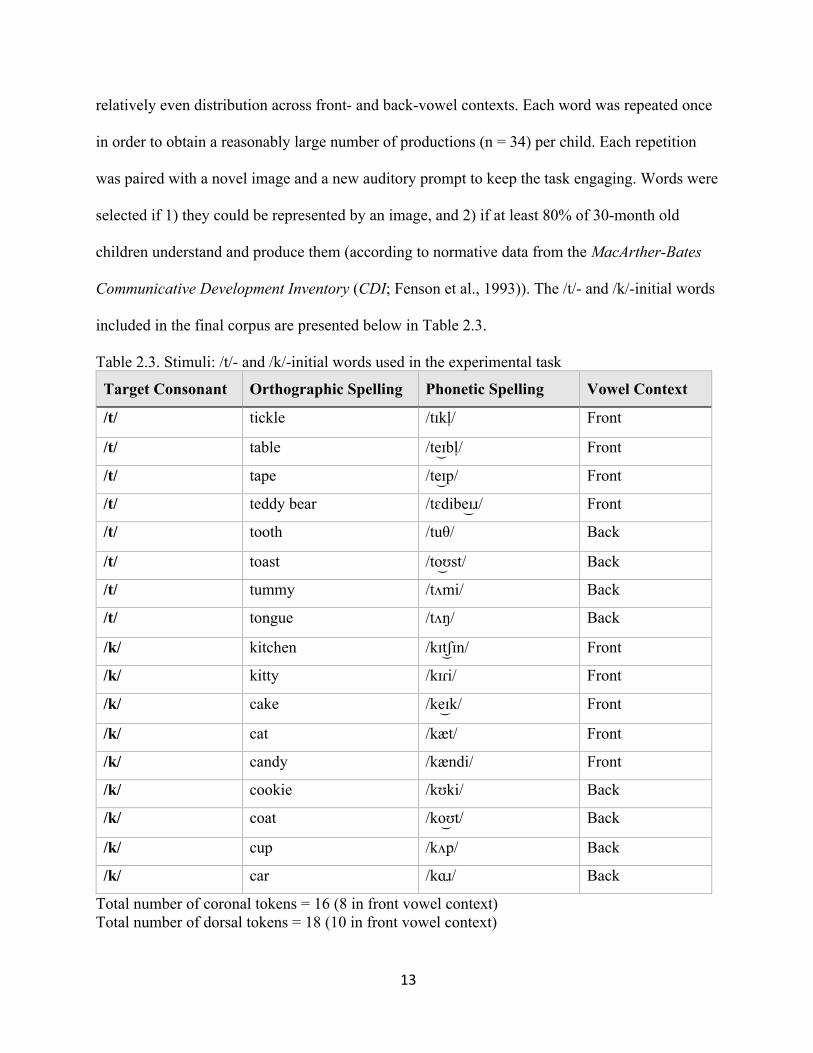
Table 2.3. Stimuli: /t/- and /k/-initial words used in the experimental task
Target Consonant Orthographic Spelling Phonetic Spelling Vowel Context
/t/ tickle /tɪkl̩/ Front
/t/ table /te͜ɪbl̩/ Front
/t/ tape /te͜ɪp/ Front
/t/ teddy bear /tɛdibe͜ɪɹ/ Front
/t/ tooth /tuθ/ Back
/t/ toast /to͜ʊst/ Back
/t/ tummy /tʌmi/ Back
/t/ tongue /tʌŋ/ Back
/k/ kitchen /kɪt͜ ʃɪn/ Front
/k/ kitty /kɪɾi/ Front
/k/ cake /ke͜ɪk/ Front
/k/ cat /kæt/ Front
/k/ candy /kændi/ Front
/k/ cookie /kʊki/ Back
/k/ coat /ko͜ʊt/ Back
/k/ cup /kʌp/ Back
/k/ car /kɑɹ/ Back
Total number of coronal tokens = 16 (8 in front vowel context) Total number of dorsal tokens = 18 (10 in front vowel context)
14
2.3 Procedure
Children participated in a sound-treated lab setting with support from two or three
trained research assistants at either the University of Wisconsin-Madison or the University of
Minnesota-Twin Cities. Most children completed all experimental tasks within three, 2-hour
visits, but some children needed one or two additional sessions to complete all tasks. Families
were compensated monetarily for their participation at the end of each session. During their
visits to the lab, children received a hearing screening and engaged in several other experimental
tasks related to the larger longitudinal project. A visual schedule was used to keep the child on
track and communicate progress throughout the visit. The child earned stickers for each
completed task, a toy prize at the end of each session, and a book for completion of the study at
each year. All experiments and standardized tests were presented in the child’s native dialect.
During the experimental task, children sat in front of a computer screen, positioned
approximately 4-6 inches away from a Shure SM81 cardioid condenser microphone with a
custom pop filter. The microphone’s built-in 18 dB/octave roll-off high-pass filter was used to
reduce background noise below 60 Hz. Stimuli were presented auditorily through a speaker
system and visually on the computer screen in a pseudo-randomized order across participants,
with steps taken to ensure target words were not repeated on consecutive trials. Children
repeated the words into the microphone, and an experimenter recorded the productions using a
Marantz PMD671 solid-state recorder at a sampling frequency of 44,100 Hz. Digital recordings
were saved for later analyses.
Four training trials preceded the experiment to familiarize the children with the task and
behavioral expectations, as well as to attain appropriate recording levels. Training trials could be
repeated as many times as necessary to satisfy these conditions. During the experimental phase,
15
stimuli could be repeated up to three times if necessary to elicit an analyzable production.
Repetitions were allowed if there was noise obscuring stimulus presentation, the child
misidentified the target, or the child became distracted. Children usually produced the target
word immediately following presentation of the stimulus, but sometimes additional prompting
from the examiner was needed to elicit a response (e.g., “What did the computer say?” or “Now
you say ‘kitty!’”). Examiners also prompted the child to repeat a production if the child
whispered or shouted, or if there was noise obscuring the response (e.g., child touched the
microphone, tapped the table, kicked the chair). Progress was communicated to the child
throughout the task visually via an animal avatar of the child’s choice: every few productions,
the avatar ascended one rung of a ladder pictured on the side of the screen, and the task was
complete when the avatar reached the top.
16
CHAPTER THREE Methods—Data Analysis
3.1 Coding
Each participant’s recording was coded using Praat®. Coding occurred in a multi-stage
process. First, trained research assistants listened to the audio recordings and marked the
boundaries for each target word. They also noted the context of the participant’s response (i.e.,
whether the production was in direct response to the computer stimulus, or whether the examiner
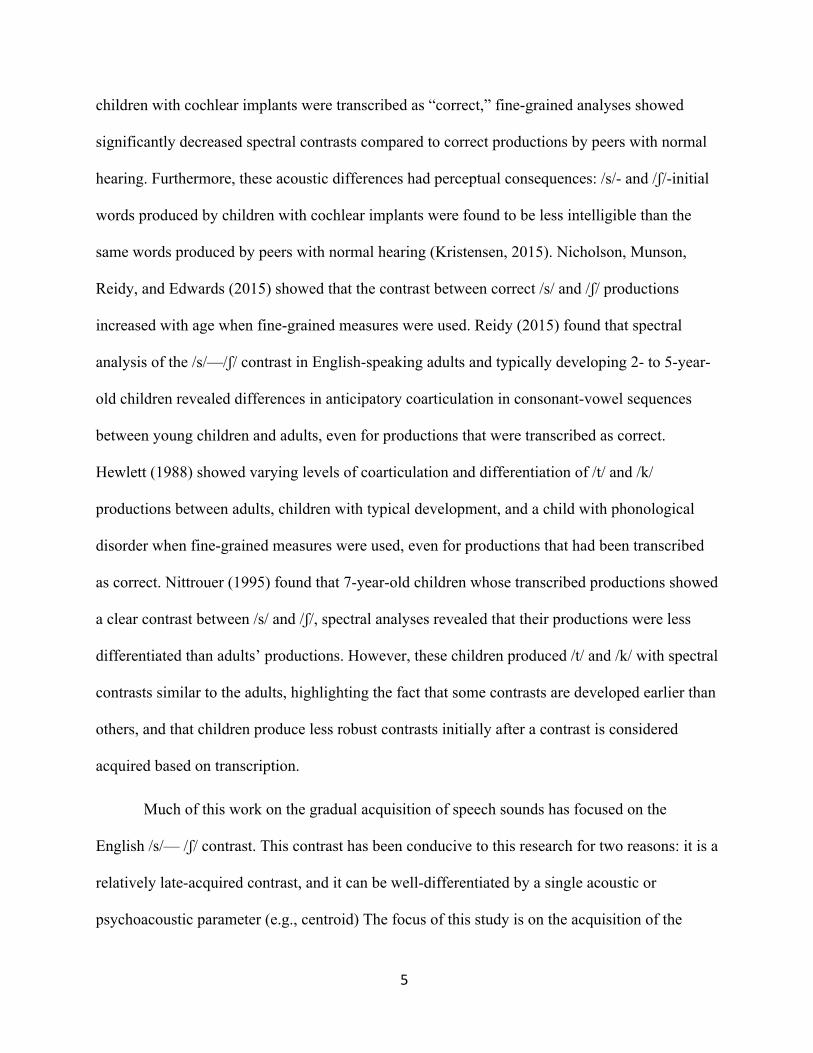
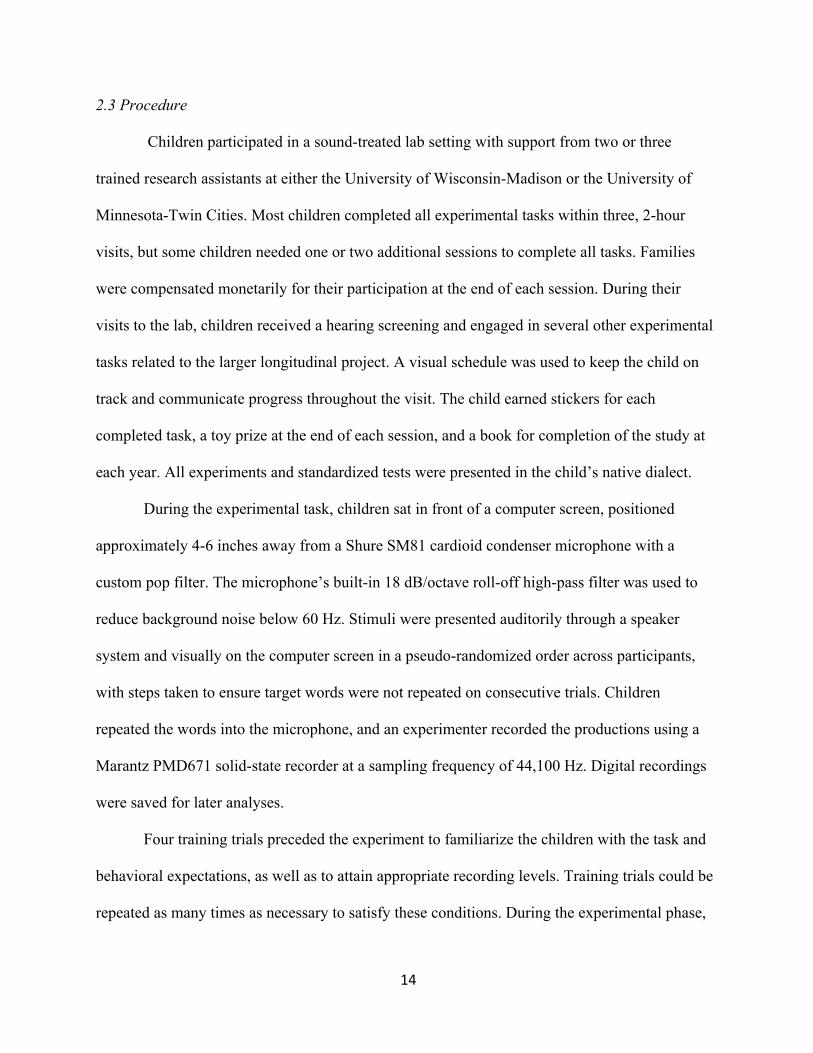
prompted the child). If a child did not produce a target, this was coded as a non-response. Figure
3.1 shows an example of the Pratt window during the first stage of coding.
Figure 3.1. Stage 1 of coding. In this example, the child produced the target word “kitty” twice: the first “Response” was a repetition immediately following the stimulus, and the second “VoicePromptResponse” was in response to the examiner’s prompt (i.e., Child: “Kitty.” Examiner: “Will you say kitty again?” Child: “I have that kitty at home.”) The “NI” denotes the target consonant was not produced phrase-initially.

17
Next, a research assistant with experience in phonetic transcription and acoustic
phonetics made a binary choice of whether the production was a stop or not (Stage 2 of coding).
If the production were a stop, the transcriber made a relatively narrow decision about place-of-
articulation (Stage 3 of coding). These transcriptions included [t] and [k], intermediate categories
(i.e., [t:k] if the production were perceptually intermediate, but closer to [t]; [k:t], if the
production were intermediate but closer to [k]) and “other” for bilabial productions. This level of
transcription also included a ‘$’ symbol if the production was a substitution (e.g., if a child
produced “tat” for cat, the initial consonant would be transcribed as [$t]). Notes could also be
added at this stage, such as the recording clipped, production of the target overlapped with
stimulus presentation, or background noise obscured the response. The first usable response was
always chosen if there were multiple productions of a word. “Useable” was defined as a response
unobscured by background noise and without clipping in the recording. If the child self-corrected
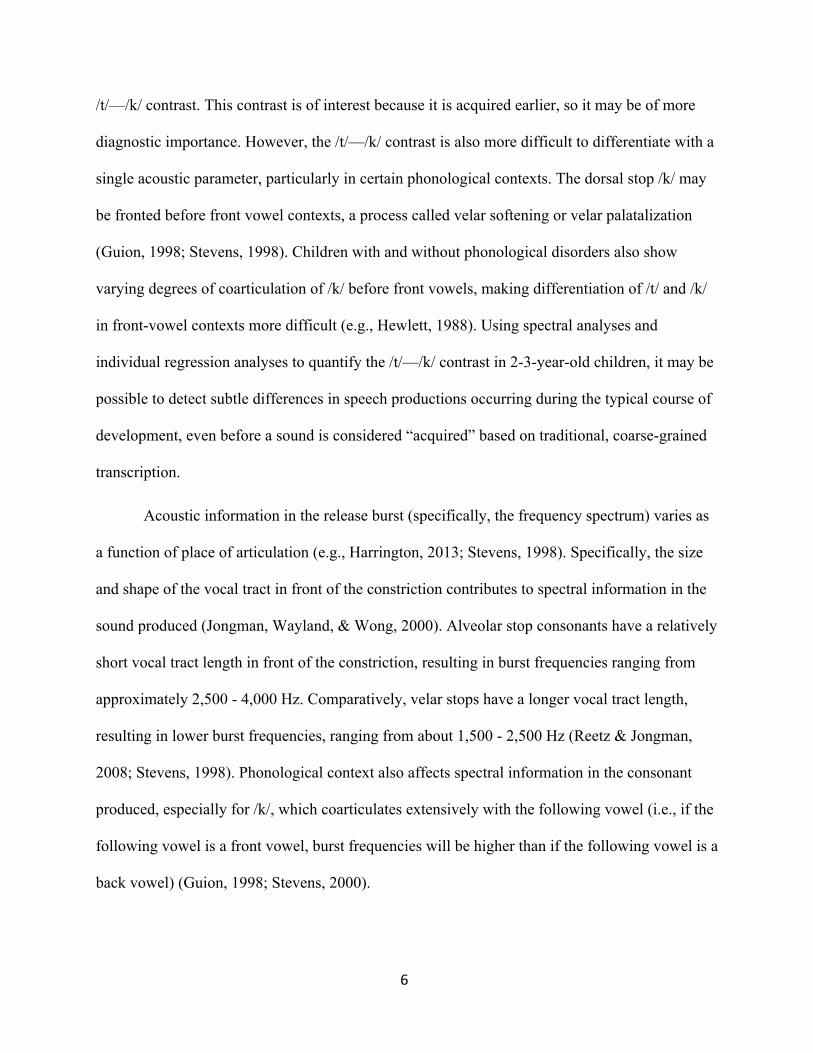
a production, the corrected production was transcribed. Figure 3.2 shows an example of the Praat
window during this stage of coding.
18
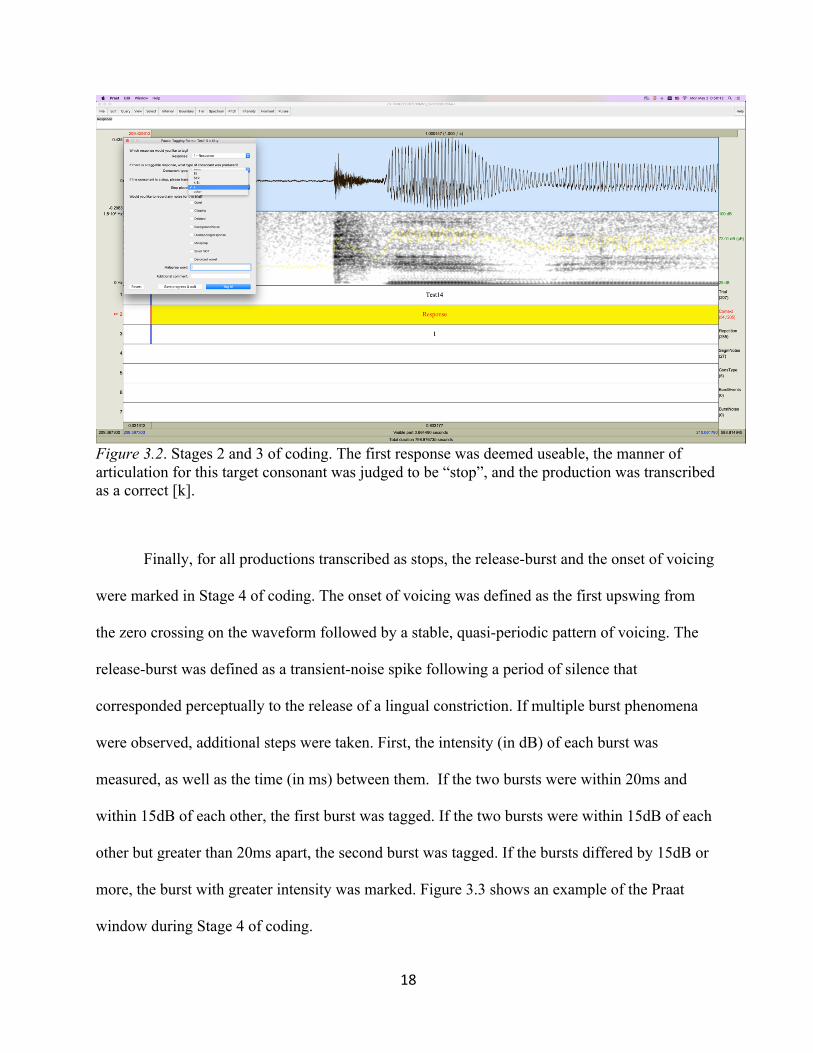
Figure 3.2. Stages 2 and 3 of coding. The first response was deemed useable, the manner of articulation for this target consonant was judged to be “stop”, and the production was transcribed as a correct [k].
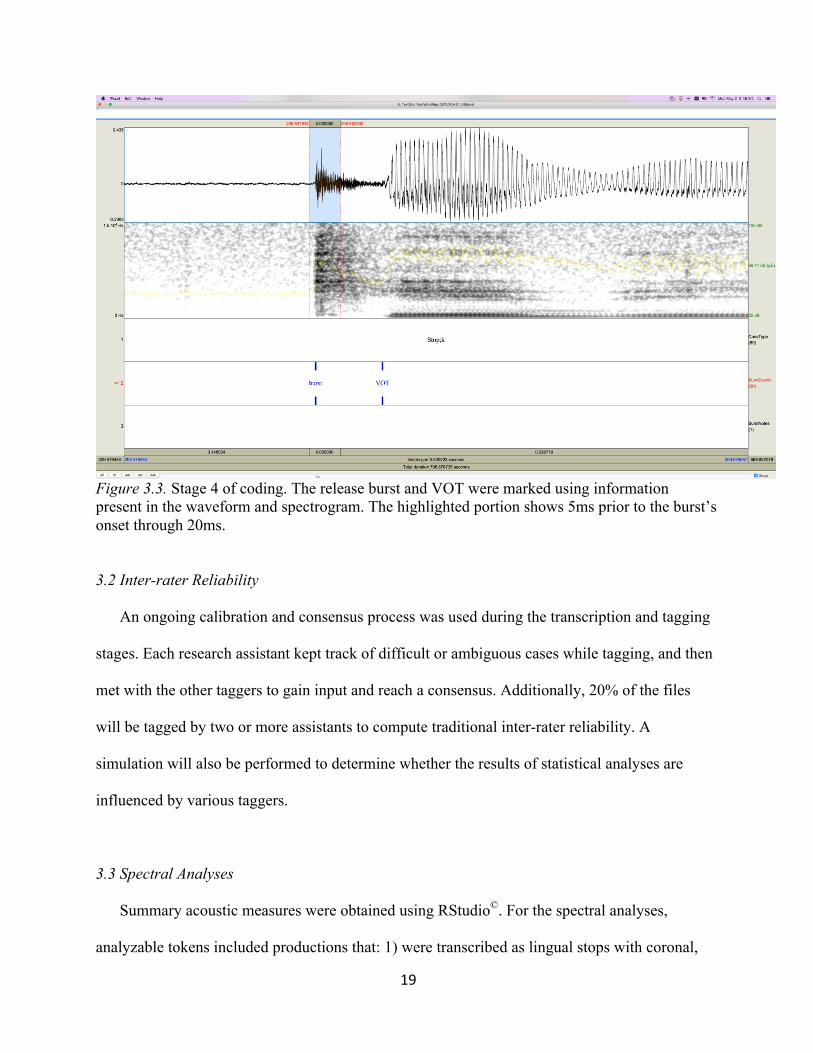
Finally, for all productions transcribed as stops, the release-burst and the onset of voicing
were marked in Stage 4 of coding. The onset of voicing was defined as the first upswing from
the zero crossing on the waveform followed by a stable, quasi-periodic pattern of voicing. The
release-burst was defined as a transient-noise spike following a period of silence that
corresponded perceptually to the release of a lingual constriction. If multiple burst phenomena
were observed, additional steps were taken. First, the intensity (in dB) of each burst was
measured, as well as the time (in ms) between them. If the two bursts were within 20ms and
within 15dB of each other, the first burst was tagged. If the two bursts were within 15dB of each
other but greater than 20ms apart, the second burst was tagged. If the bursts differed by 15dB or
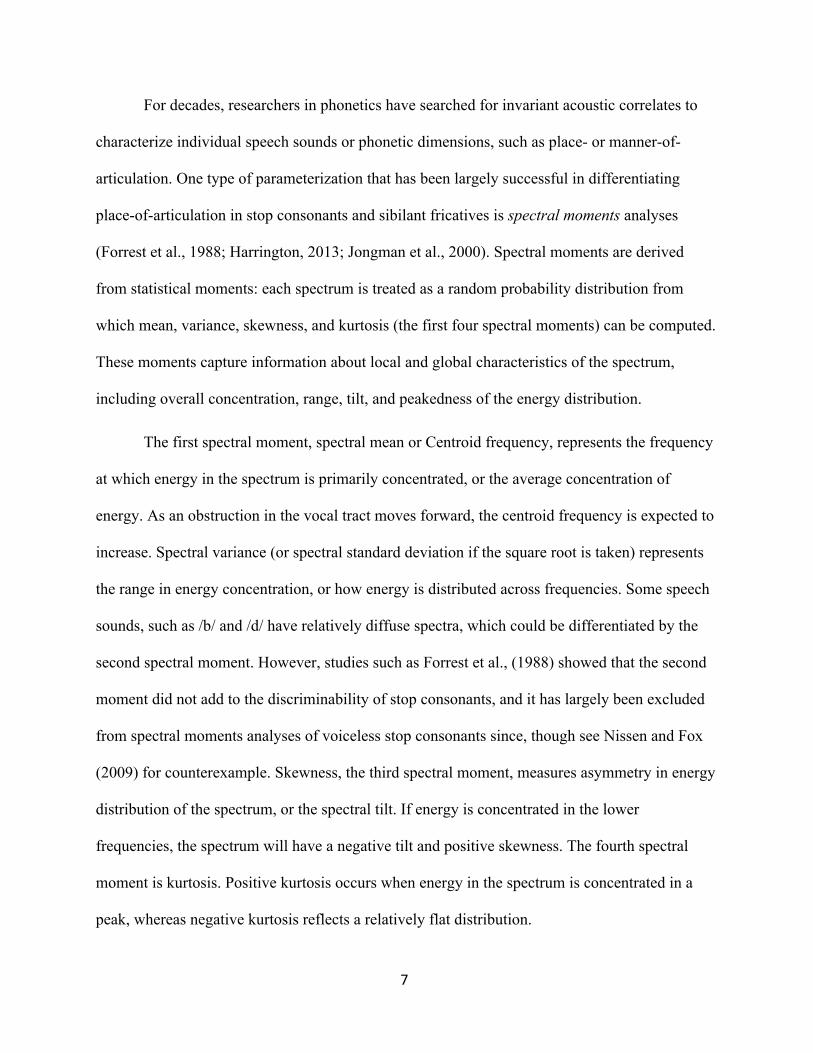
more, the burst with greater intensity was marked. Figure 3.3 shows an example of the Praat
window during Stage 4 of coding.
19
Figure 3.3. Stage 4 of coding. The release burst and VOT were marked using information present in the waveform and spectrogram. The highlighted portion shows 5ms prior to the burst’s onset through 20ms.
3.2 Inter-rater Reliability
An ongoing calibration and consensus process was used during the transcription and tagging
stages. Each research assistant kept track of difficult or ambiguous cases while tagging, and then
met with the other taggers to gain input and reach a consensus. Additionally, 20% of the files
will be tagged by two or more assistants to compute traditional inter-rater reliability. A
simulation will also be performed to determine whether the results of statistical analyses are
influenced by various taggers.
3.3 Spectral Analyses
Summary acoustic measures were obtained using RStudio©. For the spectral analyses,
analyzable tokens included productions that: 1) were transcribed as lingual stops with coronal,

20
dorsal, or intermediate place-of-articulation; 2) had voice-onset-time (VOT) greater than 20ms;
and 3) had release-bursts unobscured by background noise. Participants were excluded from the
analysis if they did not produce at least 4 analyzable tokens in both front- and back- vowel
contexts. For each analyzable production, 5ms preceding the burst through 20ms following the
burst was extracted with a rectangular analysis window from the source file. Figure 3.3 shows an
example of the 25ms window that was extracted from the .wav file. The spectrum of the window
was estimated with zero-padding, using a multitier spectrum with parameters K= 8, NW = 4. Due
to a relatively intense, low-frequency noise floor, the children’s recordings were also high-pass
filtered with a first-order FIR filter.
The summary acoustic measure for each production—Centroid frequency—was computed
from each spectrum on a linear scale ranging from 926.4 Hz to 15,178.7 Hz. The values of the
spectrum within this range were normalized, so the total power within the spectrum summed to
1. The Centroid frequency of the spectrum was computed as the sum of frequencies within this
interval weighted by the normalized spectral power at each frequency. In analogous terms, the
normalized spectrum was treated as a discrete probability mass function over frequency, and the
Centroid frequency was computed as the expected frequency value of the distribution.
The summary psychoacoustic measure for each production—Peak ERB—was calculated by
passing the estimated spectrum through a bank of bandpass filters. Each filter in the bank was a
4th-order gammatone filter whose bandwidth was proportional to its center frequency. Variable
bandwidths were used because the auditory filters are wider at high frequencies compared to low
frequencies. The center frequencies of the gammatone filters were spaced 0.1 ERB apart along
the ERB-number scale ranging from 15 to 39 (equivalent to the acoustic range used when
calculating Centroid, i.e., 15 ERB = 926.4 Hz, and 39 ERB = 15,178.7 Hz). The evenly spaced
21
filters along the psychoacoustic scale modeled the fact that the auditory periphery
logarithmically compresses the physical Hz frequency scale. The output of each channel in the
filter bank was summed, and each channel’s total power was plotted against that channel’s center
frequency on the ERB-scale, yielding a ‘psychoacoustic spectrum’ or ‘excitation pattern.’ Peak
ERB was the frequency component of the psychoacoustic spectrum with the greatest amplitude.
3.4 Statistical Analyses
Several steps were taken to prepare the data for statistical analysis. First, separate datasets
were created for the adults’ productions and the children’s productions, and all analyses were
performed separately for children and adults. For accuracy measures, each lingual stop
production that was transcribed with correct place-of-articulation and had VOT >20ms was
assigned a 1 for Accuracy, and each production that was transcribed as incorrect (including VOT
<20ms) was assigned a 0 for Accuracy. Intermediate productions that were transcribed as closer
to the target were coded as correct. To be included in the subsequent analyses, tokens had to be
transcribed as correct (i.e., assigned a 1), and analyzable (not obscured by noise). For spectral
measures, Centroid measurements were converted into kHz, so the values were more similar in
range to the Peak ERB measures. Finally, Centroid in kHz and Peak ERB were both mean-
centered in order to increase the likelihood that statistical models would converge and improve
interpretability of the model’s parameter estimates.
Four separate mixed-effects logistic regression models were used to analyze each dataset
(again, separate analyses were done for children and adults). The first model included Centroid
(kHz) as the central measure, and the second model included Peak (ERB) as the central measure.
Both models predicted the likelihood that target consonant was /t/ or /k/ based on: fixed effects
22
of central measure, vowel context, and their interaction; and random effects of the intercept and
slope for central measure by-participant. Random effects were allowed to be correlated. The
models were constructed for the RStudio© package lme4, version 1.1-11 (Bates, Maechler,
Bolker, & Walker), as follows:
Model 1: glmer(Target Consonant ~ Centroid.kHz.c * Vowel Context + (1 + Centroid.kHz.c | ID))
Model 2: glmer(Target Consonant ~ PeakERB.c * Vowel Context + (1 + PeakERB.c | ID))
From the output of Models 1 and 2, the probability that each production’s target
consonant was /t/ were calculated. If the probability was greater than 50%, the model predicted
the target consonant was /t/. If the probability was less than 50%, the model predicted the target
consonant was /k/. If the predicted target consonant matched the actual target consonant (i.e., the
model made a correct prediction), the token was assigned a 1 for Predicted Accuracy. If the
model mis-classified the consonant (the model’s prediction was incorrect), the token was
assigned a 0 for Predicted Accuracy.
The third and fourth mixed-effects logistic regression models were used to determine
which central measure (Centroid or Peak ERB) better differentiated /t/ and /k/. This was defined
as a significantly higher log likelihood that predictions were made accurately by Model 1
(Centroid model) or Model 2 (Peak ERB model). Model 3 was built on productions in front-
vowel contexts, and Model 4 was built on productions in back-vowel contexts. Both models
included Predicted Accuracy (assignment of 1 or 0 from results of the first two models) as the
outcome variable, with a fixed effect of group (group 1 was Centroid, group 2 was Peak ERB),
and a random intercept by-participant. These models were constructed as follows:
Models 3 & 4: glmer(Predicted Accuracy ~ Central Measure + (1 | ID), family = ‘binomial’)
The results of Models 3 and 4 directly address the research question of this study: is
Centroid or Peak ERB a better central measure for differentiating /t/ and /k/ productions.

23
CHAPTER FOUR Results
4.1 Adults—Accuracy based on transcription
Based on transcriptions, adults produced /t/ and /k/ targets with 99.8% accuracy. One
adult produced a single [k] token with VOT < 20ms, decreasing the expected 100% accuracy
value. A total of 657 productions across 21 adults were analyzable (correctly produced and
unobscured by noise) and included in the subsequent spectral analyses (mean: 31 productions per
adult).
4.2 Adults—Differentiating /t/ and /k/
For the adults, Model 1—using Centroid to predict Target consonant—made accurate
predictions 95% of the time (94% accurate for target /t/, and 96% accurate for target /k/). Model
2—using Peak ERB to predict Target consonant—made accurate predictions 92% of the time
(88% accurate for target /t/, and 95% accurate for target /k/). Table 4.1 shows accuracy of the
models’ predictions for target /t/ and target /k/ productions separate for front- and back-vowel
contexts.
Table 4.1. Mean accuracy of the predictions made by Model 1 and Model 2 for adults
Then, Model 3 and Model 4 were used to compare the prediction accuracy of the two
central measures in front- and back-vowel contexts, respectively.
Target /t/ Target /k/
Centroid (Model 1)
Front 92%
Back 98%
Front 95%
Back 96%
Peak ERB (Model 2)
Front 85%
Back 92%
Front 98%
Back 93%
24
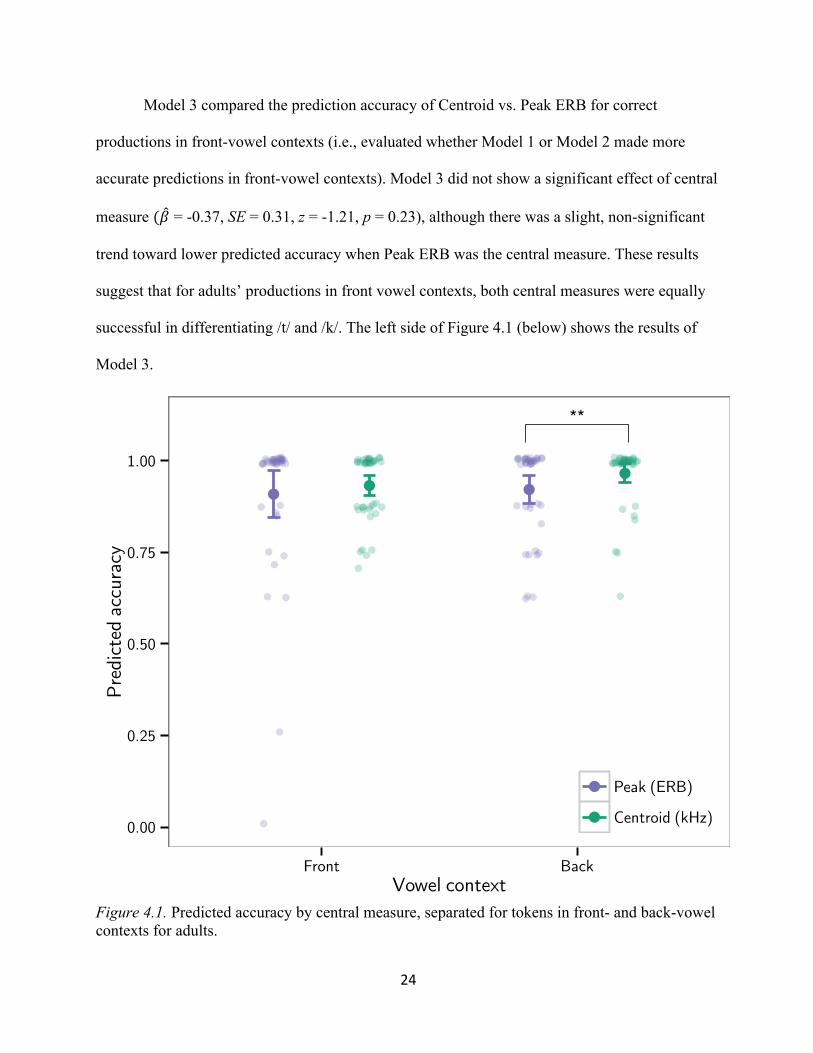
Model 3 compared the prediction accuracy of Centroid vs. Peak ERB for correct
productions in front-vowel contexts (i.e., evaluated whether Model 1 or Model 2 made more
accurate predictions in front-vowel contexts). Model 3 did not show a significant effect of central
measure (" = -0.37, SE = 0.31, z = -1.21, p = 0.23), although there was a slight, non-significant
trend toward lower predicted accuracy when Peak ERB was the central measure. These results
suggest that for adults’ productions in front vowel contexts, both central measures were equally
successful in differentiating /t/ and /k/. The left side of Figure 4.1 (below) shows the results of
Model 3.
Figure 4.1. Predicted accuracy by central measure, separated for tokens in front- and back-vowel contexts for adults.
●●
●●
**
0.00
0.25
0.50
0.75
1.00
Front BackVowel context
Pre
dict
ed a
ccur
acy
●
●
Peak (ERB)
Centroid (kHz)
25
Model 4 compared the prediction accuracy of Centroid vs. Peak ERB for correct
productions in back-vowel contexts (i.e., evaluated whether Model 1 or Model 2 made more
accurate predictions in back-vowel contexts). Model 4 showed a significant effect of central
measure: in back-vowel contexts, predicted accuracy was significantly lower when Peak ERB
was the central measure (" = -1.01, SE = 0.39, z = -2.61, p = 0.009). These results suggest that
for adults’ productions in back-vowel contexts, Centroid was a better central measure for
differentiating /t/ and /k/. The right side of Figure 4.1 (above) shows the significant results of
Model 4.
4.3 Children—Accuracy based on transcription
For the 185 children who participated in the experimental task, /t/ and /k/ targets were
produced with 74.7% accuracy. Of these children, 22 were excluded from spectral analyses due
to too few analyzable tokens. To be included, at least four tokens in each vowel context had to be
produced correctly and unobscured by noise. For the remaining 163 children, overall accuracy of
/t/ and /k/ productions was 81.3%.
For the 163 children included in spectral analyses, /t/ targets were produced slightly more
accurately (83%) than /k/ targets (80%). Productions of /t/ targets in front-vowel contexts were
produced slightly less accurately (81%) than productions of /t/ in back-vowel contexts (85%).
Productions of /k/ targets followed a similar trend: 77% accuracy in front-vowel contexts, 83%
accuracy in back-vowel contexts. A total of 4,193 productions were included in spectral analyses
(mean: 26 per child).
26
4.4 Children—Differentiating /t/ and /k/
Model 1—using Centroid to predict Target consonant—made accurate predictions 79%
of the time (69% accurate for target /t/, and 81% accurate for target /k/). Model 2—using Peak
ERB to predict Target consonant—made accurate predictions 72% of the time (58% accurate for
target /t/, and 79% accurate for target /k/). Table 4.2 shows the mean accuracy of the models’
predictions for target /t/ and target /k/ separately for front- and back-vowel contexts.
Table 4.2. Mean accuracy of the predictions made by Model 1 and Model 2 for children
Target /t/ Target /k/ Centroid (Model 1)
Front 54%
Back 85%
Front 78%
Back 85%
Peak ERB (Model 2)
Front 44%
Back 71%
Front 86%
Back 72%
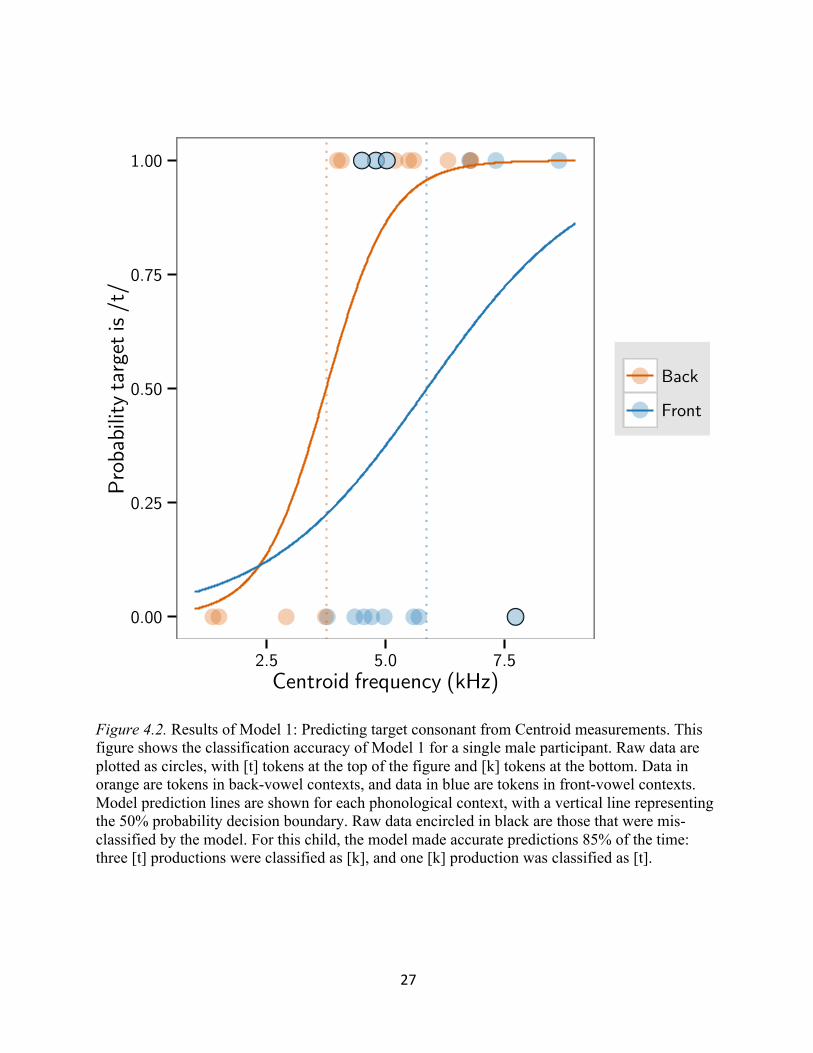
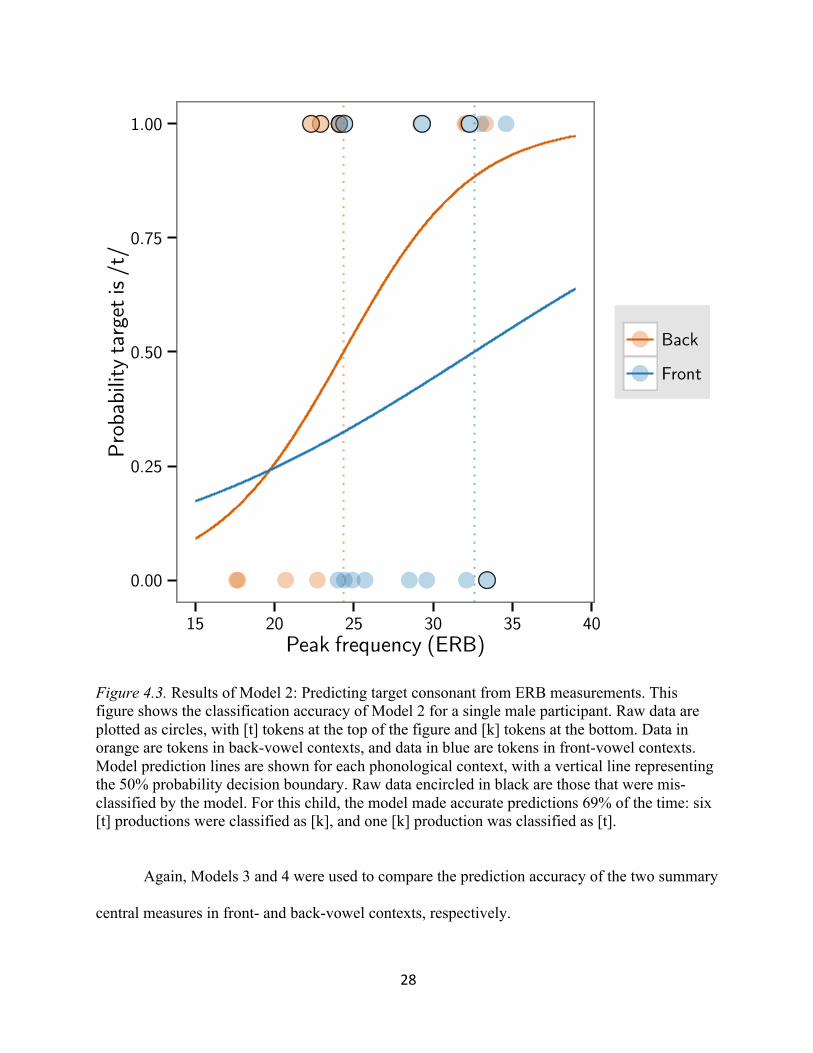
Figure 4.2 shows the results of Model 1 for a single child, and Figure 4.3 shows the
results of Model 2 for that same child. Raw data are plotted as circles: productions transcribed as
[k] are on the bottom of the figures and productions transcribed as [t] are at the top; productions
in front-vowel context are in blue, and productions in back-vowel context are in orange. Blue
and orange lines represent the model’s predictions for tokens in front- and back-vowel contexts,
respectively. A dashed, vertical, decision boundary line is drawn where the probability that a
production was a /t/ equals 50%. For [t] tokens at the top of the figures, anything to the left of
these decision boundaries was mis-classified by the model (i.e., the model incorrectly classified
the production as a [k]). For [k] tokens on the bottom of the figures, anything to the right of the
decision boundaries was mis-classified by the model (i.e., the model incorrectly classified the
production as a [t]).
27
Figure 4.2. Results of Model 1: Predicting target consonant from Centroid measurements. This figure shows the classification accuracy of Model 1 for a single male participant. Raw data are plotted as circles, with [t] tokens at the top of the figure and [k] tokens at the bottom. Data in orange are tokens in back-vowel contexts, and data in blue are tokens in front-vowel contexts. Model prediction lines are shown for each phonological context, with a vertical line representing the 50% probability decision boundary. Raw data encircled in black are those that were mis-classified by the model. For this child, the model made accurate predictions 85% of the time: three [t] productions were classified as [k], and one [k] production was classified as [t].
●
●
● ●
0.00
0.25
0.50
0.75
1.00
2.5 5.0 7.5Centroid frequency (kHz)
Pro
babi
lity
targ
et is
/t/
Back
Front
28
Figure 4.3. Results of Model 2: Predicting target consonant from ERB measurements. This figure shows the classification accuracy of Model 2 for a single male participant. Raw data are plotted as circles, with [t] tokens at the top of the figure and [k] tokens at the bottom. Data in orange are tokens in back-vowel contexts, and data in blue are tokens in front-vowel contexts. Model prediction lines are shown for each phonological context, with a vertical line representing the 50% probability decision boundary. Raw data encircled in black are those that were mis-classified by the model. For this child, the model made accurate predictions 69% of the time: six [t] productions were classified as [k], and one [k] production was classified as [t].
Again, Models 3 and 4 were used to compare the prediction accuracy of the two summary
central measures in front- and back-vowel contexts, respectively.
● ●●●
●
●●●
0.00
0.25
0.50
0.75
1.00
15 20 25 30 35 40Peak frequency (ERB)
Pro
babi
lity
targ
et is
/t/
Back
Front
29
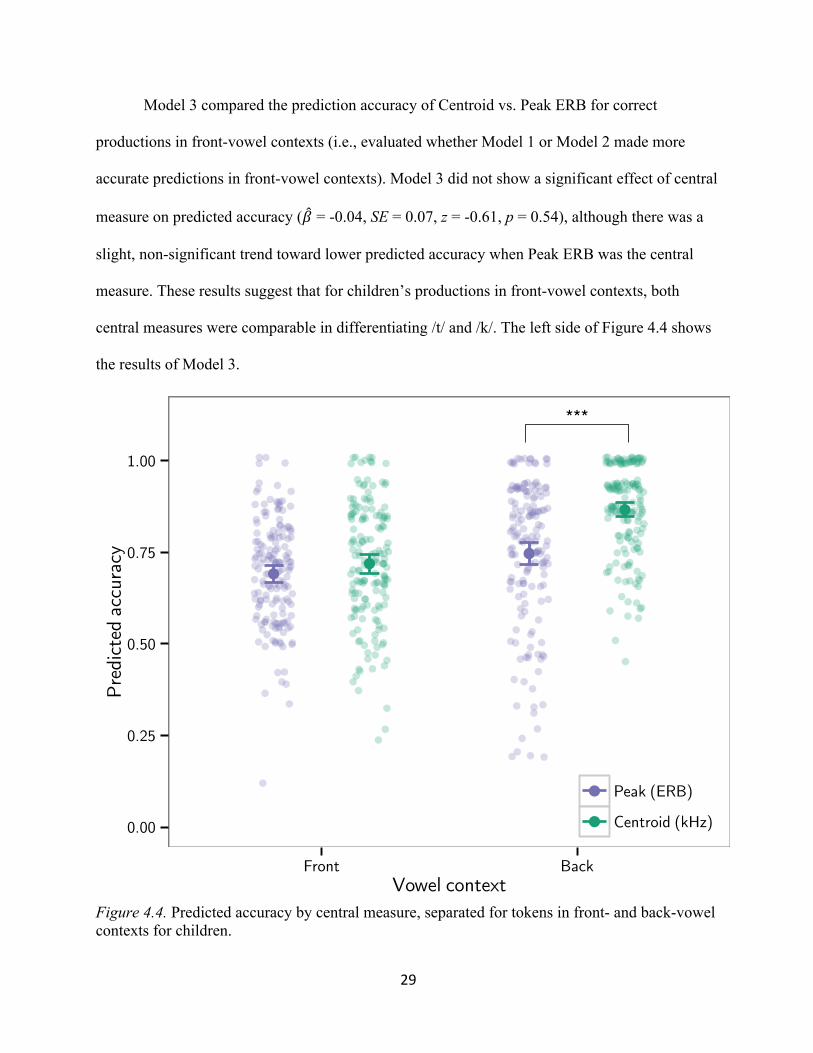
Model 3 compared the prediction accuracy of Centroid vs. Peak ERB for correct
productions in front-vowel contexts (i.e., evaluated whether Model 1 or Model 2 made more
accurate predictions in front-vowel contexts). Model 3 did not show a significant effect of central
measure on predicted accuracy (" = -0.04, SE = 0.07, z = -0.61, p = 0.54), although there was a
slight, non-significant trend toward lower predicted accuracy when Peak ERB was the central
measure. These results suggest that for children’s productions in front-vowel contexts, both
central measures were comparable in differentiating /t/ and /k/. The left side of Figure 4.4 shows
the results of Model 3.
Figure 4.4. Predicted accuracy by central measure, separated for tokens in front- and back-vowel contexts for children.
●●
●
●
***
0.00
0.25
0.50
0.75
1.00
Front BackVowel context
Pre
dict
ed a
ccur
acy
●
●
Peak (ERB)
Centroid (kHz)
30
Model 4 compared the prediction accuracy of Centroid vs. Peak ERB for correct
productions in back-vowel contexts (i.e., evaluated whether Model 1 or Model 2 made more
accurate predictions in back-vowel contexts). Model 4 showed a significant effect of central
measure: in back-vowel contexts, predicted accuracy was significantly lower when Peak ERB
was the central measure (" = -0.92, SE = 0.08, z = -10.87, p < 0.001). These results suggest that
for children’s productions in back-vowel contexts, Centroid was a better measure for
differentiating /t/ and /k/. The right side of Figure 4.4 shows the significant results of Model 4.
Additional models were fit for the children to evaluate a possible effect of target
consonant on predicted accuracy. Separate models were fit for front- and back-vowel contexts
(Models 5 and 6, respectively). These models included a main effect of target consonant and an
interaction between central measure and target consonant. The resulting models were structured
as follows:
Models 5 & 6: Predicted Accuracy ~ Central Measure * Target Consonant + (1 | ID)
For correct productions in front-vowel contexts, Model 5 showed significant main effects
of central measure (" = 0.48, SE = 0.12, z = -3.93, p < 0.001) and target consonant (" = -1.5, SE
= 0.11, z = -14.57, p <0.001), as well as a significant interaction (" = -0.85, SE = 0.16, z = -5.51,
p <0.001). These results indicate that in front-vowel contexts, productions with target /t/ were
predicted less accurately than productions with target /k/. The significant interaction indicates
that target /t/ productions were predicted more accurately when Centroid was used, but target /k/
productions were predicted more accurately when Peak ERB was used. These results are shown
in the left panel of Figure 4.5.

31
Figure 4.5. Predicted accuracy by central measure, separated by vowel context and target consonant for children.
For correct productions in back vowel contexts, Model 6 showed significant main effects
of central measure (" = -0.91, SE = 0.13, z = -7.25, p < 0.001) and target consonant (" = -0.33,
SE = .13, z = -2.47, p <0.001), but the interaction was not significant (" = -0.02, SE = 0.17, z = -
0.13, p = 0.9). These results suggest that in back vowel contexts, productions with target /t/ were
predicted less accurately than productions with target /k/, and overall, Centroid was significantly
better at differentiating /t/ and /k/. These results are shown in the right panel of Figure 4.5.
Front Back
●
●
●
● ●
●
●
●
0.00
0.25
0.50
0.75
1.00
t k t kTarget consonant
Pre
dict
ed a
ccur
acy
●
●
Peak (ERB)
Centroid (kHz)
32
CHAPTER FIVE Discussion
The goal of the present study was to compare the utility of two central measures—Centroid
and Peak ERB—in quantifying the robustness of contrast between word-initial [t] and [k]
productions in both adults and children. Using an objective, gradient acoustic measure to
supplement subjective, binary transcription decisions may present a more valid way to
characterize subtle differences in speech productions, especially for children in the process of
acquiring a particular contrast.
Twenty-one adults produced /t/ and /k/ words at ceiling-level accuracy, and both central
measures were highly successful in predicting whether the target consonant was /t/ or /k/. While
controlling for vowel context, the model predicting target consonant based on Centroid was
accurate 95% of the time, and the model predicting target consonant based on Peak ERB was
accurate 92% of the time. When comparing central measures directly, there was no difference
between the two measures in front-vowel contexts, but Centroid better differentiated /t/ and /k/ in
back-vowel contexts.
One hundred and sixty-three children produced /t/ and /k/ words with 81% accuracy (/t/
targets were produced slightly more accurately than /k/ targets, as expected for this age range).
Compared to adults, both central measures were less successful in predicting whether the target
consonant was /t/ or /k/, suggesting that children’s productions exhibit less acoustic contrast
overall. While controlling for vowel context, the model predicting target consonant based on
Centroid was accurate 79% of the time, and the model predicting target consonant based on Peak
ERB was accurate 72% of the time. When comparing central measures, results were similar to
33
those for adults: there was no difference between the measures’ accuracy in front vowel contexts,
but Centroid better differentiated /t/ and /k/ in back-vowel contexts.
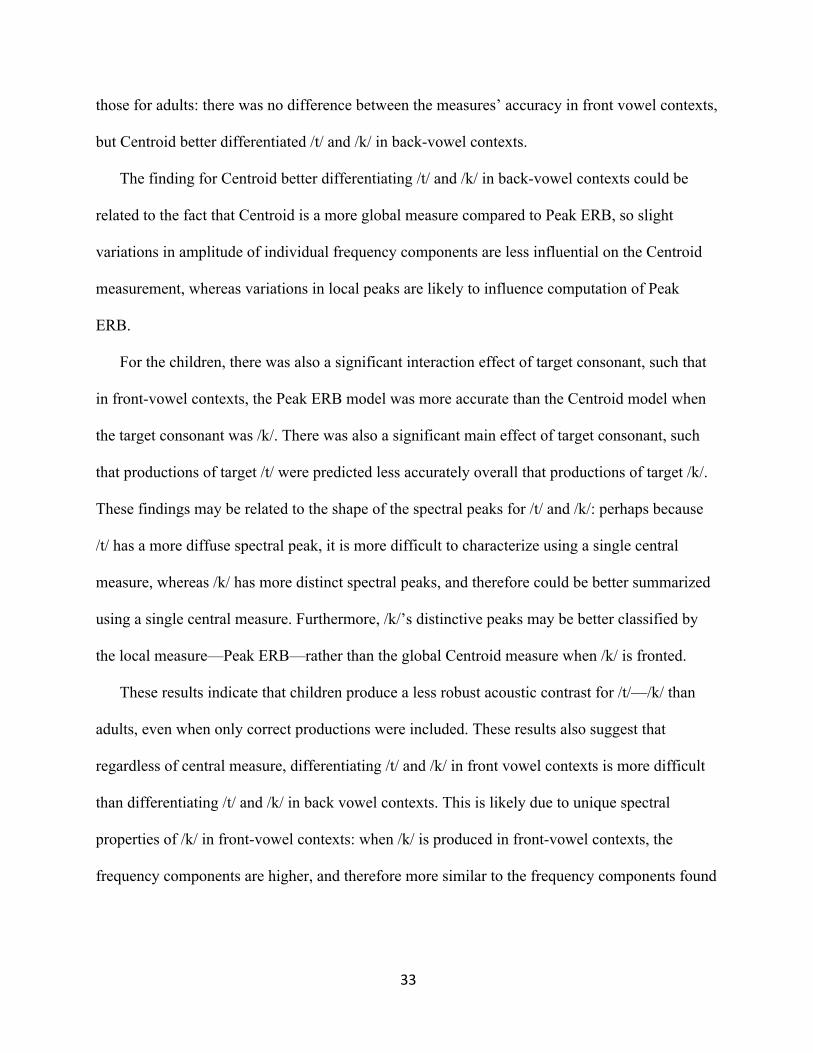
The finding for Centroid better differentiating /t/ and /k/ in back-vowel contexts could be
related to the fact that Centroid is a more global measure compared to Peak ERB, so slight
variations in amplitude of individual frequency components are less influential on the Centroid
measurement, whereas variations in local peaks are likely to influence computation of Peak
ERB.
For the children, there was also a significant interaction effect of target consonant, such that
in front-vowel contexts, the Peak ERB model was more accurate than the Centroid model when
the target consonant was /k/. There was also a significant main effect of target consonant, such
that productions of target /t/ were predicted less accurately overall that productions of target /k/.
These findings may be related to the shape of the spectral peaks for /t/ and /k/: perhaps because
/t/ has a more diffuse spectral peak, it is more difficult to characterize using a single central
measure, whereas /k/ has more distinct spectral peaks, and therefore could be better summarized
using a single central measure. Furthermore, /k/’s distinctive peaks may be better classified by
the local measure—Peak ERB—rather than the global Centroid measure when /k/ is fronted.
These results indicate that children produce a less robust acoustic contrast for /t/—/k/ than
adults, even when only correct productions were included. These results also suggest that
regardless of central measure, differentiating /t/ and /k/ in front vowel contexts is more difficult
than differentiating /t/ and /k/ in back vowel contexts. This is likely due to unique spectral
properties of /k/ in front-vowel contexts: when /k/ is produced in front-vowel contexts, the
frequency components are higher, and therefore more similar to the frequency components found
34
in /t/ productions. Thus, the model will be less successful differentiating /t/ and /k/ when /k/ is
fronted by anticipatory coarticulation.
Limitations of this study should be discussed. First, there was an unexpected noise floor in
the children’s recordings. An intense, low-frequency noise was present throughout recordings,
which created a necessity to pass the children’s recordings through a high-pass filter. This
additional manipulation of the acoustic signal was neither planned nor desirable, and may have
had unexpected effects on central measurements. To avoid this issue in the future, it is
recommended that the highest quality recording equipment be used in a sound-treated space, and
noise floor measurements should not exceed 20dB.
Second, many tokens were excluded from analysis due to background noise during the
response or the response overlapping with the stimulus. To increase the amount of useable data,
it is recommended that a cue be built into the experiment so that children know exactly when
they should start their responses. Also, experimenters may need extra support to determine
whether responses began while the stimulus was still playing. One idea is to implement use of a
software system that would produce a waveform in real time, so examiners could ensure there
was time between stimulus offset and response onset.
There are many future directions given the current findings for this line of research. The next
step will be to look at how the models classify all productions of lingual stops, including not only
correct productions, but clear substitutions and intermediate productions transcribed as closer to
incorrect. The current study only analyzed robustness of overt contrasts, and this future analysis
could provide insight into children’s productions of covert contrasts. Perhaps two children who
consistently made [t/ for /k/ substitutions will have different degrees of robustness of contrast
35
(i.e., the model makes more accurate predictions for one child compared to the other), suggesting
that one child may be producing a covert contrast.
Another future analysis will include comparing each child’s acoustic robustness of contrast
with perceptual robustness of contrast. Perceptual robustness of contrast will be obtained by
using a visual analog scale (VAS) rating to quantify robustness of contrast, as in Bernstein
(2015), Kim (2016), and Holliday et al. (2015). Naïve listeners will hear /t/ and /k/ productions
(including correct, incorrect, and intermediate productions) and rate them on a linear scale from
0 (very /t/-like) to 1 (very /k/-like). It’s possible that even though Peak ERB was comparable to
Centroid in differentiating /t/ and /k/ in front-vowel contexts and less accurate in back-vowel
contexts, Peak ERB may be more related to gradient perceptual judgments, as it was designed to
better reflect the human auditory system.
A possible path to further explore the current data and improve the models’ abilities to
differentiate /t/ and /k/ may involve incorporating additional spectral moments to improve
classification accuracy. Because /t/ has a more diffuse spectral peak compared to /k/, additional
measures of variance, skewness, and especially peakedness may facilitate the model’s ability to
differentiate /t/ and /k/ productions across phonological contexts. This could be especially
relevant for quantifying robustness of the /t/—k/ contrast in children. Although a single central
measure was overall highly accurate in classifying adults’ productions, the children’s smaller
vocal tracts reduce the range of relevant frequencies, likely causing more overlap and less
distance between centroid frequencies in /t/ and /k/ productions. An additional measure to
describe the peakedness of the spectrum might serve in differentiating /t/ and /k/ productions in
front-vowel contexts for children.

36
Another possible method to better characterize the stops would be to use a dynamic measure
rather than static information within a single spectral slice. Analyzing the spectrum during the
release-burst and its transition into the following vowel could provide additional cues and
improve categorization accuracy in various phonological contexts (for examples, see Kewley-
Port, Pisoni, & Studdert-Kennedy, (1983); Lahiri, Gewirth, & Blumstein, 1984; Nossair &
Zahorian, 1991; Suomi, 1985; Walley & Carrell, 1983).
Finally, as the measurements collected from the children in this study were part of a larger
longitudinal project, there are several avenues for individual differences research to determine
which child-level factors, if any, predict early development of a robust contrast between /t/ and
/k/. Vocabulary skills, speech perception skills, or articulation abilities overall may influence a
child’s ability to produce a clear contrast. Family factors could also play a role, such as maternal
education, quantity and quality of language input in the home, the average number of
conversational turns a child takes on a typical day, or how often the child participates in shared
reading time with others. With the longitudinal data collected over several years, it would also be
possible to look at a child’s /t/—k/ contrast over time, and determine whether any child-level
factors at 2-3-years of age predict more rapid growth.
To summarize, the present study explored two central measures—Centroid and Peak ERB—
and their utility in quantifying robustness of the /t/—k/ contrast across various phonological
contexts in children and adults. For both groups of speakers, Centroid and Peak ERB were
comparable in differentiating /t/ and /k/ in front vowel contexts, but Centroid was significantly
better in back vowel contexts. Children overall produced less robust contrasts compared to
adults, even when only correct productions were analyzed, and this was especially true in front-
vowel contexts, likely because /k/ becomes fronted and has spectral properties more similar to /t/.

37
However, when the target consonant was /k/, Peak ERB was better for differentiating the
consonants, which could suggest that local peaks are more meaningful than a global average
when /k/ becomes fronted.
The results of this study highlight the importance of using an objective, gradient measures to
supplement transcription: even when all the /t/ and /k/ productions were transcribed as correct,
there was a wide range in robustness of acoustic contrast. Quantifying robustness of contrast in
using spectral analyses could increase the precision of researchers’ and clinician’s descriptions of
children’s articulation skills. Precise profiles of children’s speech could lead to more informative
normative data on the gradual acquisition process, more accurate diagnostic tools for describing
covert contrasts, and more focused therapy approaches for children with speech sound disorders.

38
REFERENCES Bertha, J., Bankson, N. W., & Flipsen, P., Jr. (2013). Articulation and phonological disorders.
New York, NY: Pearson Higher Education. Cheng, H., Murdoch, B., Goozee, J., & Scott, D. (2007). Physiologic development of tongue-
jaw coordination from childhood to adulthood. Journal of Speech, Language, and Hearing Research, 50(2), 352-360.
Edwards, J., Gibbon, F., & Fourakis, M. (1997). On discrete changes in the acquisition of the alveolar/velar stop consonant contrast. Language and Speech, 40(2), 203-210.
Edwards, J., & Beckman, M. (2008). Methodological questions in studying consonant acquisition. Clinical Linguistics & Phonetics, 22(12), 937-956.
Forrest, K., Weismer, G., Milenkovic, P., & Dougall, R. N. (1988). Statistical analysis of word- initial voiceless obstruents: Preliminary data. The Journal of the Acoustical Society of America, 84, 115.
Forrest, K., Weismer, G., Hodge, M., Dinnsen, D., & Elbert, M. (1990). Statistical analysis of word-initial /k/ and /t/ produced by normal and phonologically disordered children. Clinical Linguistics & Phonetics, 4(4), 327-340.
Gibbon, F. (1990). Lingual activity in two speech-disordered children's attempts to produce velar and alveolar stop consonants: evidence from electropalatographic (EPG) data.
International Journal of Language & Communication Disorders, 25(3), 329-340. Gibbon, F. (1999). Undifferentiated lingual gestures in children with articulation/phonological
disorders. Journal of Speech, Language, and Hearing Research, 42(2), 382-97. Gibbon, F., & Wood, S. (2002). Articulatory drift in the speech of children with articulation and
phonological disorders. Perceptual and Motor Skills, 95(1), 295-307. Gierut, J. (1998). Treatment efficacy: Functional phonological disorders in children. Journal Of Speech, Language & Hearing Research, 41(1), S85-100. Glasberg, B. R. and Moore, B. C. J. (1990). Derivation of auditory filter shapes from notched-
noise data. Hearing Research, 47:103–138. Guion, S. (1998). The role of perception in the sound change of velar palatalization. Phonetica:
International Journal of Speech Science, 55(1-2), 18-52. Harrington, J. (2013). Acoustic Phonetics. In W.J. Hardcastle, J. Laver, & F. Gibbon (Eds.), The
Handbook of Phonetic Sciences (pp. 81-130) Oxford: Wiley-Blackwell. Harrison, L. J., & McLeod, S. (2010). Risk and protective factors associated with speech and
language impairment in a nationally representative sample of 4-to-5year-old children. Journal of Speech, Language, and Hearing Research, 53, 508-529.
Hazan, V., & Baker, R. (2011). Is consonant perception linked to within-category dispersion or across-category distance? Proceedings of the 17th International Congress of Phonetic Sciences (ICPhS). 839 – 842. Hong Kong.
Hewlett, N. (1988). Acoustic properties of /k/ and /t/ in normal and phonologically disordered speech. Clinical Linguistics & Phonetics, 2(1), 29-45.
Hewlett, N., & Waters, D. (2004). Gradient change in the acquisition of phonology. Clinical Linguistics & Phonetics, 2004, Vol.18(6-8), P.523-533, 18(6-8), 523-533.
Holliday, J., Reidy, P., Beckman, M., & Edwards, J. (2015). Quantifying the robustness of the English sibilant fricative contrast in children. Journal of Speech, Language, and Hearing Research, doi:10.1044/2015_JSLHR-S-14-0090 Joffe, V., & Pring, T. (2008). Children with phonological problems: a survey of clinical practice.
International Journal of Language & Communication Disorders, 43(2), 154-164.
39
Jongman, A., Wayland, R., & Wong, S. (2000). Acoustic characteristics of English fricatives. Journal of the Acoustical Society of America, 108(3 part 1), 1252-63.
Kent, R. D. (1976). Anatomical and neuromuscular maturation of the speech mechanism: evidence from acoustic studies. Journal of Speech and Hearing Research, (3), 421-47.
Kewley-Port, D., Pisoni, D. B., and Studdert-Kennedy, M. (1983) Perception of static and dynamic acoustic cues to place of articulation in initial stop consonants. Journal of the Acoustical Society of America, 73, 1779–1793.
Kewley-Port, D., and Luce, P. A. (1984) Time-varying features of initial stop consonants in auditory running spectra: A first report. Perception and Psychophysics, 35, 353–360.
Kristensen, K. (2015). Relating decreased acoustic contrast to intelligibility: Perceptual consequences for cochlear implants. Department of Communication Sciences and Disorders. M.S.
Lahiri, A., Gewirth, L., and Blumstein, S. E. (1984) A reconsideration of acoustic invariance for place of articulation in diffuse stop consonants: Evidence from a cross- language study. Journal of the Acoustical Society of America, 76, 391– 404.
Law, J., Boyle, J., Harris, F., Harkness, A., & Nye, C. (2000). Prevalence and natural history of primary speech and language delay: findings from a systematic review of the literature. International Journal of Language & Communication Disorders, 35(2), 165-188.
Li, F., Edwards, J., & Beckman, M. (2009). Contrast and covert contrast: The phonetic development of voiceless sibilant fricatives in English and Japanese toddlers. Journal of Phonetics, 37(1), 111-124.
Liberman, A., Harris, K., Hoffman, H., & Griffith, B. (1957). The discrimination of speech sounds within and across phoneme boundaries. Jounral of Experimental Psychology, 54(5), 358-368.
Macken, M. A., Barton, D. (1980). The acquisition of the voicing contrast in English: A study of voice onset time in word initial stop consonants. Journal of Child Language, 7, 41–74.
Maniwa, K., & Jongman, A. (2009). Acoustic characteristics of clearly spoken English fricatives. Journal of the Acoustical Society of America, 125(6), 3962-3973.
Marin, S., Pouplier, M., & Harrington, J. (2010). Acoustic consequences of articulatory variability during productions of /t/ and /k/ and its implications for speech error research. Journal of the Acoustical Society of America, 127(1), 445-461.
Maxwell, E., & Weismer, G. (1982). The contribution of phonological, acoustic, and perceptual techniques to the characterization of a misarticulating child's voice contrast for stops. Applied Psycholinguistics, 3(1), 29-43.
Mayo, C., Gibbon, F., Clark, R.A. (2013). Phonetically trained and untrained adults' transcription of place of articulation for intervocalic lingual stops with intermediate acoustic cues. Journal of Speech, Language & Hearing Research, (3), 779-791.
McCormack, J., Harrison, L. J., McLeod, S., & McAllister, L. (2011). A nationally representative study of the association between communication impairment at 4-5 years and children's life activities at 7-9 years. Journal of Speech, Language & Hearing Research, 54(5), 1328-1348. doi:10.1044/1092-4388(2011/10-0155)
McLeod, S. & Bleile, K. (2003). Neurological and developmental foundations of speech acquisition. American Speech-Language-Hearing Association Convention. Chicago.
Moore, B. C. J. (2014). Development and current status of the “Cambridge” loudness models. Trends in Hearing, 18. doi:10.1177/2331216514550620
Moore, B. C. J. (2013). An introduction to the psychology of hearing. Leiden, Netherlands: Brill.
40
Moore, B. C. J. and Glasberg, B. R. (1983). Suggested formulae for calculating auditory- filter bandwidths and excitation patterns. Journal of the Acoustical Society of America, 74(3):750–753.
Moore, B. C. J. and Glasberg, B. R. (1996). A revision of Zwicker’s loudness model. Acta Acustica united with Acustica, 82(2):335–345.
Moore, B. C. J., Glasberg, B. R., and Baer, T. (1997). A model for the prediction of thresholds, loudness and partial loudness. Journal of the Audio Engineering Society, 45(4):224–240
Munson, B., Edwards, J., Schellinger, S., Beckman, M., & Meyer, M. (2010). Deconstructing phonetic transcription: covert contrast, perceptual bias, and an extraterrestrial view of Vox Humana. Clinical Linguistics & Phonetics, 24(4-5), 245-260. doi:10.3109/02699200903532524
National Institute on Deafness and Other Communication Disorders (NIDCD). (2006). Strategic Plan FY 2006-2008. Retrieved on November 18, 2014, from http://www.nidcd.nih.gov/staticresources/about/plans/strategic/strategic06-08.pdf
National Institute on Deafness and Other Communication Disorders (NIDCD). (2010). Statistics on Voice, Speech, and Language. Retrieved on November 18, 2014, from http://www.nidcd.nih.gov/health/statistics/pages/vsl.aspx#5
Nicholson, N., Reidy, P., Munson, B., Beckman, M. E., & Edwards, J. (2015). The acquisition of English lingual sibilant fricatives in very young children: Effects of age and vocabulary size on transcribed accuracy and acoustic differentiation. Proceedings of the 18th International Congress of Phonetic Sciences (ICPhS). Glasgow, Scotland.
Nissen, S. L., & Fox, R.A. (2005). Acoustic and spectral characteristics of young children’s fricative productions: A developmental perspective. Journal of the Acoustical Society of America, 118, 2570.
Nissen, Shawn L., & Fox, Robert Allen. (2009). Acoustic and spectral patterns in young children's stop consonant productions. Journal of the Acoustical Society of America, 126(3), 1369-1378.
Nittrouer, S. (1995). Children Learn Separate Aspects of speech production at different rates: Evidence from spectral moments. Journal of the Acoustical Society of America, 97(1), 520-530.
Nossair, Z., & Zahorian, S. (1991). Dynamic spectral shape-features as acoustic correlates for initial stop consonants. Journal of The Acoustical Society Of America, 89(6), 2978-2991.
Scobbie, J. M., Gibbon, F., Hardcastle, W. J., & Fletcher, P. (2000). Covert contrast as a stage in the acquisition of phonetics and phonology. In M. B. Broe & J. B. Pierrehumbert (Eds.), Papers in Laboratory Phonology V: Acquisition and the Lexicon, (pp. 194-207). Cambridge, England: Cambridge UP.
Shadle, C., & Mair, S. (1996). Quantifying spectral characteristics of fricatives. Spoken Language, 1996. ICSLP 96. Proceedings., Fourth International Conference on, 3, 1521- 1524.
Smit, A.B., Hand, L., Freilinger, J., Bernthal, J., Bird, A. (1990) The Iowa articulation norms project and its Nebraska replication. Journal of Speech and Hearing Disorders, 55(4),
779-798. Suomi, K. 1985: The vowel dependence of gross spectral cues to place of articulation of stop
consonants in CV syllables, Journal of Phonetics, 13, 267–285. Reetz, H., & Jongman, A. (2008). Phonetics: Transcription, production, acoustics, and
41
perception. Chichester: Wiley-Blackwell. Reidy, P. (2015). The spectral dynamics of voiceless sibilant fricatives in English and
Japanese. (Doctoral dissertation). Retrieved from https://etd.ohiolink.edu/ Stevens, K. (1998). Acoustic phonetics. Cambridge: The MIT Press. Stevens, K., & Blumstein, S. (1978). Invariant cues for place of articulation in stop
consonants. Journal of the Acoustical Society of America, 64, 1358. Strömbergsson, S., Salvi, G., & House, D. (2015). Acoustic and perceptual evaluation of
category goodness of /t/ and /k/ in typical and misarticulated children's speech. The Journal of the Acoustical Society of America, 137(6), 3422-35.
Todd, A. E., Edwards, J. R., & Litovsky, R. Y. (2011). Production of contrast between sibilant fricatives by children with cochlear implants. Journal of the Acoustical Society of America, 130(6), 3969-3979.
Tyler, A. A., Figurski, G. R., & Langsdale, T. (1993). Relationships between acoustically determined knowledge of stop place and voicing contrasts and phonological treatment progress. Journal of Speech, Language, and Hearing Research, 36(4), 746-759. Walley, A. C., and Carrell, T. D. 1983: Onset spectra and formant transitions in the adult’s and
child’s perception of place of articulation in stop consonants, Journal of the Acoustical Society of America, 73, 1011–1022.
Zwicker, E. (1961). Subdivision of the audible frequency range into critical bands. The Journal of the Acoustical Society of America, 33(2), 248-248.
Zwicker, E., & Terhardt, E. (1980). Analytical expressions for critical-band rate and critical bandwidth as a function of frequency. The Journal of the Acoustical Society of America, 68, 1523.