Robert Temple, M.D. - Food and Drug Administration€¦ · Food and Drug Administration ......
73
Robert Temple, M.D. Deputy Center Director for Clinical Science Center for Drug Evaluation and Research Food and Drug Administration Peripheral and Central Nervous System Drugs Advisory Committee Meeting September 28, 2017
Transcript of Robert Temple, M.D. - Food and Drug Administration€¦ · Food and Drug Administration ......

Robert Temple, M.D.
Deputy Center Director for Clinical ScienceCenter for Drug Evaluation and Research
Food and Drug Administration
Peripheral and Central Nervous System Drugs Advisory Committee Meeting
September 28, 2017

2
Examining Subgroups
The general principle that the study endpoints to be analyzed to demonstrate effectiveness must be fully identified before the study is completed (preferably before it is started) is expressed universally and is a critical part of study planning. The global term covering this issue is multiplicity and all recognize that false conclusions can be reached if it is not accounted for. Just as important, there is also potential bias if new endpoints are selected with data in hand. In designing trials, there is thus particular attention to specifying the primary endpoint. Similar issues arise when there is an attempt to examine other aspects of an endpoint, such as results in subgroups of the population e.g., demographic, disease severity, or various baseline characteristics, as is the case today, where a clearly negative study based on all randomized patients is said to be a positive study in a population subset chosen after study completion and with knowledge of the data.
Cautions about such analyses are universal.

3
ICH E‐9
“Redefinition of the primary variable [I would also include a subset of the population based on a baseline characteristic] after unblinding will almost always be unacceptable since the biases this introduces are difficult to assess.”
“Subgroups, Interactions, and Covariates [Acknowledging that subgroup variations are of great interest and CAN be planned]. In most cases, however, subgroup or interaction analyses are exploratory and should clearly be identified as such. . . When exploratory, these analyses should be interpreted cautiously. Any conclusion of treatment efficacy (or lack thereof) or safety based on exploratory subgroup analyses is unlikely tobe accepted.
“Exploratory trials cannot be the basis of the formal proof of efficacy, although they may contribute to the total body of relevant evidence.”

4
PocockIn a very timely NEJM piece (Sept 1, 2016), Pocockand Stone addressed the issue of what to do with studies when the “primary outcome fails.” They note that there may be “reasons for hope” based on such a study, notably when a small trial “comes close” to nominal significance but they are skeptical when the overall result is “neutral” [a judgment call, of course]. “Indeed we find it hard to think of an example in which an apparent benefit in a subgroup in a trial with a negative outcome has led to confirmation in a subsequent trial.”

5
Pocock (cont)
Personally, I do not feel quite as negative, perhaps because of my “enthusiasm” for enrichment. The concept of prognostic and predictive enrichment is that there can be patient characteristics that can influence effect size, spontaneous change, variability, potential for response, etc., all of which could alter the observed overall effect of a treatment. So I would say we would encourage sponsors to look closely at what seems to be possible “responder subsets,” as PTC has done. Note, however, that such subset findings need study, not belief.

6
Fleming
In a paper in the Annals of Internal Medicine – “Clinical Trials. Discerning Hype from Substance,” Fleming illustrates the risks of unplanned subgroup analyses. In a trial of Actimmune in idiopathic pulmonary fibrosis, no significant effect was seen on progression‐free survival, the primary endpoint, or on overall mortality, but mortality “leaned” with nominal p of 0.08‐0.15, depending on who was included. In the mild‐to‐moderate subset, however, there was a marked reduction in mortality (21 vs 6), with a nominal p‐value of 0.004.
A confirmatory trial in patients with mild‐to‐moderate disease showed no effect at all.
Actimmune, 14.5% mortality vs placebo, 12.7% mortality.

7
PTC Experience
The Fleming example (and there are many more) of failing to confirm a subset finding is not a reason not to study a subset that appears to respond in a subsequent trial, especially if the subset is plausible and the finding strong. Indeed PTC’s experience with Ataluren in DMD and, as I will show, in cystic fibrosis as well, show that 1) it is possible to responsibly assess plausible subsets in a prospective trial, 2) one should “control” one’s expectations. The experience also clearly shows why a study planned to support the subset hypothesis is needed, and why as Pocock, Fleming, FDA, and many others have explained repeatedly, the subset findings are not credible on their own (perhaps with very rare exceptions).

8
PTC Experience (cont)As you have heard, the initial controlled study of Ataluren, Study 007, compared two doses of Ataluren to placebo, with a primary endpoint of change in 6 minute walking distance. There is no question that the study “leaned” in a favorable direction for the low dose (but showed no hint of an effect at the high dose undermining the “lean”), but, as explained in the division memorandum the various post‐hoc analyses, some of which led to nominal p‐values of < 0.05, were not considered statistically valid and were weakened further by the absence of effects on secondary physical function measures.
An additional post‐hoc analysis of results by baseline 6MWD suggested a larger effect in patients with baseline 6WMD of ≥ 150 m and ≤ 80% of predicted and this group was then included in Study 020. In addition, all patients had to be on corticosteroids at baseline and be 7‐16 years of age.
All this was reasonable prognostic enrichment strategy.

9
PTC Experience (cont)PTC thus responded appropriately to FDA’s refusal to file the 2011 NDA by conducting a new study (Study 020) FDA suggested in the promising subgroup identifying by analyzing data in Study 007. Unfortunately, as you have heard, Study 020 did not show a statistically significant effect on 6MWD (nominal p‐value 0.21) and the mean effect size observed was very modest (13 m), far smaller than the 46 m effect seen in the subset of Study 007 that led to the inclusion criteria for Study 020, a powerful illustration of Pocock’s observation.
For Study 020, as you have heard, PTC urges, after clear failure on the planned primary endpoint, assessment based on yet another subgroup, patients with baseline 6MWD of 300‐400 meters. I will not address their reasons here but even if they are plausible (and subset analyses almost always appear plausible), they were chosen with data in hand and are therefore potentially biased. We believe such subset results need to be studied in controlled trials, not simply accepted, as the failure of Study 020, as initially planned, demonstrates powerfully.

10
PTC Experience (cont)Of interest is PTC’s experience with Ataluren in nonsense‐mutation cystic fibrosis.
A 2014 press release reported favorable trends in a placebo‐controlled trial on FEV1 and pulmonary exacerbations, with a larger, and nominally significant, effect in patients NOT receiving aminoglycosides. This was supported by new in vitro studies showing interference of aminoglycosides with Ataluren activity.
PTC announced that they were going to conduct a confirmatory study, which they did, with results announced in March 2017. Unfortunately, no significant effect was seen (p = 0.534 for FEV1 and p = 0.401 for exacerbations).
Another reminder: Study subset effects, even plausible ones; do not just believe them.

11
Ataluren Efficacy – Overview
Veneeta Tandon, Ph.D.
Clinical ReviewerDivision of Neurology ProductsOffice of Drug Evaluation‐IOffice of New DrugsCenter for Drug Evaluation and ResearchUS Food and Drug Administration
September 28, 2017

12
Study 004: A 4‐Week Uncontrolled Dose‐Ranging Study
4/4/8 mg/kg (n = 6)10/10/20 mg/kg (n = 18)20/20/40 mg/kg (n = 12)
Age ≥ 5 years
In vivo muscle dystrophinIn vitro muscle dystrophin (cultured myotubes from
muscle biopsy)

13
Two 48‐Week Placebo‐Controlled Trials
Placebo (n = 57)10/10/20mg/kg (n = 57)20/20/40mg/kg (n = 60)
Age ≥ 5 years6MWD ≥ 75metersSteroid Use (Yes/No)
Placebo (n = 115)10/10/20mg/kg (n = 115)
Age 7 to ≤ 16 years6MWD ≥ 150 meters
Steroid Use (>6 months)
Stratification Factors (both studies): • 6‐minute walking distance (6MWD):< 350 vs ≥ 350 meters (m)• Age: < 9 vs ≥ 9 years• Steroid use: Study 007: steroids vs. no steroids
Study 020: 6‐12 months on steroids vs. ≥ 12 months on steroids
Modified to “enrich” based upon post hoc Study 007 results
Study 007 Study 020

14
Study 007
• Primary endpoint: Change in 6MWD at Week 48– Both doses negative (p = 0.15 and 0.48)– High‐dose similar to placebo
• 50 Secondary endpoints– All but two endpoints negative for both doses– High‐dose similar to placebo for all endpoints
Based on post hoc assessment, applicant postulated that the failure of the high‐dose to show a trend towards benefit is related to an “inverted U” shaped dose‐response – this hypothesis is discussed later in the FDA presentation.

15
Study 007: Post Hoc Analyses
• Different statistical methods – Refined mixed model repeat measure (MMRM) analysis with the addition of baseline 6MWD and visit interaction term on untransformed data
– Permutation test on refined MMRM
• Different study population– Changed baseline values of 2 patients because of injuries affecting assessments
• Basis of 2011 NDA

16
Study 007: Additional Post Hoc Analyses
• “Ambulatory Decline Phase (ADP)” population• Defined as:
o Age ≥ 7 and ≤ 16 yearso 6MWD ≥ 150 meters and ≤ 80% predicted at baseline
o Steroid use (> 6 months)
17
Study 020• Empirically enriched to match enrolled patients to the “ADP” subgroup from Study 007
• Three times the size of the “ADP” subgroup in Study 007 (n = 230 vs. n = 63) for the low dose
• Evaluated only the low dose of ataluren from Study 007 (10/10/20 mg/kg)
Despite enrichment and the larger sample size:
• Primary endpoint: change from baseline 6MWD at Week 48 negative (p=0.21)
• Secondary endpoints: All but one were nominally negative

18
Applicant’s Explanation of the Failure of Study 020
“Despite efforts to enrich for patients in the ambulatory decline phase of the disease, the Study 020 population remained heterogeneous”
“…mean baseline 6MWD higher in this study [compared to Study 007], therefore Study 020 failed to enrich for patients in the ambulatory decline phase of the population”
FDA analysis suggests that these factors do not explain the failure of Study 020

19
Study 020 Nine Subgroups Analyzed
• Exploratory (study failed on primary analysis)• No plan for multiple comparisons (no control of type 1 error)
• One out of 9 subgroups nominally positive– Patients with baseline 6MWD 300 to < 400 m– Additional post hoc analysis of these new subgroups in Study 007
– Basis of 2015 NDA

20
Ataluren Efficacy Statistical Review
Xiang Ling, Ph.D.
Senior Staff FellowDivision of Biometrics IOffice of BiostatisticsOffice of Translational SciencesCenter for Drug Evaluation and ResearchUS Food and Drug Administration

21
Study 007: Primary Endpoint of Week 48 Change in 6MWD
Analysis Method Transforma‐tion
Low Dose vs Placebo High Dose vs Placebo
∆ (meters)
Nominalp‐value
Adjusted p‐value*
∆(meters)
Nominalp‐value
Adjusted p‐value*
Primary AnalysisMMRM
Ranks(primary) ‐‐ 0.15 0.30 ‐‐ 0.48 0.48None 26.4 0.09 0.16 ‐0.1 1.00 1.00
* Adjusted for testing two doses; Holm’s method for adjusting p‐values was specified for analyses on rank‐transformed data, and Dunnett's method was specified for analyses on untransformed data. Abbreviation: 6MWD = 6‐minute walking distance, MMRM = mixed‐model repeated‐measures
www.fda.gov
• The primary analysis did not show a statistically significant treatment difference for the low dose compared to placebo.
• There was virtually no treatment difference between the high‐dose group and placebo.

22
Study 007: Specified Sensitivity Analyses for the Primary Endpoint if the Primary Analysis had been Positive (Exploratory)
Analysis Method Transforma‐tion
Low Dose vs Placebo High Dose vs Placebo
∆ (meters)
Nominalp‐value
Adjusted p‐value*
∆(meters)
Nominalp‐value
Adjusted p‐value*
Primary AnalysisMMRM
Ranks(primary) ‐‐ 0.15 0.30 ‐‐ 0.48 0.48None 26.4 0.09 0.16 ‐0.1 1.00 1.00
Additional Analyses on 6MWD (exploratory)
ANCOVA with LOCFRanks ‐‐ 0.16 0.32 ‐‐ 0.41 0.41None 28.4 0.04 0.08 ‐0.7 0.96 1.00
Permutation TestNone ‐‐ 0.08 0.15 ‐‐ 1.00 1.00
* Adjusted for testing two doses; Holm’s method for adjusting p‐values was specified for analyses on rank‐transformed data, and Dunnett's method was specified for analyses on untransformed data. Abbreviation: ANCOVA = analysis of covariance, LOCF = last observation carried forward
www.fda.gov

23
Study 007: Secondary Endpoints
• No type I error control specified for testing secondary endpoints
• Over 50 secondary endpoints were explored
• Nominal statistical significance was reported for only two of them (10% Worsening in 6MWD, Accidental Falling)– Nominal statistical significance means that the p‐value of the test is
less than 0.05, without adjusting for multiple comparisons involving multiple endpoints and multiple doses.
www.fda.gov

24
Study 007: Secondary Endpoints for Timed Function Tests
Transforma‐tion
Low Dose vs Placebo High Dose vs Placebo∆
(seconds)Nominal p‐value
∆ (seconds)
Nominal p‐value
4‐Stair climb Ranks ‐‐ 0.10 ‐‐ 0.34None ‐2.4 0.04 ‐1.3 0.27
4‐Stair descend Ranks ‐‐ 0.43 ‐‐ 0.67None ‐1.6 0.20 ‐1.0 0.41
10‐Meter run/walk
Ranks ‐‐ 0.70 ‐‐ 0.73
None ‐1.1 0.32 ‐0.3 0.80
Supine to standRanks ‐‐ 0.42 ‐‐ 0.74None ‐0.0 0.98 ‐0.2 0.88
Pre‐specified analyses method: MMRM on rank‐transformed dataNegative delta indicates improvement relative to placebo.
www.fda.gov
• 4 endpoints, with rank‐transformed and untransformed data, for both doses• Nominal significance seen for 1 of 16 tests
25
Study 007: “Ambulatory Decline Phase” Subgroup
• The applicant identified a post hoc subgroup that showed a numerically larger treatment effect (44 meters, nominal p‐value =0.05) in Study 007
• This subgroup, referred to as the “Ambulatory Decline Phase” (ADP) subgroup, was defined by 3 factors
– aged ≥7 to ≤16 years – 6MWD ≥150 meters to ≤80%‐predicted for age and height– Steroid use ≥6 months
www.fda.gov
26
Study 020: Design Features
• Subsequently, a large phase 3 study was designed to enrich the “Ambulatory Decline Phase” population
– The enrollment criteria of study 020 included these three factors
– Patients were randomized only to low dose of ataluren or placebo
– N=115 per group: twice the size of study 007, and over 3 times the size of study 007 “Ambulatory Decline Phase” subgroup
www.fda.gov

27
Study 020: Primary Endpoint of Week 48 Change in 6MWD
• Failed to reach statistical significance
– P‐value =0.21, ANCOVA with multiple imputation (MI)
• Numerical treatment difference much smaller
– 13 meters for Study 020 vs. 44 meters for Study 007 “Ambulatory Decline Phase” subgroup
www.fda.gov

28
Applicant’s Explanation of the Failure of Study 020
• 80% of predicted 6MWD inclusion criteria was set too high to adequately exclude stable patients
• mean baseline 6MWD was 23 meters higher in Study 020 than in the Study 007 “Ambulatory Decline Phase” subgroup
An FDA analysis attempting to create a group matched closer to the Study 007 “Ambulatory Decline Phase” subgroup• The most stable patients were excluded so that the mean baseline
6MWD for this subgroup was similar to the Study 007 “Ambulatory Decline Phase” subgroup
• The resulting numerical difference between ataluren and placebo was similar (15 meters, nominal p‐value =0.23) to the primary analysis
www.fda.gov

29
∆ (seconds) Nominal p‐value
4‐Stair descend ‐1.8 0.01
4‐Stair climb ‐1.8 0.06
10‐Meter walk/run ‐1.2 0.12
Study 020: Secondary Endpoints (Exploratory)
• Time to 10% persistent worsening in 6MWD– Hazard ratio = 0.75 (nominal p‐value =0.16, Cox regression)
• Timed Function Tests
Analysis method: ANCOVA with multiple imputation
www.fda.gov

30
Study 020: Exploratory Subgroup Analyses of the Primary Endpoint
www.fda.gov
Subgroup
n (%) Ataluren vs Placebo
Placebo Ataluren ∆ (95%CI) Nominalp‐value
Baseline 6MWD<300 m 21 (18) 24 (21) ‐8 (‐55, 40) 0.75
≥300 to <400 m 52 (46) 47 (41) 43 (12, 74) 0.01
≥400 m 41 (36) 43 (38) ‐10 (‐43, 24) 0.58
Baseline 6MWD<350 m 41 (36) 41 (36) 22 (‐12, 56) 0.21
≥350 m 73 (64) 73 (64) 8 (‐18, 33) 0.54
• No type I error control specified for testing subgroups• Only 1 subgroup was nominally significant

31
* Negative delta indicates improvement relative to placebo.+ Positive delta indicates improvement relative to placebo.
Endpoint<300m ≥300 to <400m ≥400m
∆ Nominal p‐value ∆ Nominal
p‐value ∆ Nominal p‐value
10‐meter walk/run * ‐2.8 0.066 ‐1.8 0.066 0.2 0.848
4‐stair climb* ‐0.5 0.790 ‐3.5 0.003 0.2 0.893
4‐stair descend * ‐1.0 0.595 ‐4.4 <0.001 ‐0.1 0.917
Total NSAA+ 0.4 0.760 1.7 0.037 ‐0.1 0.896
Linear NSAA+ 0.7 0.837 4.3 0.041 ‐1.1 0.637
Study 020: Exploratory Subgroup Analyses of the Secondary/Exploratory Endpoints
www.fda.gov

32
• Greater treatment differences in Study 007 compared to Study 020 for the low dose• Inconsistent direction of treatment difference in the <300m and ≥400m subgroups
www.fda.gov
Mean Difference for Ataluren over Placebo on Week 48 Change
6MWD Results by Baseline 6MWD Category (Study 007 and 020)

33
• Both studies failed to demonstrate that ataluren has a treatment effect on the primary endpoint, change in 6MWD at Week 48. – There was no treatment difference between the high‐dose group and placebo in Study 007.
– In Study 007, the adjusted p‐value of the low‐dose group was in the range of 0.08 to 0.32.
– In Study 020, numerical treatment difference =13 meters (p‐value =0.21).
Summary
www.fda.gov

34
• The data suggested a signal of treatment effect for the low‐dose ataluren.– Both studies showed a statistically non‐significant numerical trend in the primary analysis favoring the low‐dose ataluren.
– In the subgroup of baseline 6MWD ≥300 to <400 meters, a numerical treatment difference on 6MWD was seen in both studies (43 and 51 meters). A numerical treatment difference was seen on most of the Timed Function Tests in Study 020.
Summary
www.fda.gov

35
Summary
• However, these results were difficult to interpret.– The high dose did not have a favorable trend.
– Multiplicity adjustment was not specified for testing the ≥300 to <400‐meter subgroup in Study 020. This subgroup was the only one reaching nominal significance, out of 9 pre‐specified subgroups.
– The numerical treatment difference on 6MWD was not similar, 44 meters in Study 007 versus 13 meters in Study 020, in ambulatory decline phase patients.
www.fda.gov

36
Ataluren Efficacy – Key Considerations
Veneeta Tandon, Ph.D.
Clinical ReviewerDivision of Neurology ProductsOffice of Drug Evaluation‐IOffice of New DrugsCenter for Drug Evaluation and ResearchUS Food and Drug Administration

37
Ataluren Efficacy – Key Considerations
• Prognostic factors for DMD clinical studies
• North Star Ambulatory Assessment analyses (NSAA)
• Post hoc pooled analyses
• Relevance of nonsense mutation cystic fibrosis (nmCF) development program

38
Prognostic Factors for DMD Clinical Trials
• There are many known prognostic factors in addition to 6MWD
– Corticosteroid use/duration of use, age, and 6MWD at baseline together only account for about 30% of the variability in 6MWD progression (Goemans 2016).
• Adding multiple other factors to a prediction model (rise time, 10‐meter walk run, 4‐stair climb, height, and weight) still only accounts for about 60% of the variability in 6MWD progression (Goemans 2016).
• Many “attractive” and seemingly logical patient subgroups could be defined based on these factors

39
Prognostic Factors for DMD Clinical Trials
• The use of prognostic factors to enrich DMD clinical trials is an evolving science.
• Without prospective testing, there is no way to be confident that the exploratory results in the 300 to < 400 meter subgroup are attributable to drug. Other known or unknown factors, or chance alone, may explain these results.

40
Exploratory Analysis North Star Ambulatory Assessment (NSAA)
• Exploratory endpoint in Study 020
• Both pre‐planned analyses of the NSAA, using ordinal and transformed linear scores, were nominally negative (p = 0.13 and p = 0.27, respectively)
• Applicant presented an additional post hoc analysis of the individual NSAA items

41
Post Hoc NSAA AnalysesPost hoc, the applicant notes that more placebo‐treated patients declined from a score of 2 or 1 to 0 in most items, compared to ataluren patients
0 5 10 15 20 25 30
Climb box step ‐ left ScoreClimb box step ‐ right Score
Descend box step ‐ left ScoreDescend box step ‐ right Score
Gets to sitting ScoreHop left leg Score
Hop right leg ScoreJump Score
Lifts head ScoreRise from floor Score
Run (10m) ScoreStand on one leg ‐ left Score
Stand on one leg ‐ right ScoreStand Score
Stand up from chair ScoreStands on heels Score
Walk (10m) score
Number of Patients Declining from 2 or 1 to 0
PlaceboAtaluren
2= Perform1= Perform with difficulty0= Unable

42
Declines in NSAA Items from 2 to 1 Favored Placebo
For 10 items, there were more declines in ataluren‐treated patients than in placebo‐treated patients; For 2 items, there were more declines in placebo‐treated patients than in ataluren‐treated patients.
0 5 10 15 20 25 30
Climb box step ‐ left ScoreClimb box step ‐ right Score
Descend box step ‐ left ScoreDescend box step ‐ right Score
Gets to sitting ScoreHop left leg Score
Hop right leg ScoreJump Score
Lifts head ScoreRise from floor Score
Run (10m) ScoreStand on one leg ‐ left Score
Stand on one leg ‐ right ScoreStand Score
Stand up from chair ScoreStands on heels Score
Number of Patients Declining from 2 to 1
Placebo
Ataluren
2= Perform1 = Perform with difficulty

43
Declines in NSAA Items from 2 to 1 Favored Placebo
Post hoc analyses: The results depend on a number of details that are selected with data in hand.
0 5 10 15 20 25 30
Climb box step ‐ left ScoreClimb box step ‐ right Score
Descend box step ‐ left ScoreDescend box step ‐ right Score
Gets to sitting ScoreHop left leg Score
Hop right leg ScoreJump Score
Lifts head ScoreRise from floor Score
Run (10m) ScoreStand on one leg ‐ left Score
Stand on one leg ‐ right ScoreStand Score
Stand up from chair ScoreStands on heels Score
Number of Patients Declining from 2 to 1
Placebo
Ataluren
2= Perform1 = Perform with difficulty

44
Pooled Analyses
• Post hoc unblinded pooled analysis:– ITT population of Study 007 + ITT of Study 020
• Negative results from two prospective clinical trials cannot be negated by a post hoc unblinded pooled analysis.
• This pooled analysis also combines different populations in terms of steroid use, age, and baseline 6MWD.
• These analyses can also be considered hypothesis generating.

45
Relevance of Ataluren Development Program in nmCystic Fibrosis
• Ataluren reported to be able to read through all nonsense mutations
• Phase 3 trial in 232 patients was negative– Post hoc trends favoring ataluren and a subgroup of patients not treated with aminoglycosides appeared to benefit the most
• A second Phase 3 study in 279 patients to prospectively test this post hoc hypothesis by excluding patients on aminoglycosides also negative
• Emphasizes the need to prospectively test even logical exploratory analyses

46
Hypothesis of “Inverted‐U” Shaped Dose‐Response
• Extremely rare when drugs are effective• The applicant suggests that there is a “inverted‐U” shaped dose‐response with:
– An exposure‐response analysis of Study 007– In vitro and in vivo dystrophin data (clinical and nonclinical)
• The FDA does not find these data supportive

47
Evaluation of the Hypothesis of an “Inverted‐U” Shaped Exposure‐Response
Relationship of Ataluren
Venkatesh Atul Bhattaram, Ph.D.
Senior Staff FellowDivision of PharmacometricsOffice of Clinical PharmacologyOffice of Translational SciencesCenter of Drug Research and EvaluationUS Food and Drug Administration

48
Exposure‐Response Analysis• The applicant presents the results of an exposure‐response analysis in the high‐dose ataluren arm from Study 007 that it suggests show that drug concentrations of 19.3 g/mL or more are associated with results that are almost identical to the placebo group
• This finding is intended to support an “inverted‐U” shaped dose‐response
• An Agency analysis indicates that any differences based on this 19.3 µg/mL cut‐off are likely due to baseline imbalances and do not support an “inverted‐U” shaped dose‐response

49
Differences in 6MWD at 48 Weeks by Concentration Groups in High‐dose are Due to
Imbalances in Baseline Variables
Better Perform
ance
High
Concen
tration
Placeb
o Low
Concen
tration
(High)
(Low)

50
Differences in 6MWD at 48 Weeks by Concentration Groups in High‐dose are Due to
Imbalances in Baseline Variables
Better Perform
ance
High
Concen
tration
Placeb
o Low
Concen
tration
(High)
(Low)

51
Differences in Rise Time at 48 Weeks by Concentration Groups in High‐dose are Due to
Imbalances in Baseline Variables
Better Perform
ance
Time to Rise from
Sup
ine Po
sitio
n, se
cond
s
Low
Concen
tration
Placeb
o
High
Concen
tration
(High)
(Low)

52
Differences in 10 m Walk/Run Time at 48 Weeks by Concentration Groups in High‐dose are Due to
Imbalances in Baseline Variables
Better Perform
ance
Low
Concen
tration
Placeb
oHigh
Concen
tration
(High)
(Low)

53
Differences in 4 Stair Climb Time at 48 Weeks by Concentration Groups in High‐dose are Due to
Imbalances in Baseline Variables
Better Perform
ance
Low
Concen
tration
Placeb
o
High
Concen
tration
(High)
(Low)

54
Differences in 4 Stair Descent Time at 48 Weeks by Concentration Groups in High‐dose are Due to
Imbalances in Baseline Variables
Better Perform
ance
Low
Concen
tration
Placeb
o
High
Concen
tration
(High)
(Low)

55
Conclusion
• The analysis conducted by the applicant does not support the hypothesis of an “inverted‐U” shaped dose‐response relationship for ataluren.
• Apparent relationships between ataluren concentrations and clinical endpoints in Study 007 are confounded by baseline imbalances.

56
Ashutosh Rao, Ph.D.
ChiefLaboratory of Applied BiochemistryDivision of Biotechnology Review and Research IIIOffice of Biotechnology ProductsOffice of Pharmaceutical QualityCenter of Drug Research and EvaluationUS Food and Drug Administration
Limitations of the Bioassays Used for Dystrophin in Studies 004 and 007

57
Dystrophin Immunohistochemistry (IHC) Assays Used in Study 004 or 007
• In vitro analyses of patient‐derived and cultured myotubes exposed to ataluren.
• In vivo analyses of patient biopsies from extensor digitorium brevis (EDB) muscles from nmDMD patients.
58
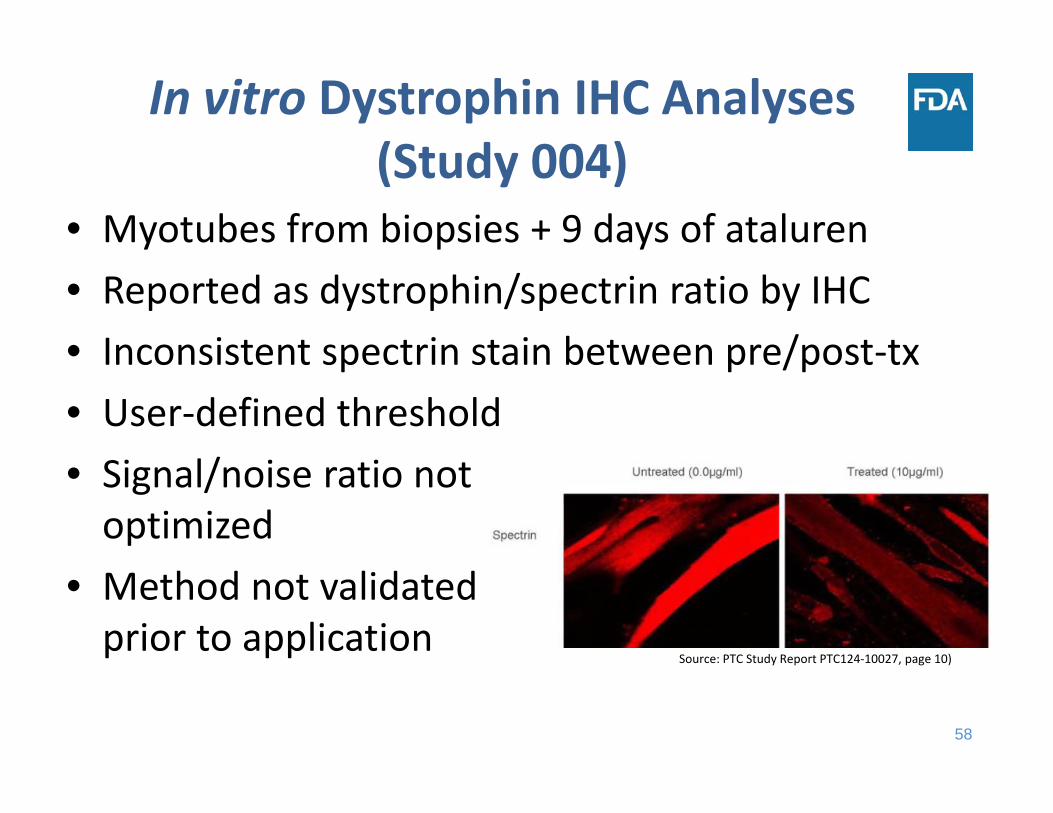
In vitro Dystrophin IHC Analyses (Study 004)
• Myotubes from biopsies + 9 days of ataluren• Reported as dystrophin/spectrin ratio by IHC• Inconsistent spectrin stain between pre/post‐tx • User‐defined threshold• Signal/noise ratio not optimized
• Method not validated prior to application
Source: PTC Study Report PTC124‐10027, page 10)
59
In vivo Dystrophin IHC Analyses (Study 004)
• Measured with day 28 patient biopsies• Applicant chose cut‐off intensity >30% to exclude “revertant fibers” but method cannot differentiate between drug‐induced and revertant fiber dystrophin
• 39% of samples have negative intensity• High variability in intensity and number of samples/group
• Study not blinded

60
Dystrophin Bioassays (Study 007)
• Biopsies from biceps brachii • Dystrophin data largely uninterpretable because there were only 21.6% samples (74/342) without freezing artifacts (Study report, PTC124_gd‐007, Table 1)
• 36% (123/342) samples had mild to moderate freezing artifact and 42.4% (145/342) samples had severe freezing artifacts.

61
• The dystrophin bioassay methods were not standardized, validated, or objectively performed to allow reliable and quantitative interpretation of dystrophin protein levels.
Summary of Dystrophin Bioassay Assessment

62
Nonclinical and In vitro Dystrophin Models
James L. Weaver, Ph.D.
Research PharmacologistDivision of Applied Regulatory ScienceOffice of Clinical PharmacologyOffice of Translational SciencesCenter of Drug Research and EvaluationUS Food and Drug Administration

63
Key Studies to Support a “Inverted‐U” Shaped Dose Response
• In vitro measurement of dystrophin expression in myotubes cultured from biopsies of 35 of 38 nmDMD patients
• In vivo measurement of dystrophin expression in biopsies of the same 38 nmDMD patients
• In vitro measurement of dystrophin expression in myotubes from mdx mice
• In vitro and in vivomeasurement of iduronidaseactivity in nmHurler mouse model
www.fda.gov

64
In vitro and In vivo Dystrophinfrom patient‐derived myotubes or patient biopsies, as detected by immunofluorescence
• In vitro study – 9 days• In vitro differentiated myotubes which are different from mature myocytes in vivo• Dystrophin detection by immunofluorescence used as the sole endpoint• Multiple serious issues with the design and conduct of the immunofluorescence assay
• In vivo study – 28 days• As stated by the sponsor, there was no correlation between ataluren exposure
(Cmax on Day 27) and in vivo dystrophin change (Day 28 vs control)• Dystrophin detection was by immunofluorescence with the same method used for
the in vitro myotubes study• Analysis of individual patient data also failed to reveal any relationship• Examining dystrophin expression vs Cavg (average exposure to mimic the constant
drug exposure in vitro) also revealed no correlation
• Conclusion: these two studies using samples from the same patients produced divergent results. We conclude that these experiments did not produce interpretable data.
www.fda.gov

65
Major Limitations of Other Studies
• In vitro measurement of dystrophin in myotubes from mdx mice – Dystrophin evaluation by immunofluorescence was fully subjective, no
objective quantitation was reported– The dose response plot shows only one data point per concentration level
and therefore lacks replicates enabling statistical evaluation
• In vitro and in vivo measurement of iduronidaseactivity in nmHurler mouse model – As illustrated by the ongoing literature debate, ataluren’s mode of action and
efficacy can change greatly from target to target – Therefore the dose response relationship from one target (iduronidase)
cannot be extrapolated to another target (dystrophin)
www.fda.gov

66
Summary
• These studies have significant technical and design issues resulting in data that cannot be interpreted
• Thus, there is no evidence to support an “inverted‐U” shaped dose‐response for ataluren in nmDMD
www.fda.gov

67
No Data Supportive of “Inverted‐U” Shaped Dose‐Response of
Ataluren• Dr. Bhattaram: Baseline patient imbalances may explain the performance differences within the high‐dose group that are attributed by the applicant to the high vs. low drug concentrations in the high‐dose group of Study 007
• Dr. Rao: There are multiple major issues with the design, validation, and conduct of the immunofluorescence assay intended to measure dystrophin protein levels
• Dr. Weaver: Due to multiple issues with experimental design and performance, the studies presented by the applicant to support the “inverted U” shaped curve could not be interpreted
www.fda.gov

68
FDA Summary
Nick Kozauer, M.D.
Clinical Team LeaderDivision of Neurology ProductsOffice of Drug Evaluation‐I
Office of New DrugsCenter for Drug Evaluation and Research
US Food and Drug Administration
September 28, 2017

69
Study 007
• Both doses negative when compared to placebo
• “Inverted‐U” shaped dose‐response not supported
• Post hoc analyses that changed the analysis methods and population
• FDA refused‐to‐file 2011 NDA

70
Study 020
• Enriched based on the post hoc “ADP” subgroup from Study 007
• Negative despite larger size

71
Study 020
• 9 exploratory subgroups, 5 based on 6MWD
• Findings in the 300 to < 400m 6MWD subgroup, although they may appear logical, can be misleading
• Post hoc subgroup analyses from Study 007 cannot be supportive
• Post hoc pooled analyses cannot be supportive

72
Conclusions
• Exploratory analyses from negative trials can generate hypotheses
• Such hypotheses need to be prospectively tested
• We support the applicant’s ongoing evaluation of the efficacy of ataluren based on the exploratory findings from Study 020