Robert T. Croyle, Ph.D. - National Cancer Institute T. Croyle, Ph.D. Director DCCPS NCI’s bridge...
69
Robert T. Croyle, Ph.D. Director DCCPS NCI’s bridge to public health research, practice, and policy
Transcript of Robert T. Croyle, Ph.D. - National Cancer Institute T. Croyle, Ph.D. Director DCCPS NCI’s bridge...

Robert T. Croyle, Ph.D. Director DCCPS
NCI’s bridge to public health research, practice, and policy
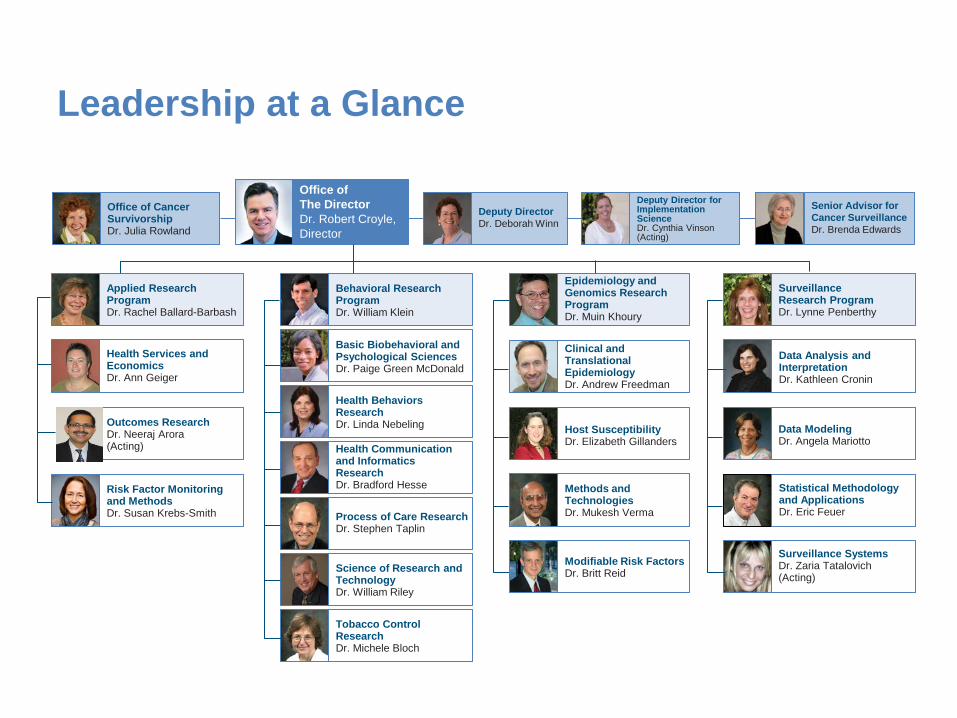
Leadership at a Glance
Office of The Director Dr. Robert Croyle, Director
Office of Cancer Survivorship Dr. Julia Rowland
Health Services and Economics Dr. Ann Geiger
Outcomes Research Dr. Neeraj Arora (Acting)
Risk Factor Monitoring and Methods Dr. Susan Krebs-Smith
Behavioral Research Program Dr. William Klein
Process of Care Research Dr. Stephen Taplin
Basic Biobehavioral and Psychological Sciences Dr. Paige Green McDonald
Health Communication and Informatics Research Dr. Bradford Hesse
Health Behaviors Research Dr. Linda Nebeling
Tobacco Control Research Dr. Michele Bloch
Science of Research and Technology Dr. William Riley
Applied Research Program Dr. Rachel Ballard-Barbash
Clinical and Translational Epidemiology Dr. Andrew Freedman
Modifiable Risk Factors Dr. Britt Reid
Methods and Technologies Dr. Mukesh Verma
Host Susceptibility Dr. Elizabeth Gillanders
Epidemiology and Genomics Research Program Dr. Muin Khoury
Surveillance Research Program Dr. Lynne Penberthy
Surveillance Systems Dr. Zaria Tatalovich (Acting)
Data Analysis and Interpretation Dr. Kathleen Cronin
Data Modeling Dr. Angela Mariotto
Statistical Methodology and Applications Dr. Eric Feuer
Deputy Director Dr. Deborah Winn
Deputy Director for Implementation Science Dr. Cynthia Vinson (Acting)
Senior Advisor for Cancer Surveillance Dr. Brenda Edwards

$0
$100
$200
$300
$400
$500
$600
$700
1998 1999 2000 2001 2002 2003 2004 2005 2006 2007 2008 2009 2010 2011 2012 2013
Dol
lars
- M
illio
ns
Contracts and IAA (FMP) Center/Cancer Control Grants Operations (FMP)
Total RPG Funding ARRA Funding FDA Funding
DCCPS Funding FY98-FY13

FY13 Distribution of Grants and Funding by Mechanism
R01 59%
R03 14%
R21 12%
U01 6%
P50 2%
R13 1%
U54 1% P01
1% UM1 1%
U19 1%
Others* 2%
Distribution of FY13 Grants by Mechanism (n=821)
R01 56%
U01 9%
P50 9%
P01 6%
UM1 5%
R21 4%
U19 4%
U54 3%
R03 2%
U24 1%
R37 1%
Others* 1%
Distribution of DCCPS FY13 Funding by Mechanism (Total Dollars=$443.6M)
Others= mechanisms with less than 1% total dollars and number of grants

DCCPS FY13 Highlights METRIC DESCRIPTION
$450 M
The DCCPS grant portfolio included approximately 800 grants valued at nearly $450 million, with work in the US and more than 40 countries aimed to reduce risk, incidence, and deaths from cancer, and to enhance the quality of life for cancer survivors.
239
DCCPS funded 239 new grants -- an increase in awards from the previous fiscal year. The breadth of research supported by DCCPS includes surveillance, epidemiology, health services, behavioral science, and cancer survivorship
37
The division provided funding support to 37 new investigators. DCCPS provides information, tools, and resources to help new grantees successfully manage their grants and advance their careers
13 In addition to encouraging the best scientific ideas through investigator-initiated grant applications, DCCPS led and contributed to 13 trans-NIH funding announcements in FY13 to encourage research projects in emerging or priority areas
18,500
The NCICancerCtrl Twitter channel gathered more than 18,500 followers in 2013, who scan our tweets to stay informed about cancer control news from NCI. The channel is one of the top 3 most followed of NCI’s 23 Twitter accounts.
50
In addition to the nearly 1,000 valued investigators whose research the division funds, DCCPS collaborates with nearly 50 collaborators and partners.

NCI Scientific Program Leadership Group (SPL)
• Rigorous stewardship of limited resources • Complement peer review to select the best research • Minimize duplication and overlap (esp. vs. other
recently approved grants) • Ensure appropriate mechanism to achieve goals • Facilitate coordination of research across NCI divisions • Enables the senior leaders to maintain a fuller
understanding of the entire NCI portfolio • Ensure that all levels of program leadership are
engaged in scientifically informed funding decisions

NCI's Grant Selection Process
• In 2013, most R01 applications with scores up to the 9th percentile were funded.
• Applications with higher scores subject to branch, program, divisional and Scientific Program Leaders (SPL) review.
• Selection of grant applications for funding by exception • Not by an absolute payline- instead by individual
consideration • The NCI awarded 1,095 competing Research Project
Grants (RPGs), resulting in a final success rate of 14%.

NCI FY2013: All Investigators: Experienced, New and Early Stage

NCI FY2013 Competing R01 Applications and Awards: New Investigators (Includes Early Stage Investigators)

NIH Research Project Grants Competing applications, awards, and success rates

A 3-Pronged Strategy for DCCPS
• Focused scientific initiatives in key domains to advance knowledge
• Expand scope and effectiveness of interagency collaboration
• Develop, enhance, and expand infrastructures to enable next-gen cancer control and population science

Enabling Next-Generation Cancer Control:
Our Research and Programs Need to be:
• Faster
• Cheaper • Bigger • Better

Doing More with Less
• Bad news: shrinking budget • Better news: improvements in infrastructure,
capacity, technology, and availability of data • Increasing capacity to do more, in less time • Remarkable early wins in all of our four
domains…faster, cheaper, bigger, better • But, challenges remain

Faster
• High-throughput technology for omics • DIY surveys (e.g. SurveyMonkey, REDCap,
Qualtrics) • Electronic data capture and processing • On-line interactive data tools (e.g. SEER*stat) • Web-enabled rapid RCTs • Tools to accelerate research translation

The future landscape of electronic data capture in cancer registries
Central Cancer Registry
Hospitals • Pathology Lab • Diagnostic
Imaging • Radiation
Oncology • Chemotherapy • Surgery • Etc.
Physician Offices • Cancer Event
Report
Free-standing Clinics • Radiation
Oncology • Chemotherapy • Radiology

E-Path Reporting Sites
14 SEER registries 318 Sites (229/278 production, 49/278 installing, +40 subsidiaries)
~1,300,000 positive pathology reports delivered annually
21(8)
3(1)
27(6)
18(4)
40(1)
7(2) 12(4)
4(3)
5(1)
16(3)
32(8)
4(2)
34(6) 6(0)
7 sites in production (2 installing/testing)
+1
+5
+4
+1
+4
+5
+5
+5
+4
+1
+4 +1
5 subsidiaries in production

E-Path Functionality and Benefits
• Rapid case identification, high quality data, standardization of data, more complete reporting
• Sensitivity (Ability to Detect Selectable Reports)
and Specificity (Ability to Detect Non-Selectable Reports) both in the range of 99.4-99.6%
• When used as part of a Rapid Case Ascertainment system, can deliver cases to researchers in less than 30 days from date of diagnosis


Example: Rapid Testing Using the Internet
Source: McClure JB, Shortreed SM, Bogart A, et al. The effect of program design on engagement with an internet-based smoking intervention: randomized factorial trial. J Med Internet Res. 2013;15(3):e69.
New Web-enabled Methodologies (e.g., Multiphase Optimization Strategy, or MOST) enable researchers to do research more quickly, cheaply, and more efficiently.


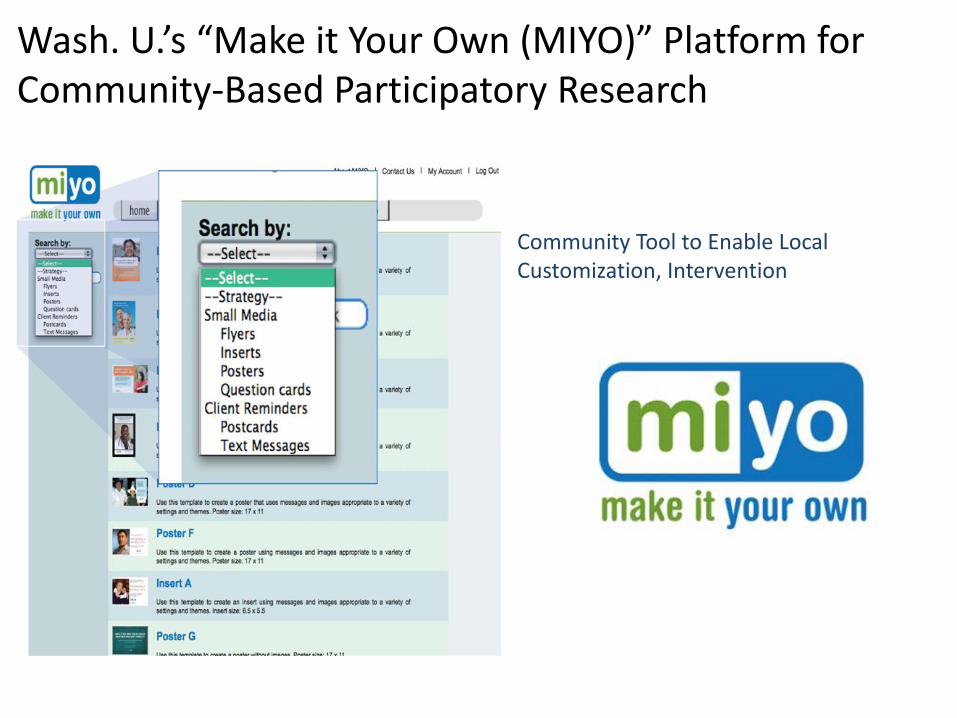
Wash. U.’s “Make it Your Own (MIYO)” Platform for Community-Based Participatory Research
Community Tool to Enable Local Customization, Intervention


ASCO CANCER*LINQ: A Learning Oncology System

Cheaper
• Lower unit costs • Reduce labor costs
– e.g. Amazon’s Mechanical Turk – Reduce interviewer time
• Use existing data

Wetterstrand KA. DNA Sequencing Costs: Data from the NHGRI Genome Sequencing Program (GSP) Available at: www.genome.gov/sequencingcosts. Accessed [10-21-13].

Wetterstrand KA. DNA Sequencing Costs: Data from the NHGRI Genome Sequencing Program (GSP) Available at: www.genome.gov/sequencingcosts. Accessed [10-21-13].

Automated Self-Administered 24-hour Dietary Recall (ASA24)

• Freely available web-based tool for collecting high-quality dietary intake data
• Since September 2009 – Released beta, ASA24-2011, ASA24-Kids-2012 – Registered over 800 studies – Collected over 113,000 recalls – ASA24-3013 soon to be released
• Adaptations: Canada (underway); Australia (under consideration)
• Mobile device version currently under development

SEER-Medicare • What’s available now?
– Clinical, demographic, and death information on 1.6 million cancer cases from SEER
– Health care services from Medicare, beginning in 1991
– 5% random sample of Medicare enrollees without cancer
• Expanding available data – 4 years of Medicare Part D
information – More diversified analyses
(e.g., hospice and provider level data)
– Plans to integrate census data

Recent Pubs… • 13 SEER-Medicare publications from Oct 1 to
22, 2013 – Contraindicated use of bevacizumab and toxicity
in elderly patients with cancer (Hershman DL et al., J Clin Oncol)
– Influence of patient, physician, and hospital factors on 30-day readmission following pancreatoduodenectomy in the US (Hyder O et al., JAMA Surg)
– Practices that reduce Latina survival disparity after breast cancer (Smith-Gagen J et al., J Womens Health)

• Beyond the Medicare Population – Cancer Research Network
• All age groups • Pre-diagnostic data on the “whole patient” • Information on ~25% of Medicare enrollees who do not
have claims because they are part of managed care plans
• Screening Processes and Outcomes – Population-based Research Optimizing Screening
through Personalized Regimens (PROSPR) • Diverse range of delivery systems • Incorporate additional physician, facility, and system data

As of January 2, 2014 1. 88,418 datasets 2. 65,378 data sets posted in past 12 months (908 by
HHS)
• 1,875,270 visitors in past 12 months • Too overwhelming? Try healthdata.gov

Huge, Ongoing Challenge:
• How to support submission, storage, curation, access, and user support for data NOT collected by the federal government

Bigger
• Larger sample size for statistical power • Consortia to enable collaboration and raise
scientific ambition • Expanded population coverage • Linked datasets to provide more
comprehensive data per subject • A larger environmental context • Greater reach of interventions

Network of Cancer Consortia (NOCC)• Evidence of an existing collaborative
superstructure between scientific teams in the field of cancer epidemiology.
Scientific research teams were mapped using the co-membership of investigators in multiple distinct teams.
This network indicates characteristics of a “small world” network, which exhibit enhanced signal-propagation and synchronization properties for transferring information.
These findings suggest NOCC provides an efficient framework for the dissemination of knowledge, methodologies, and discoveries within cancer epidemiology accelerating the translation of research results.
•
•
•
Consortia Co-Membership Network

Number of Cancer Epidemiology Consortia Papers in Scientific Areas by Year
0
20
40
60
80
100
120
140
160
180
200
220
1996 1997 1998 1999 2000 2001 2002 2003 2004 2005 2006 2007 2008 2009 2010 2011
Genomics EL MT ME CT BIO RS BR
Michael R. Burgio Jr., John P.A. Ioaniddis, Brett M. Kaminski, et al. Collaborative Cancer Epidemiology in the 21st Century: the Model of Cancer Consortia. CEBP. 2013 Sep 19 [Epub ahead of print]

EGRP-associated Cancer Epidemiology Cohorts: Population Characteristics
Enro
llmen
t (E
GRP
supp
orte
d CE
Cs)
No. of participants (thousands)
0 200 400 600 800 1000 1200 1400 1600 1800 2000
Hispanic
Asian
Black
White
Females
Males
Total enrollment
2003 2013

A Comprehensive Genetic Analysis of Common Cancer Risk Through the Development of the
OncoArray Network
The GAME-ON Initiative

Aims of OncoArray Network
• Genotyping of 210,000 cancer cases and 200,000 controls using a set of 600,000 markers. Define the effects of genetic factors in multiple ethnic groups and evaluate gene-gene effects.
• Meta-analysis jointly evaluating risk to identify shared and cancer-specific risks for common cancer development.
• Detailed fine mapping of established loci from each cancer site to identify candidate functional and causative variants.
• Integrative analyses that allow us to partition competing risk for common cancers, allowing for effects from genetic and environmental factors that are measured across sites.

Summary
• By genotyping a very large number of samples on the same platform we can identify variants that influence common cancers
• Common platform facilitates gene-gene interaction studies
• Low cost and high throughput platform facilitates additional studies

www.teamsciencetoolkit.cancer.gov
The Team Science Toolkit is an interactive website that provides resources to help users support, engage in, and study team-based research.

1992
1975
SEER 9: 1975+ (10%) SEER 13: 1992+ (14%) SEER 18: 2000+ (28%)
2000 Expansion of SEER Registries over time


Census tract SES data Exposure (UV, toxins, pollution) Small area estimates Community Health Status Urban sprawl index Screening frequency SEP Index Smoking prevalence Built environment
Spatial Data for Etiological and Prevention Research

GIS to Explore Built Environment Influences on Physical Activity
Radial and Network Buffers Around a Participants Home
-0.2
-0.1
0
0.1
0.2
0.3
0.4
0.5
0.6
400m 800m 1200m 1600m 400m 800m 1200m 1600m
Coef
ficie
nt fo
r Wal
king
MET
hrs
/wk
(95%
CIs
)
Radial Line-Based
Association Between Walking and Intersection Density for Different Buffer Sizes
James et al. 2013, Submitted – Health and Place

Improving Energy Balance Related Exposure Assessment with $100 GPS devices
Ryan, Kerr, Jankowska, et al. 2013, Pers. Comm.


NCI Geo Viewer

Animated Historical Cancer Atlas

NCI Map Stories

Smokefree.Gov

Smokefree Women

Smokefree Teen
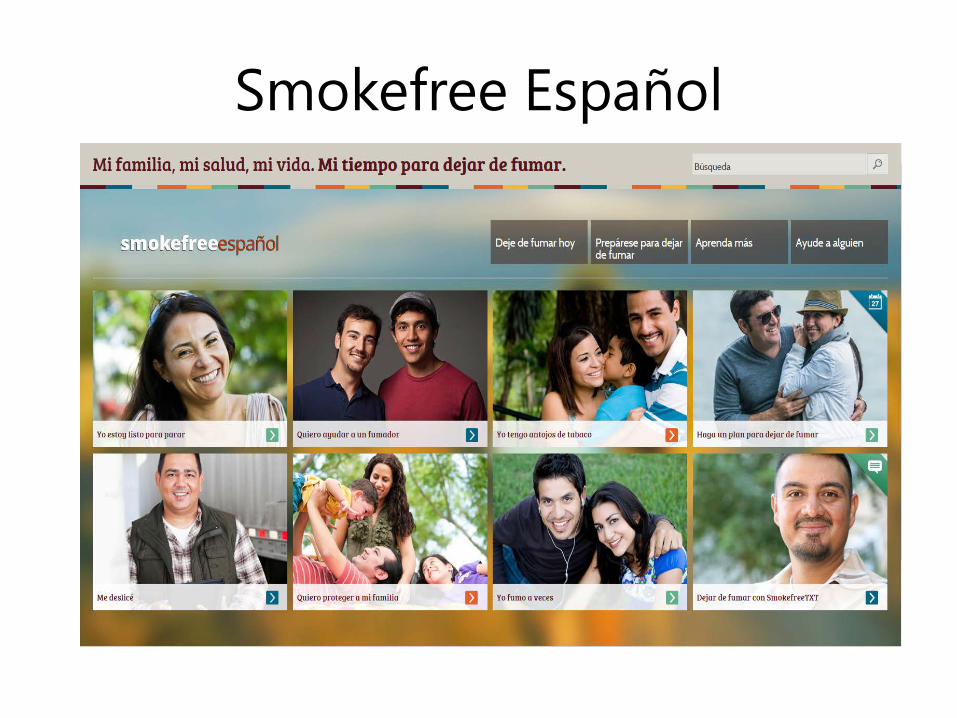
Smokefree Español

SmokefreeTXT Program

SmokefreeTXT Metrics Total Subscriptions March 2012- July 2013
-
5,000
10,000
15,000
20,000
25,000
30,000
35,000
40,000
45,000
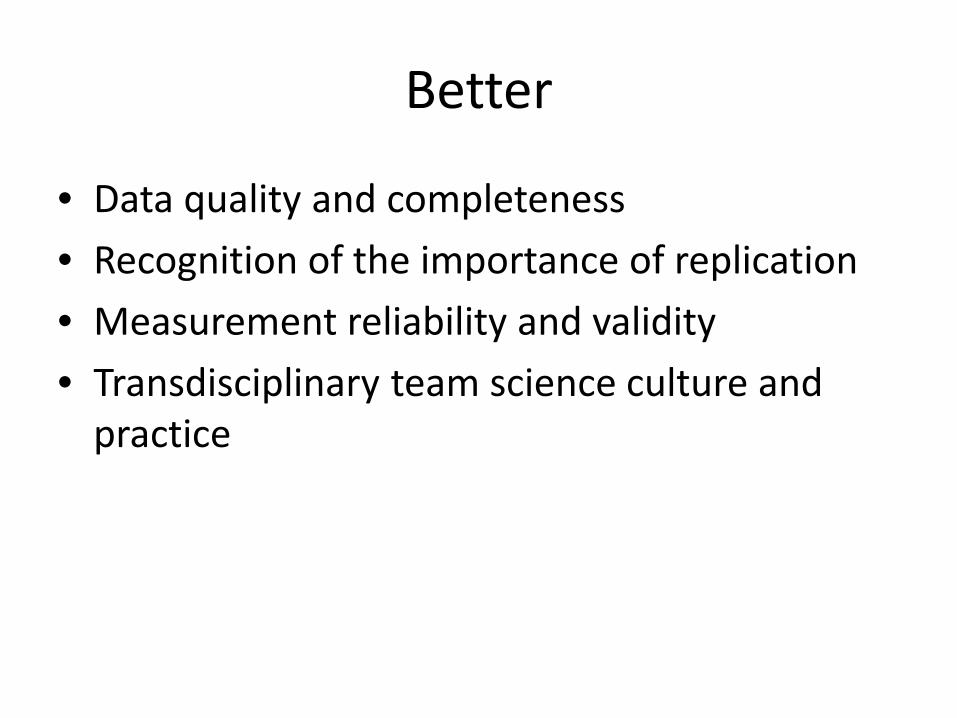
Better
• Data quality and completeness • Recognition of the importance of replication • Measurement reliability and validity • Transdisciplinary team science culture and
practice

Accelerometer-Based Tools for Physical Activity Assessment, Monitoring & Interventions
Past Technology (1990’s) • High cost- $450/unit • Poor reliability/Manual
Calibration • No consumer market • Use in very small studies
Current Technology • Improved cost & capabilities Research Tools - $225/unit
• High reliability/no calibration • Use across diverse research
areas, study designs & sizes
Emerging Opportunities
Large scale exploitation of wearable & embedded sensors in consumer technology for clinical & research applications

Accelerometer Cites in Scopus 2000-2012
0
100
200
300
400
500
600
70020
00
2001
2001
2003
2004
2005
2006
2007
2008
2009
2010
2011
2012
es
clitrA
Year
Trend in Accelerometer Articles

Accelerometers in National Surveillance
• US National Health and Nutrition Examination Survey (NHANES) 2003-2006, 2011-2014
• Canadian Health Measures Surveys (2007-11)
• Health Survey for England 2008

Large Cohorts with Accelerometers • Activity and Function of the Elderly in Ulm (ActiFE Ulm) • Avon Longitudinal Study of Parents and Children (ALSPAC) • Child Heart and Health Study in England (CHASE) • European Youth Heart Study (EYHS) • Identification and Prevention of Dietary- and Lifestyle-Induced Health
Effects in Children and Infants (IDEFICS) • International Study of Childhood Obesity, Lifestyle and the Environment
(ISCOLE) • Millennium Cohort Study • Personal and Environmental Associations with Children’s Health (PEACH) • Raine Study • Sport Physical Activity & Eating Behaviour: Environmental Determinants
in Young People (SPEEDY) • Women’s Health Study

Mobile Tools for Clinical Monitoring, Surveillance & Intervention Research
Remote participant enrollment Collect, store & analyze streaming sensor data Support phones, consumer wearables & research sensors

Our Challenge: In an Era of Faster, Cheaper, Bigger, Better, How do we
Balance: • What is easy? • What is interesting? • What is fundable?
– Vs.
• What is important?

And, we still need, when appropriate…
• Small-scale studies • Traditional, single-investigator studies • Basic, mechanistic knowledge
• …but in cancer control and population
sciences, biology is just one of many levels of analysis that are critical

cancercontrol.cancer.gov
Thank you!