Robb Jetty LSP 090414 - Parliament of Western Australia assessment and report utilised the results...
24
m p rogers & associates pl Cockburn Coast Coastal Vulnerability to 2013 SCPP K1132, Report R466 Rev 2, Page (i) R466 Rev 2 14 March 2014 LandCorp Cockburn Coast Coastal Vulnerability to 2013 SCPP www.coastsandports.com.au
Transcript of Robb Jetty LSP 090414 - Parliament of Western Australia assessment and report utilised the results...

m p rogers & associates pl Cockburn Coast Coastal Vulnerability to 2013 SCPP K1132, Report R466 Rev 2, Page (i)
R466 Rev 2
14 March 2014
LandCorp
Cockburn Coast Coastal Vulnerability to 2013 SCPP
www.coastsandports.com.au

m p rogers & associates pl LandCorp, Cockburn Coast Coastal Vulnerability to 2013 SCPP K1132, Report R466 Rev 2, Page i
m p rogers & associates pl creating better coasts and ports
Suite 1, 128 Main Street, Osborne Park, WA 6017 p: +618 9254 6600 e: [email protected] w: www.coastsandports.com.au
K1132, Report R466 Rev 2 Record of Document Revisions
Rev Purpose of Document Prepared Reviewed Approved Date
A Draft for MRA review M Rogers C Doak M Rogers 17/01/14
0 Issued for Client use M Rogers C Doak M Rogers 17/01/14
1 Minor edits & reissued for Client use M Rogers C Doak M Rogers 29/01/14
2 Minor edits & reissued for Client use D Hamilton M Rogers M Rogers 14/03/14
Form 035 18/06/2013
Limitations of this Document This document has been prepared for use by the Client in accordance with the agreement between the Client and M P Rogers & Associates Pty Ltd. This agreement includes constraints on the scope, budget and time available for the services. The consulting services and this document have been completed with the degree of skill, care and diligence normally exercised by members of the engineering profession performing services of a similar nature. No other warranty, expressed or implied, is made as to the accuracy of the data and professional advice included. This document has not been prepared for use by parties other than the Client and its consulting advisers. It may not contain sufficient information for the purposes of other parties or for other uses.
M P Rogers & Associates takes no responsibility for the completeness or form of any subsequent copies of this document. Copying this document without the permission of the Client or M P Rogers & Associates Pty Ltd is not permitted.

m p rogers & associates pl LandCorp, Cockburn Coast Coastal Vulnerability to 2013 SCPP K1132, Report R466 Rev 2, Page ii
Table of Contents
1. Introduction 1
1.1 General 1
1.2 Background & Setting 2
2. Severe Storm Erosion (S1) 4
3. Historic Shoreline Movement Trends (S2) 10
4. Future Sea Level Rise (S3) 12
5. Recommended Physical Processes Setback 13
6. Inundation (S4) 16
7. Summary 17
8. References 18

m p rogers & associates pl LandCorp, Cockburn Coast Coastal Vulnerability to 2013 SCPP K1132, Report R466 Rev 2, Page iii
Table of Figures
Figure 1.1 District Structure Plan 1
Figure 2.1 Storm Erosion Process (source: CERC 1984) 4
Figure 2.2 Cockburn Coast Sectors 6
Figure 2.3 Sector 1 SBeach Results 7
Figure 2.4 Sector 2 SBeach Results 8
Figure 2.5 Sector 3 SBeach Results 8
Figure 2.6 Sector 4 SBeach Results 9
Figure 5.1 2013 SCPP Physical Processes Setback and the Proposed Development 15
Table of Tables
Table 2.1 S1 Severe Storm Erosion Allowance 9
Table 3.1 S2 Ongoing Trends 11
Table 5.1 Recommended Physical Processes Setback Distances to 2013 SCPP 13

m p rogers & associates pl LandCorp, Cockburn Coast Coastal Vulnerability to 2013 SCPP K1132, Report R466 Rev 2, Page 1
1. Introduction
1.1 General
LandCorp has been investigating the development of the coastal land from just north of Rollinson Road, South Beach to Port Coogee. A District Structure Plan was prepared for the proposed development in 2008 and is shown in Figure 1.1.
Figure 1.1 District Structure Plan

m p rogers & associates pl LandCorp, Cockburn Coast Coastal Vulnerability to 2013 SCPP K1132, Report R466 Rev 2, Page 2
The District Structure Plan shown in Figure 1.1 was based on setbacks calculated by Oceanica in 2007 to the then current State Coastal Planning Policy (SCPP). It was accepted by the City of Cockburn and the Department of Planning.
In 2010 LandCorp engaged Wood & Grieve Engineers (WGE) to assist with the civil, structural, servicing and coastal / maritime engineering. WGE engaged specialist coastal and port engineers, M P Rogers & Associate Pty Ltd (MRA) to complete the coastal / maritime engineering investigations for the project. This included a coastal vulnerability assessment to then current Statement of Planning Policy 2.6 – State Coastal Planning Policy (WAPC 2003) together with the Position Statement released in 2010 (WAPC 2010). The MRA report R301 Rev 0 of July 2011 presented that work. That assessment and report utilised the results of Oceanica’s 2007 assessment of coastal processes for the development of the District Structure Plan (Oceanica 2007).
In July 2013, the State Coastal Planning Policy was revised (WAPC 2013). LandCorp has engaged MRA to complete an assessment to the requirements of this new policy in order to confirm that the proposed development would be safe from potential coastal erosion.
This policy provides a methodology for completing an assessment of the potential impacts of coastal processes over the planning timeframe that can be used to inform the planning process. This methodology requires consideration of the potential effects of:
severe storm erosion (termed the S1 allowance);
future long term changes to the shoreline position (termed the S2 allowance);
climate change induced sea level rise (termed the S3 allowance); and
storm surge inundation (termed the S4 allowance).
1.2 Background & Setting
The shoreline in this area has a long history of development since European settlement in the 1800’s. The area has been used for horse racing, recreation, a variety of industrial and port uses, power generation, and more recently for urban development. There are several ship wrecks in the area that are of historical significance.
The natural coastal processes have been interrupted for about half a century by the groynes at Island Street, Catherine Point, Robb Road and the South Fremantle Power Station. The South Fremantle Power Station was constructed on the shoreline in the 1940’s and included seawalls to protect the facilities. Over the last 70 years there has been significant accretion of the coast due to the sand feed from Success Bank being trapped by the various coastal structures. The seawalls both north and south of the cooling water pond area have been covered by sand accumulation. The shoreline to the north of the cooling water pond has prograded more than 120 m since 1942.
In 2006 the main breakwaters at Port Coogee were constructed. These also changed the coastal processes. The Waterway Manager of Port Coogee is responsible for ongoing beach monitoring and management to mitigate the impacts of the development on coastal processes and maintain Coogee Beach. The management has included bypassing sand from the northern side of Port Coogee to the beaches to the south. Since the Port Coogee breakwaters were constructed,
m p rogers & associates pl LandCorp, Cockburn Coast Coastal Vulnerability to 2013 SCPP K1132, Report R466 Rev 2, Page 3
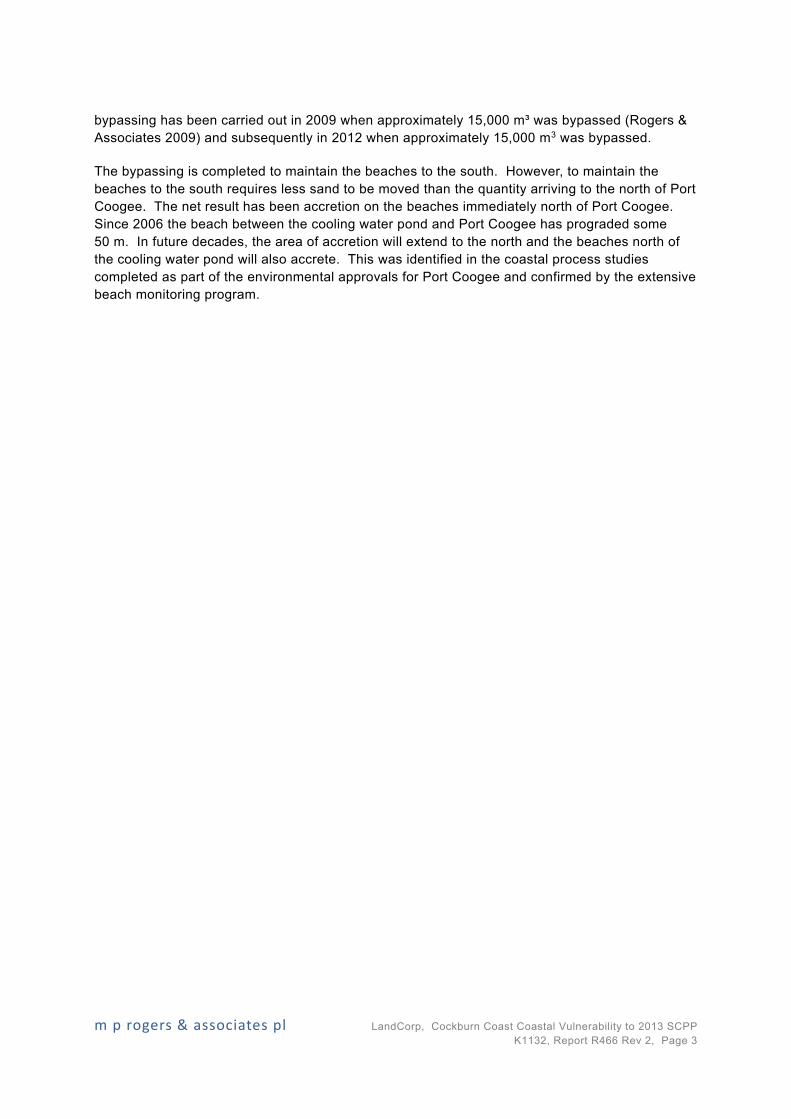
bypassing has been carried out in 2009 when approximately 15,000 m³ was bypassed (Rogers & Associates 2009) and subsequently in 2012 when approximately 15,000 m3 was bypassed.
The bypassing is completed to maintain the beaches to the south. However, to maintain the beaches to the south requires less sand to be moved than the quantity arriving to the north of Port Coogee. The net result has been accretion on the beaches immediately north of Port Coogee. Since 2006 the beach between the cooling water pond and Port Coogee has prograded some 50 m. In future decades, the area of accretion will extend to the north and the beaches north of the cooling water pond will also accrete. This was identified in the coastal process studies completed as part of the environmental approvals for Port Coogee and confirmed by the extensive beach monitoring program.

m p rogers & associates pl LandCorp, Cockburn Coast Coastal Vulnerability to 2013 SCPP K1132, Report R466 Rev 2, Page 4
2. Severe Storm Erosion (S1)
Severe storm events have the potential to cause increased erosion to a shoreline, through the combination of higher, steeper waves generated by sustained strong winds, and increased water levels. These two factors acting in concert allow waves to erode the upper parts of the beach not normally vulnerable to wave attack.
If the initial width of the surf zone is insufficient to dissipate the increased wave energy, this energy is often spent eroding the beach face, beach berm and sometimes the dunes. The eroded sand is transported offshore with the return water flow to form offshore bars. As these bars grow, they can cause incoming waves to break further offshore, decreasing the wave energy available to attack the beach. This is shown diagrammatically in Figure 2.1.
Figure 2.1 Storm Erosion Process (source: CERC 1984)

m p rogers & associates pl LandCorp, Cockburn Coast Coastal Vulnerability to 2013 SCPP K1132, Report R466 Rev 2, Page 5
The SBEACH computer model was developed by the Coastal Engineering Research Centre (CERC) to simulate beach profile evolution in response to storm events. It is described in detail by Larson & Kraus (1989). Since this time the model has been further developed, updated and verified based on field measurements (Wise et al 1996, Larson & Kraus 1998, Larson et al 2004).
SBEACH has also been validated locally by MRA (Rogers et al 2005). This local validation has shown that SBEACH can provide useful and relevant predictions of the storm induced erosion provided the inputs, which include time histories of wave height, period and water elevation, as well as pre-storm beach profile and median sediment grain size, are correctly applied; and care is taken to ensure that the model is accurately reproducing the recorded wave heights and water levels.
SPP2.6 recommends that the allowance for absorbing acute erosion consider both the effects of longshore and cross shore sediment transport processes. It is recommended that potential cross shore erosion be determined by modelling the impact of an appropriate storm sequence using acceptable models such as SBEACH (WAPC 2013). It is also specified that the modelled storm should have an annual exceedance probability (AEP) of 1% with regard to beach erosion. This is equivalent to a storm with an average recurrence interval (ARI) of 100 years.
It is widely accepted that simulating 3 repeats of a severe storm sequence that effected south west Western Australia in July 1996 provides a conservative representation of the 100 year beach erosion event. This storm sequence had elevated water levels for a period of approximately 111 hours and caused coastal erosion at a number of locations in Western Australia. Modelling three consecutive repeats of this storm therefore simulates the effects of over 330 hours of storm conditions on the shoreline.
Previously the SBEACH model was used by Oceanica (2007) to predict the response of the shoreline to the designated storm sequence for the following coastal sectors.
Sector 1 = 110 m north of Rollinson Road to Catherine Point Groyne.
Sector 2 = Catherine Point Groyne to Robb Jetty remains.
Sector 3 = Robb Jetty remains to Robb Road Groyne.
Sector 4 = Robb Road Groyne to the Power Station Cooling Water Pond.
Sector 5 = Power Station Cooling Water Pond to Port Coogee Northern Breakwater.
These sectors and the main coastal features are shown on Figure 2.2.

m p rogers & associates pl LandCorp, Cockburn Coast Coastal Vulnerability to 2013 SCPP K1132, Report R466 Rev 2, Page 6
Figure 2.2 Cockburn Coast Sectors
The SBeach modelling for these various sectors has been completed to the requirements of the 2013 State Coastal Planning Policy. This modelling work provided the position of the Horizontal Shoreline Datum (HSD) and the S1 value to allow for storm erosion behind the HSD.
Sector 1
Island St Groyne
Catherine Pt Groyne
Sector 2
Robb Jetty Remains
Sector 3
Robb Rd Groyne
Sector 4
Sector 5
Port Coogee Northern Breakwater
Cooling Water Pond
Power Station
Rollinson Road
Robb Road
Port Coogee
m p rogers & associates pl LandCorp, Cockburn Coast Coastal Vulnerability to 2013 SCPP K1132, Report R466 Rev 2, Page 7
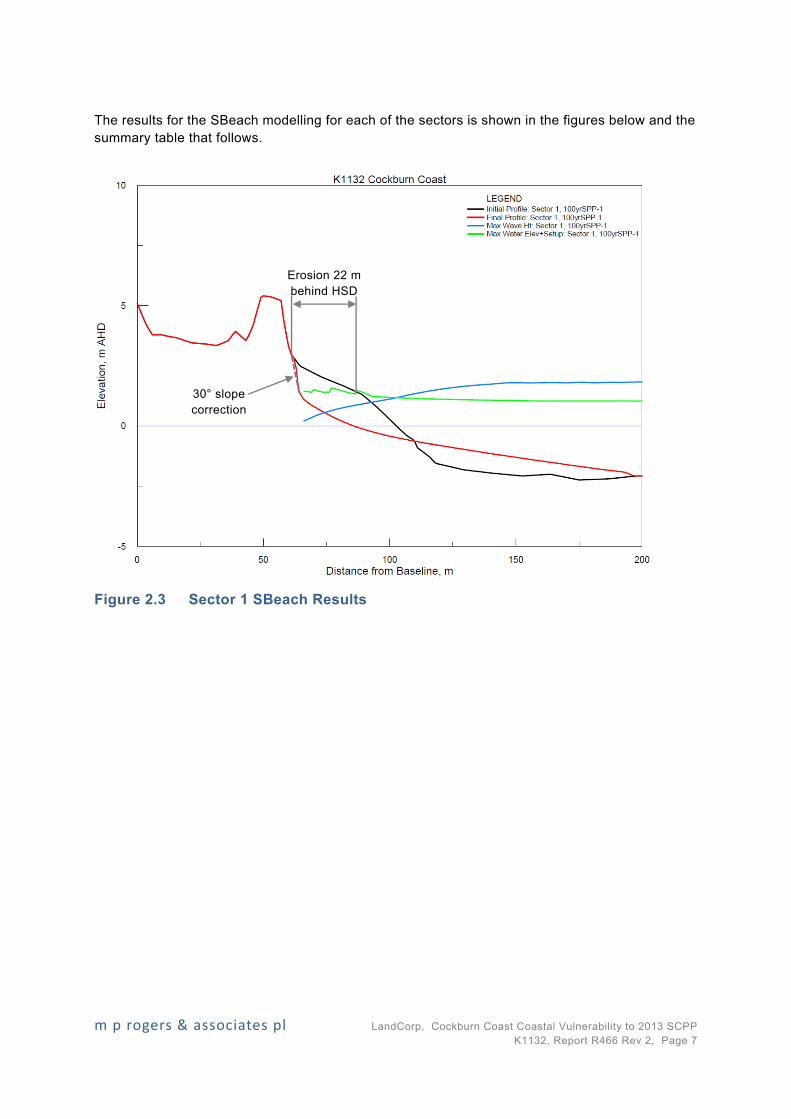
The results for the SBeach modelling for each of the sectors is shown in the figures below and the summary table that follows.
Figure 2.3 Sector 1 SBeach Results
Erosion 22 m behind HSD
30° slope correction

m p rogers & associates pl LandCorp, Cockburn Coast Coastal Vulnerability to 2013 SCPP K1132, Report R466 Rev 2, Page 8
Figure 2.4 Sector 2 SBeach Results
Figure 2.5 Sector 3 SBeach Results
Erosion 20 m behind HSD
30° slope correction
Erosion 20 m behind HSD
30° slope correction

m p rogers & associates pl LandCorp, Cockburn Coast Coastal Vulnerability to 2013 SCPP K1132, Report R466 Rev 2, Page 9
Figure 2.6 Sector 4 SBeach Results
Sector 5 is protected by the seawall that forms the cooling water pond and the seawall that is buried in the newly formed beach between the cooling water pond and Port Coogee. These seawalls will be upgraded as part of the proposed development and it is recommended that all freehold development be set 50 m behind the crests of the upgraded seawalls. Consequently, a SBeach simulation of potential storm erosion is not required for Sector 5.
The results of the work are summarised in the table below. The new policy also requires an assessment of possible changes due to gradients in longshore transport. This has also been completed and is included in the table showing the S1 value for each sector.
Table 2.1 S1 Severe Storm Erosion Allowance
Coastal Sector SBeach
behind HSD Longshore Drift Factor
S1
1 – North of Catherine Point Groyne 22 m 5 m 27 m
2 – Catherine Point Groyne to Robb Rd Jetty 20 m 5 m 25 m
3 – Robb Rd Jetty to Robb Rd Groyne 20 m 0 m 20 m
4 – Robb Rd Groyne to Power Station 19 m 0 m 19 m
5 – Power Station to Port Coogee NA NA NA
Note: 1. Sector 5 is protected by the existing seawalls and the S1 factor is not applicable.
Erosion 19 m behind HSD
30° slope correction

m p rogers & associates pl LandCorp, Cockburn Coast Coastal Vulnerability to 2013 SCPP K1132, Report R466 Rev 2, Page 10
3. Historic Shoreline Movement Trends (S2)
Physical coastal process act on wide ranging time scales, from storm to post storm, seasonal and longer term. The continual action of these processes helps to shape the shoreline.
Short term changes to the coast are captured by the S1 component. The S2 component in the 2013 State Coastal Planning Policy seeks to capture the longer term changes to the shoreline that are likely to occur in the future.
By monitoring changes in the shoreline over time, information can be obtained regarding the net dynamics of an area. Historical aerial photography has therefore used to plot the movement of the shoreline through recent history.
Rogers & Associates (2005) and Oceanica (2007) both collated and reviewed a large amount of historical information for the coastline of the sediment cell extending from Fremantle Harbour to Woodman Point. This information indicates that the foreshore in front of the site has been influenced by the various groynes, seawalls and breakwaters. The dynamics of Success Bank has also influenced the coast. In general there has been net accretion due to the onshore feed of sand from Success Bank and the trapping action of the various groynes and breakwaters. There has been significant accretion of the shoreline with the beach prograding about 120 m near the Power Station since the 1940s. This accretion is anticipated to continue in the coming century.
In the last few decades there has been some erosion of the beach north of Catherine Point Groyne. This was caused by the movement of the crest of Success Bank and reduction in the rate of sand feed from Success Bank. The area has stabilised in recent years and is still seaward of its position in 1942. The beach immediately south of Catherine Point Groyne has also experienced erosion due to the changes in the position and sand feed from Success Bank.
Sector 1 has a long term history of accretion, a short period of realignment due to the movement of Success Bank, and in recent years has been stable. Given this history and the likely future changes it is anticipated that there will not be a long term erosion trend. Consequently, S2 has been assessed as 0 m.
Sector 2 also has a long term history of accretion but has suffered erosion in the last two decades. The erosion immediately south of Catherine Point Groyne is expected to continue for a decade or two and then the realigned beach would be dynamically stable and may even have periods of accretion. The recession of the shoreline in the two decades is expected to be about 10 to 20 m with no further recession in the subsequent decades. The southern area of this sector (near Robb Road Jetty ruins) has not suffered the same erosion. It is anticipated that this area will recede about 5 m in the coming two decades and then accrete in subsequent decades. In view of this assessment of the future dynamics it is recommended that the allowance for S2 be 20 m at the northern end of Sector 2 and 5 m at the southern end.
Sectors 3, 4 and 5 are expected to continue the long term accretion trend. A conservative assessment of the likely future accretion trend was made using a sand feed from Success Bank that is greatly reduced from the historical rate (15,000 to 40,000 m3/year). This conservative assessment was made on the basis of about 7,500 m3/year of sand arriving south of Catherine Point Groyne and moving to the south where it would accrete due to the presence of Port Coogee. The sand bypassing operations would remove about 5,000 m3/year leaving about 2,500 m3/year. This would cause the shoreline to accrete and prograde about 0.2 m/year on average. The 2013 SCPP requires that half of the long term accretion rate be taken for S2. Consequently, for Sectors 3, 4 and 5 the recommended value for S2 is -10 m.

m p rogers & associates pl LandCorp, Cockburn Coast Coastal Vulnerability to 2013 SCPP K1132, Report R466 Rev 2, Page 11
Based on these thorough investigations of the historical and a detailed assessment of the future beach and sand bank dynamics the following allowances for S2 are recommended.
Table 3.1 S2 Ongoing Trends
Coastal Sector S2
1 – North of Catherine Point Groyne 0 m
2 – Catherine Point Groyne to Robb Rd Jetty Northern End
20 m
2 – Catherine Point Groyne to Robb Rd Jetty Southern End
5 m
3 – Robb Rd Jetty to Robb Rd Groyne -10 m
4 – Robb Rd Groyne to Power Station -10 m
5 – Power Station to Port Coogee -10 m

m p rogers & associates pl LandCorp, Cockburn Coast Coastal Vulnerability to 2013 SCPP K1132, Report R466 Rev 2, Page 12
4. Future Sea Level Rise (S3)
The 2013 State Coastal Planning Policy requires that for sandy beaches the S3 allowance be taken as 100 times a sea level rise of 0.9 m. This gives S3 as 90 m for a sandy beach. This factor has been used in this assessment of the Physical Processes Setback Distance.

m p rogers & associates pl LandCorp, Cockburn Coast Coastal Vulnerability to 2013 SCPP K1132, Report R466 Rev 2, Page 13
5. Recommended Physical Processes Setback
A thorough assessment of the Physical Processes Setback has been complete to the full requirements of the 2013 State Coastal Planning Policy. The recommended setbacks are shown in the table below.
Table 5.1 Recommended Physical Processes Setback Distances to 2013 SCPP
Coastal Sector S1 S2 S3 FOS Total
1 – North of Catherine Point Groyne 27 m 0 m 90 m 20 m 137 m
2 – Catherine Point Groyne to Robb Rd Jetty Northern End
25 m 20 m 90 m 20 m 155 m
2 – Catherine Point Groyne to Robb Rd Jetty Southern End
20 m 5 m 90 m 20 m 135 m
3 – Robb Rd Jetty to Robb Rd Groyne 20 m -10 m 90 m 20 m 120 m
4 – Robb Rd Groyne to Power Station 19 m -10 m 90 m 20 m 119 m
5 – Power Station to Port Coogee 0 m 0 m 0 m 50 m 50 m
Note: 1. Sector 5 is protected by the seawalls that will be upgraded as part of the development.
These setback distances should be measured from the Horizontal Shoreline Datum as defined in the 2013 State Coastal Planning Policy. The HSD is taken from the extent of ocean action in the design storm and has been determined from the various SBeach runs presented previously in this report.
The physical processes setbacks to the requirements of the 2013 State Coastal Planning Policy have been plotted on a composite plan showing the proposed areas of freehold development on the Local Structure Plan for the northern portion of the subject land and the Master Plan for the southern portion of the subject land. This is presented in the Figure 5.1 below.
The setback buffers for Sectors 1 and 2 extend to the eastern side of Robb Road and the freight rail corridor. Robb Road is vested in the City of Cockburn and the freight rail corridor is owned by the Public Transport Authority (PTA). PTA has entered into a long term lease of the freight rail infrastructure to Brookfield Rail. The freight rail infrastructure is a vital asset of strategic importance to the State of Western Australia. It is an essential element of Fremantle Ports’ infrastructure. The efficient port operation is important to the economy of Western Australia. It is not conceivable that the Government of Western Australia would not protect this essential infrastructure should it become threatened by coastal erosion in the coming century. The freight rail corridor would be protected and such coastal protection measures would also protect the proposed development of freehold land immediately east of the freight rail corridor. Consequently, the proposed freehold development on the eastern side of the rail corridor in Sectors 1 and 2 would be adequately protected from future coastal erosion and thus the proposed development meets the intent of the 2013 State Coastal Planning Policy.
LandCorp engaged MRA to develop some initial concepts that could be used to stabilise Sector 2 and address the erosion threat to Robb Road and the freight rail corridor. These are presented in

m p rogers & associates pl LandCorp, Cockburn Coast Coastal Vulnerability to 2013 SCPP K1132, Report R466 Rev 2, Page 14
MRA report R314 Rev 4 of March 2014. These concepts can be considered by the City and the PTA to determine their approach to the erosion threat over the coming decades.
The setback buffer for Sectors 3 and 4 are 120 m and 119 m respectively and all proposed freehold development is located behind the recommended setback line. There is a small section of WAPC land in Sector 3 that extends about 20 m seaward of the recommended Physical Processes Setback Line. It is proposed to excise this 900 m2 area from the WAPC landholding and transfer it to the foreshore reserve. This is also shown on Figure 5.1 below.
Sector 5 between the Power Station Cooling Water Pond and Port Coogee is protected by existing seawalls. These seawalls walls will be upgraded as part of the proposed development and it is proposed that all freehold development will be at least 50 m behind the these upgraded seawalls. The buffer of 50 m behind the upgraded seawalls is quite generous and was suggested by Oceanica in the initial work for the District Structure Plan in 2007. Should it be required, further technical studies could be completed to examine the suitability of a smaller buffer behind the upgraded seawalls. Nevertheless, at this stage all freehold development is proposed to be 50 m behind the upgraded seawalls.
It is not proposed to create any freehold land seaward of the setback line shown for Sectors 3, 4 and 5.
LandCorp has developed a comprehensive Foreshore Management Plan for the subject land area that provides suitable foreshore amenities and access to the beaches throughout the planning period to 2110. The risk of future coastal erosion has been evaluated and fully avoided as required by the 2013 State Coastal Planning Policy.

m p rogers & associates pl LandCorp, Cockburn Coast Coastal Vulnerability to 2013 SCPP K1132, Report R466 Rev 2, Page 15
Figure 5.1 2013 SCPP Physical Processes Setback and the Proposed Development

m p rogers & associates pl LandCorp, Cockburn Coast Coastal Vulnerability to 2013 SCPP K1132, Report R466 Rev 2, Page 16
6. Inundation (S4)
The 2013 State Coastal Planning Policy requires that the development be above a very rare ocean storm surge level to avoid flooding. The new policy states “the storm event for storm surge inundation should be based on ocean forces and coastal processes that have a 0.2 percent or one-in-five hundred probability of being equalled or exceeded in any given year over the planning time frame.”
During severe storms the ocean water level can be higher than the normal astronomical tidal levels. The combined action of low atmospheric pressure, strong onshore winds and waves breaking onto reefs and the shore can create significant storm surge above the normal tidal levels.
There have been ocean water level measurements taken at Fremantle Harbour since 1897. Since World War II the reliability of these records has improved. An analysis of the water level records at Fremantle since the 1950s indicates that the 500 year Average Recurrence Interval steady water level in about 6 m of water is approximately +1.4 mAHD.
Strong onshore winds that would accompany the design storm could cause further water level set up between water 6 m deep and the shore. It was estimated that this setup would be about 1.2 m.
At the end of the century long planning period the 2013 SCPP requires that a sea level rise of 0.9 m be used in order to account for the possible impacts of Climate Change.
Using all of these factors the assessment of the S4 Inundation level was completed and is summarised below.
500 year ARI ocean water level in 6 m of water +1.4 mAHD
Local set up between 6 m of water and the shore +1.2 m
Allowance for Sea Level Rise to 2110 +0.9 m
S4 RECOMMENDED MINIMUM FINISHED FLOOR LEVEL +3.5 mAHD
This recommended Finished Floor Level is for new freehold development located behind the recommended setback line. All of the proposed freehold development will be required to have development levels of 3.5 mAHD or higher.

m p rogers & associates pl LandCorp, Cockburn Coast Coastal Vulnerability to 2013 SCPP K1132, Report R466 Rev 2, Page 17
7. Summary
In 2008 LandCorp developed a District Structure Plan for the land between Rollinson Road and Port Coogee. The supporting work included an assessment of the coastal dynamics and recommended setback distances by Oceanica in 2007. The Oceanica work was based on the 2003 State Coastal Planning Policy.
In 2010 the WAPC released a Position Statement for the State Coastal Planning Policy. LandCorp had the setback distances re-evaluated to the new guidelines and adjusted the development plans accordingly (Rogers & Associates 2011). The planning work continued and between 2010 and 2014 LandCorp developed Local Structure Plans for the northern part of the subject land and a Master Plan for the Power Station Precinct.
In July 2013 a new version of the State Coastal Planning Policy was released. This new policy is quite different in several areas to the previous versions. LandCorp has had the physical processes setback distances and inundation factor assessed to the full requirements of the 2013 State Coastal Planning Policy.
This report provides the results of the assessment to the new policy. The proposed development by LandCorp shown in the development plans has all proposed freehold land behind the freight rail corridor or the Physical Processes Setback line calculated to the 2013 State Coastal Planning Policy. Consequently, the proposed development meets the requirements of the new 2013 State Coastal Planning Policy and no freehold land would be under threat from future coastal erosion.
In addition, all freehold properties will be founded above 3.5 mAHD and avoid inundation from ocean storm surge as required by the 2013 State Coastal Planning Policy.
LandCorp has developed a comprehensive Foreshore Management Plan that provides suitable access to the beaches and foreshore amenities throughout the planning period to 2110.

m p rogers & associates pl LandCorp, Cockburn Coast Coastal Vulnerability to 2013 SCPP K1132, Report R466 Rev 2, Page 18
8. References
Department of Transport, 2009. Coastal Demarcation Lines for Administrative & Engineering Purposes: Delineation Methodology & Specification. Government of Western Australia.
IPCC 2001. Summary for Policy Makers, Climate Change 2001: Impacts, Adaptation and Vulnerability. Published by the IPCC and Approved by the IPCC Working Group II in Geneva.
IPCC 2007. Summary for Policymakers. In: Climate Change 2007 – The Physical Science basis. Contribution of Working Group I to the Fourth Assessment Report of the Intergovernmental Panel on Climate Change [S Solomon, D Qin, M Manning, Z Chen, M Marquis, K B Averyt, M Tignor and H L Miller (eds)]. Cambridge University Press, Cambridge UK.
Komar, P D 1998. Beach Processes and Sedimentation (2nd Edition). Prentice Hall Inc, New Jersey, USA.
Larson, M & Kraus, N C 1989. SBEACH: Numerical Model for Simulating Storm-Induced Beach Change. Report 1: Empirical foundation and model development. Technical Report CERC-89-9. Coastal Engineering Research Centre, Vicksburg, MS.
Larson, M & Kraus, N C 1998. SBEACH: Numerical Model for Simulating Storm-Induced Brach Change. Report 5: Representation of Non-erodible (Hard) Bottoms. Technical Report CERC-89-9, Coastal Engineering Research Centre, Vicksburg, MS.
Larson, M, Wise, R A & Kraus, N C 2004. Coastal Over-wash Part 2: Upgrade to SBEACH. ERDC/CHL RSMP CHETN-IV-XXI, US Army Corps pf Engineers.
Oceanica 2007. Cockburn Coast District Structure Plan, Coastal Processes Assessment. Oceanica Consulting Pty Ltd, Perth Report No 524/1 prepared for the WAPC in June 2007.
Rogers & Associates 2005. Southern Perth Metropolitan Coast – Coastal Setback Study. M P Rogers & Associates Pty Ltd report R156 Rev 0 prepared for the Department for Planning & Infrastructure, Perth WA in August 2005.
Rogers & Associates 2009. Port Coogee Sand Bypassing – Completion Report. M P Rogers & Associates Pty Ltd letter report 09258 Rev 0 prepared for the Port Catherine Development, Perth WA in December 2009.
Rogers & Associates 2011. Cockburn Coast – Coastal Vulnerability Assessment. M P Rogers & Associates Pty Ltd report R301 Rev 0 prepared for LandCorp, Perth.
Rogers & Associate 2014. Cockburn Coast – Foreshore Management Plan, Coastal Vulnerability Assessment & Adaptation. M P Rogers & Associates Pty Ltd report R314 Rev 4. Prepared for LandCorp, Perth.
Rogers, M. P., Saunders, B. S. & Hunt, T. S. 2005. Living on the Coast – But How Close is Safe? Proceedings of the Coasts and Ports 2005 Conference, Adelaide, Australia.
Short, A. 2006. Beaches of the Western Australian Coast: Eucla to Roebuck Bay. A guide to their nature, characteristics, surf and safety, Sydney University Press.

m p rogers & associates pl LandCorp, Cockburn Coast Coastal Vulnerability to 2013 SCPP K1132, Report R466 Rev 2, Page 19
WAPC 2003. Statement of Planning Policy No. 2.6 – State Coastal Planning Policy. Western Australian State Government, Perth.
WAPC 2010. Position Statement - State Planning Policy No. 2.6 - State Coastal Planning Policy Schedule 1 Sea Level Rise. Western Australian State Government, Perth.
WAPC 2013. Statement of Planning Policy No. 2.6 – State Coastal Planning Policy. Western Australian State Government, Perth.
Wise, R A, Smith, S J & Larson, M 1996. SBEACH: Numerical Model for Simulating Storm-Induced Beach Change. Report 4, Cross-shore transport under random waves and model validation with SUPERTANK and field data. Technical Report CERC-89-9 rept. 4. Coastal Engineering Research Centre, Vicksburg, MS.