
Roadshow presentation - b2holding.no · Roadshow presentation 12-16 ... or completeness of the...
32
-- Roadshow presentation 12-16 September 2016
Transcript of Roadshow presentation - b2holding.no · Roadshow presentation 12-16 ... or completeness of the...
-- Roadshow presentation
12-16 September 2016
13/29/77
0/51/153
Colour scheme
54/97/222
121/150/233
188/202/244
217/217/217
191/191/191
166/166/166
127/127/127
B2H-blue
| 2
Important information
This presentation has been prepared by B2Holding ASA (the “Company”) solely for information purposes and does not constitute, and should not be construed as,
an offer to sell or issue securities or otherwise constitute an invitation or inducement to any person to purchase, underwrite, subscribe to or otherwise acquire
securities in the Company or any member of the Group.
The information contained in this document is confidential and is being made only to, and is only directed at, persons to whom such information may lawfully be
communicated. This document may not be (in whole or in part) reproduced, distributed, stored, introduced into a retrieval system of any nature or disclosed in any
way to any other person without the prior written consent of the Company.
The information contained in this document has not been verified or reviewed by the Company’s auditors and, as such, is subject to all other publicly available
information and amendments without notice (such amendments may be material). The Company makes no representation or warranty of any sort as to the accuracy
or completeness of the information contained in this document or in any meeting or presentation which accompanies it or in any other document or information
made available in connection with this document and no person shall have any right of action against the Company or any other person in relation to the accuracy or
completeness of any such information.
Each recipient acknowledges that neither it nor the Company intends that the Company act or be responsible as a fiduciary to such investor, its management,
stockholders, creditors or any other person. By accepting and providing this document, each investor and the Company, respectively, expressly disclaims any
fiduciary relationship and agrees that each investor is responsible for making its own independent judgments with respect to any transaction and any other matters
regarding this document.
This document contains statements that constitute forward-looking statements relating to the business, financial performance and results of the Company and its
subsidiaries (the “Group”) and the industry in which the Group operates. These statements may be identified by words such as “expectation”, “belief”, “estimate”,
“plan”, “target”, or “forecast” and similar expressions or the negative thereof; or by forward-looking nature of discussions of strategy, plans or intentions; or by their
context. All statements regarding the future are subject to inherent risks and uncertainties and various factors could cause actual future results, performance or
events to differ materially from those described or implied in these statements. Such forward-looking statements are based on numerous assumptions regarding the
Group’s present and future business strategies and the environment in which the Group will operate in the future.
While management has endeavoured to ensure the accuracy of the material in the presentation, the presentation is provided for information only. The Company, its
officers and management expressly exclude and disclaim any liability in respect of any decision made in reliance on the presentation.
Further, certain forward-looking statements are based upon assumptions of future events which may not prove to be accurate and neither the Company nor any
other person accepts any responsibility for the accuracy of the opinions expressed in this document or the underlying assumptions. The forward-looking statements
in this document speak only as at the date of this presentation and the Company assumes no obligation to update or provide any additional information in relation to
such forward-looking statements.
This document is not intended for distribution to, or use by any person or entity in any jurisdiction or country where such distribution or use would be contrary to local
law or regulation or which would require any registration or licensing within such jurisdiction.
13/29/77
0/51/153
Colour scheme
54/97/222
121/150/233
188/202/244
217/217/217
191/191/191
166/166/166
127/127/127
B2H-blue
B2Holding presenting team
Harald Henriksen
Chief Financial Officer
B2Holding
Joined B2Holding in January 2015
Mr. Henriksen held various controller positions in Elkem ASA
and Poseidon AS and CFO positions in I M Skaugen ASA,
Actinor Shipping ASA, Aktiv Kapital ASA and in shipping
investment portfolios under ABG Sundal Collier ASA
MSc from the Norwegian School of Economics
Erik Just Johnsen
Chief Group Controller
B2Holding
Joined B2Holding in March 2013
Mr Johnsen held various positions in Orkla Finans and Elkem
before operating Erling Johnsen AS from 1992 - 2000
He later acted as CFO in Northstar Ind. Inc. and Marine
Subsea
Bachelor of Business Administration with major in Finance
from University of Wisconsin, MBA with major in Finance from
University of Chicago
| 3

13/29/77
0/51/153
Colour scheme
54/97/222
121/150/233
188/202/244
217/217/217
191/191/191
166/166/166
127/127/127
B2H-blue
1. Credit update
2. Refresher on B2H
3. Industry dynamics and B2H's market position
4. Portfolio overview
5. Financials
6. Appendix
Agenda
| 4
13/29/77
0/51/153
Colour scheme
54/97/222
121/150/233
188/202/244
217/217/217
191/191/191
166/166/166
127/127/127
B2H-blue
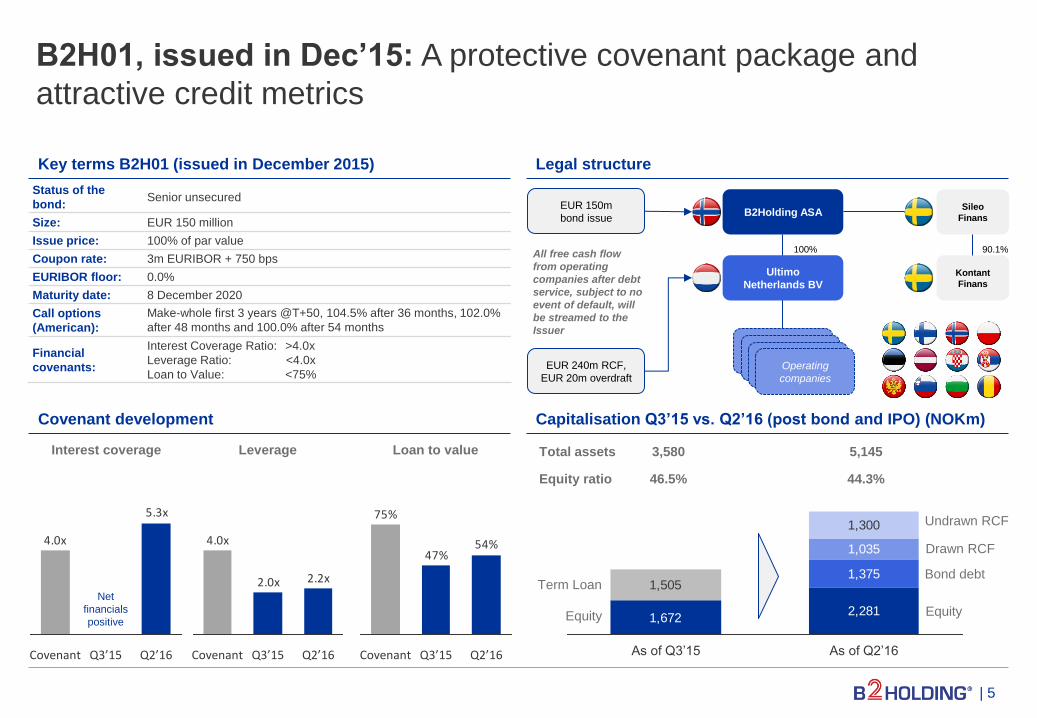
B2H01, issued in Dec’15: A protective covenant package and
attractive credit metrics
| 5
Key terms B2H01 (issued in December 2015) Legal structure
Capitalisation Q3’15 vs. Q2’16 (post bond and IPO) (NOKm)
Sileo
Finans
Kontant
Finans
Operating
companies
EUR 240m RCF,
EUR 20m overdraft
B2Holding ASA
Ultimo
Netherlands BV
EUR 150m
bond issue
100%
Status of the
bond: Senior unsecured
Size: EUR 150 million
Issue price: 100% of par value
Coupon rate: 3m EURIBOR + 750 bps
EURIBOR floor: 0.0%
Maturity date: 8 December 2020
Call options
(American):
Make-whole first 3 years @T+50, 104.5% after 36 months, 102.0%
after 48 months and 100.0% after 54 months
Financial
covenants:
Interest Coverage Ratio: >4.0x
Leverage Ratio: <4.0x
Loan to Value: <75%
Covenant development
4.0x
5.3x
Covenant Q2’16 Q3’15
2.2x2.0x
4.0x
Q3’15 Q2’16 Covenant
54%47%
75%
Covenant Q3’15 Q2’16
Net
financials
positive
All free cash flow
from operating
companies after debt
service, subject to no
event of default, will
be streamed to the
Issuer
1,6722,281
1,375
1,035
1,300
1,505
As of Q2’16 As of Q3’15
Total assets
Equity ratio
3,580
46.5%
5,145
44.3%
Term Loan
Equity
Undrawn RCF
Drawn RCF
Bond debt
Equity
Interest coverage Leverage Loan to value
90.1%
13/29/77
0/51/153
Colour scheme
54/97/222
121/150/233
188/202/244
217/217/217
191/191/191
166/166/166
127/127/127
B2H-blue
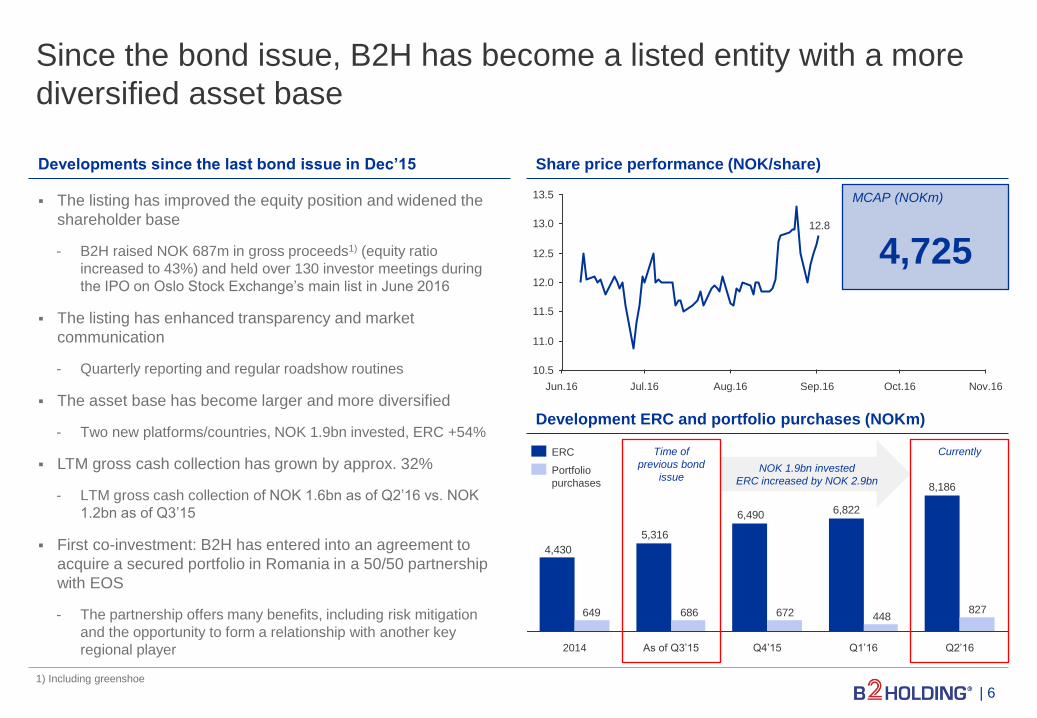
The listing has improved the equity position and widened the
shareholder base
- B2H raised NOK 687m in gross proceeds1) (equity ratio
increased to 43%) and held over 130 investor meetings during
the IPO on Oslo Stock Exchange’s main list in June 2016
The listing has enhanced transparency and market
communication
- Quarterly reporting and regular roadshow routines
The asset base has become larger and more diversified
- Two new platforms/countries, NOK 1.9bn invested, ERC +54%
LTM gross cash collection has grown by approx. 32%
- LTM gross cash collection of NOK 1.6bn as of Q2’16 vs. NOK
1.2bn as of Q3’15
First co-investment: B2H has entered into an agreement to
acquire a secured portfolio in Romania in a 50/50 partnership
with EOS
- The partnership offers many benefits, including risk mitigation
and the opportunity to form a relationship with another key
regional player
12.8
10.5
11.0
11.5
12.0
12.5
13.0
13.5
Oct.16 Jul.16 Jun.16 Sep.16 Aug.16 Nov.16
NOK 1.9bn invested
ERC increased by NOK 2.9bn
Since the bond issue, B2H has become a listed entity with a more
diversified asset base
| 6
Developments since the last bond issue in Dec’15 Share price performance (NOK/share)
Development ERC and portfolio purchases (NOKm)
1) Including greenshoe
8,186
6,8226,490
5,316
4,430
827448672686649
2014 Q4’15 Q1’16 As of Q3’15 Q2’16
Time of
previous bond
issue
Currently
MCAP (NOKm)
4,725
ERC
Portfolio
purchases
13/29/77
0/51/153
Colour scheme
54/97/222
121/150/233
188/202/244
217/217/217
191/191/191
166/166/166
127/127/127
B2H-blue
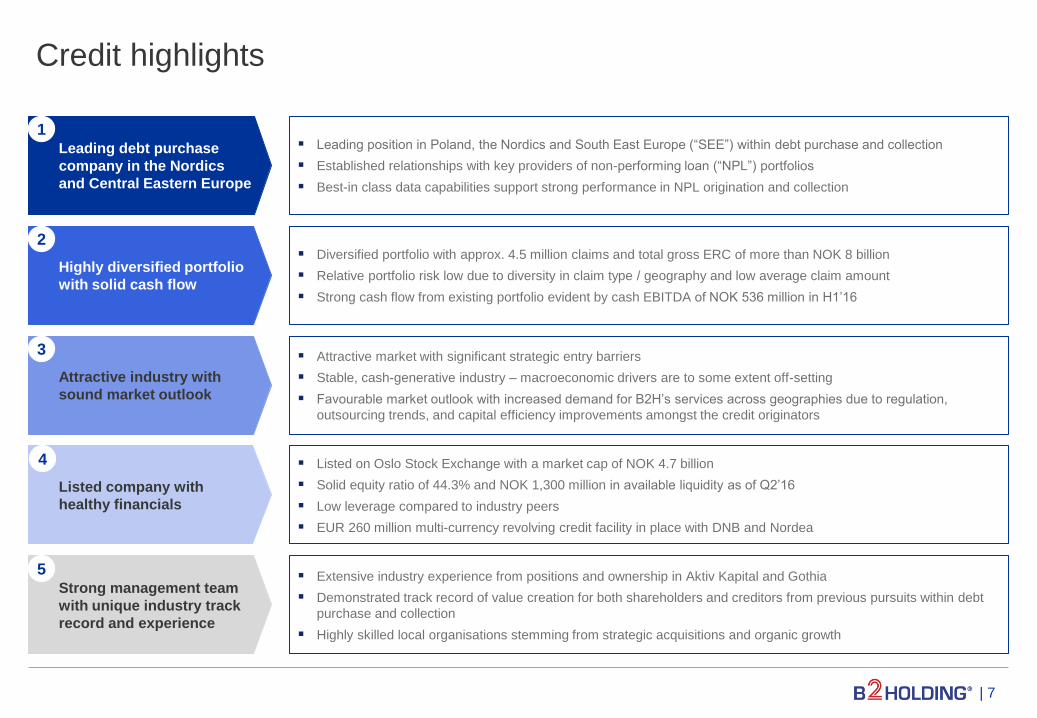
Credit highlights
| 7
Leading debt purchase
company in the Nordics
and Central Eastern Europe
1
Highly diversified portfolio
with solid cash flow
2
Attractive industry with
sound market outlook
3
Listed company with
healthy financials
4
Strong management team
with unique industry track
record and experience
5
Leading position in Poland, the Nordics and South East Europe (“SEE”) within debt purchase and collection
Established relationships with key providers of non-performing loan (“NPL”) portfolios
Best-in class data capabilities support strong performance in NPL origination and collection
Listed on Oslo Stock Exchange with a market cap of NOK 4.7 billion
Solid equity ratio of 44.3% and NOK 1,300 million in available liquidity as of Q2’16
Low leverage compared to industry peers
EUR 260 million multi-currency revolving credit facility in place with DNB and Nordea
Attractive market with significant strategic entry barriers
Stable, cash-generative industry – macroeconomic drivers are to some extent off-setting
Favourable market outlook with increased demand for B2H’s services across geographies due to regulation,
outsourcing trends, and capital efficiency improvements amongst the credit originators
Extensive industry experience from positions and ownership in Aktiv Kapital and Gothia
Demonstrated track record of value creation for both shareholders and creditors from previous pursuits within debt
purchase and collection
Highly skilled local organisations stemming from strategic acquisitions and organic growth
Diversified portfolio with approx. 4.5 million claims and total gross ERC of more than NOK 8 billion
Relative portfolio risk low due to diversity in claim type / geography and low average claim amount
Strong cash flow from existing portfolio evident by cash EBITDA of NOK 536 million in H1’16
13/29/77
0/51/153
Colour scheme
54/97/222
121/150/233
188/202/244
217/217/217
191/191/191
166/166/166
127/127/127
B2H-blue
1. Credit update
2. Refresher on B2H
3. Industry dynamics and B2H's market position
4. Portfolio overview
5. Financials
6. Appendix
Agenda
| 8
13/29/77
0/51/153
Colour scheme
54/97/222
121/150/233
188/202/244
217/217/217
191/191/191
166/166/166
127/127/127
B2H-blue
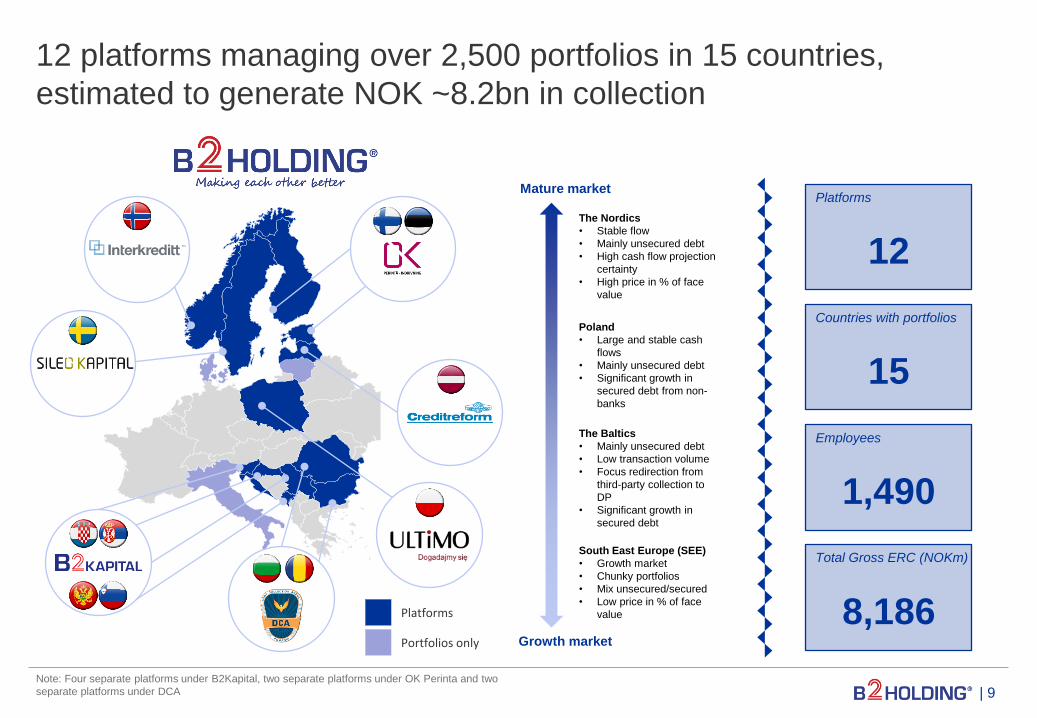
12 platforms managing over 2,500 portfolios in 15 countries,
estimated to generate NOK ~8.2bn in collection
| 9 Note: Four separate platforms under B2Kapital, two separate platforms under OK Perinta and two
separate platforms under DCA
The Nordics
• Stable flow
• Mainly unsecured debt
• High cash flow projection
certainty
• High price in % of face
value
South East Europe (SEE)
• Growth market
• Chunky portfolios
• Mix unsecured/secured
• Low price in % of face
value
Poland
• Large and stable cash
flows
• Mainly unsecured debt
• Significant growth in
secured debt from non-
banks
The Baltics
• Mainly unsecured debt
• Low transaction volume
• Focus redirection from
third-party collection to
DP
• Significant growth in
secured debt
Mature market
Growth market
Platforms
12
Countries with portfolios
15
Employees
1,490
8,186 Platforms
Portfolios only
Total Gross ERC (NOKm)
13/29/77
0/51/153
Colour scheme
54/97/222
121/150/233
188/202/244
217/217/217
191/191/191
166/166/166
127/127/127
B2H-blue
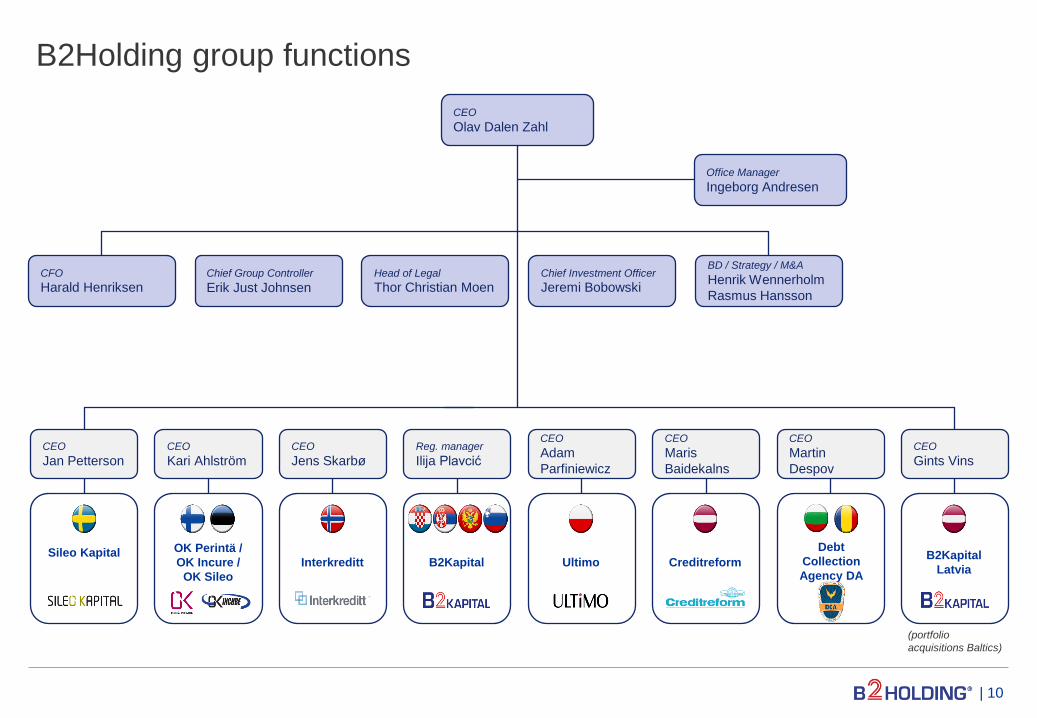
B2Holding group functions
| 10
Office Manager
Ingeborg Andresen
CEO
Olav Dalen Zahl
CFO
Harald Henriksen Chief Group Controller
Erik Just Johnsen
BD / Strategy / M&A
Henrik Wennerholm
Rasmus Hansson
Chief Investment Officer
Jeremi Bobowski Head of Legal
Thor Christian Moen
Sileo Kapital
OK Perintä /
OK Incure /
OK Sileo
Interkreditt B2Kapital Ultimo Creditreform
Debt
Collection
Agency DA
CEO
Jan Petterson CEO
Kari Ahlström CEO
Jens Skarbø Reg. manager
Ilija Plavcić
CEO
Adam
Parfiniewicz
CEO
Maris
Baidekalns
CEO
Martin
Despov
CEO
Gints Vins
B2Kapital
Latvia
(portfolio
acquisitions Baltics)
13/29/77
0/51/153
Colour scheme
54/97/222
121/150/233
188/202/244
217/217/217
191/191/191
166/166/166
127/127/127
B2H-blue
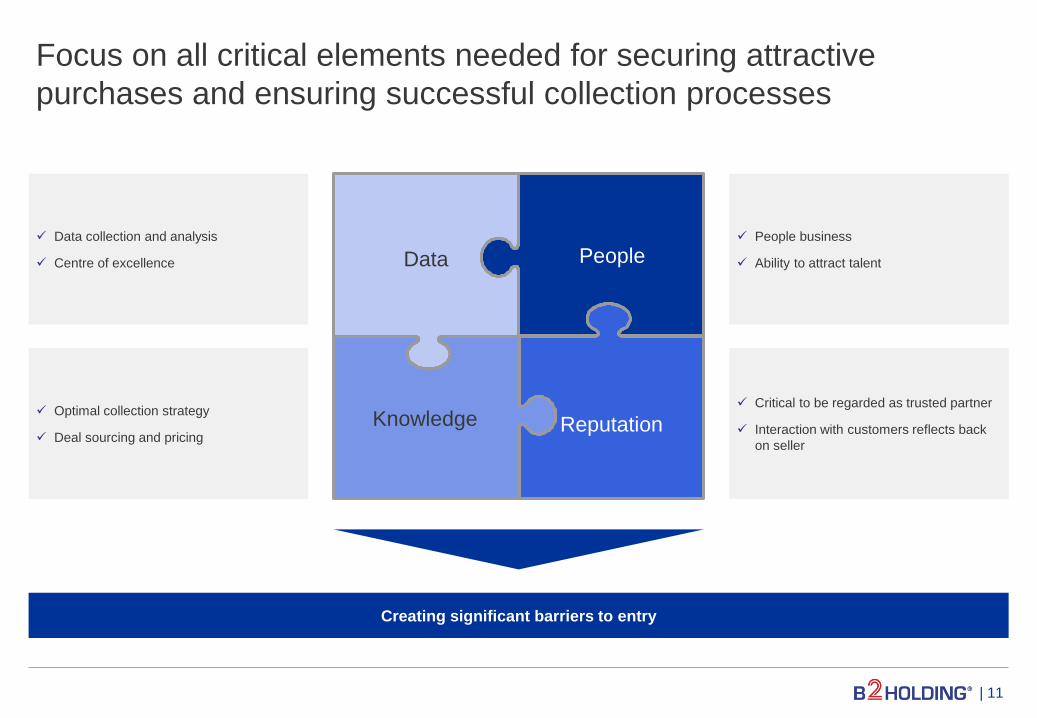
Focus on all critical elements needed for securing attractive
purchases and ensuring successful collection processes
| 11
Creating significant barriers to entry
Data
Knowledge
People
Reputation
Data collection and analysis
Centre of excellence
Optimal collection strategy
Deal sourcing and pricing
People business
Ability to attract talent
Critical to be regarded as trusted partner
Interaction with customers reflects back
on seller
13/29/77
0/51/153
Colour scheme
54/97/222
121/150/233
188/202/244
217/217/217
191/191/191
166/166/166
127/127/127
B2H-blue
1. Credit update
2. Refresher on B2H
3. Industry dynamics and B2H's market position
4. Portfolio overview
5. Financials
6. Appendix
Agenda
| 12
13/29/77
0/51/153
Colour scheme
54/97/222
121/150/233
188/202/244
217/217/217
191/191/191
166/166/166
127/127/127
B2H-blue
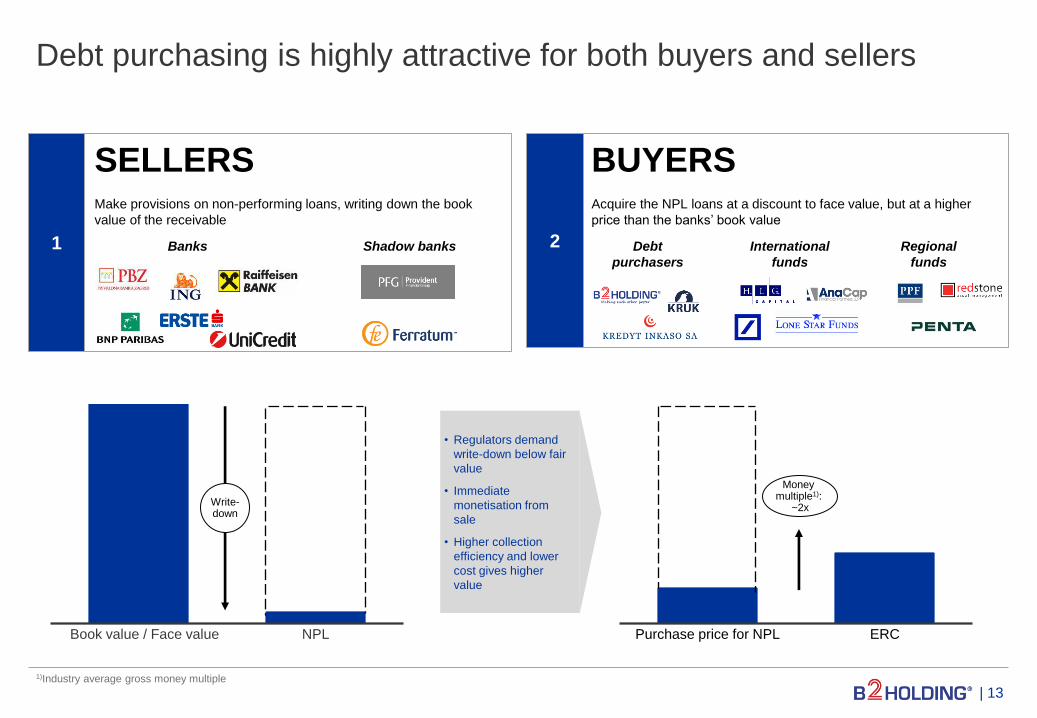
Debt purchasing is highly attractive for both buyers and sellers
| 13
1)Industry average gross money multiple
Write- down
Money multiple1):
~2x
ERC Purchase price for NPL
1
BUYERS
Acquire the NPL loans at a discount to face value, but at a higher
price than the banks’ book value
2
Book value / Face value NPL
SELLERS
Make provisions on non-performing loans, writing down the book
value of the receivable
• Regulators demand
write-down below fair
value
• Immediate
monetisation from
sale
• Higher collection
efficiency and lower
cost gives higher
value
Banks Shadow banks Debt
purchasers
International
funds
Regional
funds

13/29/77
0/51/153
Colour scheme
54/97/222
121/150/233
188/202/244
217/217/217
191/191/191
166/166/166
127/127/127
B2H-blue
Attractive industry characteristics based on strong macroeconomic-
and industry specific drivers
| 14 Source: IMF Global Financial Stability Report October 2015, PWC Portfolio Advisory Group Market update Q1 2016
9351,000
200
0
600
800
400
2012 2013
+11%
Q3 2015 2014 2011 2010 2009
141
0
50
100
150
2015 2014 2013 2012 2011
+67%
2010
M
A
C
R
O
I
N
D
U
S
T
R
Y
Face value of European bank NPLs
Face value of European portfolio transactions
The level of NPLs on banks’ balance sheets
The banks’ propensity to sell portfolios
EURbn
EURbn
13/29/77
0/51/153
Colour scheme
54/97/222
121/150/233
188/202/244
217/217/217
191/191/191
166/166/166
127/127/127
B2H-blue
UK
Poland
SEE
Nordic
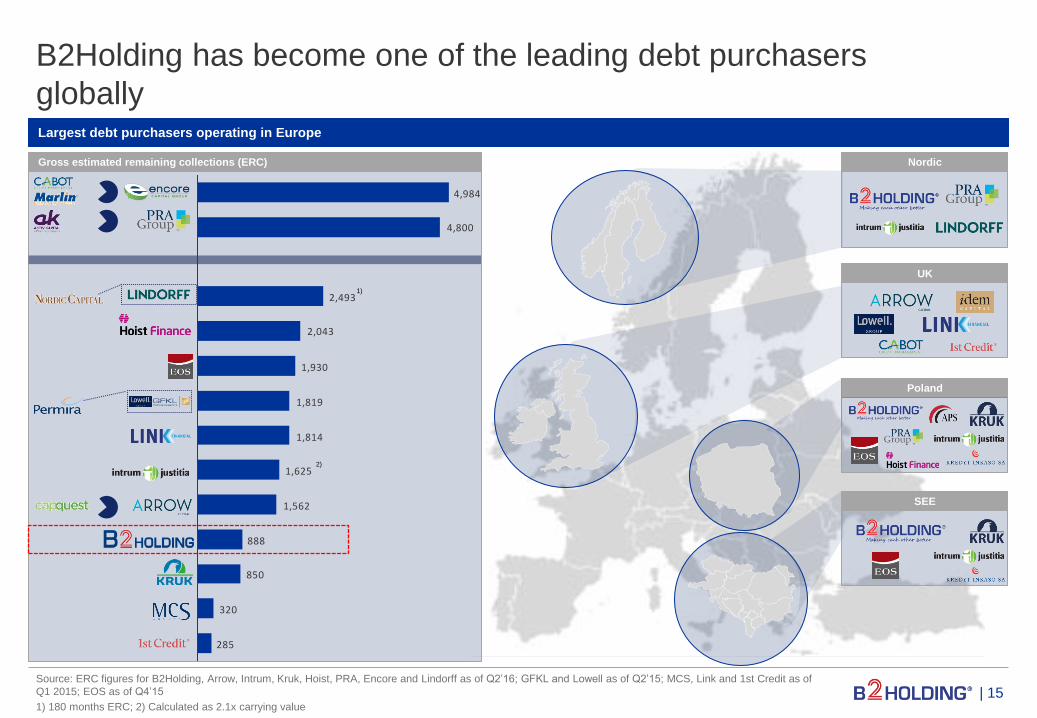
B2Holding has become one of the leading debt purchasers
globally
Source: ERC figures for B2Holding, Arrow, Intrum, Kruk, Hoist, PRA, Encore and Lindorff as of Q2’16; GFKL and Lowell as of Q2’15; MCS, Link and 1st Credit as of
Q1 2015; EOS as of Q4’15
1) 180 months ERC; 2) Calculated as 2.1x carrying value
Largest debt purchasers operating in Europe
Gross estimated remaining collections (ERC)
285
320
850
888
1,562
1,625
1,814
1,819
1,930
2,043
2,493
4,800
4,984
1)
2)
| 15

13/29/77
0/51/153
Colour scheme
54/97/222
121/150/233
188/202/244
217/217/217
191/191/191
166/166/166
127/127/127
B2H-blue
Offering a mix of first mover advantage and mature market
presence
Typical development stages of debt purchasing markets (illustrative only)
Description
• Regulatory or Cultural barriers and
«denial» among banks
• Increasing competition across debt
purchasers and decreasing bid-ask
spreads
• Local banks gradually become more active
• Large share of NPL stock sold annually
• NPL sales an integral part of bank
ecosystem
Growth phase Mature phase Early phase
Typical stages of
development of
debt purchasing
markets
Time since inception of debt sales
Penetr
atio
n o
f debt
sale
s
| 16
B2H is built on a Nordic foothold
13/29/77
0/51/153
Colour scheme
54/97/222
121/150/233
188/202/244
217/217/217
191/191/191
166/166/166
127/127/127
B2H-blue
1. Credit update
2. Refresher on B2H
3. Industry dynamics and B2H's market position
4. Portfolio overview
5. Financials
6. Appendix
Agenda
| 17
13/29/77
0/51/153
Colour scheme
54/97/222
121/150/233
188/202/244
217/217/217
191/191/191
166/166/166
127/127/127
B2H-blue
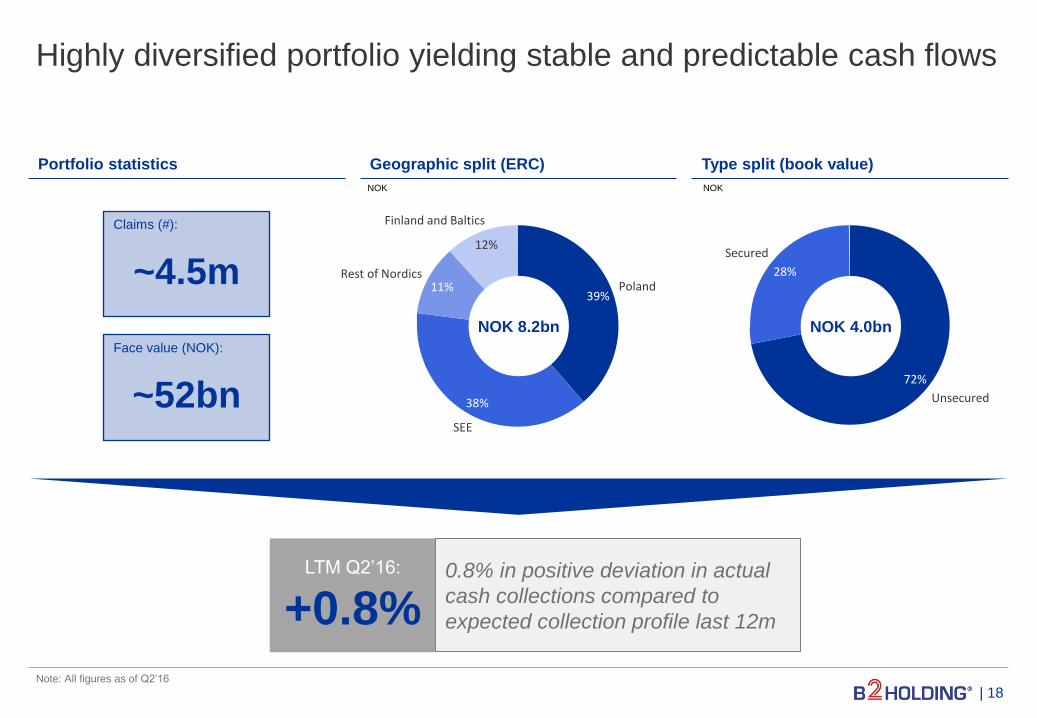
SEE
Finland and Baltics
12%
39% 11%
Rest of Nordics Poland
38%
Highly diversified portfolio yielding stable and predictable cash flows
| 18
Portfolio statistics Geographic split (ERC)
Note: All figures as of Q2’16
Type split (book value)
LTM Q2’16:
+0.8% 0.8% in positive deviation in actual
cash collections compared to
expected collection profile last 12m
Claims (#):
~4.5m
Face value (NOK):
~52bn
NOK NOK
NOK 8.2bn
72%
Unsecured
28%
Secured
NOK 4.0bn

13/29/77
0/51/153
Colour scheme
54/97/222
121/150/233
188/202/244
217/217/217
191/191/191
166/166/166
127/127/127
B2H-blue
Total Gross ERC passed NOK 8bn in the second quarter
Development in Total Gross ERC Total Gross ERC split by estimated collection time
Gross ERC split by estimated collection time table
8,186
6,8226,490
4,430
1,371
Q2’16 2015 Q1’16 2013 2014
NOK million
Region Year
1 2 3 4 5 6 7 8 9 10 120m
ERC
Total
ERC
Poland 787 682 510 365 254 186 123 83 53 31 3,074 3,153
SEE 534 753 804 590 232 129 63 31 9 2 3,147 3,147
Rest of Nordics 125 108 95 86 79 72 66 59 50 41 782 931
Finland & Estonia 257 178 132 96 73 55 44 33 12 1 881 881
Baltics 18 13 9 7 5 4 3 2 2 2 66 74
Total 1,721 1,733 1,551 1,144 643 448 298 208 126 77 7,949 8,186
NOK million
5 6 7 8 9 4 >10 2 3
Year
1,733
10 1
1,144
448
126
1,721
208 236
643
298
1,551
77
SEE
Baltics
Poland
Finland
Rest of Nordics
NOK million
| 19
13/29/77
0/51/153
Colour scheme
54/97/222
121/150/233
188/202/244
217/217/217
191/191/191
166/166/166
127/127/127
B2H-blue
1. Credit update
2. Refresher on B2H
3. Industry dynamics and B2H's market position
4. Portfolio overview
5. Financials
6. Appendix
Agenda
| 20
13/29/77
0/51/153
Colour scheme
54/97/222
121/150/233
188/202/244
217/217/217
191/191/191
166/166/166
127/127/127
B2H-blue
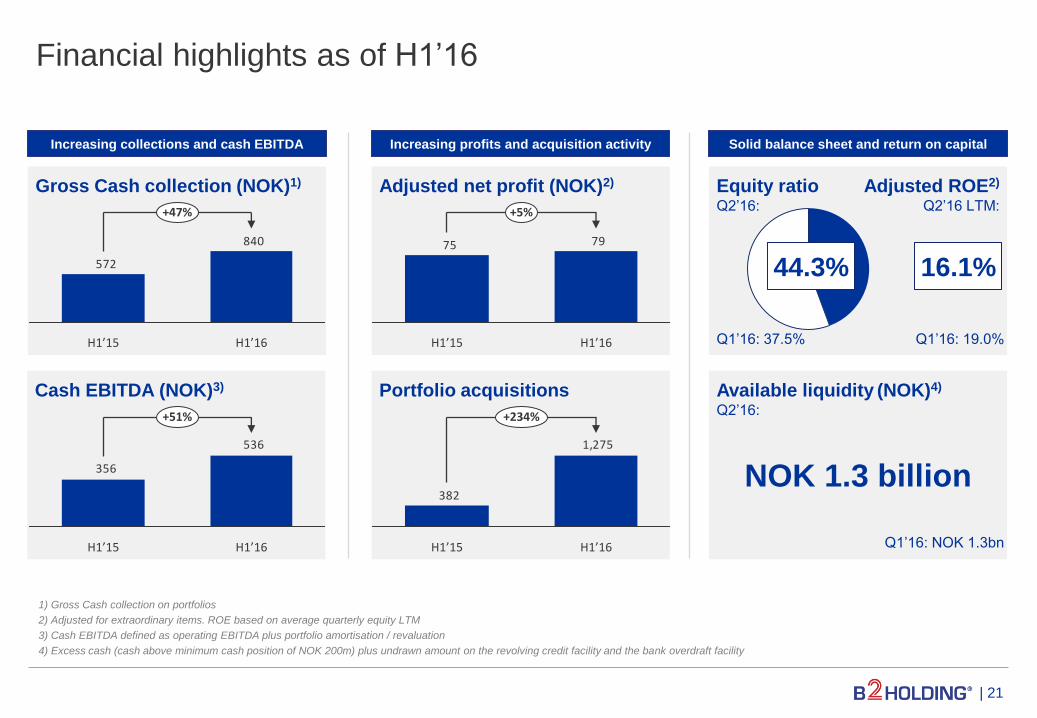
Financial highlights as of H1’16
1) Gross Cash collection on portfolios
2) Adjusted for extraordinary items. ROE based on average quarterly equity LTM
3) Cash EBITDA defined as operating EBITDA plus portfolio amortisation / revaluation
4) Excess cash (cash above minimum cash position of NOK 200m) plus undrawn amount on the revolving credit facility and the bank overdraft facility
Available liquidity (NOK)4)
Q2’16:
NOK 1.3 billion
Cash EBITDA (NOK)3)
Adjusted net profit (NOK)2)
Portfolio acquisitions
Increasing collections and cash EBITDA Increasing profits and acquisition activity Solid balance sheet and return on capital
Gross Cash collection (NOK)1) Equity ratio Q2’16:
Q1’16: 37.5%
44.3% 16.1%
Adjusted ROE2) Q2’16 LTM:
Q1’16: 19.0%
840
572
H1’15 H1’16
+47%
7975
H1’15 H1’16
+5%
536
356
H1’15 H1’16
+51%
1,275
382
H1’15 H1’16
+234%
| 21
Q1’16: NOK 1.3bn
13/29/77
0/51/153
Colour scheme
54/97/222
121/150/233
188/202/244
217/217/217
191/191/191
166/166/166
127/127/127
B2H-blue
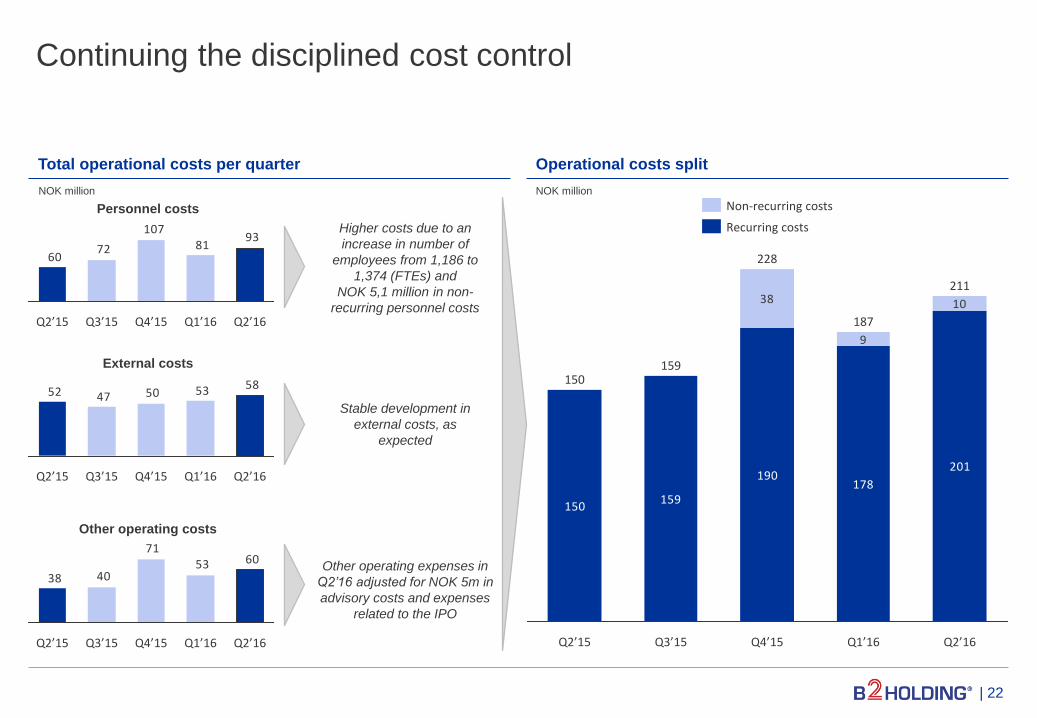
Continuing the disciplined cost control
Total operational costs per quarter Operational costs split
Higher costs due to an
increase in number of
employees from 1,186 to
1,374 (FTEs) and
NOK 5,1 million in non-
recurring personnel costs
Stable development in
external costs, as
expected
Other operating expenses in
Q2’16 adjusted for NOK 5m in
advisory costs and expenses
related to the IPO
9381
107
7260
Q2’15 Q3’15 Q4’15 Q1’16 Q2’16
Personnel costs
NOK million NOK million
5853504752
Q2’15 Q2’16 Q3’15 Q1’16 Q4’15
External costs
605371
4038
Q2’15 Q1’16 Q3’15 Q4’15 Q2’16
Other operating costs
201
178190
159150
10
9
38
Q3’15 Q2’15
211
Q1’16
150
Q4’15
159
228
187
Q2’16
Recurring costs
Non-recurring costs
| 22

13/29/77
0/51/153
Colour scheme
54/97/222
121/150/233
188/202/244
217/217/217
191/191/191
166/166/166
127/127/127
B2H-blue
Strong operational performance
in Q2, with cash EBITDA
growing 49% on a y-o-y basis
Strong growth in EBIT q-on-q
Income statement Q2’16
Income statement Comments
1) Interest income including change in portfolio cash flow estimates, explained by permanent deviations to initial NPV of non-performing loan portfolio
2) Actual cash collection less interest income on purchased loan portfolios is equal to portfolio amortisation
NOKm Q2’15 2015
audited Q1’16 Q2’16
Interest income on purchased loan portfolios1 189 915 233 284
Revenue from external collection 23 104 24 26
Other operating revenues 12 57 22 22
Net operating revenues 223 1,076 279 332
Excess cash from collection over income2 103 424 182 143
Total cash revenue 327 1,500 461 474
External costs of services provided -52 -189 -53 -58
Personnel costs -60 -294 -81 -93
Other operating expenses -38 -188 -53 -60
Cash EBITDA 177 829 274 264
EBITDA 73 405 92 121
Depreciation and amortization -6 -28 -7 -7
EBIT 67 377 85 113
Net financials 26 -134 -79 -36
Tax -8 -45 -8 -15
Net profit 84 198 -2 63
Non-recurring items (net of tax) 0 79 9 10
Adjusted net profit 84 277 7 72
| 23
13/29/77
0/51/153
Colour scheme
54/97/222
121/150/233
188/202/244
217/217/217
191/191/191
166/166/166
127/127/127
B2H-blue
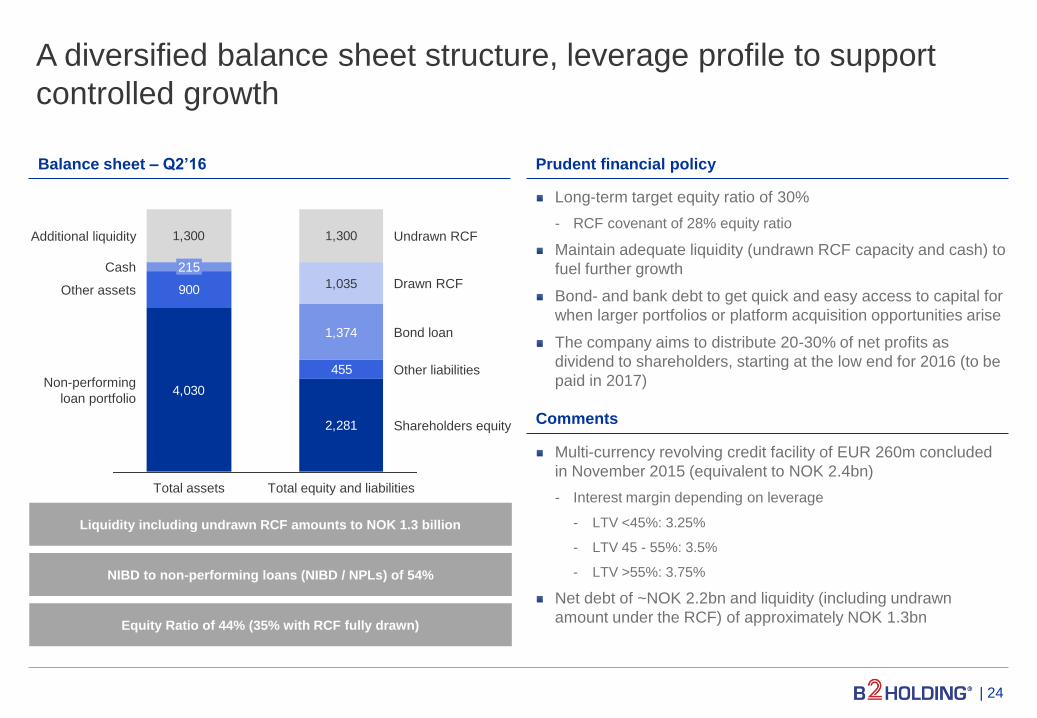
A diversified balance sheet structure, leverage profile to support
controlled growth
Balance sheet – Q2’16
Comments
Prudent financial policy
Multi-currency revolving credit facility of EUR 260m concluded
in November 2015 (equivalent to NOK 2.4bn)
- Interest margin depending on leverage
- LTV <45%: 3.25%
- LTV 45 - 55%: 3.5%
- LTV >55%: 3.75%
Net debt of ~NOK 2.2bn and liquidity (including undrawn
amount under the RCF) of approximately NOK 1.3bn
Long-term target equity ratio of 30%
- RCF covenant of 28% equity ratio
Maintain adequate liquidity (undrawn RCF capacity and cash) to
fuel further growth
Bond- and bank debt to get quick and easy access to capital for
when larger portfolios or platform acquisition opportunities arise
The company aims to distribute 20-30% of net profits as
dividend to shareholders, starting at the low end for 2016 (to be
paid in 2017)
Liquidity including undrawn RCF amounts to NOK 1.3 billion
Equity Ratio of 44% (35% with RCF fully drawn)
NIBD to non-performing loans (NIBD / NPLs) of 54%
| 24
2,281
455
1,374
1,035
1,300
4,030
900
1,300
Shareholders equity
Other liabilities
Total equity and liabilities
215 Cash
Bond loan
Total assets
Additional liquidity
Other assets
Undrawn RCF
Non-performing
loan portfolio
Drawn RCF
13/29/77
0/51/153
Colour scheme
54/97/222
121/150/233
188/202/244
217/217/217
191/191/191
166/166/166
127/127/127
B2H-blue
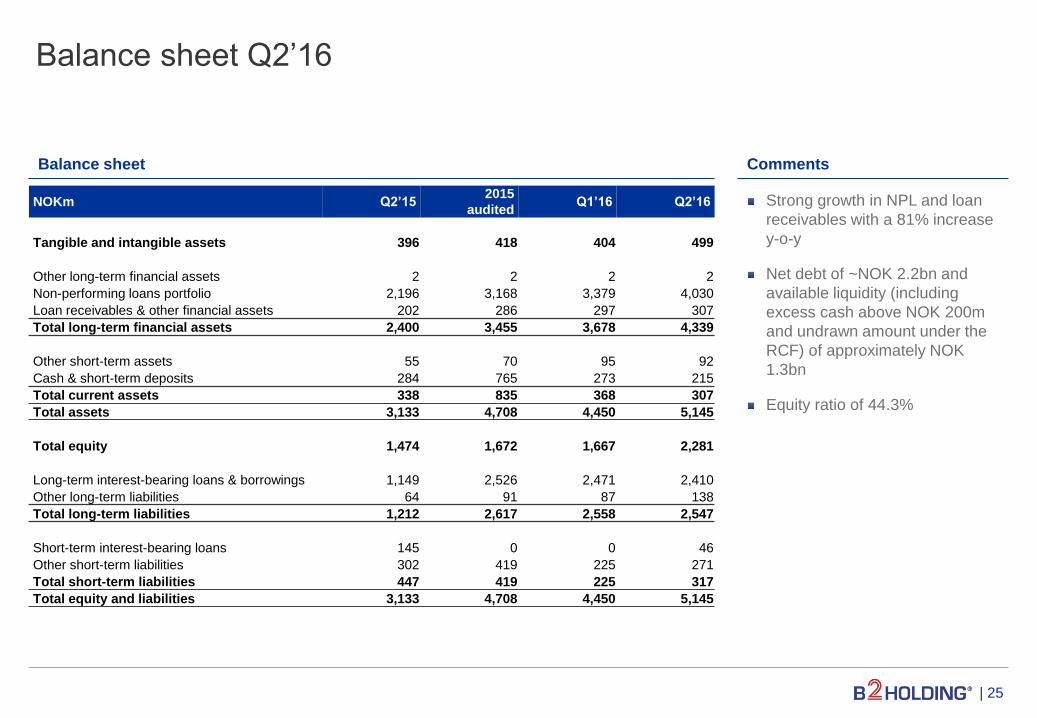
NOKm Q2’15 2015
audited Q1’16 Q2’16
Tangible and intangible assets 396 418 404 499
Other long-term financial assets 2 2 2 2
Non-performing loans portfolio 2,196 3,168 3,379 4,030
Loan receivables & other financial assets 202 286 297 307
Total long-term financial assets 2,400 3,455 3,678 4,339
Other short-term assets 55 70 95 92
Cash & short-term deposits 284 765 273 215
Total current assets 338 835 368 307
Total assets 3,133 4,708 4,450 5,145
Total equity 1,474 1,672 1,667 2,281
Long-term interest-bearing loans & borrowings 1,149 2,526 2,471 2,410
Other long-term liabilities 64 91 87 138
Total long-term liabilities 1,212 2,617 2,558 2,547
Short-term interest-bearing loans 145 0 0 46
Other short-term liabilities 302 419 225 271
Total short-term liabilities 447 419 225 317
Total equity and liabilities 3,133 4,708 4,450 5,145
Balance sheet Q2’16
Balance sheet Comments
Strong growth in NPL and loan
receivables with a 81% increase
y-o-y
Net debt of ~NOK 2.2bn and
available liquidity (including
excess cash above NOK 200m
and undrawn amount under the
RCF) of approximately NOK
1.3bn
Equity ratio of 44.3%
| 25
13/29/77
0/51/153
Colour scheme
54/97/222
121/150/233
188/202/244
217/217/217
191/191/191
166/166/166
127/127/127
B2H-blue
1. Credit update
2. Refresher on B2H
3. Industry dynamics and B2H's market position
4. Portfolio overview
5. Financials
6. Appendix
Agenda
| 26
13/29/77
0/51/153
Colour scheme
54/97/222
121/150/233
188/202/244
217/217/217
191/191/191
166/166/166
127/127/127
B2H-blue
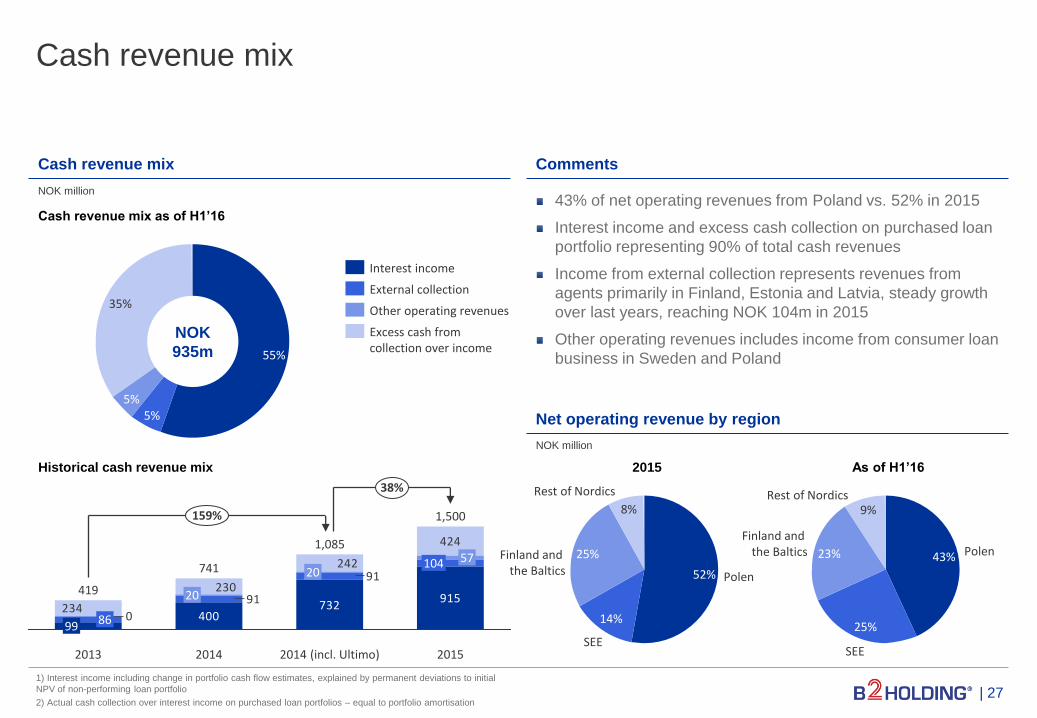
Cash revenue mix
| 27
Cash revenue mix Comments
1) Interest income including change in portfolio cash flow estimates, explained by permanent deviations to initial
NPV of non-performing loan portfolio
2) Actual cash collection over interest income on purchased loan portfolios – equal to portfolio amortisation
55%
35%
5% 5%
NOK
935m
400732
915
91
91
0234
424
242
230
2014 (incl. Ultimo)
1,085
86 99
20
2013
419
2014
20 741
38%
2015
1,500
104
159%
57
External collection
Other operating revenues
Interest income
Excess cash from collection over income
43% of net operating revenues from Poland vs. 52% in 2015
Interest income and excess cash collection on purchased loan
portfolio representing 90% of total cash revenues
Income from external collection represents revenues from
agents primarily in Finland, Estonia and Latvia, steady growth
over last years, reaching NOK 104m in 2015
Other operating revenues includes income from consumer loan
business in Sweden and Poland
Net operating revenue by region
Cash revenue mix as of H1’16
Historical cash revenue mix
NOK million
NOK million
Finland and the Baltics Polen
Rest of Nordics
52%
8%
25%
14%
SEE
43% 23%
9%
SEE
25%
Rest of Nordics
Finland and the Baltics Polen
2015 As of H1’16
13/29/77
0/51/153
Colour scheme
54/97/222
121/150/233
188/202/244
217/217/217
191/191/191
166/166/166
127/127/127
B2H-blue
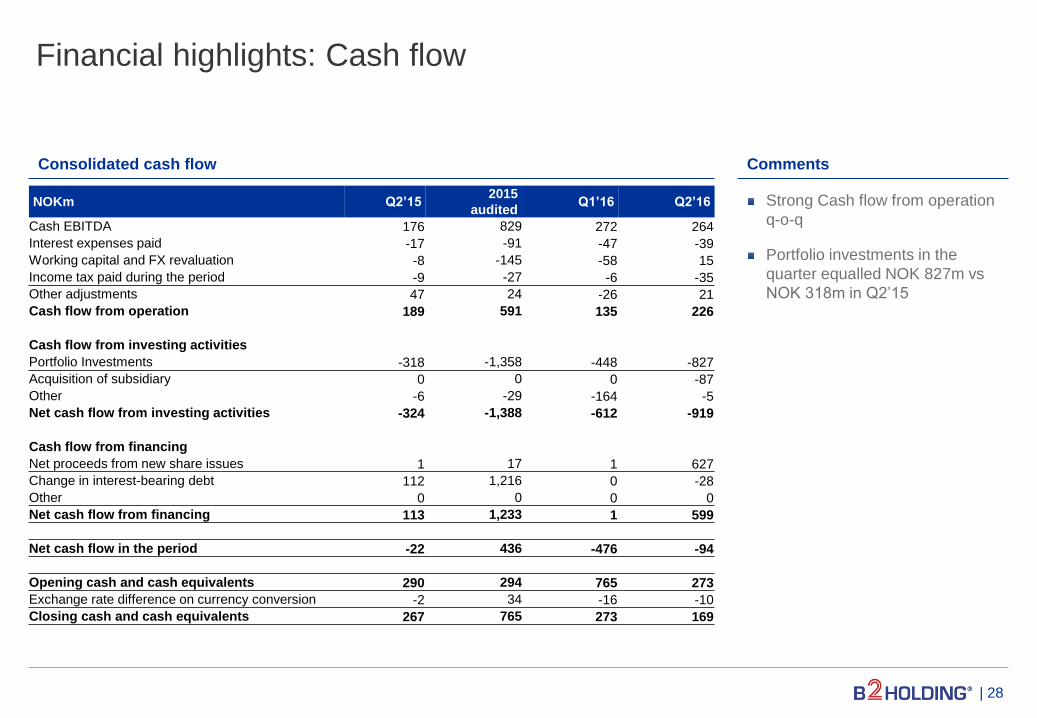
Financial highlights: Cash flow
Comments
Strong Cash flow from operation
q-o-q
Portfolio investments in the
quarter equalled NOK 827m vs
NOK 318m in Q2’15
NOKm Q2’15 2015
audited Q1’16 Q2’16
Cash EBITDA 176 829 272 264
Interest expenses paid -17 -91 -47 -39
Working capital and FX revaluation -8 -145 -58 15
Income tax paid during the period -9 -27 -6 -35
Other adjustments 47 24 -26 21
Cash flow from operation 189 591 135 226
Cash flow from investing activities
Portfolio Investments -318 -1,358 -448 -827
Acquisition of subsidiary 0 0 0 -87
Other -6 -29 -164 -5
Net cash flow from investing activities -324 -1,388 -612 -919
Cash flow from financing
Net proceeds from new share issues 1 17 1 627
Change in interest-bearing debt 112 1,216 0 -28
Other 0 0 0 0
Net cash flow from financing 113 1,233 1 599
Net cash flow in the period -22 436 -476 -94
Opening cash and cash equivalents 290 294 765 273
Exchange rate difference on currency conversion -2 34 -16 -10
Closing cash and cash equivalents 267 765 273 169
Consolidated cash flow
| 28
13/29/77
0/51/153
Colour scheme
54/97/222
121/150/233
188/202/244
217/217/217
191/191/191
166/166/166
127/127/127
B2H-blue
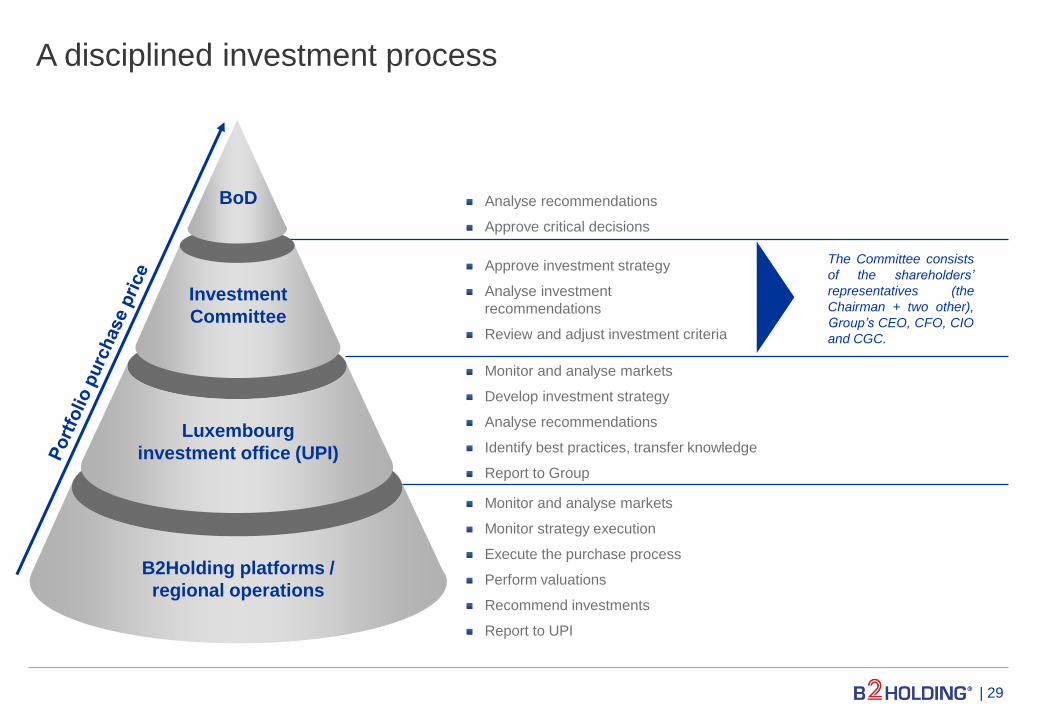
A disciplined investment process
B2Holding platforms /
regional operations
Luxembourg
investment office (UPI)
Investment
Committee
BoD
Monitor and analyse markets
Develop investment strategy
Analyse recommendations
Identify best practices, transfer knowledge
Report to Group
Monitor and analyse markets
Monitor strategy execution
Execute the purchase process
Perform valuations
Recommend investments
Report to UPI
Approve investment strategy
Analyse investment
recommendations
Review and adjust investment criteria
Analyse recommendations
Approve critical decisions
The Committee consists
of the shareholders’
representatives (the
Chairman + two other),
Group’s CEO, CFO, CIO
and CGC.
| 29
13/29/77
0/51/153
Colour scheme
54/97/222
121/150/233
188/202/244
217/217/217
191/191/191
166/166/166
127/127/127
B2H-blue
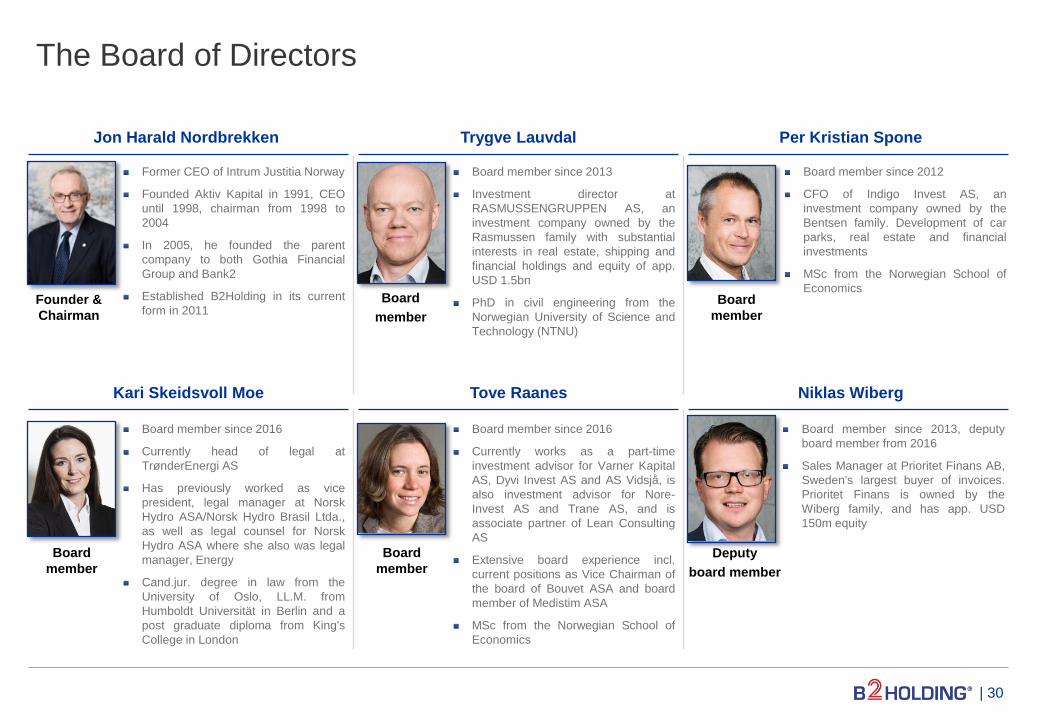
Tove Raanes
The Board of Directors
| 30
Jon Harald Nordbrekken
Founder &
Chairman
Trygve Lauvdal
Board
member
Per Kristian Spone
Board
member
Kari Skeidsvoll Moe
Board
member
Former CEO of Intrum Justitia Norway
Founded Aktiv Kapital in 1991, CEO
until 1998, chairman from 1998 to
2004
In 2005, he founded the parent
company to both Gothia Financial
Group and Bank2
Established B2Holding in its current
form in 2011
Board member since 2012
CFO of Indigo Invest AS, an
investment company owned by the
Bentsen family. Development of car
parks, real estate and financial
investments
MSc from the Norwegian School of
Economics
Board member since 2013
Investment director at
RASMUSSENGRUPPEN AS, an
investment company owned by the
Rasmussen family with substantial
interests in real estate, shipping and
financial holdings and equity of app.
USD 1.5bn
PhD in civil engineering from the
Norwegian University of Science and
Technology (NTNU)
Board member since 2016
Currently head of legal at
TrønderEnergi AS
Has previously worked as vice
president, legal manager at Norsk
Hydro ASA/Norsk Hydro Brasil Ltda.,
as well as legal counsel for Norsk
Hydro ASA where she also was legal
manager, Energy
Cand.jur. degree in law from the
University of Oslo, LL.M. from
Humboldt Universität in Berlin and a
post graduate diploma from King's
College in London
Board member since 2016
Currently works as a part-time
investment advisor for Varner Kapital
AS, Dyvi Invest AS and AS Vidsjå, is
also investment advisor for Nore-
Invest AS and Trane AS, and is
associate partner of Lean Consulting
AS
Extensive board experience incl.
current positions as Vice Chairman of
the board of Bouvet ASA and board
member of Medistim ASA
MSc from the Norwegian School of
Economics
Board
member
Niklas Wiberg
Board member since 2013, deputy
board member from 2016
Sales Manager at Prioritet Finans AB,
Sweden's largest buyer of invoices.
Prioritet Finans is owned by the
Wiberg family, and has app. USD
150m equity
Deputy
board member
13/29/77
0/51/153
Colour scheme
54/97/222
121/150/233
188/202/244
217/217/217
191/191/191
166/166/166
127/127/127
B2H-blue
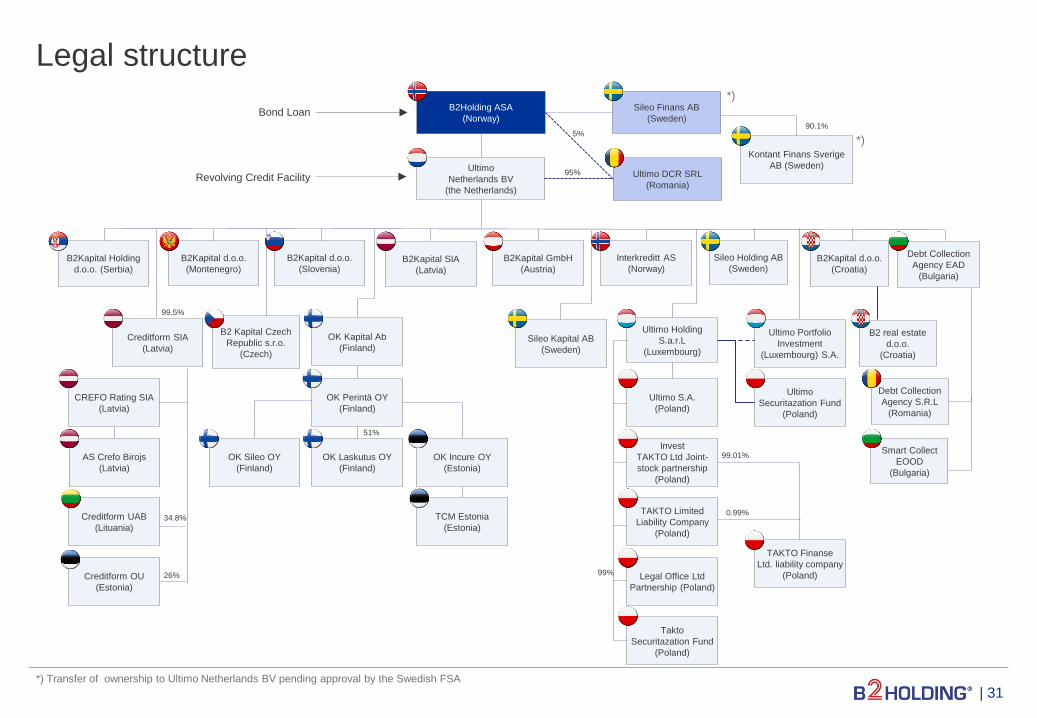
Legal structure
| 31 *) Transfer of ownership to Ultimo Netherlands BV pending approval by the Swedish FSA
Ultimo
Netherlands BV
(the Netherlands)
Sileo Finans AB
(Sweden)
Ultimo
Securitazation Fund
(Poland)
B2Kapital d.o.o.
(Montenegro)
B2Kapital Holding
d.o.o. (Serbia)
B2Kapital d.o.o.
(Slovenia) B2Kapital SIA
(Latvia)
B2Kapital GmbH
(Austria)
Interkreditt AS
(Norway) B2Kapital d.o.o.
(Croatia)
Sileo Holding AB
(Sweden)
OK Kapital Ab
(Finland) Sileo Kapital AB
(Sweden)
OK Perintä OY
(Finland)
OK Laskutus OY
(Finland)
OK Incure OY
(Estonia)
OK Sileo OY
(Finland)
TCM Estonia
(Estonia)
Creditform SIA
(Latvia)
Revolving Credit Facility
Creditform UAB
(Lituania)
Creditform OU
(Estonia)
CREFO Rating SIA
(Latvia)
Ultimo S.A.
(Poland)
Invest
TAKTO Ltd Joint-
stock partnership
(Poland)
TAKTO Limited
Liability Company
(Poland)
TAKTO Finanse
Ltd. liability company
(Poland) Legal Office Ltd
Partnership (Poland)
B2Holding ASA
(Norway)
Ultimo Holding
S.a.r.L
(Luxembourg)
Ultimo Portfolio
Investment
(Luxembourg) S.A.
Bond Loan
90.1%
99.5%
34.8%
26%
51%
99%
99.01%
0.99%
Takto
Securitazation Fund
(Poland)
B2 real estate
d.o.o.
(Croatia)
Kontant Finans Sverige
AB (Sweden)
B2 Kapital Czech
Republic s.r.o.
(Czech)
AS Crefo Birojs
(Latvia)
5%
95% Ultimo DCR SRL
(Romania)
Debt Collection
Agency EAD
(Bulgaria)
Debt Collection
Agency S.R.L
(Romania)
Smart Collect
EOOD
(Bulgaria)
*)
*)

B2Holding ASA | Stortingsgaten 22 | P.O. Box 1642 Vika | N-0119 Oslo
www.b2holding.no | Tel: +47 22 83 39 50 | E-mail: [email protected]