Roadshow June 27-29, 2005 Silvio de Carvalho Executive Director.
56
Roadshow June 27-29, 2005 Silvio de Carvalho Executive Director
-
date post
22-Dec-2015 -
Category
Documents
-
view
216 -
download
2
Transcript of Roadshow June 27-29, 2005 Silvio de Carvalho Executive Director.

Roadshow
June 27-29, 2005
Silvio de CarvalhoExecutive Director

2
Agenda
Brazilian Economy
Brazilian Banking System
Highlights
Strategy and In-depth Results
Performance of the Shares

3
Brazilian Macroeconomic Scenario
Floating exchange rate and outstanding adjustment in external
accounts
Monetary policy: inflation expectation and growth
Fiscal policy: accomplishment of fiscal targets, even without IMF
surveillance
Credit expansion: private sector crowding out
Baseline scenario
Brazil: towards investment grade

4
Recent overvaluation of the real
Jun-05 2.4
1.01.52.02.53.03.54.04.55.05.56.06.57.0
Ja
n-8
4
Ja
n-8
5
Ja
n-8
6
Ja
n-8
7
Ja
n-8
8
Ja
n-8
9
Ja
n-9
0
Ja
n-9
1
Ja
n-9
2
Ja
n-9
3
Ja
n-9
4
Ja
n-9
5
Ja
n-9
6
Ja
n-9
7
Ja
n-9
8
Ja
n-9
9
Ja
n-0
0
Ja
n-0
1
Ja
n-0
2
Ja
n-0
3
Ja
n-0
4
Ja
n-0
5
Effective basket 92-93 average R$/US$ Euro
Collor-ItamarPeriod
Pegged currency
Floating exchange rate
Plano Real
3.2
Real exchange rate

5
Trade surplus continues to widen
25
30
35
40
45
50
55
60
65
70
75
80
85
90
95
100
105
Jan
-03
Feb
-03
Mar-
03
Ap
r-0
3
May-0
3
Jun
-03
Jul-
03
Au
g-0
3
Sep
-03
Oct-
03
Nov-0
3
Dec-0
3
Jan
-04
Feb
-04
Mar-
04
Ap
r-0
4
May-0
4
Jun
-04
Jul-
04
Au
g-0
4
Sep
-04
Oct-
04
Nov-0
4
Dec-0
4
Jan
-05
Feb
-05
Mar-
05
Ap
r-0
5
May-0
5 6
8
10
12
14
16
18
20
22
24
26
28
30
32
34
36
38
Exports (L) Imports (L) Trade balance (R)
Trade surplus – accumulated in 12-months
US$ billion
Source: Central Bank of Brazil
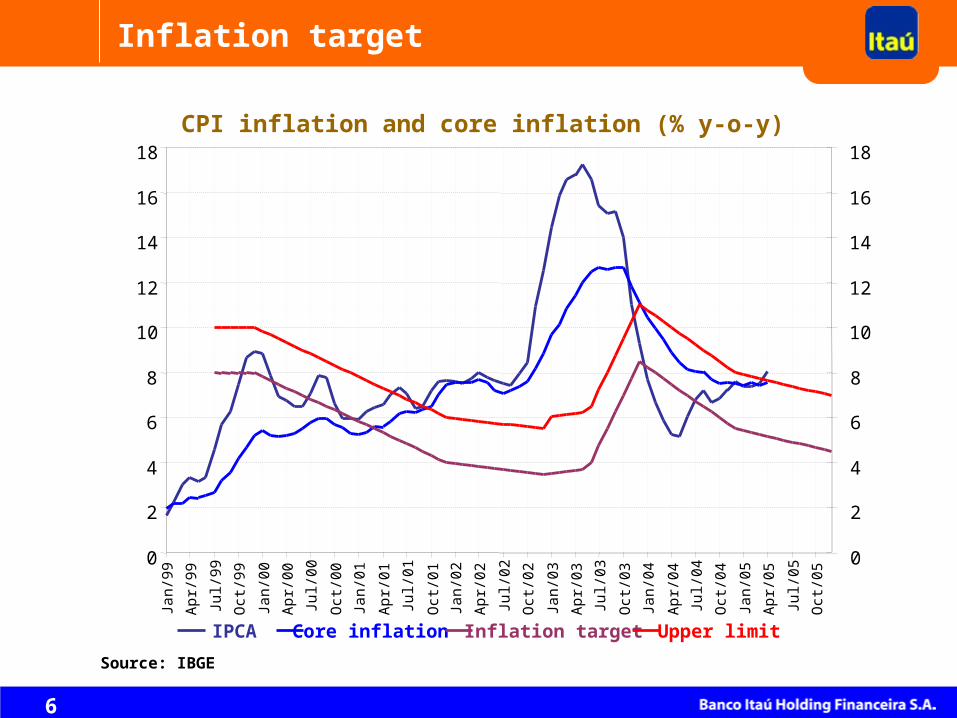
6
Inflation target
Source: IBGE
0
2
4
6
8
10
12
14
16
18Ja
n/9
9
Apr/
99
Jul/9
9
Oct
/99
Jan/0
0
Apr/
00
Jul/0
0
Oct
/00
Jan/0
1
Apr/
01
Jul/0
1
Oct
/01
Jan/0
2
Apr/
02
Jul/0
2
Oct
/02
Jan/0
3
Apr/
03
Jul/0
3
Oct
/03
Jan/0
4
Apr/
04
Jul/0
4
Oct
/04
Jan/0
5
Apr/
05
Jul/0
5
Oct
/05
0
2
4
6
8
10
12
14
16
18
IPCA Core inflation Inflation target Upper limit
CPI inflation and core inflation (% y-o-y)

7
Inflationary expectations converging back toward the target
Median of market expectations for IPCA (%)
20056.35
20065.00
4.0
4.5
5.0
5.5
6.0
6.5
7.0
Jan-04 Mar-04 May-04 Jul-04 Sep-04 Nov-04 Jan-05 Mar-05 May-05
2005 2006
Source: Focus Survey/Central Bank of Brazil

8
Growth resumption and recent convergencetowards potential growth
2.4%
1.1%
0.1%
-0.5%
1.9%
4.2% 4.0%
2.5%
0.2%0.7%
2.5%
1.4%1.2%
4.9%4.6%
-1%
0%
1%
2%
3%
4%
5%
19
98
.I
19
98
.III
19
99
.I
19
99
.III
20
00
.I
20
00
.III
20
01
.I
20
01
.III
20
02
.I
20
02
.III
20
03
.I
20
03
.III
20
04
.I
20
04
.III
20
05
.I
15
16
17
18
19
20
21
1997.I
V
1998.I
I
1998.I
V
1999.I
I
1999.I
V
2000.I
I
2000.I
V
2001.I
I
2001.I
V
2002.I
I
2002.I
V
2003.I
I
2003.I
V
2004.I
I
2004.I
V
2005.I
I
2005.I
V
GDPGrowth accumulated in 4 quarters
Fixed Investment/GDP (%) -Prices as of the previous year average 2005:
19.5%
average 2004: 18.8%
Source:IBGE and Banco Itaú´s projection

9
Primary surplus since 1998
-2.47%
-7.49%
5.01%
-12%
-10%
-8%
-6%
-4%
-2%
0%
2%
4%
6%
Dec/
98
Jun/9
9
Dec/
99
Jun/0
0
Dec/
00
Jun/0
1
Dec/
01
Jun/0
2
Dec/
02
Jun/0
3
Dec/
03
Jun/0
4
Dec/
04
Nominal deficit Interest payments Primary surplus
Apr-05
Fiscal policy stance
Source: Central Bank of Brazil

10
Increase in the private investment/GDP (%)
Source: Central Bank of Brazil
Total Credit and Public Sector Debt
20
25
30
35
40
45
50
55
60
65
Jul-9
4
No
v-9
4
Ma
r-9
5
Jul-9
5
No
v-9
5
Ma
r-9
6
Jul-9
6
No
v-9
6
Ma
r-9
7
Jul-9
7
No
v-9
7
Ma
r-9
8
Jul-9
8
No
v-9
8
Ma
r-9
9
Jul-9
9
No
v-9
9
Ma
r-0
0
Jul-0
0
No
v-0
0
Ma
r-0
1
Jul-0
1
No
v-0
1
Ma
r-0
2
Jul-0
2
No
v-0
2
Ma
r-0
3
Jul-0
3
No
v-0
3
Ma
r-0
4
Jul-0
4
No
v-0
4
Ma
r-0
5
% GDP
20
22
24
26
28
30
32
34
36
38
40% GDP
Net public debt Total credit

11
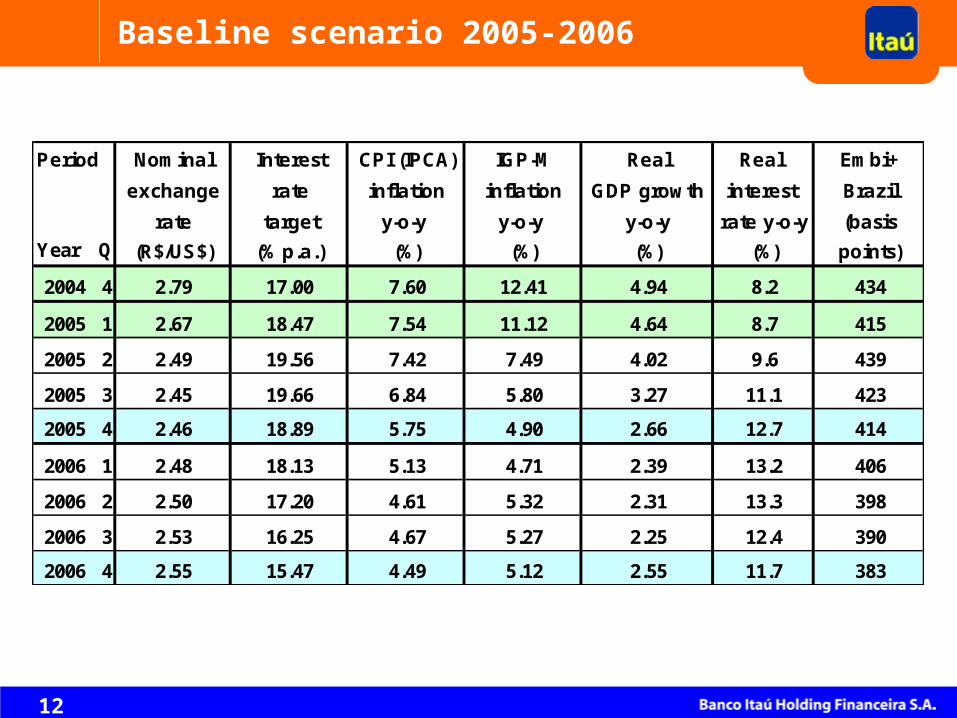
Baseline scenario 2005-2006
Hypothesis:
Exchange rate: remains constant in real terms, taking into account the difference between Brazil’s CPI (IPCA) inflation and US PPI inflation
Inflation expectations: 6.2% in 2005 and 5.0% in 2006 (Focus Survey on June 17, 2005)
Interest rate path: compatible with limiting aggregate demand acceleration in order to bring inflation back to the target path
Primary budget surplus: 4.25% of GDP in 2005 and 2006
GDP linear growth trend: 3.0% in 2005 and 3.5% in 2006
Commodities’ prices remain constant in the forecasting horizon
World trade real growth: 9.5% in 2005 and 8% in 2006
12
Baseline scenario 2005-2006
Period Nominal Interest CPI (IPCA) IGP-M Real Real Embi+
exchange rate inflation inflation GDP growth interest Brazil
rate target y-o-y y-o-y y-o-y rate y-o-y (basis
Year Q (R$/US$) (% p.a.) (%) (%) (%) (%) points)
2004 4 2.79 17.00 7.60 12.41 4.94 8.2 434
2005 1 2.67 18.47 7.54 11.12 4.64 8.7 415
2005 2 2.49 19.56 7.42 7.49 4.02 9.6 439
2005 3 2.45 19.66 6.84 5.80 3.27 11.1 423
2005 4 2.46 18.89 5.75 4.90 2.66 12.7 414
2006 1 2.48 18.13 5.13 4.71 2.39 13.2 406
2006 2 2.50 17.20 4.61 5.32 2.31 13.3 398
2006 3 2.53 16.25 4.67 5.27 2.25 12.4 390
2006 4 2.55 15.47 4.49 5.12 2.55 11.7 383

13
Investment grade
• The external indicators project the possibility of Brazil reaching an investment grade rating in 2008
(D/X = external debt/current account receipts equal to 1)
• Fiscal indicators lag behind, but by 2008 there is a chance that debt as % of GDP in clear declining trend would also qualify Brazil to that rating
US$ billion 2003 2004 2005 2006 2007 2008 2009 2010
Net FDI 9.9 8.5 10.0 10.0 10.0 10.0 10.0 10.0Current account/GDP 0.8% 1.9% 1.0% 0.4% 0.4% 0.7% 1.0% 1.3%
Primary Surplus (% GDP) 4.4% 4.6% 4.3% 4.3% 4.3% 4.3% 4.3% 4.3%Public debt / GDP 57.2% 51.8% 51.4% 51.0% 48.0% 45.6% 43.7% 41.9%Current account 4.0 11.6 6.4 2.6 3.3 5.9 8.5 11.2Trade balance 24.8 33.7 31.4 28.8 28.8 29.5 30.7 32.0External debt with IMF 28.3 24.3 17.5 9.1 0.0 0.0 0.0 0.0
Total external debt (with intercia)235.4 220.3 211.2 188.7 166.0 149.1 129.6 107.3Gross Reserves 49.3 52.3 57.5 49.1 41.0 41.0 41.0 41.0Real FX devaluation 0.1% -5.4% -5.5% 0.0% 0.0% 0.0% 0.0% 0.0%Inflation rate 9.3% 7.6% 5.7% 4.0% 3.8% 3.9% 4.0% 4.0%Real interest rate 13% 8% 11% 10% 8% 6% 7% 7%Real GDP growth 0.5% 5.2% 2.5% 2.8% 4.5% 3.3% 2.9% 3.0%
International trade growth 15.2% 18.5% 9.5% 6.0% 4.5% 4.5% 4.5% 4.5%
D/X Moody's 2.62 1.92 1.68 1.38 1.14 1.02 0.87 0.70

14
Agenda
Brazilian Economy
Brazilian Banking System
Highlights
Strategy and In-depth Results
Performance of the Shares

15
Brazilian Banking System
Macro Characteristics Micro Scenario
Huge fixed costs Cost reduction / efficiency Strongly capitalized Room for growth in credit Satisfactory level of provisioning Conservative approach
Advanced risk management Advanced banking supervision; preparation for Basel II
Importance of banking service fees Specific for each segment
Profitable Target: to keep profitability in lower margins scenario
Oriented to services Intensive use of technology, focused
on self-service and Internet All bills are paid in the banks
Huge transaction volumes
High spreads Falling due to decline in interest rates
Dimension Differentiated needs
High reserve requirements High impact over spreads

16
Declining Interest Rates x Increasing Loan Demand: New Revenue Dynamics
Growing Fee Earnings and Tighter Cost Control To Offset Lower Treasury Gains
Focus on Higher-Yielding Consumer Finance and SME Lending
Efforts of Client Acquisition and Gains of Scale
Government Still Attracts Large Portions of the System’s Liquidity; Gradual Replacement of Bonds By Loans
Public Sector Banks Still Dominant: 45% of Deposits
More Aggressive Competition, Not Price Wars
Current Scenario

17
1. Citigroup2. Crédit Agricole Group 3. HSBC Holdings4. Bank of America Corp.5. JP Morgan Chase & Co.6. Mizuho Financial Group7. Mitsubishi Tokyo8. Royal Bank of Scotland9. Sumitomo Mitsui10. BNP Paribas20. ABN AMRO Bank109. Bradesco113. Bank of Taiwan114. Banco Itaú116. Standard Bank Group117. Banco do Brasil171. Unibanco
December 2003
Assets
1,2641,1051,034
736771
1,285975806950989668617041818024
US$Billion
2nd
4th
5th
15th
13th
1st
8th
10th
9th
7th
18th
139th
125th
197th
115th
117th
268th
Rank
BIS
12.0 %10.5 %12.0 %11.9 %11.8 %11.4 %13.0 %11.8 %11.4 %12.9 %11.7 %19.9 %14.6 %
19.8 %14.8 %13.7 %18.6 %
Index
6755554443383735343223544442
SE(1)
US$ Billion
ROA
%
167th
633rd
401st
154th
382th
638th
536th
361st
755th
569th
510th
309th
816th
17th
283rd
169th
84th
Rank (*)
Source: The Banker Top 1000 - July/04 (1) Stockholder´ Equity
2.1 %0.7 %1.2 %2.2 %1.3 %0.7 %0.9 %1.4 %0.4 %0.8 %0.9 %1.5 %0.3 %4.7 %1.6 %2.1 %2.8 %
The Banker Top 1000

18
Capital (Tier One) / Assets (%)
9.2%
14.2%
12.3%11.4%11.7%
9.1%9.9%
9.1%10.2%
12.0%11.9%11.1%
9.1%7.8%
4.3% 4.4% 4.5% 4.7% 4.7% 4.6% 4.6% 4.5% 4.7% 4.9% 4.7% 4.6% 4.5% 4.4%
0%
2%
4%
6%
8%
10%
12%
14%
16%
90 91 92 93 94 95 96 97 98 99 00 01 02 03
Brazilian Banks 1,000 Largest Banks in the World
Source: THE BANKER - Top 1000 – July 2004

19
1. Citigroup2. Bank of America Corp.3. HSBC4. JP Morgan Chase & Co.5. RBS Group†6. Wells Fargo & Co.7. UBS AG8. Wachovia Corp.9. Santander10. Barclays13. Morgan Stanley19. Merrill Lynch & Co.20. US Bancorp21. Credit Suisse Group22. Goldman Sachs23. Lloyds TSB47. Hang Seng Bank49. Bank of New York Co. Inc.56. Banco Itaú Holding Financeira S.A. 65. Kookmin Bank67. Bradesco97. Banco do Brasil S.A.139. Unibanco
BanksMarket Cap.
251,782188,517177,236133,058108,009103,82998,23785,24279,85770,94465,20357,16557,03855,76455,41454,43826,00023,96120,27716,14415,6719,8105,238
US$ Million
United StatesUnited StatesUnited KingdomUnited StatesUnited KingdomUnited StatesSwitzerlandUnited StatesSpainUnited KingdomUnited StatesUnited StatesUnited StatesSwitzerlandUnited StatesUnited KingdomHong kongUnited StatesBrasilKoreaBrasilBrasilBrasil
Country
Source : UBS Global Banks Valuations 03/08/05
Itaú is the 2nd largest bank
by Market Cap. in
Emerging Markets
Global Banks Valuations

20
Agenda
Brazilian Economy
Brazilian Banking System
Highlights
Strategy and In-depth Results
Performance of the Shares

21
69.681.8
127.0146.4
130.3118.8111.1
2000 2001 2002 2003 2004 1stQ/04
1stQ/05
27.334.3
45.4 44.653.3
44.8
57.0
2000 2001 2002 2003 2004 1stQ/04
1stQ/05
6.6 7.69.0
11.914.0
12.514.6
2000 2001 2002 2003 2004 1stQ/04
1stQ/05
7.3 8.110.0
14.217.1
8.611.6
2000 2001 2002 2003 2004 1stQ/04
1stQ/05
+15.3% +16.8%
+27.4%
+35.2%
Highlights
Assets (R$ Billion)
Credit Operations (R$ Billion)
Stockholders’ Equity (R$ Billion)
Technical Provisions – Insurance, Pension Plans and Capitalization (R$ Billion)

22
3,0612,373
10,2209,224
7,2505,892
4,541
2000 2001 2002 2003 2004 1stQ/04
1stQ/05
1,841
3,776
8761,141
3,152
2,3772,389
2000 2001 2002 2003 2004 1stQ/04
1stQ/05
7,056
8,770
2,3812,183
9,0148,425
5,996
2000 2001 2002 2003 2004 1stQ/04
1stQ/05
3,6994,277
6,165
1,405 1,794
3,465
5,121
2000 2001 2002 2003 2004 1stQ/04
1stQ/05
+30.3% +27.7%
+9.1% +29.0%
Highlights
Net Income (R$ Million)
Administrative Expenses (R$ Million)
Banking Service Fees (R$ Million)
Net Interest Margin (R$ Million)

23
27.7%31.5%
26.3% 26.5% 27.0%31.2%
35.1%
2000 2001 2002 2003 2004 1stQ/04
1stQ/05
2,6%2,9%
2,1%
2,7%2,9% 2,8%
3,2%
2000 2001 2002 2003 2004 1stQ/04
1stQ/05
14.4%16.9%
18.4%19.8% 20.6% 19.8%
18.3%
2000 2001 2002 2003 2004 1stQ/04
1stQ/05
67.2%62.1% 58.2% 54.5% 52.4%
58.0%49.4%
2000 2001 2002 2003 2004 1stQ/04
1stQ/05
Obs: Annualized quarterly indexes.
Highlights
ROE (%)
ROA (%)
BIS Ratio (%)
Efficiency Ratio (%)

24
3,0763,1463,0733,1723,1923,184
2,995
2000 2001 2002 2003 2004 1stQ/04
1stQ/05
3,7753,293
3,6243,157
2,5981,998
1,427
2000 2001 2002 2003 2004 1stQ/04
1stQ/05
21,34620,13320,02121,150
17,926
13,77712,064
2000 2001 2002 2003 2004 1stQ/04
1stQ/05
42,450 45,31642,058
44,99243,21545,40947,524
2000 2001 2002 2003 2004 1stQ/04
1stQ/05
(*) Without Credicard and FIC employees.
Highlights
Branches+CSBs
Internet Banking Clients (In million)
ATMs
Employees
(*)

25
Agenda
Brazilian Economy
Brazilian Banking System
Highlights
Strategy and In-depth Results
Performance of the Shares

26
2. Growth of Credit Portfolio on the quarter of 7.0%: Personal Credit (22.2%) and Automobile (17.3%);
5. Full amortization of the goodwill: Associating process with LASA, amounting R$ 182 million (after tax effects);
3. Growth of Provisions: Constitution of R$ 150 million of Exceeding Provision for Loan Losses on the quarter, amounting R$ 1,150 million;
Maintenance of Additional Provision for Securities Portfolio of R$ 400 million;
1. Results: Net Income of R$ 1,141 million with an increase of 10.8% q-o-q and of 30.3% when compared to the net income of R$ 876 million of the 1st. Q/04; ROE 35.1%; Earnings per share R$ 10.04;
4. Delinquency: Maintenance of the Nonperforming Loans ratio in 2.9%;
6. Creation of a new segment – Consumer Credit - Itaucred: disclosure of the result of operations performed in channels for non-account customers.
Highlights

27
Itaú
CorporationItaucredItaú BBAItaubanco
Segmentation

28
Itaú
ItaucredItaú BBAItaubanco
Banking
Credit Cards
Insurance, Pens. Plans
and Capitalization
Resources Managed
Segmentation
Corporation

29
R$ Million
(*) Rural and Mortgage Loans – Loans linked to the availability of Demand deposits and Savings deposits.
Mar 31, 05 Dec 31, 04 Mar 31, 04Var Mar, 05
-Dec, 04Var Mar, 05
-Mar, 04
Individuals 20,770 18,272 12,769 13.7%. 62.7%
Loans to Companies 31,891 30,467 28,255 4.7% 12.9%
Small and Medium Sized 9,037 8,571 5,650 5.4% 60.0%
Corporate 22,854 21,896 22,605 4.4% 1.1%
Mandatory Loans (*) 4,351 4,536 3,732 -4.1% 16.6%
Total - Loans 57,012 53,275 44,757 7.0% 27.4%
Public Securities - Brazil 7,218 7,486 12,939 -3.6% -44.2%
Private Securities 11,660 12,145 9,526 -4.0% 22.4%
Total - Securities 18,878 19,631 22,465 -3.8% -16.0%
Total 75,890 72,906 67,221 4.1% 12.9%
Exposure – Loans and Securities

30
16,890
47,40750,980
19,596
27,253
34,282
44,581
53,27557,012
38,419 38,659
29,615
23,674
14,058
16,916
45,414
0
10,000
20,000
30,000
40,000
50,000
60,000
1998 1999 2000 2001 2002 2003 2004 2005 (*)
Credit Operations Credit Operations including Endorsements and Sureties
R$ Million
CAGR: 21.5%
CAGR: 22.9%
Credit Operations
(*) On March 31, 2005.
Credit Portfolio

31
9
34
16
41
2004
Restricted Loans
Individuals
Small and Medium-sized companies
Corporate Loans
In %
9
29
11
51
2003
40%
8
36
16
40
Mar/2005
52%
Change in the mix of the Credit Portfolio

32
Coverage Ratio (*)
202% 204%210%
220% 221%
0%
50%
100%
150%
200%
250%
Mar-04 Jun-04 Sep-04 Dec-04 Mar-05
Nonperforming Loans Ratio (%)
4.03.5
3.22.9 2.9
5.66.0 5.6
6.57.3
0.80.9
1.51.81.9
0.00
2.00
4.00
6.00
8.00
10.00
12.00
Mar-04 Jun-04 Sep-04 Dec-04 Mar-05
Nonperforming Loans Ratio – GlobalNonperforming Loans Ratio – IndividualsNonperforming Loans Ratio – Companies
(*) Provision for Loan Losses / Total Nonperforming Loans
We are not expecting an ongoing improvement in these indicators, because of the focus on credit products with higher margins, but, at the same time, with a higher credit risk.
Nonperforming Loans Ratio and Coverage Ratio

33
SecuritiesAdjust. market value
Additional Provision
Total
(*) Values differ from the one published in note “Market Value” because they are net of the additional provision for securities.
Additional Provision for Loan Losses (PDD)
Financial Instruments: Market vs. Recorded Value(*)
R$ 540 million
R$ 400 million
R$ 3.7 billion
Mar. 31, 2005
R$ 1.15 billion
R$ 1.75 billion
R$ 733 million
R$ 400 million
R$ 3.8 billion
Dec. 31, 2004
R$ 1.0 billion
R$ 1.67 billion
R$ 712 million
R$ 545 million
R$ 4.0 billion
Mar. 31, 2004
R$ 1.0 billion
R$ 1.73 billion
Conservative Accounting Practices

34
R$ Million
(1) Mutual Funds and Consortium.(2) Adjusted in 4Q04 in R$ 124 million related to Collection Services for INSS.
1st Q/05 4th Q/04 Var 1Q05- 4Q04
Var 1Q05- 1Q04
Asset Management (1) 398 376 345 22 53
Current Account Services 349 327 289 22 60
Credit Cards 437 371 244 66 193
Sureties and Credits 271 266 195 4 76
Collection Services (2) 209 178 203 31 6
Other 131 158 129 (26) 2
Total 1,794 1,675 1,405 119 389
1st Q/04
Service Fees

35
R$ Million
03/31/05 12/31/04 03/31/04
Stockholders’ Equity
Interbank Deposits 4 14 9
Securities and Derivatives 555 620 693
Credit Operations 216 248 399
Investment on BPI 765 660 697 Time and Interbank Deposits and Funds from
acceptance and issuance of securities abroad9 (41) 71
Securitization of Payment Orders Abroad 91 93 109
Subordinated Debt and Treasury Shares 506 480 298
Total Unrealized 2,147 2,074 2,275
Unrealized Income/(Loss) (1) (2)
(1) Tax effects not considered.(2) Includes unrealized minority interest gains in Equity of R$ 336 million in March/05, R$ 299 million in December/04, R$ 399 million
in March/04.
Financial Instruments – Market Value

36
(1) Excludes endorsements and sureties.
Maturity of Operations (in days)
R$ Million
Credit Operations (*)
Securities and Derivatives
Total (A)
Assets
12,717
11,579
24,296
0-30
15,162
4,254
19,416
31-180
6,661
3,638
10,299
181-365
16,009
10,680
26,689
Over 365
50,980
30,150
81,130
Total
Deposits
Money Market
Total (B)
Liabilities
34,341
7,174
41,515
0-30
4,378
2,399
6,777
31-180
3,842
999
4,841
181-365
1,464
6,794
8,258
Over 365
44,025
17,367
61,392
Total
Total (A)-(B) (17,219) 12,639 5,457 18,431 19,738
March 31, 2005

37
R$ Million
Highlights of Pro Forma Segments
Note: The Consolidated figures do not represent the sum of the parts because certain intercompany transactions were eliminated only at the Consolidated level.
(1) Quarterly Net Income. (2) including Endorsements and Sureties.
Itaubanco Itaú BBA Itaucred Corporation Itaú
Net Income (1) 767 257 123 (7) 1,141 Allocated Capital Tier I 7,588 3,235 1,106 2,699 14,629 ROE (%) 47.0% 35.8% 52.4% -1.0% 35.1%Credit Portfolio (2) 23,928 22,472 10,612 - 57,012 Total Assets 119,595 40,919 10,275 5,358 146,403
Mar/05
Itaubanco Itaú BBA Itaucred Corporation Itaú
1,332 242 105 (648) 1,030 6,868 3,194 975 2,934 13,971
103.2% 33.9% 50.7% -63.2% 32.9%
22,070 22,051 9,154 - 53,275 101,119 33,902 8,863 6,597 130,339
Dec/04
Net Income (1)
Allocated Capital Tier I
ROE (%)
Credit Portfolio (2)
Total Assets

38
Itaubanco - Banking
Credit Cards
Insurance, Pension Pl. and Cap.
Mutual Funds and Managed Portfolio
Total
R$ Million
1st Q/05 4th Q/04 (*) Variation
469 637 (168)
105 69 36
132 101 31
61 38 23
767 846 (79)
1st Q/05
61.1%
8.0%
17.2%
13.7%
Itaubanco - BankingCredit CardsInsurance, Pension Plans and CapitalizationMutual Funds and Managed Portfolio
Diversification of income sourcesNot dependent only on interest rates
(*) Adjusted by eventual items of R$ 612 million in Net Interest Margin, R$ 124 million in Service Fees and of R$ 250 million in Tax Income and Social Contribution.
Consolidated Net Income

39
Credit Cards
R$ Million (Except where indicated)
Participation in the Net Income of Orbitall and Redecard
Nº of Cards - Itaucard (thousands)
Nº of Cards - Credicard (thousands) (*)
Nº of Cards - Total (thousands)
2004 2003 Variation
7,085
3,595
10,680
12,956
6,519
19,475
390
90
480
5,780
2,246
8,026
10,603
4,787
15,390
400
99
499
1,305
1,349
2,654
2,353
1,732
4,085
(10)
(9)
(19)
22.6%
60.0%
33.1%
22.2%
36.2%
26.5%
-2.5%
-9.1%
-3.8%
(*) Corresponds to the share of Credicard owned by Itaú – 50% at 2004 and 33% at 2003.
63 41 22 53.7%
Turnover - Itaucard
Turnover - Credicard (*)
Turnover - Total
Net Income - Itaucard
Net Income - Credicard (*)
Net Income - Total

40
R$ Million
The Combined Ratio has shown a falling trend for 8 quarters.
1st Q/05 4th Q/04 VariationInsurance Premiums, Pension Plans Contributions and Premium Bonds Revenues 1,362 1,695 (333)
Changes in Technical Provisions (382) (843) 461 Selling Expenses (108) (103) (5) Insurance Claims, Pension Plans Benefits and Premium Bonds Redemption (690) (578) (112)
Other Operating Income/(Expenses) 1 15 (14) Operating Margin 183 186 (3) Financial Income 123 115 8 Non-Interest Expenses (143) (152) 9 Income Tax and Social Contribution (46) (23) (23) Other 15 (24) 39
132 101 31
Combined Ratio 90.9% 92.9% 2.0%
Claim Ratio 51.2% 49.7% 1.5%
Result of Ins., Pension Plans and Cap.
Insurance, Pension Plans and Capitalization

41
87.199.8
105.2
Mar-04 Dec-04 Mar-05
8.6
11.0 11.6
Assets under Management andTechnical Provisions
R$ Billion
Technical Provisions of Insurance, Pension Plans and Capitalization
Volume of Mutual Funds and Portfolios under Management
Growth of 20.8% in the volume of Funds and Portfolios under Management and 35.2% in the volume of Technical Provisions in relation to Mar/2004

42
Itaú
CorporationItaucredItaú BBAItaubanco
Corporate Operation
Segmentation

43
R$ Million
1º Tri/05 4º Tri/041st Q/05 4th Q/04 1st Q/04Var. 1Q/05
- 4Q/04Var. 1Q/05
- 1Q/04
Net Interest Margin 370 464 242 (94) 128 Result from Loan Losses 67 31 162 36 (95) Service Fees 80 84 64 (4) 16 Non-Interest Expenses (130) (159) (147) 28 17 Tax Income and Social Contribution (103) (151) (94) 49 (9) Other (27) (27) (17) 1 (10)
Net Income 257 242 210 16 47 Tier I Allocated Capital 3,235 3,194 2,768 41 467 ROE (%) 35.8% 33.9% 33.9%
Itaú BBA Pro Forma

44
Strategy
Itaú BBA: wholesale bank integrated into a financial conglomerate; Credit perspective for the corporate segment in Brazil: declining spreads, increase in
the competition, limited client base. Currently 51% of all our revenues are non-credit related;
Challenge: to maintain current profitability levels in the next years considering lower margins in credit;
Our strategy: compensate lower gains in credit with an increase in the distribution of non-credit related products and services to our clients through:
Cross-selling – continue to take advantage of the synergy with Itaú, by increasing the selling of structured treasury operations such as hedging and also simpler products such as payroll and collection;
Investment banking – segment likely to expand in the next 5 years (we expect that by the end of this period Brazil becomes an investment grade country).
Itaú BBA is well-positioned in investment banking – leader in fixed income issuances and reinforcing our variable income team in order to build a strong investment banking.
Investment banking currently stands for 5% of Itaú BBA´s revenues. In the next 5 to 6 years our goal is to increase this participation to 20%.

45
Itaú
CorporationItaucredItaú BBAItaubanco
FIC50% CBD50% Itaú
FAI50% LASA50% Itaú
Own stores
100% Itaú
Payroll Credit
FináustriaItaucred VehiclesBanco FiatIntercap
Vehicle Credit Cardsnon customers 50% Credicard
Credit for Individuals

46
Taií
New Brand Name (Itaú-based).
Focus on lower income
consumers.
Proprietary platform.
Uses the Itaú ATM network.
Diversifies credit-related
revenues.
Responsive and efficient.
Expansion of Focus on
direct consumer credit
Long term partnership: 20
years, and renewal option
Operating Management under the responsibility of Itaú
Exclusivity in exploitation
of financial products and
services to retailers’
customers
Retail partnershipsCBD and LASA
Credit for Individuals
47
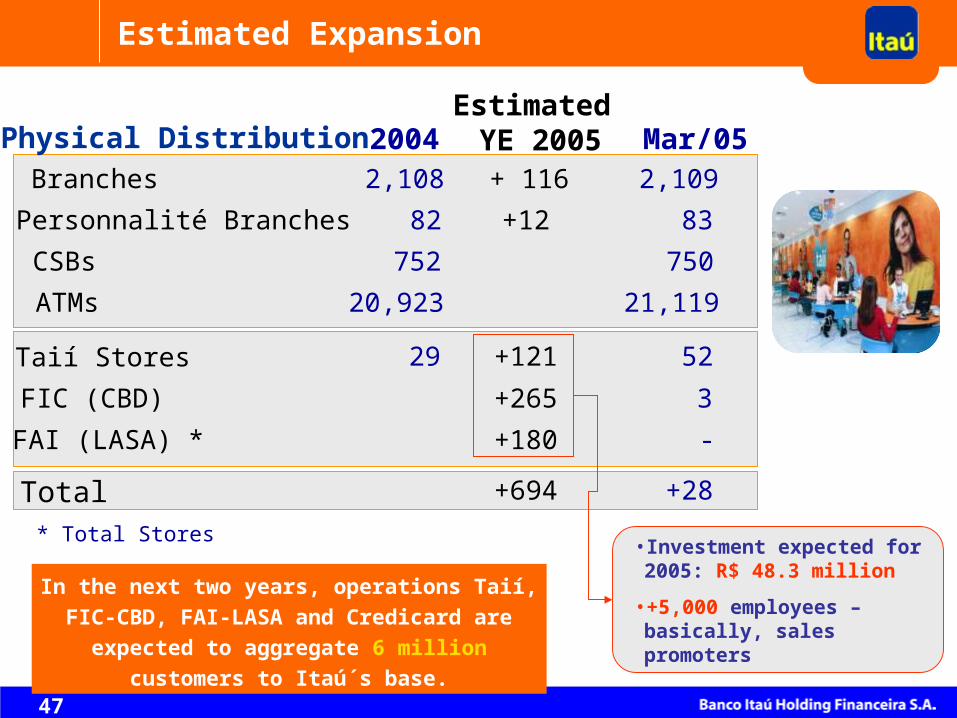
Estimated Expansion
2004
CSBs 752
FIC (CBD) +265
FAI (LASA) * +180
Physical DistributionEstimated
YE 2005Branches 2,108 + 116
Personnalité Branches 82 +12
ATMs 20,923
29 +121Taií Stores
Total +694
* Total Stores
Mar/05
750
2,109
83
21,119
52
3
-
+28
•Investment expected for 2005: R$ 48.3 million
•+5,000 employees – basically, sales promoters
In the next two years, operations Taií, FIC-CBD,
FAI-LASA and Credicard are expected to
aggregate 6 million customers to Itaú´s base.

48
3.3 millionOwn Credit Cards (Private Label)
Currently
FIC (CBD)
FAI (LASA) 186 thousand
480 thousandCredit Cards
FIC (CBD)
FAI (LASA) -
-Personal Loan Contracts
FIC (CBD)
FAI (LASA) 137 thousand
580 thousandConsumer Credit Contracts
FIC (CBD)
FAI (LASA) 32 thousand
4.7 millionTotal
In Quantities
Financial Products

49
5,780 5,951 6,261 6,639 7,085 7,518
2,245 2,308 2,413 2,4383,596 3,548
Dec-03 Mar-04 Jun-04 Sep-04 Dec-04 Mar-05
Itaucard Credicard
8,026 8,2598,674 9,077
10,680
In Thousand
Market Share: 20.7%
Leader in Brazil
Credit Card Base
Increase in Participation on Credicard
11,066

50
Agenda
Brazilian Economy
Brazilian Banking System
Highlights
Strategy and In-depth Results
Performance of the Shares

51
1.00 1.243.03 2.90
5.11 5.467.24 7.45
9.7212.11
4.956.04
7.46
15.85
21.41 21.36
27.66
33.33
0.983.26 2.88
15.99
0.00
2.00
4.00
6.00
8.00
10.00
12.00
14.00
16.00
18.00
20.00
22.00
24.00
26.00
28.00
30.00
32.00
34.00
1994 1995 1996 1997 1998 1999 2000 2001 2002 2003 2004
Evolution of Earnings per Share andDividends per Share (*)
CAGR = 28.6%
R$
(*) In the previous years per lot of thousand shares, as in 2004 a reverse split of shares was carried out.
CAGR = 26.2%
Dividends per Share (*)Earnings per Share (*)

52
119 148
362 343
602 629
808 829
1,108
1,372
1.00 1.24
3.03 2.90
5.46
7.24 7.45
5.11
9.72
12.11
0
200
400
600
800
1,000
1,200
1,400
1995 1996 1997 1998 1999 2000 2001 2002 2003 2004
0
2
4
6
8
10
12
14
Total Dividends Unitary Dividends
Highlight:
Increase in monthly
payments from R$ 0.17 to
R$ 0.21 per share on
May 2005
Evolution of Dividends

53
(*) Annualized
Evolution of ROE (%)
15.4%17.2%
18.9%
31.6%
26.3% 26.5% 27.0%
35.1%
27.7%
31.5%
1996 1997 1998 1999 2000 2001 2002 2003 2004 1st Q/05(*)

54
•Expansion of points of sale
•Continuity of growth in Credit
•Focus in consumer credit (Taií, FIC CBD, FAI LASA, Vehicles...)
•Credit Cards - Credicard operation
•Growth in number of customers
•Client retention
•Focus in cost-efficiency
Perspectives for 2005

55
US$
(1) With dividends reinvestment (2) Without dividends reinvestment
Evolution of US$ 100 Invested from June/95 to June/05
Preferred Shares Appreciation – in US$
0
100
200
300
400
500
600
700
800
900
1.000
95 96 97 98 99 00 01 02 03 04 05
Itaú (1)Itaú (2)
Bovespa
603
279279
875Itaú(1) Itaú(2) Ibov.
10 yers 24.22% 19.69% 10.82%
5 yers 20.03% 15.78% 3.28%
12 months 104.09% 97.66% 60.43%
Russian CrisisReal Devaluation
Mexican Crisis
Asian Crisis
Argentine Crisis
Attack to WTC Election
Period
Annual Average Appreciation in US$

Roadshow
June 27-29, 2005
Silvio de CarvalhoExecutive Director