Roadroid - Reseach and Innovation for Swedish Transport Admin 2014
41
www.roadroid.com www.twitter.com/roadroid Lars Forslöf Founder/CEO 100.000 km road condition data surveyed by a motorist club Transportforum 9 Januari 2015
-
Upload
lars-forsloef -
Category
Technology
-
view
114 -
download
0
Transcript of Roadroid - Reseach and Innovation for Swedish Transport Admin 2014
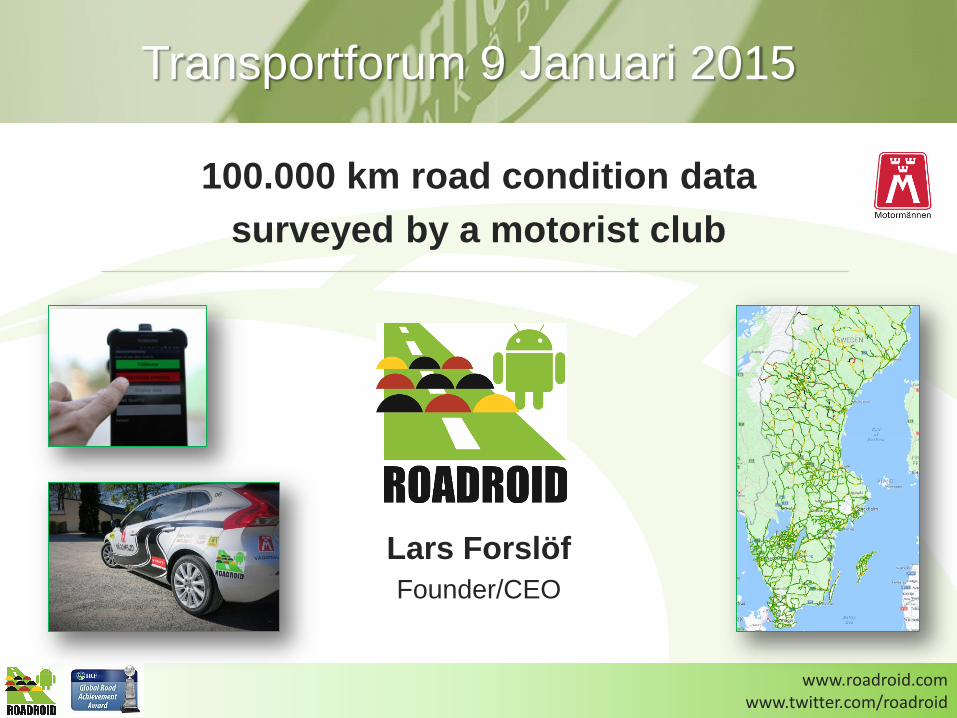
www.roadroid.comwww.twitter.com/roadroid
Lars Forslöf
Founder/CEO
100.000 km road condition data
surveyed by a motorist club
Transportforum 9 Januari 2015

www.roadroid.comwww.twitter.com/roadroid
This presentation
1. Introduction to technology
2. The projects 3 main issues:
1. How accurate is the data?
2. How can data be collected?
3. How can data be used
3. Summary/questions
2

www.roadroid.comwww.twitter.com/roadroid
How does it work: The app use the phone's accelerometer and analyzes vibrations from the vehicle in
100 Hz. Data is saved every second (1 Hz) with GPS-coordinates.
ww
w
Export
-Text files as
sections of
selectable lengths.
-Points o links to
shape files.
-Import in ex.
HDM4.
www.roadroid.comwww.twitter.com/roadroid
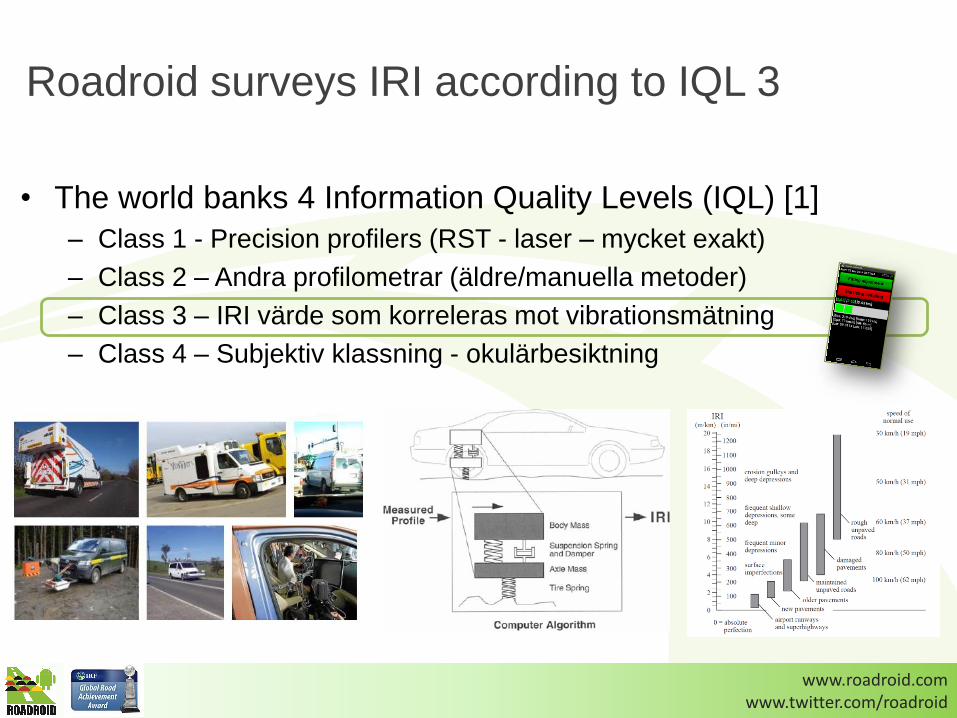
Roadroid surveys IRI according to IQL 3
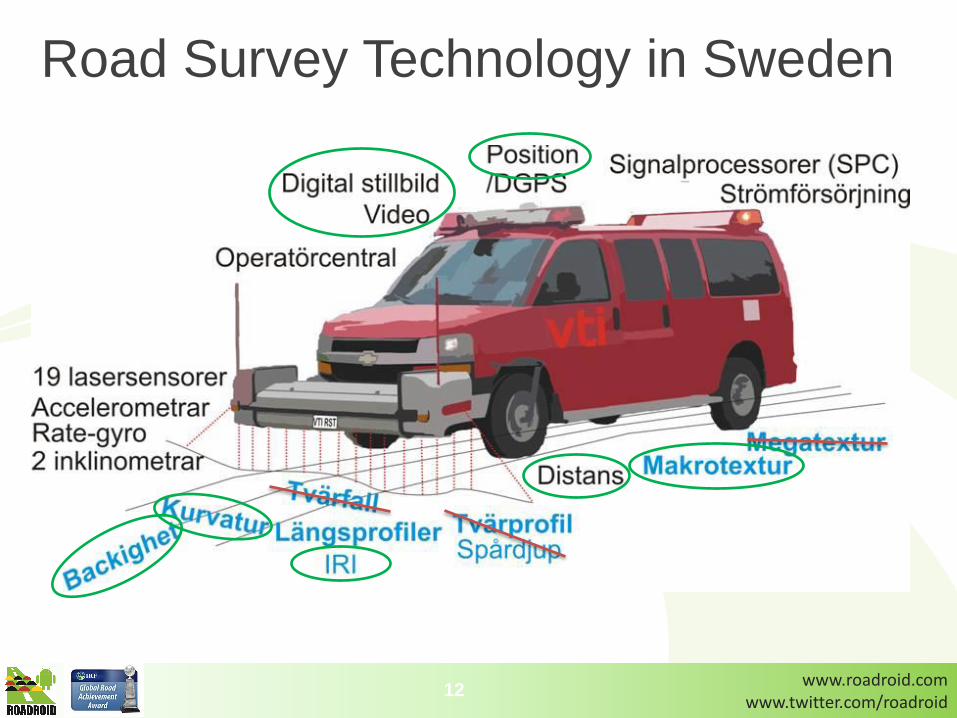
• The world banks 4 Information Quality Levels (IQL) [1]
– Class 1 - Precision profilers (RST - laser – mycket exakt)
– Class 2 – Andra profilometrar (äldre/manuella metoder)
– Class 3 – IRI värde som korreleras mot vibrationsmätning
– Class 4 – Subjektiv klassning - okulärbesiktning

www.roadroid.comwww.twitter.com/roadroid
Roadroid - Estimated och Calculated IRI
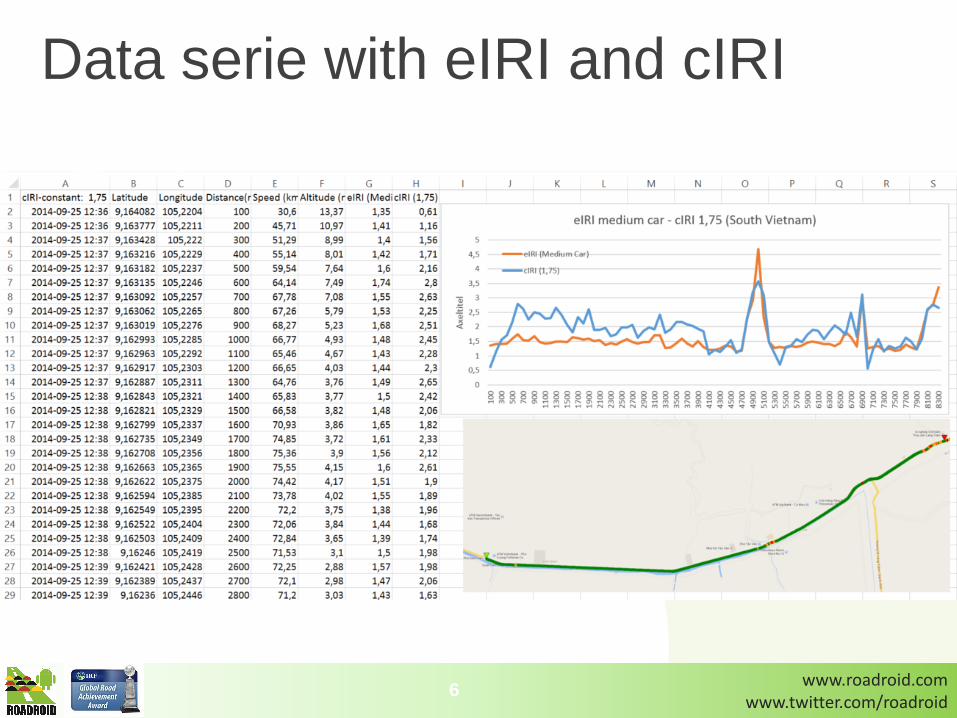
• eIRI
– Make a selection of samples (not RMS) in a loop of 100 Hz, and estimates IRI.
Formula developed in correlation with IQL1 measurements (2012).
– Use a complex speed compensation (designed for paved road)
– Speed: 20-100 km/h
– Uses a setting of 3 car types: Small, Medium/Large-4WD/Jeep
– Research by University of Auckland found 81% corresponding to IRI [3], [4].
– sensitive to sudden shocks and rough texture.
• cIRI
– use QC (quarter-car systems) IRI algorithm [1]
– has an option to adjust sensitivity
– Requires constant speed of 60-90 km/h to keep accuracy
– calculates IRI for a given section length
– less sensitive to sudden shocks and rough texture.
www.roadroid.comwww.twitter.com/roadroid
Data serie with eIRI and cIRI
6

www.roadroid.comwww.twitter.com/roadroid
Quick analysis in web polygon

www.roadroid.comwww.twitter.com/roadroid
Show changes over time
• Easy to collect daily/weekly roughness data
• Compare % of different classes, for same links in different times.
Road Condition Change report Q4 - 2012Gävleborg
Hudiksvall Contractor 69,4% 15,5% 7,4% 7,8% 65,8% 14,6% 8,5% 11,0%
1089 Km Phone 010-476 14 07 Q4 - 2012 Helår - 2012
Road no. Traffic Class Length Comments Good Sat Usat Poor TREND Good Sat Usat Poor eIRI avg
E4 14000 1 143 93,9% 4,6% 0,9% 0,5% -3,4% 97,4% 2,0% 0,4% 0,3% 1,8
83 8300 2 167 Salt road 88,9% 7,4% 2,2% 1,5% 3,3% 85,6% 8,0% 3,2% 3,2% 2,6
84 7500 2 210 Salt road 90,9% 6,1% 1,7% 1,3% -1,6% 92,5% 4,8% 1,6% 1,1% 2,9
305 1200 3 105 76,7% 14,4% 5,3% 3,6% -0,6% 77,3% 13,3% 5,2% 4,1% 4,5
307 900 3 75 93,7% 5,2% 0,7% 0,4% 0,4% 93,3% 5,5% 0,8% 0,4% 3,7
539 300 3 33 Gravel road 9,1% 23,2% 24,2% 43,4% 7,5
583 1700 3 89 96,9% 2,6% 0,2% 0,3% 0,0% 96,9% 2,0% 0,6% 0,5% 2,3
660 1850 3 64 88,6% 8,3% 0,6% 2,5% 9,1% 79,5% 9,7% 4,5% 6,3% 6,7
Good for Q4 minus Good for all year.

www.roadroid.comwww.twitter.com/roadroid
When does it happen?
How ”strong” is it?
What happend - where?
How was it afterwards?
Example frost heave

www.roadroid.comwww.twitter.com/roadroid
This presentation
1. Introduction to technology
2. The projects 3 main issues:
1. How accurate is the data?
2. How can data be collected?
3. How can data be used
3. Summary/questions
10
www.roadroid.comwww.twitter.com/roadroid
11
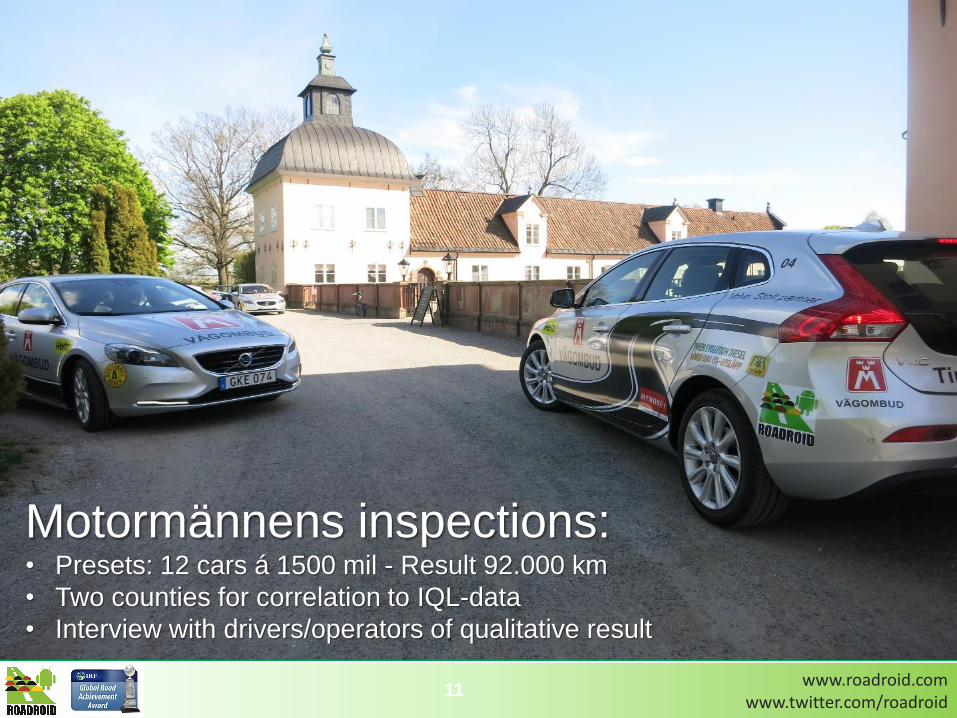
Motormännens inspections: • Presets: 12 cars á 1500 mil - Result 92.000 km
• Two counties for correlation to IQL-data
• Interview with drivers/operators of qualitative result
www.roadroid.comwww.twitter.com/roadroid
Road Survey Technology in Sweden
12

www.roadroid.comwww.twitter.com/roadroid
IRI-data from IQL1 resp. Roadroid
13
IRI
Data varje sekund med ko-ordinat – matchning till länk Vägens längds-riktning
IRI
0-20 m 20-40 m 40-60 m 60-80 m Osv… Vägens längds-riktning
VYM
Roadroid

www.roadroid.comwww.twitter.com/roadroid
Matching to road link
14
IRI
0-20 m 20-40 m 40-60 m 60-80 m Osv… Vägens längds-riktning
IRI
Data varje sekund med ko-ordinat – matchning till länk Vägens längds-riktning
Ett unikt objekt-ID (OID)length; irihv; avgspeed; nopoints; eiri; ciri
Medel för IRI höger o vänster (irihv)
Medel för hastighet, antal punkter för länken, eIRI ocIRI
IRI från Vägytemätning IRI från Roadroid

www.roadroid.comwww.twitter.com/roadroid
Data from IQL1 and Roadroid for same link
15
www.roadroid.comwww.twitter.com/roadroid
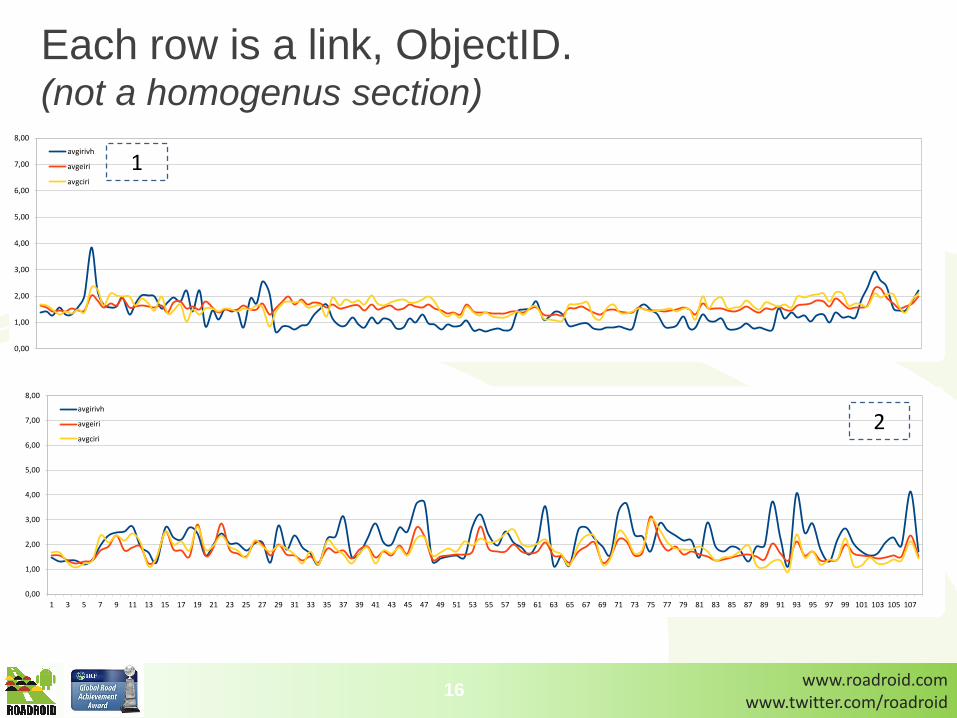
Each row is a link, ObjectID.(not a homogenus section)
16
0,00
1,00
2,00
3,00
4,00
5,00
6,00
7,00
8,00
1 3 5 7 9 11 13 15 17 19 21 23 25 27 29 31 33 35 37 39 41 43 45 47 49 51 53 55 57 59 61 63 65 67 69 71 73 75 77 79 81 83 85 87 89 91 93 95 97 99 101 103 105 107
avgirivh
avgeiri
avgciri
2
0,00
1,00
2,00
3,00
4,00
5,00
6,00
7,00
8,00
avgirivh
avgeiri
avgciri
1

www.roadroid.comwww.twitter.com/roadroid
Summary of correlation: IQL1-Roadroid
1. In comparison to a large group of whole OID (0,2-5 km links) Roadroid
achieve a correlation factor (R2) of 0.6. Often even more accurate.
2. For 100-metre sections in 80 km/h, Roadroid reach eIRI 0.72/cIRI 0.77.
Within a limited type of road class it is possible to reach a higher.
3. Within a certain speed range, and with the right settings its possible to
survey down to 20-meter sections.
4. The correlation is better on poor paved roads, with higher and more
variable IRI.
5. Good roads with long IRI provides a smaller span and makes it more
difficult to correlate.
6. IQL1 seems more dynamic: With higher values on poor roads – and lower
values on good roads. This can provide a possible basis for a development
of the Roadroid analysis formula.
17

www.roadroid.comwww.twitter.com/roadroid
Qualitative evaluationTwo questions to the drivers/operators
(1=not at all and 10=perfect)
1: If you look at the map of the area you surveyed, how much do you think the
result conforms to your own view? Answer: Average 8.4
2: How do you think the app performed during measurement? Did it register
bumps in the road surface, etc? Answer: Average 9.0
Text comments:
• Roadroid is a very good feature. We miss not having the whole year to measure, even in winter
and spring. It gave great results. And it was nice to view the police and say what reality looks
like. The police and the other was very impressed when I showed up the features and results.
• After having learned to protect the unit from the Sun with a "screen" and replaced a device it was
easy to use! However, the unit locked sometimes completely without reason! Forced shutdown
was only able to start all over again!
• The unit did not register long deep depressions in the road surface. Not either rutting.
• If it was too hot weather we could not use the charger, we had to take it into the house and charge
it overnight.
• To take photos – and touch the screen - the unit came out of position some times.
18

www.roadroid.comwww.twitter.com/roadroid
This presentation
1. Introduction to technology
2. The projects 3 main issues:
1. How accurate is the data?
2. How can data be collected?
3. How can data be used
3. Summary/questions
19

www.roadroid.comwww.twitter.com/roadroid
How can data be gathered?
20
Motorist club inspection
Road owner
Inspection
Contractors
News paper
distributor
www.roadroid.comwww.twitter.com/roadroid
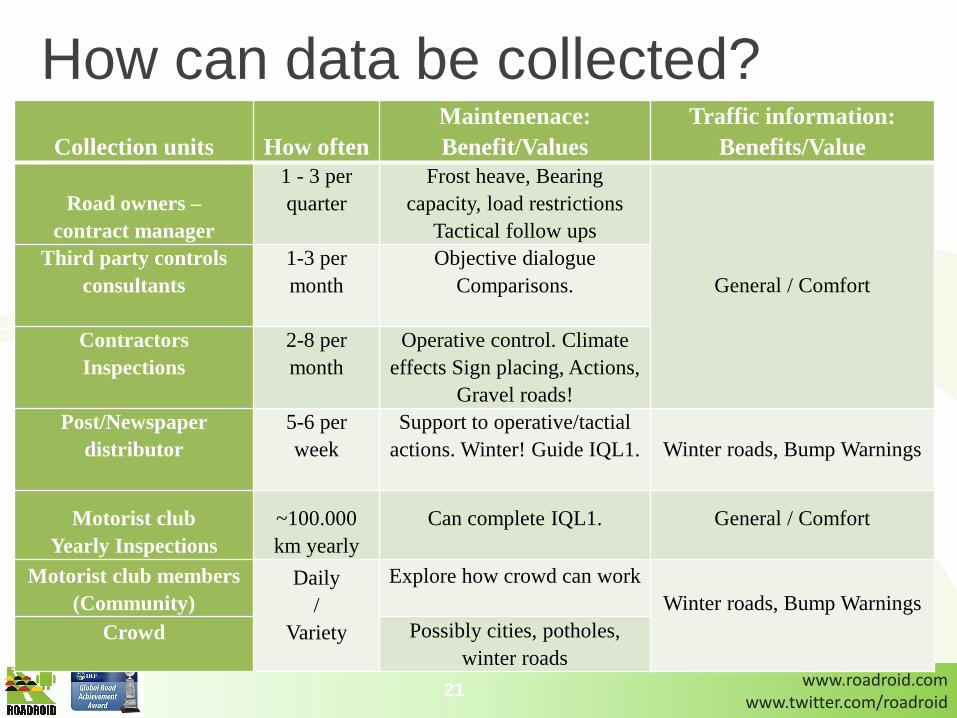
How can data be collected?
Collection units How often
Maintenenace:
Benefit/Values
Traffic information:
Benefits/Value
Road owners –
contract manager
1 - 3 per
quarter
Frost heave, Bearing
capacity, load restrictions
Tactical follow ups
General / Comfort
Third party controls
consultants
1-3 per
month
Objective dialogue
Comparisons.
Contractors
Inspections
2-8 per
month
Operative control. Climate
effects Sign placing, Actions,
Gravel roads!
Post/Newspaper
distributor
5-6 per
week
Support to operative/tactial
actions. Winter! Guide IQL1. Winter roads, Bump Warnings
Motorist club
Yearly Inspections
~100.000
km yearly
Can complete IQL1. General / Comfort
Motorist club members
(Community)
Daily
/
Variety
Explore how crowd can work
Winter roads, Bump Warnings
Crowd Possibly cities, potholes,
winter roads
21

www.roadroid.comwww.twitter.com/roadroid
Collection units How often
Maintenenace:
Benefit/Values
Traffic information:
Benefits/Value
Road owners –
contract manager
1 - 3 per
quarter
Frost heave, Bearing
capacity, load restrictions
Tactical follow ups
General / Comfort
Third party controls
consultants
1-3 per
month
Objective dialogue
Comparisons.
Contractors
Inspections
2-8 per
month
Operative control. Climate
effects Sign placing, Actions,
Gravel roads!
Post/Newspaper
distributor
5-6 per
week
Support to operative/tactial
actions. Winter! Guide IQL1. Winter roads, Bump Warnings
Motorist club
Yearly Inspections
~100.000
km yearly
Can complete IQL1. General / Comfort
Motorist club members
(Community)
Daily
/
Variety
Explore how crowd can work
Winter roads, Bump Warnings
Crowd Possibly cities, potholes,
winter roads
Hur kan data samlas in
22

www.roadroid.comwww.twitter.com/roadroid
This presentation
1. Introduction to technology
2. The projects 3 main issues:
1. How accurate is the data?
2. How can data be collected?
3. How can data be used
3. Summary/questions
23

www.roadroid.comwww.twitter.com/roadroid
Two users:
1) Maintenance/pavement and
2) Traffic information
– General / Comfort and
– Winter roads, slippery roads, warn for bumps
24

www.roadroid.comwww.twitter.com/roadroid
25
Comfort!

www.roadroid.comwww.twitter.com/roadroid
Comfort based route planning
26
• Alternativ 1
– xx långt
– zz komfortabelt
• Alternativ 2
– pp långt
– kk komfortabelt

www.roadroid.comwww.twitter.com/roadroid
Maintenance – pavement planning
27
In perspective of the “accuracy” discussion. Asset management is optimized with the
right decision, based on current data of good quality:
• In cold winter countries: IQL1 surveys are made in summer.
• Data processing and data imports into Pavement Management System in fall/winter.
• After the winter it is frost heave…It can change the pavement allot!
It takes a year from measurement to the pavement work.
Advanced models can predict the evolution, but winter can affect much…
• Moisture: how much water was in the way the body on the autumn
• Temperature: Cold/Frost depth, fluctuations around zero (thawing/Frost).
• Winter Road/Traffic: Ice removal, plowing, sanding, salting, studded tires.
• Extreme load: extreme amounts of timber after a storm
Many roads are only surveyed every second or third year ...
Bad road parts, or part with gravel/dirt cannot always be measured IQL1.

www.roadroid.comwww.twitter.com/roadroid
Possible benefits in pavement planning?
Update Pavement/Road Management System, with fresh
IRI values immediately after winter!
- Indicate adjustments in the assets management…
- Influence planning of coming summers IQL1 surveys.
If the situation has changed significantly, IQL1 can
check up more precisely.
28

www.roadroid.comwww.twitter.com/roadroid
Frost heave, Floodings, Tsunamis..
29
59%
42%48%
71% 68%
18%
22%19%
11% 13%
11%
14% 13%
7% 10%
12%22% 20%
11% 9%
0%
10%
20%
30%
40%
50%
60%
70%
80%
90%
100%
Mars April Maj Juni Juli
Dålig
Ej OK
OK
Bra
4234 30 35
4157 57 58
45 41
0%
10%
20%
30%
40%
50%
60%
70%
80%
90%
100%
W9 W10 W11 W12 W13 W14 W15 W16 W17 W18
Dålig
Ej OK
OK
Bra

www.roadroid.comwww.twitter.com/roadroid
Gravel roads…
30
Of the Swedish state road
network of 100.000 km, 19,300
km are gravel roads (exclusive
all private forest roads).
• Frost thaw season (spring)
• Planing/Corrugating
• Regravelling
• Good support with
simple/quick GPS Photo.
Easy to use, robust, cheap ...

www.roadroid.comwww.twitter.com/roadroid
Winter roads
31
Before ice grading:
-Road users complain, and
the contractor has to check
the need (subjective).
-Grading is an expensive
effort by subcontractor.
- After action: If grading or
plowing is not done well,
the result is bad.
= Useful in controlling the
operation and quality of
work.
Simple, robust, cheap ...
Friction measurement, like
"Coralba".

www.roadroid.comwww.twitter.com/roadroid
Performance based Maintanance
• Move the focus from the "exact" spec on what to do to what the
outcome is. Input->Output->Outcome.
• Stimulating innovation and the development of new and
sustainable solutions.
• New Key Performance Index/Indicators needed to evaluate the
outcome of certain technologies.
• Today the subjective assessments of a number of things along
the roads and highways (pen and paper).
• Smart phone data can provide a continuous data collection, and
with automated reports show changes over time.
32

www.roadroid.comwww.twitter.com/roadroid
Pilot on E22, Kalmar-Östergötland
33
Survey of roughness, effective visual registration of cracks, potholes etc
Automated report where actual situation and development trend is clearly visualized.

www.roadroid.comwww.twitter.com/roadroid
County maps
34

www.roadroid.comwww.twitter.com/roadroid
This presentation
1. Introduction to technology
2. The projects 3 main issues:
1. How accurate is the data?
2. How can data be collected?
3. How can data be used
3. Summary/questions
35
www.roadroid.comwww.twitter.com/roadroid
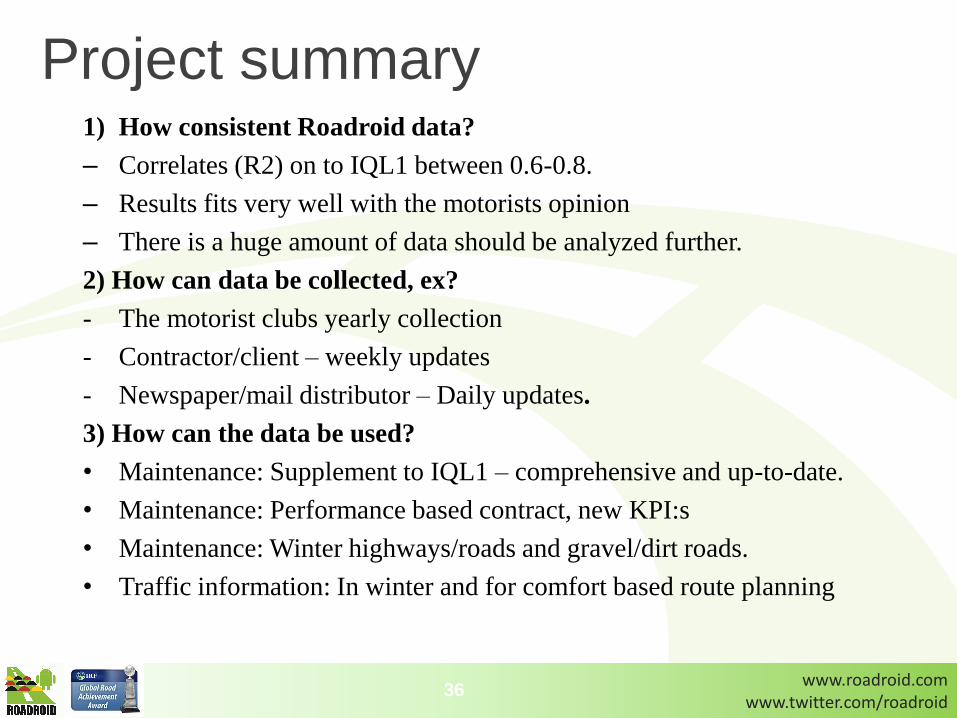
Project summary1) How consistent Roadroid data?
– Correlates (R2) on to IQL1 between 0.6-0.8.
– Results fits very well with the motorists opinion
– There is a huge amount of data should be analyzed further.
2) How can data be collected, ex?
- The motorist clubs yearly collection
- Contractor/client – weekly updates
- Newspaper/mail distributor – Daily updates.
3) How can the data be used?
• Maintenance: Supplement to IQL1 – comprehensive and up-to-date.
• Maintenance: Performance based contract, new KPI:s
• Maintenance: Winter highways/roads and gravel/dirt roads.
• Traffic information: In winter and for comfort based route planning
36

www.roadroid.comwww.twitter.com/roadroid
Awards
37
November 2014
Februari 2013 – Global Champion, World Summit Award (FN) Övrigt:
www.roadroid.comwww.twitter.com/roadroid
Thanks for listening!
• Questions/discussion?
www.roadroid.com
38

www.roadroid.comwww.twitter.com/roadroid
Referenser
• [1] Michael W. Sayers, Thomas D. Gillespie, and Cesar A. V. Queiroz, “The
International Road Roughness Experiment: Establishing Correlation and a
Calibration Standard for measurements,” World Bank Technical paper
number 45, Washington DC, 1986.
• [2] K.E.Tarr, “Evaluation of Response Type Application for Measuring
Road Roughness”, University of Pretoria, South Africa, 2013
• [3] Myles Johnston. “Using cell-phones to monitor road roughness”,
University of Auckland, Auckland, New Zealand, 2013
• [4] Tasnimul Islam. “Using cell-phones to monitor road roughness” ,
University of Auckland, Auckland, New Zealand, 2013
• [5] C. Bennet. 2013_wb_trends_road_asset_management, The world bank
• [6] M R Schlotjes, A Visser, C Bennet. Evaluation of a smart phone
roughness meter, University of Pretoria

www.roadroid.comwww.twitter.com/roadroid
Extra 1 - Roughness and Texture
40
Bad RoughnessBad Texture
Good RoughnessBad Texture
Bad RoughnessGood Texture
Good RoughnessGood Texture
1)
2)
3)
4)

www.roadroid.comwww.twitter.com/roadroid
2014 we cooperate with universities in over 10 countries- something we want to atleast double during 2015!