ROADMAP TO ZERO EMISSIONS - Architecture 2030architecture2030.org/files/roadmap_web.pdf · Roadmap...
20
Transcript of ROADMAP TO ZERO EMISSIONS - Architecture 2030architecture2030.org/files/roadmap_web.pdf · Roadmap...

1
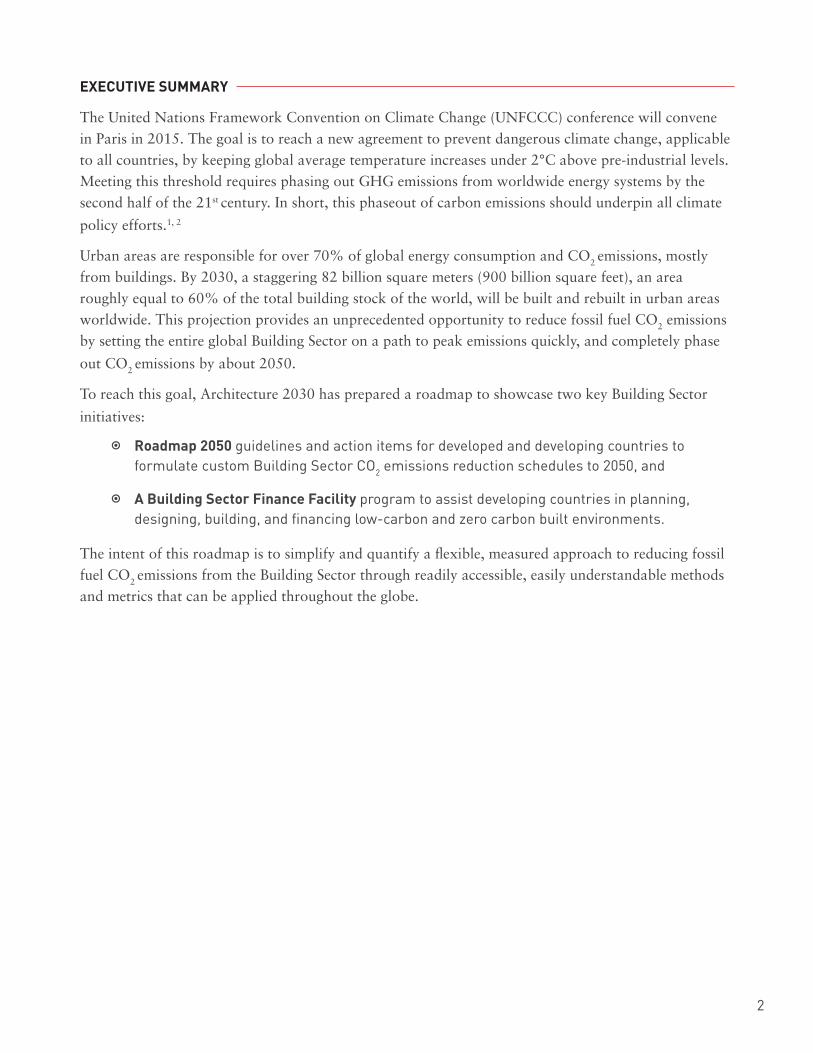
ROADMAP TO ZERO EMISSIONS
June 4, 2014 (originally submitted March 30, 2014) The Built Environment in a Global Transformation to Zero Emissions
INTRODucTION
Architecture 2030 is a non-profit, non-partisan, and independent organization with
straightforward goals:
•• to•achieve•a•dramatic•reduction•in•the•energy•consumption•and•greenhouse•gas•(GHG)•emissions•of•the•built•environment•by•changing•the•way•buildings,•developments•and•cities•are•planned,•designed,•and•constructed;•and,•
•• to•forward•the•development•of•adaptive•built•environments•that•can•manage•the•impacts•of•climate•change,•preserve•natural•resources,•and•access•low-cost,•renewable•water•and•energy•resources.•
This submission focuses on the design of the United Nations Framework Convention on Climate Change (UNFCCC) 2015 agreement, and in that context, addresses the role and emissions reductions necessary in the urban built environment – currently responsible for over 70% of all greenhouse gas emissions – in order to keep global average temperature increases under 2°C above
pre-industrial levels.*
TABLE•OF•CONTENTS
INTRODUCTION
EXECUTIVE SUMMARY
BACKGROUND
PREMISES
ROADMAP TO ZERO EMISSIONS
CONCLUSION
APPENDIX A: Timeline, Projections, and Targets
APPENDIX B: Bridging the Information Gap
APPENDIX C: Architecture 2030 Initiatives
APPENDIX D: The U.S. Building Sector
WORKS CITED
.......................................................................................................... 1
............................................................................................... 2
............................................................................................................. 3
...................................................................................................................... 4
............................................................................. 5
............................................................................................................... 7
........................................................... 8
................................................................ 12
................................................................. 14
........................................................................ 16
............................................................................................................ 19
2
ExEcuTIvE SuMMARy
The United Nations Framework Convention on Climate Change (UNFCCC) conference will convene in Paris in 2015. The goal is to reach a new agreement to prevent dangerous climate change, applicable to all countries, by keeping global average temperature increases under 2°C above pre-industrial levels. Meeting this threshold requires phasing out GHG emissions from worldwide energy systems by the second half of the 21st century. In short, this phaseout of carbon emissions should underpin all climate
policy efforts.1, 2
Urban areas are responsible for over 70% of global energy consumption and CO2 emissions, mostly from buildings. By 2030, a staggering 82 billion square meters (900 billion square feet), an area roughly equal to 60% of the total building stock of the world, will be built and rebuilt in urban areas worldwide. This projection provides an unprecedented opportunity to reduce fossil fuel CO2 emissions by setting the entire global Building Sector on a path to peak emissions quickly, and completely phase
out CO2 emissions by about 2050.
To reach this goal, Architecture 2030 has prepared a roadmap to showcase two key Building Sector
initiatives:
•• Roadmap 2050 guidelines•and•action•items•for•developed•and•developing•countries•to•formulate•custom•Building•Sector•CO2•emissions•reduction•schedules•to•2050,•and
• A Building Sector Finance Facility program•to•assist•developing•countries•in•planning,•designing,•building,•and•financing•low-carbon•and•zero•carbon•built•environments.••
The intent of this roadmap is to simplify and quantify a flexible, measured approach to reducing fossil fuel CO2 emissions from the Building Sector through readily accessible, easily understandable methods and metrics that can be applied throughout the globe.
3
BAckgROuND
Working Group 1 of the Intergovernmental Panel on Climate Change’s (IPCC) 5th Assessment Report
confirms the necessity for immediate and sustained global action on climate change: we must remain
well below the 2°C global average temperature threshold (above pre-industrial levels) to prevent
dangerous anthropogenic interference with the climate system.
From the IPCC’s 5th Assessment Report, a number of timeline scenarios (Representative Concentration
Pathways or RCPs) have been defined, RCP8.5, RCP6.0, RCP4.5, RCP2.6, and >85% below 2°C, each
plotting amounts of carbon emissions and resulting global average temperatures. The only scenario
with a high probability (85% or greater chance) of keeping under the 2°C threshold is when global
CO2 emissions from fossil fuels peak quickly and reach zero by about 2050 (see APPENDIX A, Graphs
1 and 2).3, 4
Parties to the UNFCCC have committed to limiting the maximum global average temperature increase
to no more than 2°C above pre-industrial levels.5 However, even if the GHG emissions pledges made at
the UNFCCC conferences in Copenhagen (2009) and Cancun (2010) are fully met, the world is on a
trajectory for a global average temperature increase of over 3°C, with a 20% chance of exceeding 4°C.6
Given these scenarios, it is clear we must explore rapid but feasible routes to reach zero global fossil
fuel CO2 emissions by the middle of the century. This challenge has led Architecture 2030 to develop
the following Roadmap to Zero Emissions: two key Building Sector initiatives to quickly reduce fossil
fuel CO2 emissions and finance low-carbon/zero carbon built environments.

4
PREMISES
•• Today,•over•half•of•the•world•population•lives•in•urban•areas.7
•• Urban•environments•(cities)•are•responsible•for•over•70%•of•global•GHG•emissions.8
•• Between•2011•and•2030,•the•world•population•is•expected•to•increase•by•1.35•billion•(from•6.97•billion•to•8.32•billion).9
•• Urban•areas•are•projected•to•gain•about•1.35•billion•people•by•2030,•absorbing•the•entire•population•growth•estimate•from•2011•to•2030.10
•• Total•world•building•stock•today•is•approximately•150•billion•square•meters•(m2),•consisting•of•approximately•75%•residential•and•25%•commercial•floor•space.11•
•• Each•year•from•2013•to•2025•approximately•3.53•billion•m2•of•building•floor•space•will•be•built•new,•and•1.93•billion•m2•of•buildings•will•be•rebuilt•(replacement•of•older•building•stock)•in•urban•areas•worldwide.12
•• By•2030,•over•80•billion•m2•of•buildings•will•be•built•new•and•rebuilt•in•urban•areas•worldwide,•an•area•roughly•equal•to•60%•of•the•total•building•stock•of•the•world.13•Global•building•construction•during•this•period•(by•percentage)•is•projected•to•occur•in•the••following•areas:
○ 38%••China• ○ 15%••U.S.•/•Canada• ○ 9%••India• ○ 9%••Latin•America••○ ••9%••Middle•East•/•Africa• ○ 12%••Other•emerging•○ ••4%••Western•Europe• ○ 4%••Other•developed••
•• China•and•the•U.S.•/•Canada•will•account•for•approximately•53%•of•all•new•and•rebuilt•building•floor•space•over•the•next•15•years,14•but•the•role•of•a•global•agreement•will•be•critical•for•reducing•emissions•in•the•remaining•47%•of•global•construction.
•• Much•of•the•world•is•projected•to•be•built•and•rebuilt•over•the•next•two•decades,•with•the•energy•and•emissions•patterns•of•this•construction•locked-in•for•many•years•(average•building•and•infrastructure•lifespans•are•80•and•120•years,•respectively15).•Today•we•have•a•once-in-a-lifetime•opportunity•to•address•climate•change•by•creating•low-carbon•and•zero-carbon•cities,•districts,•and•buildings•that:
•○ dramatically•reduce•their•environmental•impact•and•exposure,•○ create•environmental•adaptability,•○ ensure•access•to•inexpensive•and•renewable•site•energy•sources,•○ minimize•vehicle•miles•traveled,•and•○ minimize•consumption•of•natural•resources,•undeveloped•land,•and•potable•water.

5
ROADMAP TO ZERO EMISSIONS
Roadmap to Zero Emissions proposes to establish guidelines for two key Building Sector initiatives: Roadmap 2050 and a Building Sector Financing Facility. Combined, these initiatives address the massive urbanization occurring worldwide over the next two decades, and provide a pathway with a high probability of keeping global average temperature increase under 2°C, peaking CO2 emissions in the Building Sector quickly, leading to zero CO2 emissions by mid-century. The initiatives are equitable and take common but differentiated responsibilities and capabilities into account by allowing each country to establish specific sector reduction targets according to its needs and capabilities, as well as providing a financial mechanism for developing countries to implement building sector strategies with
appropriate levels of support.
The two key components of the Roadmap to Zero Emissions are:
1. Roadmap 2050 provides•guidelines•for•individual•countries•to•develop•customized•Building•Sector•CO2•emissions•reduction•schedules,•and•the•Action•Items•needed•to•reach•zero•CO2•emissions•by•2050:•
a. Building Sector cO2 Emissions Schedule guidelines:
Achieve•a•total•annual•Building•Sector•(residential,•commercial,•and•institutional•building•operations)•CO2•emissions•level,•relative•to•Building•Sector•CO2•emissions•in•2015,•within•the•following•range:
•○ ••0%••••to••-15%•in•2020•○ -15%••to••-30%•in•2025•○ -30%••to••-45%•in•2030•○ -45%••to••-60%•in•2035•○ -60%••to••-75%•in•2040•○ -75%••to••-90%•in•2045•○ -90%••to••••Zero•CO2•emissions•in•2050•○ ••Zero•CO2•emissions•in•2055
b. Action Items guidelines:•
i)••New•Buildings•–•Design•new•buildings•and•major•renovations•to•meet•a•site•energy•use•intensity•(EUI)•of•the•following•percentage•below•the•regional•••••••••••••••••••(or•country)•average•for•each•building•type:
•○ 70%•in•2016•○ 80%•in•2020•○ 90%•in•2025••○ Carbon•Neutral•in•2030•
The term “major renovation” means a sufficiently extensive renovation so that the entire building can meet the energy targets for new buildings.
Carbon neutral is defined as a building that is designed and constructed to require a greatly reduced quantity of energy to operate, meeting the balance of its energy needs from sources that do not produce CO2 emissions and therefore result in zero net CO2 emissions.
Site EUI (building energy consumed at the building site in Btu/sf/year or kWh/ m2/year) reduction targets for new buildings and renovations are accomplished by implementing low-cost/no-cost efficiency and sustainable design strategies and practices, and by generating on-site renewable power, and/or by importing non CO2-emitting energy.
6
ii)••Existing•Buildings,•Developed•Countries••–•Renovate•a•minimum•of•2%•to•3%•of•the•total•existing•building•stock•each•year•to•meet•a•site•EUI•of•50%•below•the•regional•(or•country)•average•for•each•building•type.•
iii)••Existing•Buildings,•Developing•Countries••–•Renovate•a•minimum•of•1.5%•to•2%•of•the•total•existing•building•stock•each•year•to•meet•a•site•EUI•of•50%•below•the•regional•(or•country)•average•for•each•building•type.
For example, buildings that meet the 2012 International Energy Conservation Code (IECC 2012) are approximately 50% below the U.S. regional average site EUI for a building type.
iv) Building Products – Specify•building•products•that•meet•a•CO2•emissions•reduc-tion•of•the•following•percentage•below•the•product•category•average•of:
•○ 35%•in•2015•○ 40%•in•2020•○ 45%•in•2025••○ 50%•in•2030•
2.• A•Building Sector Financing Facility•through•the•Green•Climate•Fund,•green•infrastructure•bonds,•and•other•climate•relevant•financial•initiatives,•supporting•developing•countries•to•finance:
a.• Building•renovations•that•meet•the•Roadmap 2050•(b)(iii)•site•EUI•target.
b.• Passive•and•active•renewable•energy•systems•for:••○ buildings•that•meet•the•Roadmap 2050•(a)•and•(b)(i),(b)(ii),•(b)(iii)•site•EUI•
target,•and•••○ installations•(with•energy•storage)•at•critical•facilities•-•hospitals,•schools,•
senior•housing•-•to•protect•against•power•outages.•
c.• New•buildings•and•major•renovations•that•are•designed•to•meet•site•EUI•targets•of•(b)(i).•
d.• Access•to•expert•and•technical•support•services•for•sustainable•planning,•adaptable•infrastructure•and•renewable•energy•systems,•and•professional•design•and•engineering•services•for•buildings•and•renovations•that•meet•the•(a)•and•(b)(i),(b)(ii),•(b)(iii)•targets.
e.• Developing•and•delivering•equitable•access•to•information•and•tools•for•sustainable,•low-carbon/zero•carbon•planning•and•building,•and•no-cost/low-cost•on-site•renewable•energy/natural•resources•systems•(e.g.,•passive•heating•and•cooling,•water•catchment•and•storage,•solar•hot•water,•daylighting,•and•natural•ventilation•systems)•to•users•at•all•levels•of•the•planning•and•building•process.
f.• Private/public•partnerships•to•develop•and•implement•city•and•district•scale•roadmaps•and•solutions•for•adaptable,•low-carbon/zero-carbon•urban•planning,•transit,•infrastructure,•energy•systems,•and•buildings.
7
cONcluSION
Rapid global urbanization and the necessity for a complete phaseout of GHG emissions call for a major transformation in the built environment, from a post-WWII fossil-fuel-reliant and consumptive model, to one that essentially emits zero carbon. The time frame for transformation has been established by the UNFCCC’s global average temperature increase threshold of 2°C above pre-industrial levels, and the IPCC’s 5th Assessment Report.
If framed and institutionalized properly, Building Sector (building operations) agreements, adopted in Paris in 2015, will lead to actions that result in a sustainable and zero carbon sector. The agreements would lead countries to contribute to a sector phase out of fossil fuel CO2 emissions by the middle of this century. The process of negotiations under the Ad Hoc Working Group on the Durban Platform for Enhanced Action (ADP), and other relevant fora, could catalyze dialogue and enhanced global cooperation among and between architects, urban planners, designers, and manufacturers of building-related products and services.
Roadmap to Zero Emissions provides an initial set of initiatives based upon successful, existing programs and actions developed to meet the fossil fuel CO2 emissions reduction targets of a high probability of holding global warming below 2°C (see APPENDIX A, Graph 2). The following are
representative of those initiatives that could be scaled up, replicated, enhanced, or serve as models:
•• The•U.S.•Energy•Independence•and•Security•Act•of•2007•(Section•433),•and•Executive•Order•13423,•requires•all•new•federal•buildings•and•major•renovations•to•be•zero•carbon•by•2030.16
•• The•EU•directed•member•states•to•ensure•that•all•new•buildings•are•nearly•zero-energy•by•2020.17•
•• The•California•Energy•Commission’s•2007•Integrated•Energy•Policy•Report•is•scheduled•to•adjust•Title•24•(building•energy•code)•updates•to•require•all•new•residential•construction•to•be•zero-net-energy•(ZNE)•by•2020,•and•all•new•commercial•buildings•ZNE•by•2030.18
•• New•buildings•in•China’s•Severe•Cold,•Cold,•Hot•Summer,•and•Cold•Winter•zones,•must•be•designed•to•an•energy•efficiency•improvement•of•65%•compared•to•1980•buildings.19
•• Germany•plans•to•improve•the•energy•efficiency•renovation•rate•of•its•existing•building•stock•from•1%•to•2%,•and•later•to•3%•per•year.20
•• Urban•2030•Districts,•consisting•of•private/public•partnerships•in•five•U.S.•cities,•implement•incremental•district-wide•energy,•water,•and•transportation•emissions•reduction•targets•to•50%•in•large•urban•areas•by•2030.•Twelve•additional•2030•Districts•are•currently•forming•in•cities•across•the•U.S.•and•Canada.21
•• The•2030•Palette,•a•freely•accessible,•highly•visual,•integrated,•and•user-driven•online•platform•was•launched•in•November•2013.•The•platform•puts•the•principles,•actions,•and•tools•behind•low-carbon/zero-carbon•and•adaptive•built•environments•–•from•regions,•cities•and•communities,•to•buildings•and•building•elements•–•at•the•fingertips•of•professionals•and•non-professionals•worldwide•(a•UN•/•World•Bank•Sustainable•Energy•For•All•commitment22,•see•APPENDIX•B.)23
8
APPENDIx A: Timelines, Projections, and Targets
Working Group 1 of the IPCC 5th Assessment Report reveals how close we are to a turning point in the earth’s climate system.
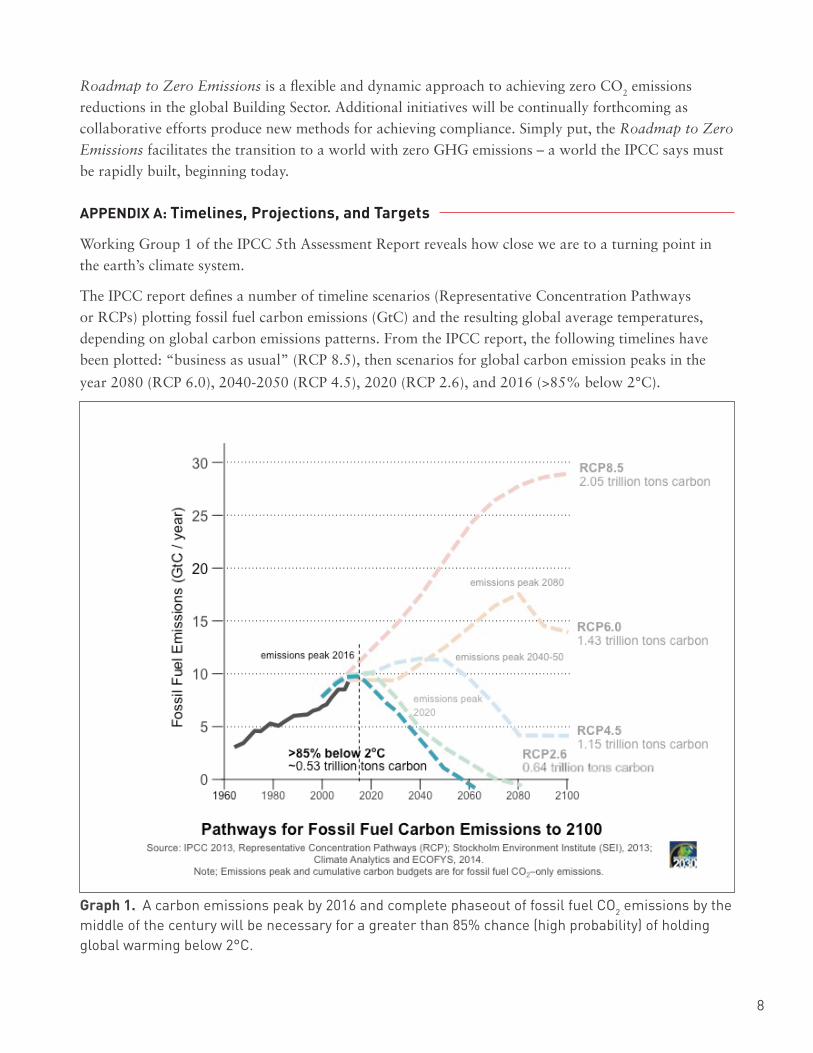
The IPCC report defines a number of timeline scenarios (Representative Concentration Pathways or RCPs) plotting fossil fuel carbon emissions (GtC) and the resulting global average temperatures, depending on global carbon emissions patterns. From the IPCC report, the following timelines have been plotted: “business as usual” (RCP 8.5), then scenarios for global carbon emission peaks in the
year 2080 (RCP 6.0), 2040-2050 (RCP 4.5), 2020 (RCP 2.6), and 2016 (>85% below 2°C).
graph 1. A•carbon•emissions•peak•by•2016•and•complete•phaseout•of•fossil•fuel•CO2•emissions•by•the•middle•of•the•century•will•be•necessary•for•a•greater•than•85%•chance•(high•probability)•of•holding•global•warming•below•2°C.•
Roadmap to Zero Emissions is a flexible and dynamic approach to achieving zero CO2 emissions reductions in the global Building Sector. Additional initiatives will be continually forthcoming as collaborative efforts produce new methods for achieving compliance. Simply put, the Roadmap to Zero
Emissions facilitates the transition to a world with zero GHG emissions – a world the IPCC says must be rapidly built, beginning today.

9
graph 2. •If•the•world•exceeds•the•2°C•threshold,•reported•models•project•the•planet•will•keep•warm-ing•and•it•will•be•virtually•impossible•to•bring•global•average•temperatures•back•to•current•levels,•leaving•humanity•with•a•continually•warming•planet•and•a•deteriorating•climate•system.•The•only•sce-nario•with•a•greater•than•85%•chance•of•holding•global•warming•below•2°C•is•to•quickly•peak•world-wide•fossil•fuel•CO2•emissions•and•reach•zero•emissions•by•the•middle•of•the•century.
10
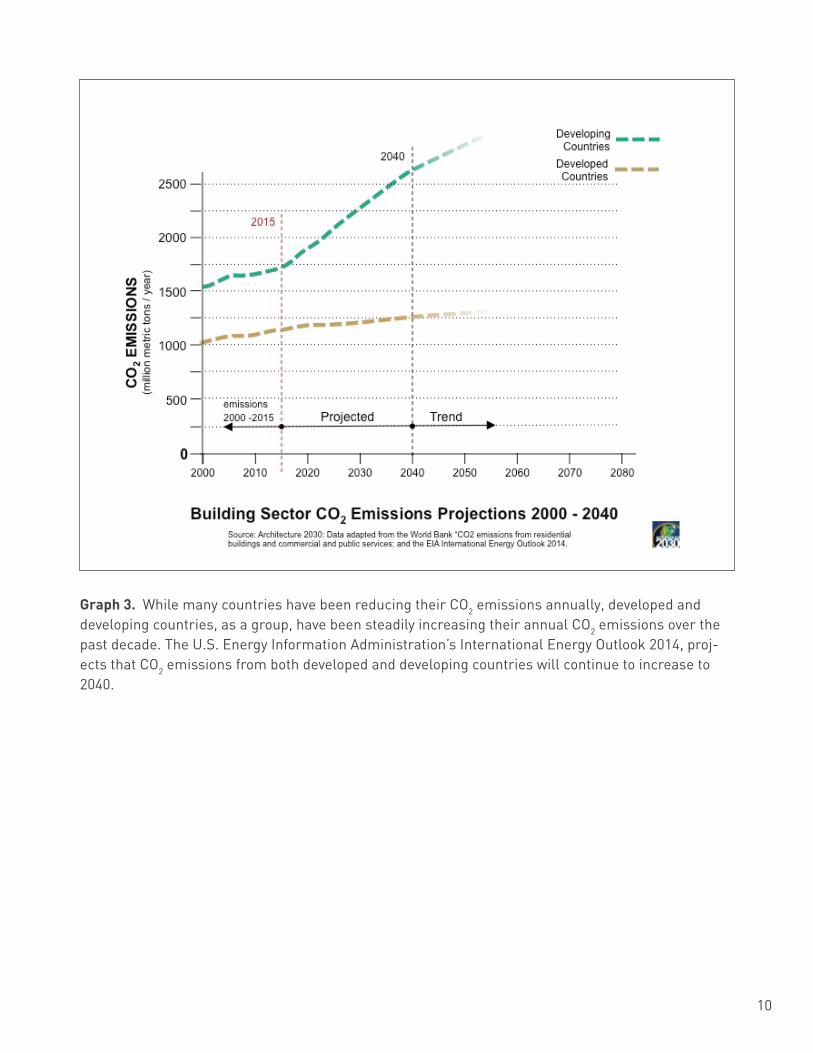
graph 3. •While•many•countries•have•been•reducing•their•CO2•emissions•annually,•developed•and•developing•countries,•as•a•group,•have•been•steadily•increasing•their•annual•CO2•emissions•over•the•past•decade.•The•U.S.•Energy•Information•Administration’s•International•Energy•Outlook•2014,•proj-ects•that•CO2•emissions•from•both•developed•and•developing•countries•will•continue•to•increase•to•2040.
11
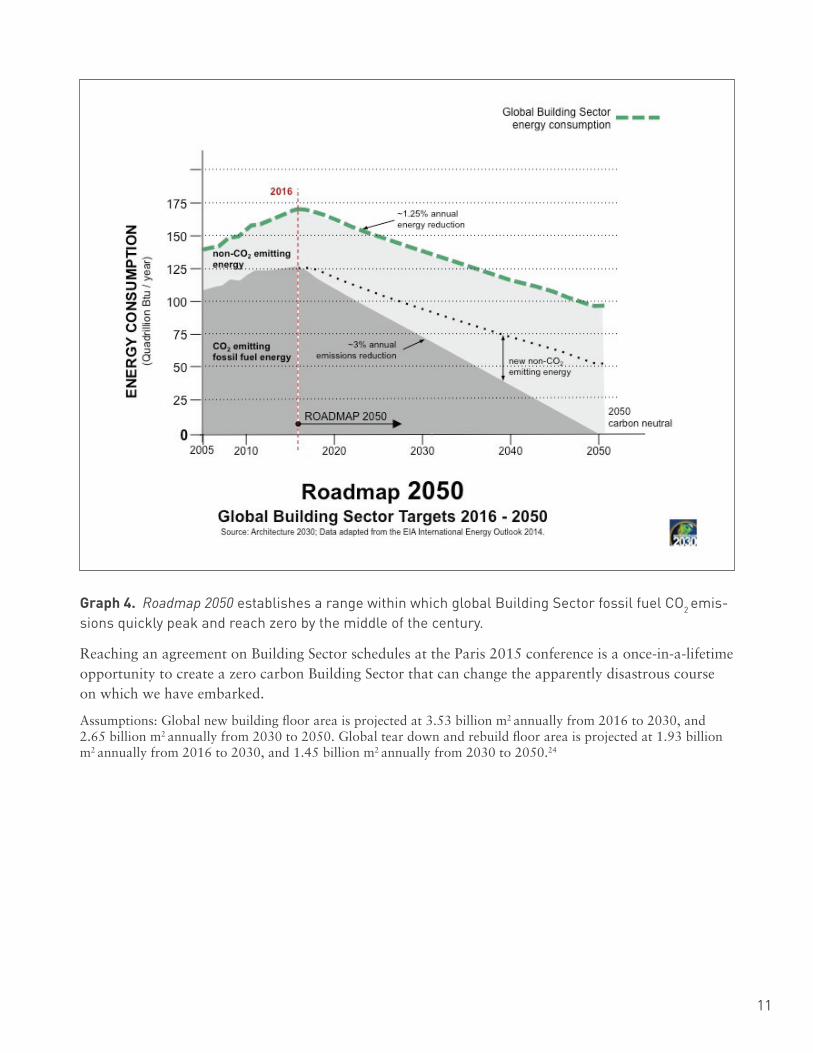
graph 4. Roadmap 2050•establishes•a•range•within•which•global•Building•Sector•fossil•fuel•CO2•emis-sions•quickly•peak•and•reach•zero•by•the•middle•of•the•century.•
Reaching an agreement on Building Sector schedules at the Paris 2015 conference is a once-in-a-lifetime opportunity to create a zero carbon Building Sector that can change the apparently disastrous course on which we have embarked.
Assumptions: Global new building floor area is projected at 3.53 billion m2 annually from 2016 to 2030, and 2.65 billion m2 annually from 2030 to 2050. Global tear down and rebuild floor area is projected at 1.93 billion m2 annually from 2016 to 2030, and 1.45 billion m2 annually from 2030 to 2050.24
12
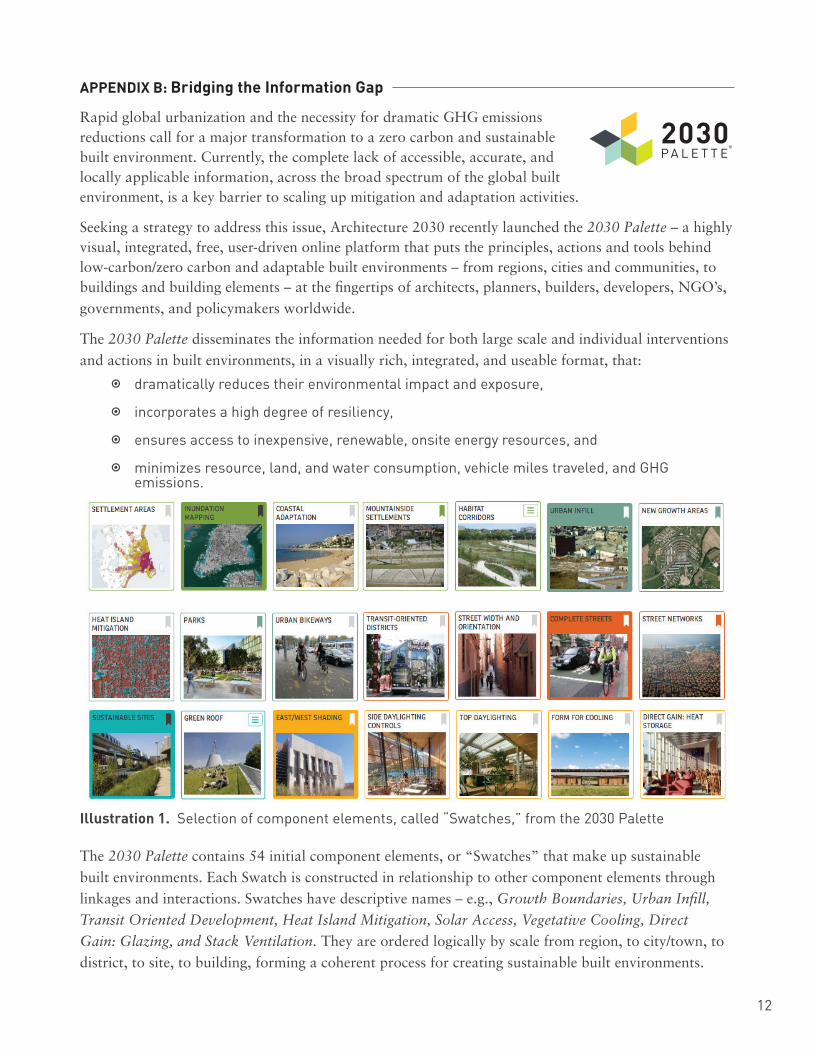
Seeking a strategy to address this issue, Architecture 2030 recently launched the 2030 Palette – a highly visual, integrated, free, user-driven online platform that puts the principles, actions and tools behind low-carbon/zero carbon and adaptable built environments – from regions, cities and communities, to buildings and building elements – at the fingertips of architects, planners, builders, developers, NGO’s, governments, and policymakers worldwide.
The 2030 Palette disseminates the information needed for both large scale and individual interventions and actions in built environments, in a visually rich, integrated, and useable format, that:
•• dramatically•reduces•their•environmental•impact•and•exposure,
•• incorporates•a•high•degree•of•resiliency,
•• ensures•access•to•inexpensive,•renewable,•onsite•energy•resources,•and
•• minimizes•resource,•land,•and•water•consumption,•vehicle•miles•traveled,•and•GHG•emissions.
2030PA L E T T E®
The 2030 Palette contains 54 initial component elements, or “Swatches” that make up sustainable built environments. Each Swatch is constructed in relationship to other component elements through linkages and interactions. Swatches have descriptive names – e.g., Growth Boundaries, Urban Infill,
Transit Oriented Development, Heat Island Mitigation, Solar Access, Vegetative Cooling, Direct
Gain: Glazing, and Stack Ventilation. They are ordered logically by scale from region, to city/town, to district, to site, to building, forming a coherent process for creating sustainable built environments.
Illustration 1.••Selection•of•component•elements,•called•“Swatches,”•from•the•2030•Palette
APPENDIx B: Bridging the Information gap
Rapid global urbanization and the necessity for dramatic GHG emissions reductions call for a major transformation to a zero carbon and sustainable built environment. Currently, the complete lack of accessible, accurate, and locally applicable information, across the broad spectrum of the global built environment, is a key barrier to scaling up mitigation and adaptation activities.
13
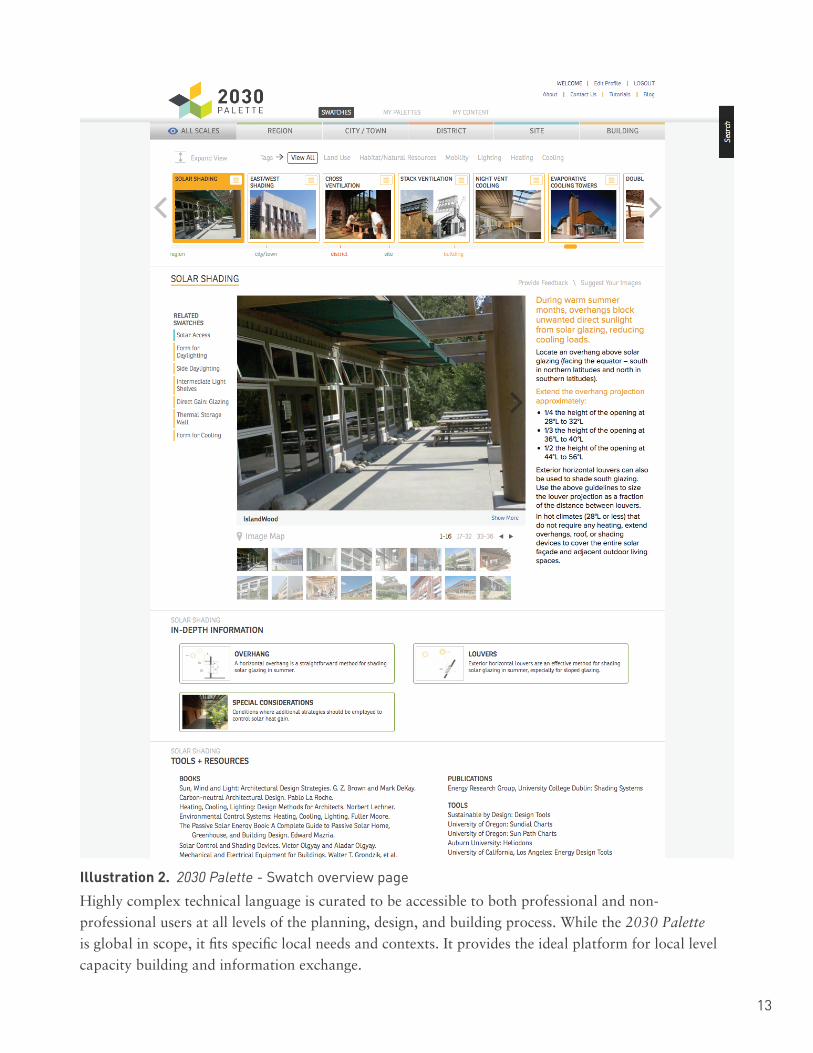
Highly complex technical language is curated to be accessible to both professional and non-professional users at all levels of the planning, design, and building process. While the 2030 Palette
is global in scope, it fits specific local needs and contexts. It provides the ideal platform for local level capacity building and information exchange.
Illustration 2. 2030 Palette•-•Swatch•overview•page

14
APPENDIx c: Architecture 2030 Initiatives
1.• The 2030 challenge Buildings, Cities, Products
a.• To•focus•the•Building•Sector•on•energy•and•GHG•emissions•reductions,•Architecture•2030•issued•the•2030•Challenge•in•2006:•a•global•initiative•that•calls•for•all•new•buildings•and•major•renovations•to•reduce•their•fossil•fuel,•GHG-emitting•energy•consumption:
○ 60% by 2010 ○ 70% by 2015 ○ 80% by 2020 ○ 90% by 2025 ○ carbon neutral by 2030
b.• To•date,•the•2030•Challenge•and•the•AIA•2030•Commitment•have•been•adopted•and•implemented•by:
•○ 80%•of•the•top•10,•and•70%•of•the•top•20•A/E/P•firms•in•the•world•(e.g.,•ARUP,•Perkins•+•Will,•HKS,•Gensler,•SOM,•and•HOK);•
•○ 52%•of•all•U.S.•architecture•firms•(2013•Design Intelligence Survey),•and•key•national•and•international•professional•organizations•including•the:
•○ 80,000-member•American•Institute•of•Architects,•○ 162,000-member•U.S.•Green•Building•Council,•○ 3,600-member•Royal•Architectural•Institute•of•Canada,•○ Ontario•Association•of•Architects,•○ Union•Internationale•des•Architectes,•○ Design•Futures•Council•(150•global•design•leaders),••○ 2,400-member•Congress•for•the•New•Urbanism,••○ American•Society•of•Heating,•Refrigerating,•and•Air-Conditioning•Engineers•
(ASHRAE),••○ US•Conference•of•Mayors,•○ International•Council•for•Local•Environmental•Initiatives.•
•○ Government•agencies•at•all•levels,•including•the•U.S.•Federal•government,•The•White•House,•National•Governors•Association,•U.S.•Conference•of•Mayors,•National•Association•of•Counties,•the•states•of•Minnesota,•California,•Washington,•and•Illinois,•and•numerous•cities•and•counties•across•the•U.S.•
c.• Subsequent•widely•adopted•2030•Challenges•were•issued•by•Architecture•2030•including•the•:
○ 2030 Challenge for Planning –•addresses•existing•urban•districts•and•cities,•calling•for•a•50%•energy•and•water•consumption,•and•transportation•emissions•reduction,•by•the•year•2030.
○ 2030 Challenge for Products –•addresses•energy•reductions•at•the•smallest•scale;•building•products.•This•Challenge•sets•reduction•targets•for•the•embodied•carbon•from•the•manufacturing•and•transportation•of•materials•such•as•cement,•steel,•wood,•and•carpet,•beginning•with•a•35%•reduction•by•2015,•incrementally•increasing•to•50%•by•2030.•

15
2. 2030 Districts Network District Scale Transformation
2030•Districts•are•unique•private/public•partnerships•that•• • • •unite•property•owners,•managers,•and•developers•with•local•• • •governments,•businesses,•and•community•stakeholders•in••••••••••••••••••••••••• •an•aggressive•model•for•urban•sustainability.•By•incorporating•• • •creative•strategies,•best•practices•and•verification•methods,•the•primary•target•of•each•2030•District•is•to•meet•a•50%•district-wide•reduction•in•existing•building•energy•and•water•consumption,•and•transportation•emissions•by•the•year•2030.• 2030•District•members•create•national•partnerships•and•purchasing•aggregation,•and•share•data•and•other•resources.•Today,•there•are•currently•established•2030•Districts•in:
•○ Seattle,•WA;•Cleveland,•OH;•Pittsburgh,•PA;•Los•Angeles,•CA;•and•Denver,•CO;•with•over•100•million•square•feet•of•buildings•committed,•and
•○ new•2030•Districts•being•formed•in•Stamford,•CT;•Detroit,•MI;•San•Antonio,•TX;•Dallas,•TX;•Silicon•Valley,•CA;•New•York•City,•NY;•Detroit,•MI;•Ann•Arbor,•MI;•Albuquerque,•NM;•San•Francisco,•CA;•Portland,•ME;•Syracuse,•NY;•Tacoma,•WA;•and•Toronto,•Canada,•with•interest•expressed•by•many•others.
3. urbanism + 2030 Sustainable Urbanism
To•address•the•challenges•associated•with•the•densification•• • • •of•the•urban•environment,•the•Congress•for•the•New•• • • •Urbanism•(CNU)•has•partnered•with•Architecture•2030• •• • •to•implement•the•2030•Challenge•for•Planning,•an•• • • • •incremental•set•of•performance•targets•for•transforming•the•built•environment•from•one•of•the•main•drivers•of•climate•change•to•a•central•part•of•the•solution.•
4. AIA + 2030 Professional Series Education Edge
The•AIA+2030•Professional•Series™•offers•the•very•latest,•• • •next-generation•design•practices•to•the•architecture•and•• • • •design•community•and•is•presented•in•25•markets•across•• • • •the•country•and•in•Canada,•from•New•York•City•to•Toronto•• • •to•Seattle.•This•ten-part•program•provides•the•design•and•technology•applications•needed•to•produce•resilient,•carbon-neutral•buildings•that•meet•the•energy•reduction•targets•of•the•2030•Challenge.•
AIA

16
APPENDIx D: The u.S. Building Sector
For the ninth straight year since issuing the 2030 Challenge, projected U.S. Building Sector energy consumption (building operations) and greenhouse gas emissions to the year 2030 have declined dra-matically.
According to the recent U.S. Energy Information Administration’s (EIA) Annual Energy Outlook 2014, the reference case (business-as-usual) energy consumption projections to the year 2030 have declined each year since 2005, even taking into consideration the fact that the U.S. will add about 60 billion square feet (5.6 billion square meters) to its building stock from 2005 to 2030.
graph 5.••Projected•U.S.•Building•Sector•Operations•2005•–•2030.
17
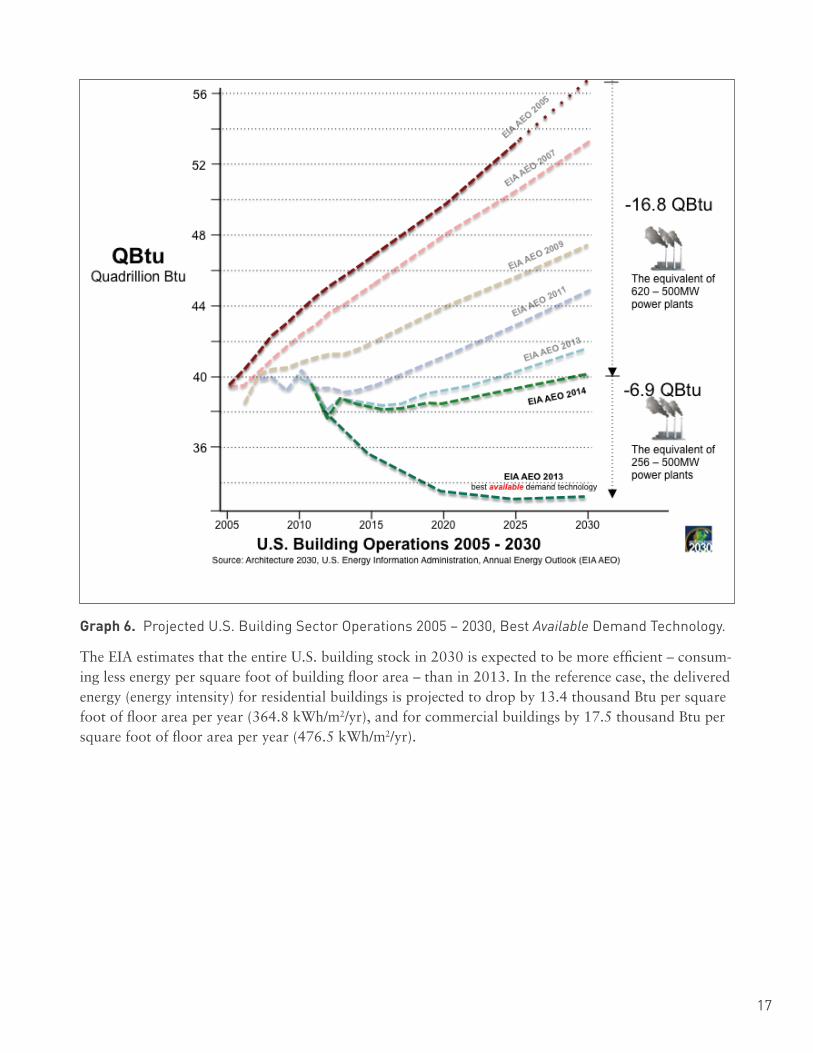
graph 6.••Projected•U.S.•Building•Sector•Operations•2005•–•2030,•Best•Available•Demand•Technology.
The EIA estimates that the entire U.S. building stock in 2030 is expected to be more efficient – consum-ing less energy per square foot of building floor area – than in 2013. In the reference case, the delivered energy (energy intensity) for residential buildings is projected to drop by 13.4 thousand Btu per square foot of floor area per year (364.8 kWh/m2/yr), and for commercial buildings by 17.5 thousand Btu per square foot of floor area per year (476.5 kWh/m2/yr).
18
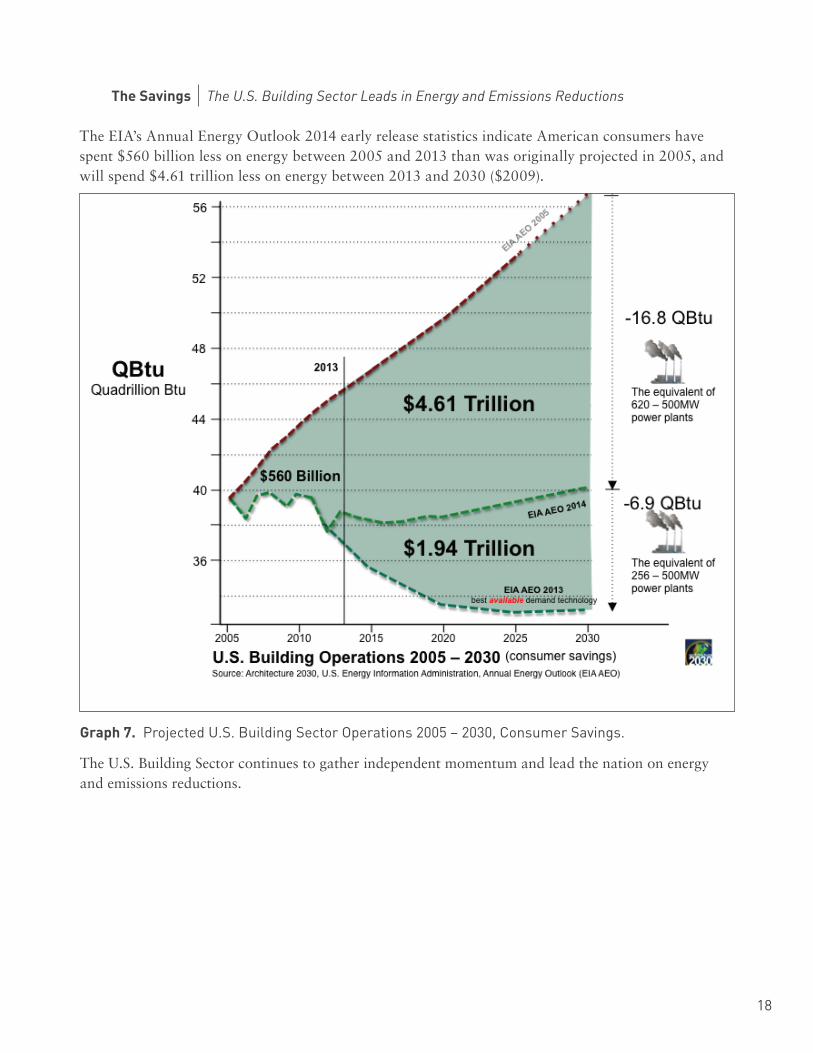
The Savings The U.S. Building Sector Leads in Energy and Emissions Reductions
The EIA’s Annual Energy Outlook 2014 early release statistics indicate American consumers have spent $560 billion less on energy between 2005 and 2013 than was originally projected in 2005, and will spend $4.61 trillion less on energy between 2013 and 2030 ($2009).
graph 7.••Projected•U.S.•Building•Sector•Operations•2005•–•2030,•Consumer•Savings.•
The U.S. Building Sector continues to gather independent momentum and lead the nation on energy and emissions reductions.
19
1.• Haites,•Erik;•Höhne,•Niklas;•Yamin,•Farhana.•Possible•Elements•of•a•2015•Legal•Agreement•on•Climate•Change.•2013.•http://www.iddri.org/Publications/Collections/Idees-pour-le-debat/WP1613_EH%20FY%20NH_legal%20agreement%202015.pdf•(accessed•05•15,•2014).
2.• Ecofys.•Feasibility•of•GHG•emissions•phase-out•by•mid-century.•2013.•http://www.ecofys.com/files/files/ecofys-2013-feasibility-ghg-phase-out-2050.pdf•(accessed•05•19,•2014).
3.• IPCC.•Intergovernmental•Panel•on•Climate•Change.•2013.•http://www.ipcc.ch/report/ar5/wg1/#.Uu59yXddU9A•(accessed•01•15,•2014).
4.• Climate•Analytics,•Ecofys,•and•the•Potsdam•Institute•for•Climate•Impact•Research.•Climate•Action•Tracker,•Below•2°C•or•1.5°C•depends•on•rapid•action•from•both•Annex•I•and•Non-Annex•I•countries.•2014.•http://www.ecofys.com/files/files/ecofys-ca-pik-climate-action-tracker-update-bonn-june-2014.pdf•(accessed•06•04,•2014).
5.• UNFCCC.•United•Nations•Framework•Convention•on•Climate•Change.•2014.•https://unfccc.int/documentation/•decisions/items/2964.php•(accessed•01•15,•2014).
6.• The•Potsdam•Institute.•Turn•Down•Heat,•Why•a•4°C•Warmer•World•Must•be•Avoided.•2012.•http://climatechange.worldbank.org/sites/default/files/Turn_Down_the_heat_Why_a_4_degree_centrigrade_warmer_world_must_be_avoided.pdf•(accessed•01•15,•2014).
7.• United•Nations.•World•Urbanization•Prospects•.•03•2012.•http://esa.un.org/unup/pdf/WUP2011_Highlights.pdf•(accessed•01•15,•2014).
8.• International•Energy•Agency.•World•Energy•Outlook,•2008.•2008.•http://www.worldenergyoutlook.org/media/weowebsite/2008-1994/weo2008.pdf•(accessed•01•15,•2014).
9.• United•Nations.•World•Urbanization•Prospects.•03•2012.•http://esa.un.org/unup/pdf/WUP2011_Highlights.pdf•(accessed•01•15,•2014).
10.• United•Nations.•World•Urbanization•Prospects.•03•2012.•http://esa.un.org/unup/pdf/WUP2011_Highlights.pdf•(accessed•01•15,•2014).
11.• Navigant•Consulting,•Inc.•Global•Building•Stock•Database.•2014.•http://www.navigantresearch.com/research/global-building-stock-database•(accessed•01•15,•2014).
12.• Dobbs,•Richard.•Insights•&•Publications.•06•2012.•http://www.mckinsey.com/insights/urbanization/urban_world_cities_•and_the_rise_of_the_consuming_class•(accessed•01•15,•2014).
13.• Adapted•from,•Dobbs,•Richard.•Insights•&•Publications.•06•2012.•http://www.mckinsey.com/insights/urbanization/urban_world_cities_•and_the_rise_of_the_consuming_class•(accessed•01•15,•2014).
14.• Dobbs,•Richard.•Insights•&•Publications.•06•2012.•http://www.mckinsey.com/insights/urbanization/urban_world_cities_•and_the_rise_of_the_consuming_class•(accessed•01•15,•2014).
15.• International•Energy•Agency.•World•Energy•Outlook,•2008.•2008.•http://www.worldenergyoutlook.org/media/weowebsite/2008-1994/weo2008.pdf•(accessed•01•15,•2014).
16.• Office•of•Energy•Efficiency•and•Renewable•Energy.•10•08,•2013.•http://energy.gov/eere/femp/articles/energy-independence-and-security-act•(accessed•01•15,•2014).
17.• Directive•2010/31/EU•of•the•European•Parliament•and•of•the•Council•of•19•May•2010•on•the•energy•performance•of•buildings.•For•further•information,•see•Concerted•Action•EPBD.•Towards•2020•-•Nearly•Zero-Energy•Buildings.•11•15,•2013.•http://www.epbd-ca.eu/themes/nearly-zero-energy•(accessed•01•15,•2014).
18.• California•Energy•Commission.•2013•Building•Energy•Efficiency•Standards.•http://www.buildinggreen.com/auth/article.cfm/2008/2/3/California-to-Require-Net-Zero-Energy-Buildings/•(accessed•01•15,•2014).
19.• bigEE.•2014.•http://www.bigee.net/en/policy/guide/buildings/policy_examples/26/•(accessed•01•15,•2014).
20.• Germanwatch,•Greenovation:Hub.•Financing•for•energy•efficiency•in•buildings•in•China•and•Germany.•10•2013.•https://germanwatch.org/en/download/8546.pdf•(accessed•01•15,•2014).
21.• Architecture•2030,•Inc.•Architecture•2030.•2014.•http://www.2030districts.org/•(accessed•01•15,•2014).
22.• Sustainable•Energy•for•All.•2030•Palette.•http://www.se4all.org/commitment/2030-palette/•(accessed•01•12,••2014)
23.• Architecture•2030,•Inc.•http://www.2030palette.org/•(accessed•01•15,•2014).
24.• Adapted•from,•Dobbs,•Richard.•Insights•&•Publications.•06•2012.•http://www.mckinsey.com/insights/urbanization/urban_world_cities_•and_the_rise_of_the_consuming_class•(accessed•01•15,•2014).
WORkS cITED
AckNOWlEDgEMENTS
*•••••Architecture•2030•would•like•to•acknowledge•the•special•contribution•made•to•this•report•by•Farhana•Yamin,••••••••••••••••••••••••••••••••••••Associate•Fellow,•Chatham•House.