Roadmap to Afterschool for All Examining Current Investments and Mapping Future Needs Afterschool...
30
Roadmap to Roadmap to Afterschool for Afterschool for All All Examining Current Investments and Mapping Future Needs www.afterschoolalliance.org Afterschool Alliance
-
Upload
tabitha-gin -
Category
Documents
-
view
223 -
download
0
Transcript of Roadmap to Afterschool for All Examining Current Investments and Mapping Future Needs Afterschool...
Roadmap to Roadmap to Afterschool for AllAfterschool for All
Examining Current Investments and Mapping Future Needs
www.afterschoolalliance.org
Afterschool Alliance

Basics of Afterschool
Parents of 28 million kids work outside the home. 14.3 million, or 25%, of the country’s K-12 youth
take care of themselves after school. 3 to 6 p.m. are the most dangerous hours for
kids. Juvenile crime soars Peak hours for drugs, alcohol, cigarettes and sex Lack of physical activity/obesity
Parents of 15 million children would sign up for an afterschool program – if one were available.
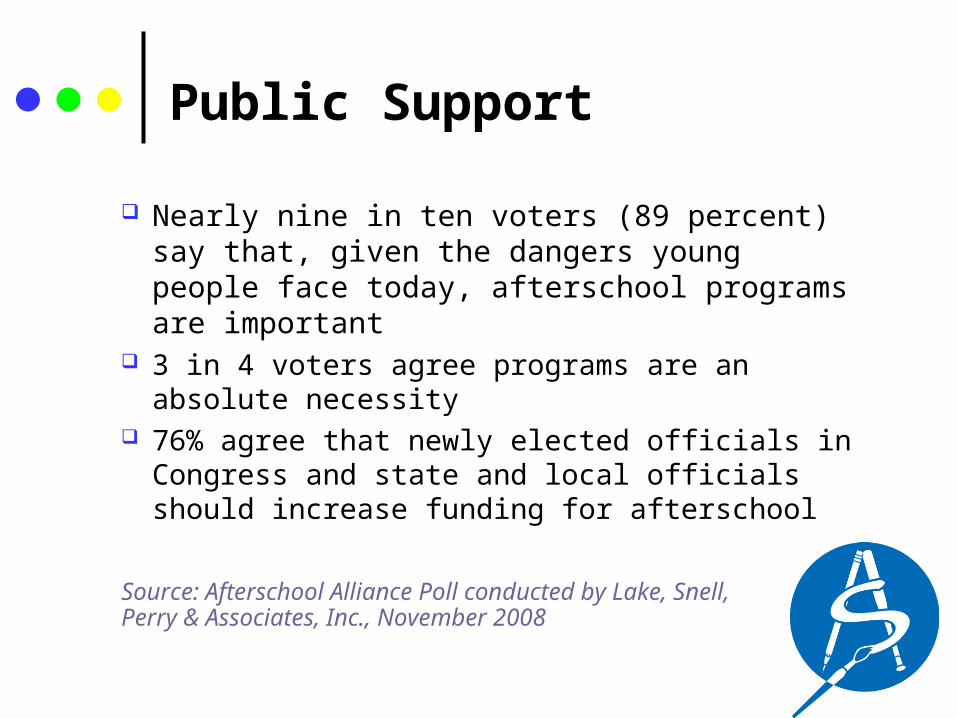
Public Support
Nearly nine in ten voters (89 percent) say that, given the dangers young people face today, afterschool programs are important
3 in 4 voters agree programs are an absolute necessity
76% agree that newly elected officials in Congress and state and local officials should increase funding for afterschool
Source: Afterschool Alliance Poll conducted by Lake, Snell, Perry & Associates, Inc., November 2008
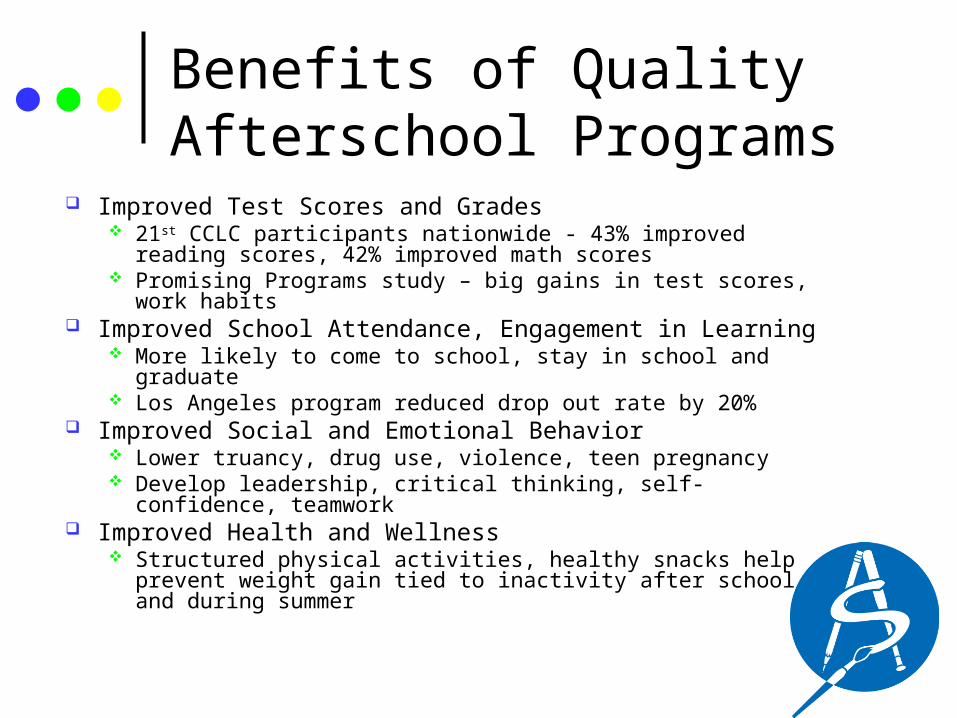
Benefits of Quality Afterschool Programs
Improved Test Scores and Grades 21st CCLC participants nationwide - 43% improved reading
scores, 42% improved math scores Promising Programs study – big gains in test scores, work habits
Improved School Attendance, Engagement in Learning
More likely to come to school, stay in school and graduate Los Angeles program reduced drop out rate by 20%
Improved Social and Emotional Behavior Lower truancy, drug use, violence, teen pregnancy Develop leadership, critical thinking, self-confidence, teamwork
Improved Health and Wellness Structured physical activities, healthy snacks help prevent weight
gain tied to inactivity after school and during summer

What We Knew Going Into This
21st Century Community Learning Centers $50 million increase for FY09
NCLB authorized $2.5 billion
Other sources of afterschool money: CCDBG, Safe and Drug Free Schools, OJJDP, SES, Department of Agriculture
FYAmount
Appropriated Amount
Authorized in NCLB
2002 $1 billion $1.25 billion
2003 $993.5M $1.5 billion
2004 $991M $1.75 billion
2005 $991M $2 billion
2006 $981M $2.25 billion
2007 $981M $2.5 billion
2008 $1.08 B $2.5 billion
2009 $1.13 B $2.5 billion
Federal Funding Picture
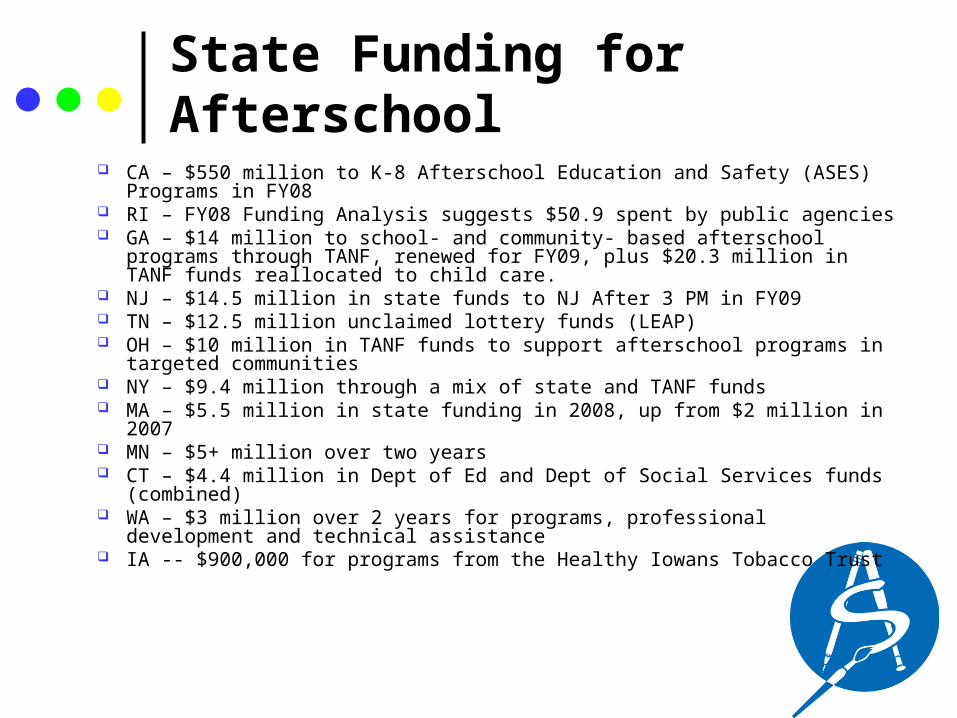
State Funding for Afterschool
CA – $550 million to K-8 Afterschool Education and Safety (ASES) Programs in FY08 RI – FY08 Funding Analysis suggests $50.9 spent by public agencies GA – $14 million to school- and community- based afterschool programs through TANF,
renewed for FY09, plus $20.3 million in TANF funds reallocated to child care. NJ – $14.5 million in state funds to NJ After 3 PM in FY09 TN – $12.5 million unclaimed lottery funds (LEAP) OH – $10 million in TANF funds to support afterschool programs in targeted
communities NY – $9.4 million through a mix of state and TANF funds MA – $5.5 million in state funding in 2008, up from $2 million in 2007 MN – $5+ million over two years CT – $4.4 million in Dept of Ed and Dept of Social Services funds (combined) WA – $3 million over 2 years for programs, professional development and technical
assistance IA -- $900,000 for programs from the Healthy Iowans Tobacco Trust
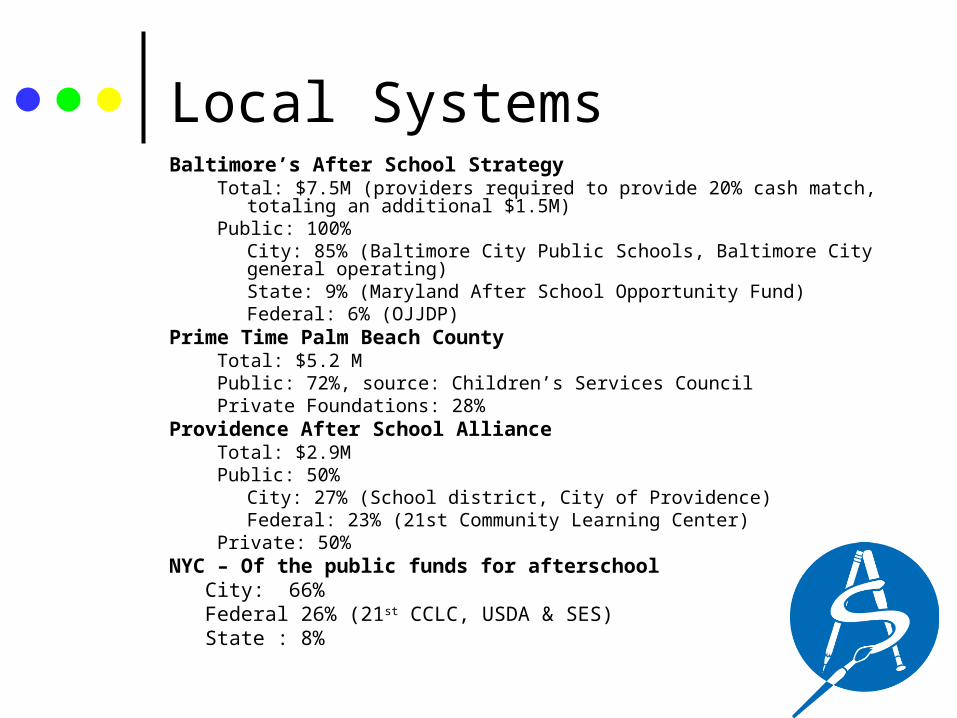
Local SystemsBaltimore’s After School Strategy
Total: $7.5M (providers required to provide 20% cash match, totaling an additional $1.5M)
Public: 100%City: 85% (Baltimore City Public Schools, Baltimore City general operating) State: 9% (Maryland After School Opportunity Fund)Federal: 6% (OJJDP)
Prime Time Palm Beach CountyTotal: $5.2 MPublic: 72%, source: Children’s Services Council Private Foundations: 28%
Providence After School Alliance Total: $2.9M Public: 50%
City: 27% (School district, City of Providence)Federal: 23% (21st Community Learning Center)
Private: 50%NYC – Of the public funds for afterschool
City: 66%Federal 26% (21st CCLC, USDA & SES)State : 8%
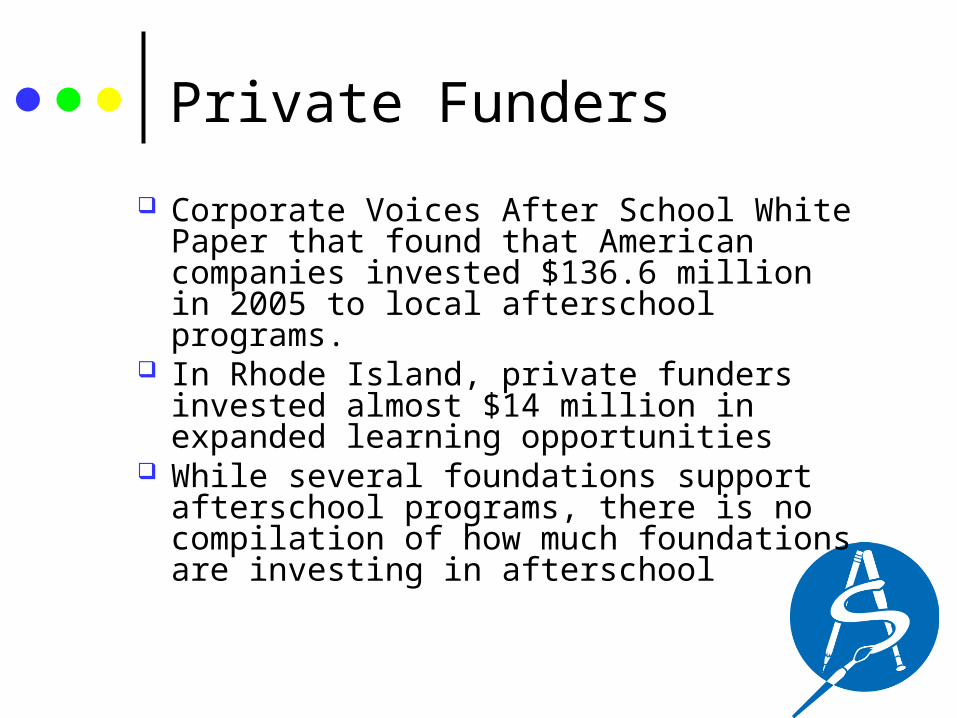
Private Funders
Corporate Voices After School White Paper that found that American companies invested $136.6 million in 2005 to local afterschool programs.
In Rhode Island, private funders invested almost $14 million in expanded learning opportunities
While several foundations support afterschool programs, there is no compilation of how much foundations are investing in afterschool
Roadmap to
Afterschool For All
Roadmap Project Overview
With funding from the Charles Stewart MottFoundation and the Atlantic Philanthropies,the Afterschool Alliance commissioned ascientific study to assess the current investmentin afterschool programs from the public sector,parents, foundations and business, and toestimate the added investment necessary ateach level to provide quality afterschool for all.
Roadmap Project Goals
Better understand current funding for afterschool;
Create a funding roadmap that will help sustain and expand quality afterschool programs;
Inform a long-term legislative agenda at every level; and
Create real benchmarks for measuring progress.
Methodology of the Study
Multiple Stage Sampling 50 School Districts, stratified by income
and then selected using PPS Developed sampling frame of afterschool
programs in 50 districts Telephone interviews with 537 programs
from the 50 districts – goal was 10 from each district, but some districts had fewer than 10 programs
Secondary analysis: tracking federal, state, philanthropic and corporate funding with afterschool as an allowable use
DefinitionFor this survey, afterschool programs are
defined as programs that:
serve school-age children, occur before or after school (but may also
occur at other times like weekends and in the summer),
operate approximately 12 or more hours/week and
are not single-activity focused (e.g., not only tutoring or sports).

Survey Instrument
Administered by phone Asked programs basic descriptive info
How many kids servedHours of operationTypes of activities
Funding informationRepeated same series of questions
for all funding sources
Findings – Basic Descriptive Info
Long running programs – more than half in operation for 10+ years
Most operate 5 days a week for at least 3 hours a day and in summer
Students participate regularly Mostly elementary students School is most common location, but some programs
in schools are run by non-profits or for-profits 48% of programs report serving at least 40% free or
reduced price lunch students.

Indicators of Quality
Median child to staff ratio is 11:1 For 87% of programs, a majority of enrolled students
participate regularly (at least 60% of the time) Staff Qualifications
Site Coordinators/Directors• 95% have had previous experience with youth, 41% are
certified teachers, 83% have a 2- or 4-year degree Staff
• In one-third of the programs, at least some of the staff were certified teachers.
• In half of the programs, some or all of the staff had a 2 or 4 year degree.
• In virtually all of the programs (94%) at least some of the staff had previous experience with youth.

Findings
Activities offered by programs serving all age groups:
Tutoring/Academics/Homework help: 98% Recreation and sports: 93% Health education : 88% Life/Personal skills: 88% Creative arts: 84% Family involvement: 76% Mentoring: 74% Leadership skills: 72% Community service: 70%
Findings
Activities – Among older youth programs only:
Career Development: 51% College application assistance: 47% Substance abuse prevention: 47% Violence prevention 41% Pregnancy prevention: 34%
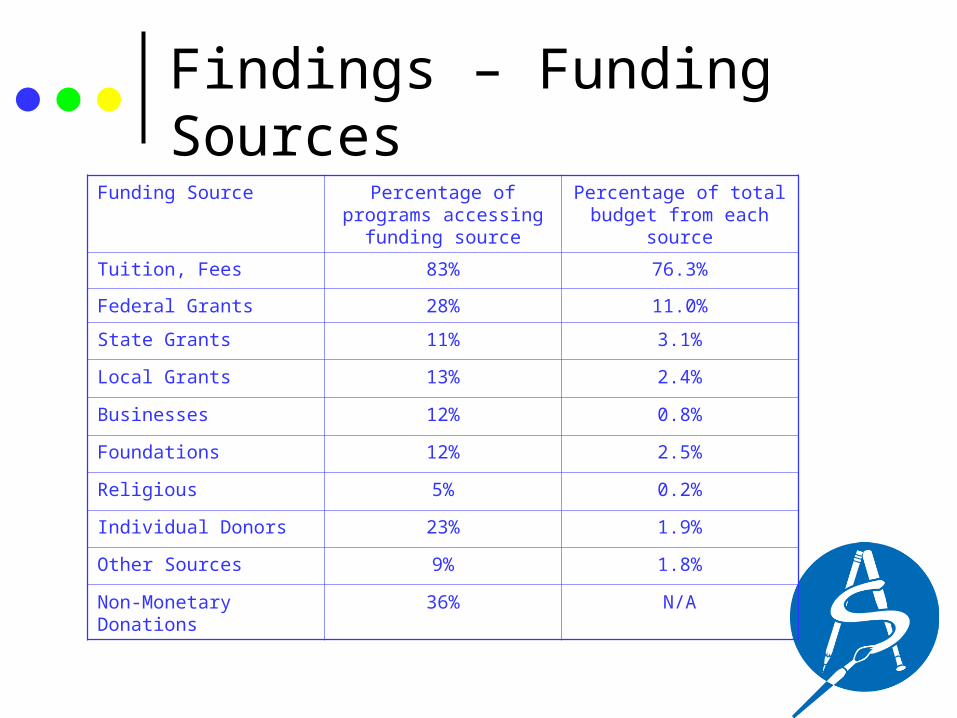
Findings – Funding SourcesFunding Source Percentage of programs
accessing funding sourcePercentage of total
budget from each source
Tuition, Fees 83% 76.3%
Federal Grants 28% 11.0%
State Grants 11% 3.1%
Local Grants 13% 2.4%
Businesses 12% 0.8%
Foundations 12% 2.5%
Religious 5% 0.2%
Individual Donors 23% 1.9%
Other Sources 9% 1.8%
Non-Monetary Donations 36% N/A
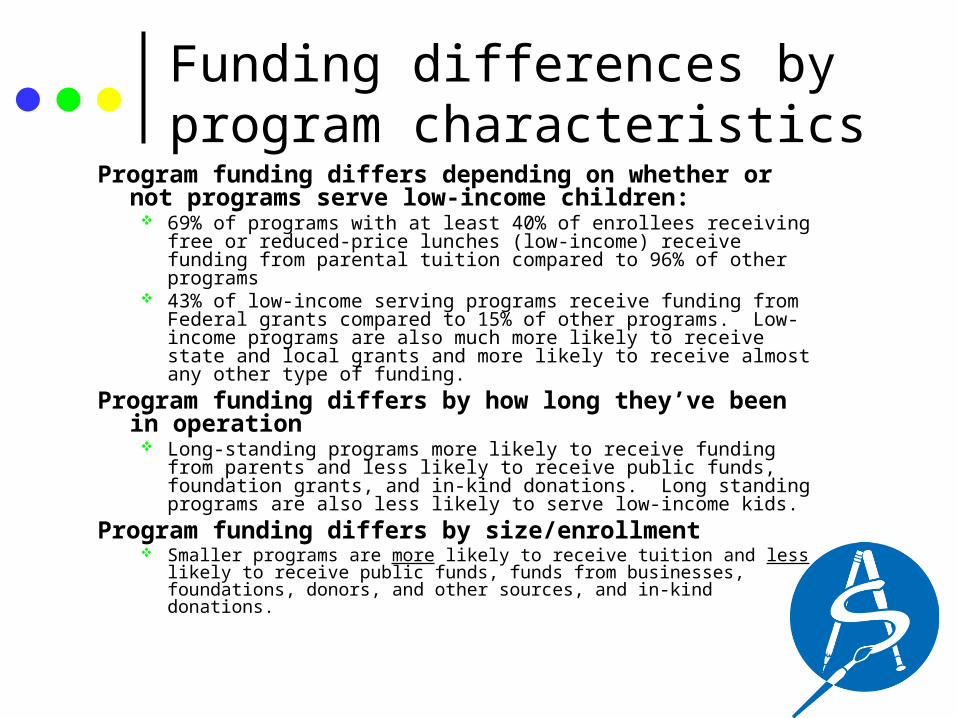
Funding differences by program characteristics
Program funding differs depending on whether or not programs serve low-income children:
69% of programs with at least 40% of enrollees receiving free or reduced-price lunches (low-income) receive funding from parental tuition compared to 96% of other programs
43% of low-income serving programs receive funding from Federal grants compared to 15% of other programs. Low-income programs are also much more likely to receive state and local grants and more likely to receive almost any other type of funding.
Program funding differs by how long they’ve been in operation
Long-standing programs more likely to receive funding from parents and less likely to receive public funds, foundation grants, and in-kind donations. Long standing programs are also less likely to serve low-income kids.
Program funding differs by size/enrollment Smaller programs are more likely to receive tuition and less likely to
receive public funds, funds from businesses, foundations, donors, and other sources, and in-kind donations.

Cost Estimate Consistent with other Cost Research
By dividing total cost by enrollment, average cost per student per year is $3190 (includes summer for most programs)
January 2009 report by P/PV and Finance Project, commissioned by The Wallace Foundation found average cost per enrollee to be $3366 for ES/MS and $2670 for HS (includes summer program).
Rhode Island Cost Analysis found average cost to be $2,097 for school year plus $636 per student per summer = $2733
Center for Summer Learning – average cost of summer program $1295
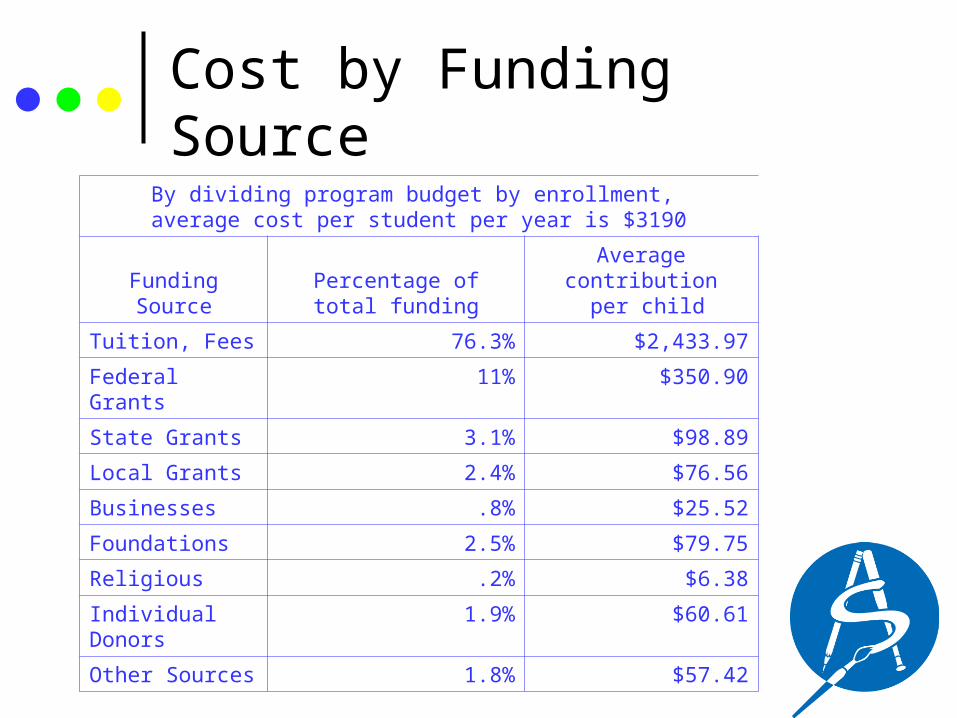
Cost by Funding Source
By dividing program budget by enrollment, average cost per student per year is $3190
Funding Source Percentage of total fundingAverage contribution
per child
Tuition, Fees 76.3% $2,433.97
Federal Grants 11% $350.90
State Grants 3.1% $98.89
Local Grants 2.4% $76.56
Businesses .8% $25.52
Foundations 2.5% $79.75
Religious .2% $6.38
Individual Donors 1.9% $60.61
Other Sources 1.8% $57.42
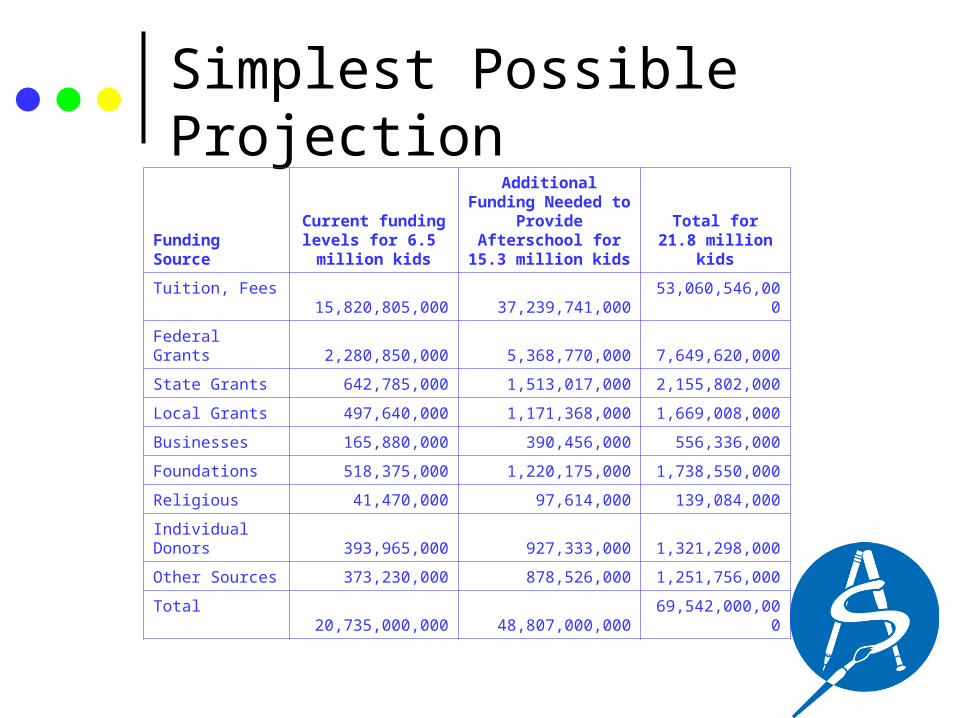
Simplest Possible Projection
Funding Source
Current funding levels for 6.5 million kids
Additional Funding Needed to Provide
Afterschool for 15.3 million kids
Total for 21.8 million kids
Tuition, Fees 15,820,805,000 37,239,741,000 53,060,546,000
Federal Grants 2,280,850,000 5,368,770,000 7,649,620,000
State Grants 642,785,000 1,513,017,000 2,155,802,000
Local Grants 497,640,000 1,171,368,000 1,669,008,000
Businesses 165,880,000 390,456,000 556,336,000
Foundations 518,375,000 1,220,175,000 1,738,550,000
Religious 41,470,000 97,614,000 139,084,000
Individual Donors 393,965,000 927,333,000 1,321,298,000
Other Sources 373,230,000 878,526,000 1,251,756,000
Total 20,735,000,000 48,807,000,000 69,542,000,000
Need a new route to get to Afterschool for All We need a roadmap that establishes concrete objectives for
achieving, in the not too distant future, afterschool for all students. This roadmap must:
Account for the economic reality that some parents are unable to afford fees, while others can.
Recognize the important role of multiple funding sources – governments at all levels, philanthropic support, businesses, parent fees.
Account for a broad range of programs from a variety of sponsors, reflecting rich diversity of American communities.
Focus on approaches that sustain successful quality programs, while allowing innovative new programs to develop.
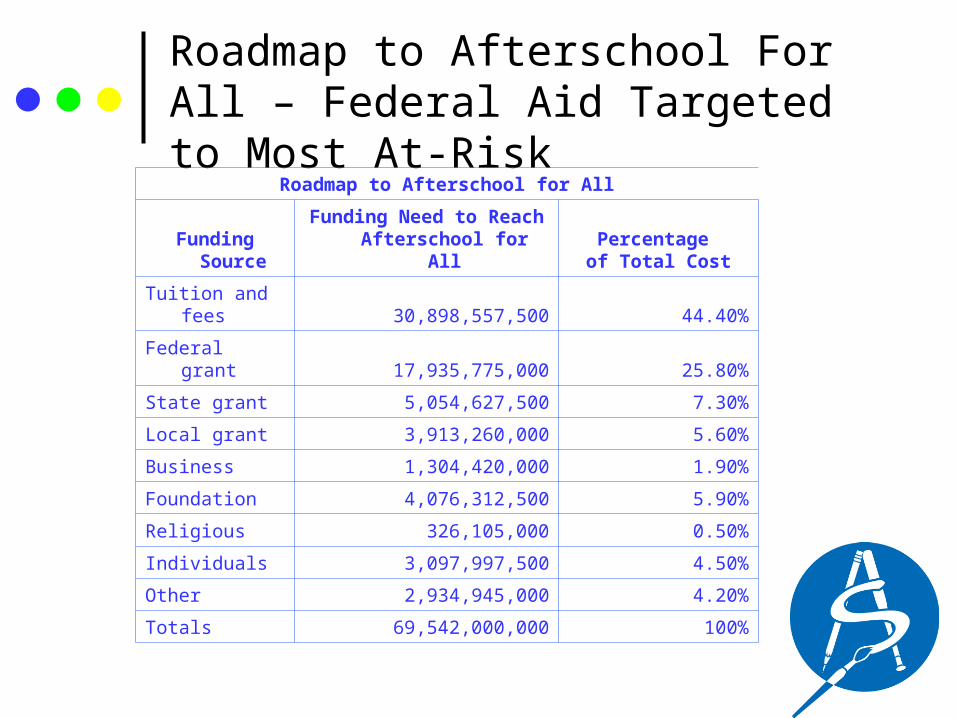
Roadmap to Afterschool For All – Federal Aid Targeted to Most At-Risk
Roadmap to Afterschool for All
Funding Source
Funding Need to Reach Afterschool for All
Percentage of Total Cost
Tuition and fees 30,898,557,500 44.40%
Federal grant 17,935,775,000 25.80%
State grant 5,054,627,500 7.30%
Local grant 3,913,260,000 5.60%
Business 1,304,420,000 1.90%
Foundation 4,076,312,500 5.90%
Religious 326,105,000 0.50%
Individuals 3,097,997,500 4.50%
Other 2,934,945,000 4.20%
Totals 69,542,000,000 100%
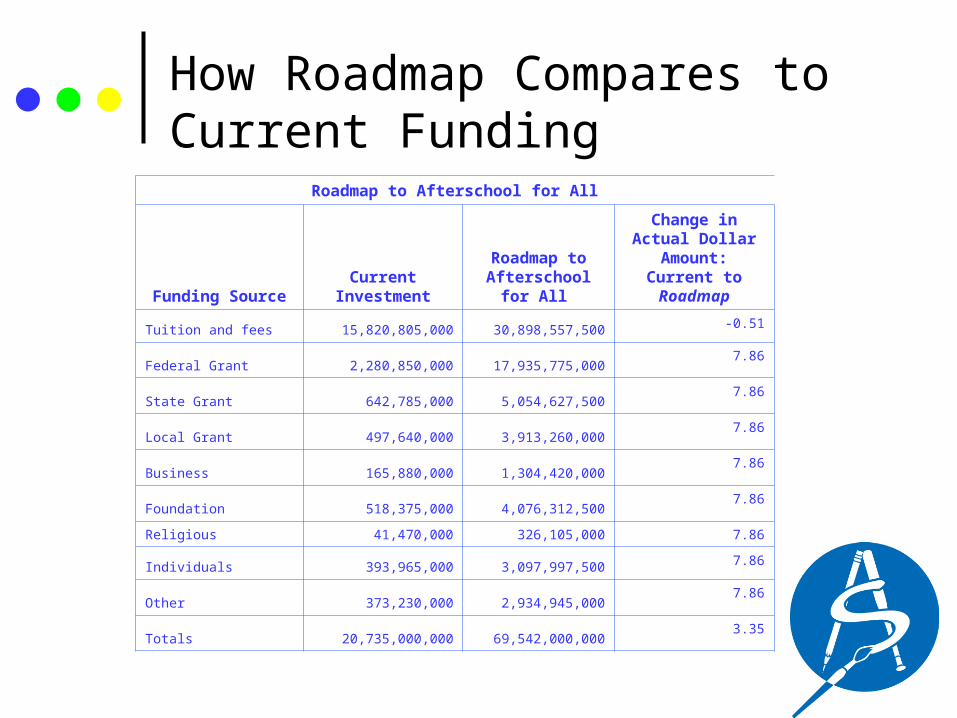
How Roadmap Compares to Current Funding
Roadmap to Afterschool for All
Funding SourceCurrent
Investment
Roadmap to Afterschool for
All
Change in Actual Dollar Amount:
Current to Roadmap
Tuition and fees 15,820,805,000 30,898,557,500 -0.51
Federal Grant 2,280,850,000 17,935,775,0007.86
State Grant 642,785,000 5,054,627,5007.86
Local Grant 497,640,000 3,913,260,0007.86
Business 165,880,000 1,304,420,0007.86
Foundation 518,375,000 4,076,312,5007.86
Religious 41,470,000 326,105,000 7.86
Individuals 393,965,000 3,097,997,500 7.86
Other 373,230,000 2,934,945,0007.86
Totals 20,735,000,000 69,542,000,0003.35
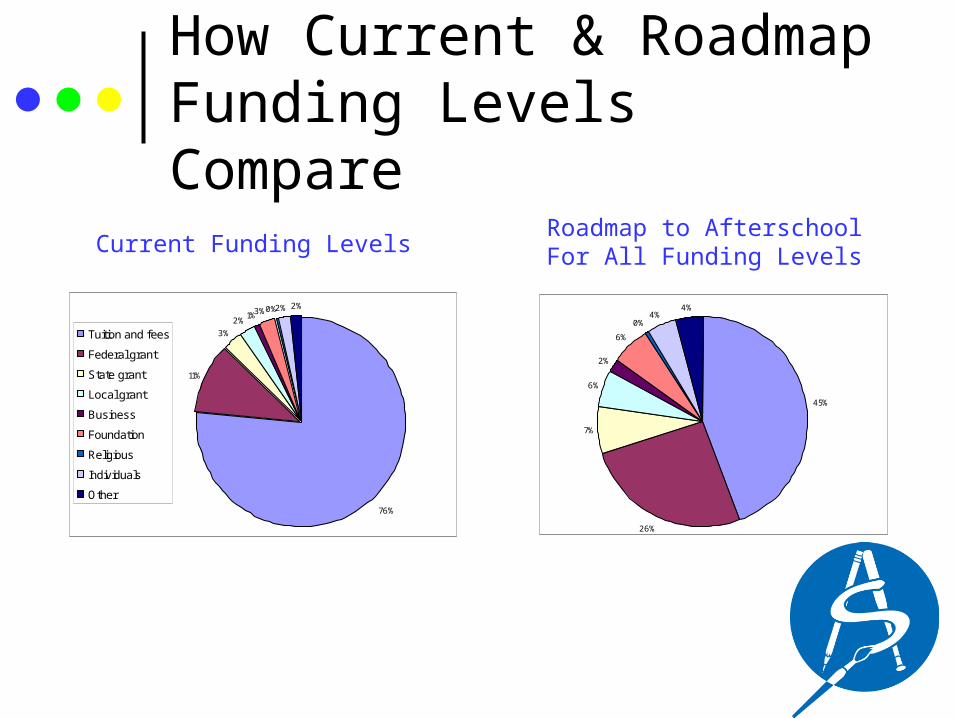
How Current & Roadmap Funding Levels Compare
76%
11%
3%
2%1%3%0%2% 2%
Tuition and fees
Federal grant
State grant
Local grant
Business
Foundation
Religious
Individuals
Other
45%
26%
7%
6%
2%
6%
0%4%
4%
Current Funding LevelsRoadmap to AfterschoolFor All Funding Levels

Takeaway Messages
Clear that parents are carrying most of the costs – need to increase investments by other sectors
Federal targeting appears effective, but not sufficient
About one-third (32%) of programs reported that their expenses exceeded their revenues, indicating that more funding is needed
Takeaway Messages
In these economic times, federal role is especially important $2.5 billion for 21st CCLC is good place to start. 21st
CCLC funds leverage other funds and benefit from in-kind support
1/4 of CCDBG funding supports school age kids – An increase of CCDBG by $1 billion will help more parents afford their share
Fund STEP UP Promote use of stimulus dollars to support afterschool
and summer All other sectors increase investments proportionate to
federal increase
Closing Thoughts
Critical Time An investment in afterschool programs is an
investment in the next generation, Unless we put the afternoon hours to good use, we
lose a real opportunity Now more than ever, we need to increase the
investment in quality afterschool programs from all sectors.
The Roadmap to Afterschool for All is designed to point the way – but the real test of America’s commitment to its children will be whether we travel down the road this report maps out.