Roadmap for A Roadmap Rd f or Government Enhancement … · Enhancement Roadmap or Government...
83
Roadmap for A R d f te Roadmap for Government Enhancement A Roadmap for Government Transformation stitut Enhancement Transformation ent In Prepared by: rnme Baker Tilly Virchow Krause, LLP FEBRUARY 2010 Gover cal G e Lo Th
Transcript of Roadmap for A Roadmap Rd f or Government Enhancement … · Enhancement Roadmap or Government...

Roadmap forA R d f teRoadmap forGovernment
Enhancement
A Roadmap for Government
Transformation stitu
t
EnhancementTransformation
ent I
n
Prepared by: rnm
e
p yBaker Tilly Virchow Krause, LLP
FEBRUARY 2010
Gov
erca
l Ge
LoTh

A Roadmap for Government Transformation
This report was prepared under the direction of the following LGI representatives:
Steering CommitteeWilliam Mielke, President/CEO Ruekert Mielke, Waukesha (public board member)Terry McMahon, Supervisor, Town of Yorkville, Racine County (Wisconsin Towns Association)Dennis O’Loughlin, Supervisor, Dane County (Wisconsin Counties Association)James Tipple, Mayor, City of Wausau (League of Wisconsin Municipalities)Jean Jacobson, Town Board Chair, Town of Norway, Racine County (public board member)John Reineman Wisconsin Counties AssociationJohn Reineman, Wisconsin Counties AssociationGary Becker, Local Government Institute
LGI BoardJerry Wehrle (President), Mayor, City of LancasterJim Dwyer (Secretary), County Board Chair, Waukesha CountyTim Hanna, Mayor, City of AppletonTerry McMahon, Supervisor, Town of Yorkville, Racine Countyy , p , , yDennis O’Loughlin, Supervisor, Dane CountyJames Tipple, Mayor, City of WausauWilliam Mielke, Public Board MemberDarryl Mayfield, Public Board MemberJean Jacobson, Public Board MemberRick Stadelman, Executive Director, Wisconsin Towns Association*Dan Thompson, Executive Director, League of Wisconsin Municipalities*Ed H ck E ec ti e Director Wisconsin Alliance of Cities*Ed Huck, Executive Director, Wisconsin Alliance of Cities*Mark O’Connell, Executive Director, Wisconsin Counties Association*
* Ex-officio Board Members
Public facilitation, analysis, and report development was led by:
Baker Tilly Virchow Krause LLPBaker Tilly Virchow Krause, LLPChristine Smith, PrincipalDavid Varana, Manager
The report was funded by:
Wisconsin Counties AssociationLeague of Wisconsin MunicipalitiesLeague of Wisconsin MunicipalitiesWisconsin Alliance of CitiesWisconsin Towns AssociationBaker Tilly Virchow Krause, LLP

EXECUTIVE SUMMARY
Baker Tilly Virchow Krause, LLP / Local Government Institute PAGE 1
The relationship between local units of government, the services they provide and sources of funding for those services is a debate of historic proportions in Wisconsin. Early in the 20th century this debate yielded innovation in the way services are delivered and funded that were copied across the country. Since the mid-1950’s however, the debate has been intense with no less than a dozen special commissions and task forces examining these relationships. Despite the intensity of the discussion at the state level, it seems that very little has been accomplished to improve the ability of local governments to work together for efficient cost effective service delivery or to address issues of a regional nature. In late 2007, the associations representing local government in Wisconsin – the League of Wisconsin Municipalities, Wisconsin Counties Association, Wisconsin Towns Association and the Wisconsin Alliance of Cities came together to form the Local Government Institute of Wisconsin (LGI). The vision for LGI is to find solutions for the efficient delivery and funding of local government services consistent with the needs of our citizens. In support of its mission to conduct research, enhance collaboration, and educate the public and decision makers on policies for improving local government’s ability to serve state residents, the LGI secured the service of Baker Tilly Virchow Krause, LLP (Baker Tilly) to facilitate research and discussion about ways for governmental leaders to facilitate the transformation of governmental service delivery within Wisconsin. The specific objectives of this study were to: Identify changes in the structure of government or
the relationship between levels of government that could result in greater efficiency for delivery of local government services;
Identify changes in local government structure that could result in greater efficiency in the delivery of services;
Complete a comparative analysis covering characteristics, benefits, and barriers to adoption of changes; and
Provide case studies of how identified alternatives or changes have been successfully implemented.
KEY GOALS OF THE PROJECT: 1. Determine whether having fewer governments is
truly more efficient and cost effective than having more local governments.
2. Understand how existing regional government organizations synthesize local and regional interest to get things done.
3. Identify services that are proven to be delivered more efficiently through local government cooperative action.
4. Recommend an approach to facilitate the definition of local versus regional interest.
WHY IS TRANSFORMATION CRITICAL? The need for transformation rests on three fundamental challenges facing local governments: Increasing tax burden coupled with increasing
demand for services creates instability for local governments;
Difficulty in addressing issues of a regional nature; and
Wisconsin’s economic competitiveness is declining due to increasing tax burden, a misalignment between jurisdictions, service and revenue sources, and the difficulty in reaching agreement on regional investments.
Economic practitioners and academics agree that the ability of local, regional, and state governmental entities to maintain an acceptable level of government service, while establishing conditions that allow business to operate efficiently, has an impact on a region’s capacity for economic development. A recent nationwide survey of economic developers points to the fact that tax burden and operating cost is increasing in importance as a consideration for business retention, expansion, or location. Transformation of government can positively impact the competitiveness of local, state, and regional economies. A key consideration in determining options for transforming governmental services is that community residents and state business interests feel strongly that reduction of services is not an option. Similarly,
EXECUTIVE SUMMARY
Baker Tilly Virchow Krause, LLP / Local Government Institute PAGE 2
increases in the tax burden to these stakeholders, while possible, is not feasible for the state to remain economically competitive. Efforts to positively impact the efficiency and effectiveness of government service delivery requires action through three specific channels:
OUTCOME CHANNEL
Increased revenue through economic growth
Local Government and Business Collaboration
Reduced cost of service to the individual taxpayer
Intergovernmental Collaboration
Increased effectiveness of government finance system
State, Local, and Regional Collaboration
A prevalent perception, historically, has been that a reduction in the units of government in Wisconsin is required in order to reduce the cost of government. This study indicates that, in fact, the number of units of government present within a state does not correlate directly with the cost of providing governmental services. Additionally, the impetus for most successful consolidations nationally has not been cost reduction, but rather the need to enhance service or better position a region from an economic development perspective. The research further shows that reductions in municipal expenditures (in terms of significantly decreased annual operating costs) are not the most commonly realized fiscal impact of functional service consolidation or other cooperative actions. Rather, analysis of local government expenditure data from the WI Department of Revenue, and of information collected directly from case studies, suggests that positive fiscal impacts are more commonly seen in the following two general areas: Cost Avoidance: Significant savings are achieved
through avoided capital costs over the medium and long term. This appears to primarily be due to the fact that, under consolidated service delivery, partners can spread capital costs over a larger tax base, thereby reducing the per-capita cost of buildings, equipment, vehicles, and systems. Further, in some cases, consolidated Departments
are able to eliminate duplicate equipment that would ordinarily have been replaced.
Reduced Annual Expenditure Increases: In
several case studies, it was noted a significant reduction (in some cases as much as by half) in the rate at which costs had historically been increasing. One possible explanation of why this may occur is that under consolidated service delivery, there is a powerful incentive to control costs in order to maintain the value proposition for the partners. It has been observed that local governments in Wisconsin are very cost conscious about maintaining control over their own budgets. However, in the case of a consolidated or joint Department, there are multiple sets of eyes reviewing operating costs.
There are also certain functional areas that history has proven are more feasible for consolidation or cooperation based on the ability to overcome barriers and align a variety of communities’ expectation with necessary success variables. The research has outlined the typical barriers and success factors relative to effectively achieving governmental service delivery transformation; however, it is clear that it is not feasible to take a “one-size-fits-all” approach when identifying approaches to greater government efficiency and collaboration. Historical barriers to consolidation or shared services approaches to service delivery include factors such as: political turf protection, competition for revenue or business growth, challenges from literal community boundaries, and perceived differences in service needs. To overcome these barriers, there are several key success factors including: Realization of Improved Service Clear Fiscal Benefits Proactive and Collaborative Inter-Governmental
Leadership Trust between Involved Entities Community Support of Initiatives Shared Perception of Need
EXECUTIVE SUMMARY
Baker Tilly Virchow Krause, LLP / Local Government Institute PAGE 3
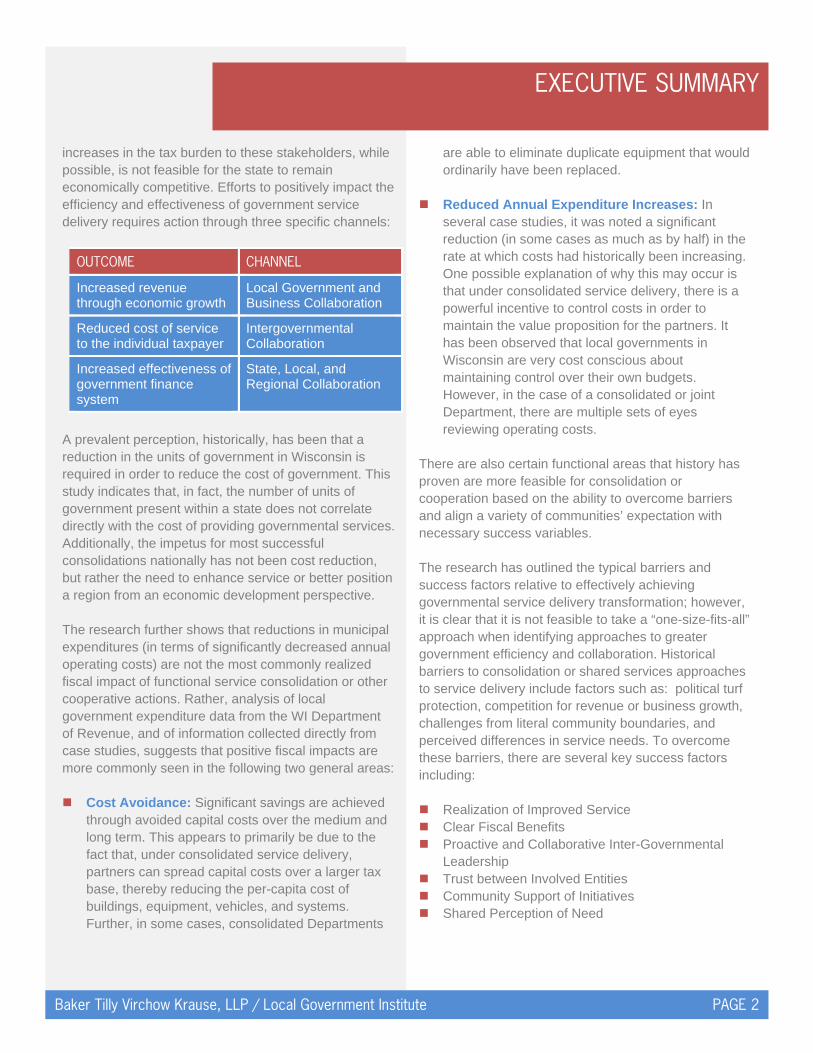
Key Action Steps for LGIThe Local Government Institute’s leadership in realizing these success factors and proactively addressing alternatives to the current approach to governmental service delivery is paramount to the realization of meaningful government transformation. Several key actions steps that LGI must take include:
1. Support the creation of Legislative Council Study Committees on Regional Collaboration with the ultimate goal of creating legislation for:
Evaluating current funding methods at the state level to encourage regional distribution of revenue as a means to reduce competition and encourage collaboration relative to regional growth.
Proactive work to revise the county and municipal aid program to incent regional service delivery for high suitability functional areas.
2. Create a broader mechanism for communities to overcome capital cost barriers whether at the state or regional level.
3. Recommend governmental associations and other stakeholders take steps to overturn the new “Maintenance of Effort” law.
4. Facilitate Intergovernmental Collaboration Councils at the multijurisdictional or regional level.
5. Seek legislative support and funding for financial incentives to cooperatively negotiate boundary agreements.
6. Increase cooperation for key services across the state and within regions applying the outlined success factors.
7. Sponsor a leadership forum and support a framework to educate municipal leaders about the benefits of and steps required to mitigate risk relative to cooperative agreements across the consolidation continuum.
8. Proactively develop formal linkages between existing regional economic development entities and intergovernmental collaboration councils.
THE CASE FOR CHANGE
Baker Tilly Virchow Krause, LLP / Local Government Institute PAGE 4
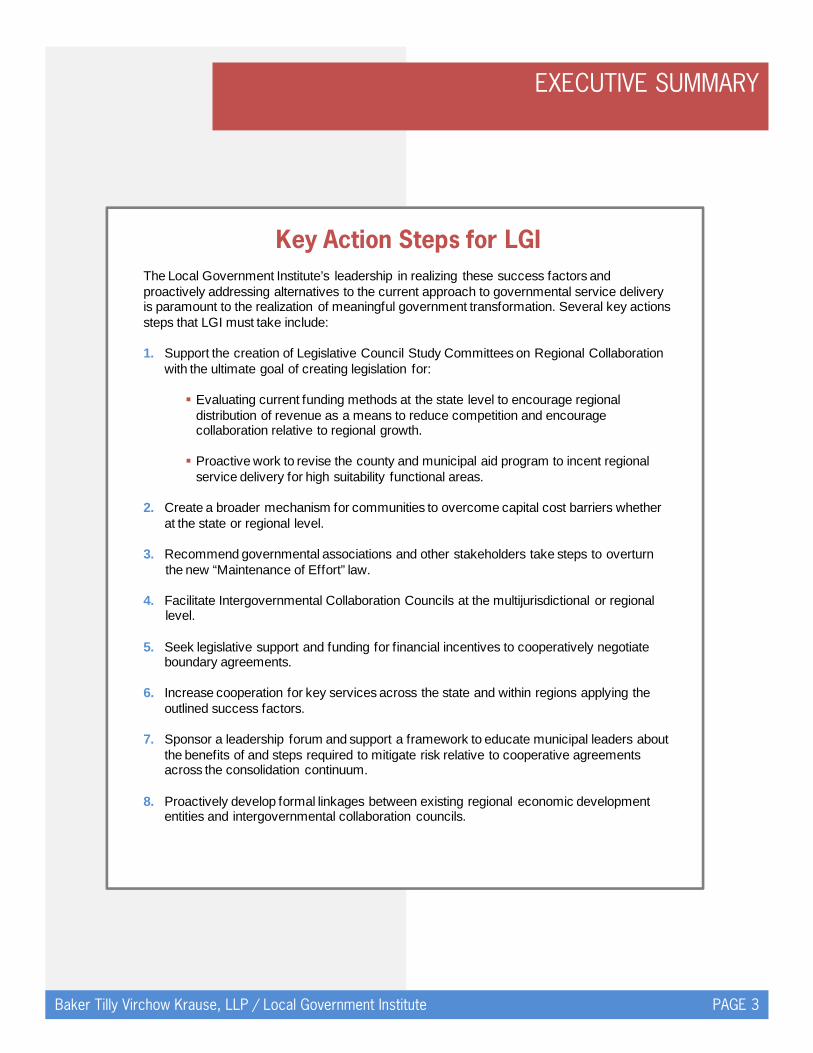
There are several long-term demographic trends forecasted to negatively impact the local government finance situation in Wisconsin by 2030 (Wisconsin Way 2009): More than one million new residents (increased
service demand) Seniors will represent one in four taxpayers, vs.
today: one in six (challenge to support future property tax increase, lower income taxes to state)
Continued net loss of college graduates Nine out of ten fastest-growing occupations require
a high school degree or less (proportionally fewer people in workforce, earning less)
The current negative economic climate will eventually end, but local governments are facing dire fiscal challenges that are not likely to ease in the near future. There is no respite from increases in the cost to deliver services. Revenues are declining, and there is widespread aversion to further tax increases. The Legislative Fiscal Bureau reports that 2009 Shared Revenue and Municipal Aid are at the equivalent level of these programs in 1994. Many believe that the State will face another significant budget deficit in the 2011-13 biennium, with some estimates projecting as much as a $2 billion deficit.
UNFAVORABLE DEMOGRAPHIC TRENDS INCREASED BUDGET CHALLENGES
88%of city finance officers responding to the National League of Cities’ Annual Survey believe that their cities are less able to meet fiscal needs in 2009 than in the previous year.
Local Government Options
REDUCE SERVICES
Wisconsin residents want government to play an active
role in shaping a better community
RAISE REVENUES
Tax increases are toxic
SPREAD COSTS ACROSS MORE TAXPAYERS =
CONSOLIDATION
Dif f icult, but feasible
Local Government & Business Community
Options LOCAL GOVERNMENT
FINANCE SYSTEM REFORM
Reform of local government revenue
system requires leadership at both State and Local
levels
State & Local Options
Unfavorable Demographic
Trends
Local Government
Budget Pressure
Population growth = increased demand for services
Uncertainty over future federal and state aid
Fewer people in the workforce, less able to
afford services
Declining economic conditions
Flat local aid payments from
state
No respite from expenditure increases
Aversion to tax
increases
Aging population
Job growth occurring in low skill occupations
“Brain drain”
Health insurance
Salary increases
Pension expenditure growth
Ongoing capital replacement
OPT
IONS
CASE
FO
R CH
ANGE
INCREASE REVENUE VIA ECONOMIC
GROWTH
Economic growth requires value factors for
businesses including impact on balance sheet
and quality services

THE CASE FOR CHANGE
Baker Tilly Virchow Krause, LLP / Local Government Institute PAGE 5
Several studies have analyzed the cost implications for current structures of government and concluded that, while maybe not the only factor, a fragmented management structure restricts the cost effective use of resources and is a contributing factor to high costs and taxes for local government. Specifically, the Center for Government Research (CGR) has conducted numerous studies (e.g. A Tale of Two Suburbs: Comparative Analysis of Cost of Local Governments (CGR 2007), Cost of Government Study for Northeast Ohio (CGR 2008), Consolidation Study for the Village of Albion, Town of Albion, and Town of Gaines) that have indicated with empirical data that the per capita cost of government can and does relate to whether a more centralized and multi-jurisdictional approach to government service delivery is adopted. This analysis, however, does not take into consideration differences in contract terms, service levels, or variations in infrastructure age. As noted, economic growth is one of the key strategies for local governments to ensure that a sufficient revenue stream is available to fund the service that residents expect. When a business considers whether to expand or locate their operations in a community, a number of factors are evaluated. Several of these factors are directly impacted by government, and as such, government leaders must play a proactive role to establish conditions that will allow business to establish or maintain operations in an efficient manner. Specific factors evaluated include: 1. Cost of operations as impacted by variables such
as market labor rates, tax burden and utility rates; 2. Ease of establishing and maintaining operations; 3. Quality of public sector services and infrastructure; 4. Site attributes;
5. Business climate (e.g. zoning, planning, permitting; and
6. Availability of incentives and investment capital. Despite the lack of consistent empirical evidence to show a direct correlation between governmental consolidation models and economic development, practitioners and academics agree that the ability of local, regional, and state governmental entities to offer required governmental services and quality of life within an acceptable operating cost structure has an impact on a region’s capacity for economic development (City and County Consolidation: Practitioners and Academics View, 2008, Rand). Researchers observe that regions in which consolidation or other shared service efforts occurred fared better in terms of economic development rates in comparison to other regions within that state. Although difficult to measure impacts in a comprehensive quantitative manner, studies show that more consolidated or regional governmental models can have the following anticipated effects which support enhanced economic development capacity:
ELEMENT CHARACTERISTIC Unity of leadership One accountable decision
maker Common vision
Increased planning and development capacity
More comprehensive planning and coordinated land use Larger resource base for
attracting and supporting development
Simpler regulatory procedures for business
Clarity of authority Improved transparency
Reduced intergovernmental competition
Less fragmented government
Government Consolidation and Economic Development in Allegheny County and the City of Pittsburgh, 2008, Rand
GOVERNMENT CAN IMPACT BUSINESS GROWTH
FRAGMENTATION OF GOVERNMENT DRIVES UP COSTS
THE CASE FOR CHANGE
Baker Tilly Virchow Krause, LLP / Local Government Institute PAGE 6
Recent research completed by New Economy Strategies suggests that economic development professionals are closely evaluating tax burden as a critical factor in site selection for expansion or relocation. SITE SELECTION FACTORS Existing and Emerging Technologies Operating Costs (Labor, Power Costs & Tax
Burden) Business Climate and Regulatory Levels Site/Building Availability and Quality Utility Reliability and Quality Ease of Establishment/Operation Incentives One of the most significant points for a regional economic development approach is the positive impact it can have on reducing the handoffs between organizations associated with the economic development process and the ability to eliminate the concerns about various layers of “bureaucracy”. This suggests that survey respondents expect local government to be the drivers of improved economic conditions. The specific location factors prioritized by businesses differ depending on the situation, size of company, product/service industry, and age in terms of maturity; however, it is clear that government can and should play a key role in affecting these factors when appropriate and in the community’s best interest. While there are many variables that have little to do with whether or not government is organized in an efficient manner (i.e. site and building availability, market competitiveness, business continuity, and risk
management), there are many other variables that do have a direct relationship to whether or not local, regional, and state government are working cooperatively on a variety of fronts. In particular, tax burden, business climate, site quality, and availability of incentives are all factors that benefit positively from such efforts. Recent research completed by New Economy Strategies indicates that economic developers rated tax burden, cash incentives, and statutory incentives as more than 50 percent more important in Quarter 3 than in Quarter 2 of the previous year. Wisconsin is currently listed as #42 relative to Business Tax Climate (Tax Foundation, 2009). Delays in development translate into costs for business and, as such, any delay, whether perceived or real, can hamper a region’s economic growth. Survey respondents to the New Economy survey ranked local economic policies higher than state or federal policies, thus suggesting that local government will likely be relied upon to take the necessary actions to ensure that an effective economic development environment exists.
Shared revenue’s absence of incentives for efficiency, cooperation,
coordination, and performance metrics sends a message.
“
”Sheehy Task Force on State and Local Government, 2003
Incentives, tax burden, energy costs, and skilled workforce were the top responses by economic
developers as ‘more important’ in Quarter 3.
“
”New-Economy Strategies, Economic Developers Index, December 2009
THE CASE FOR CHANGE
Baker Tilly Virchow Krause, LLP / Local Government Institute PAGE 7
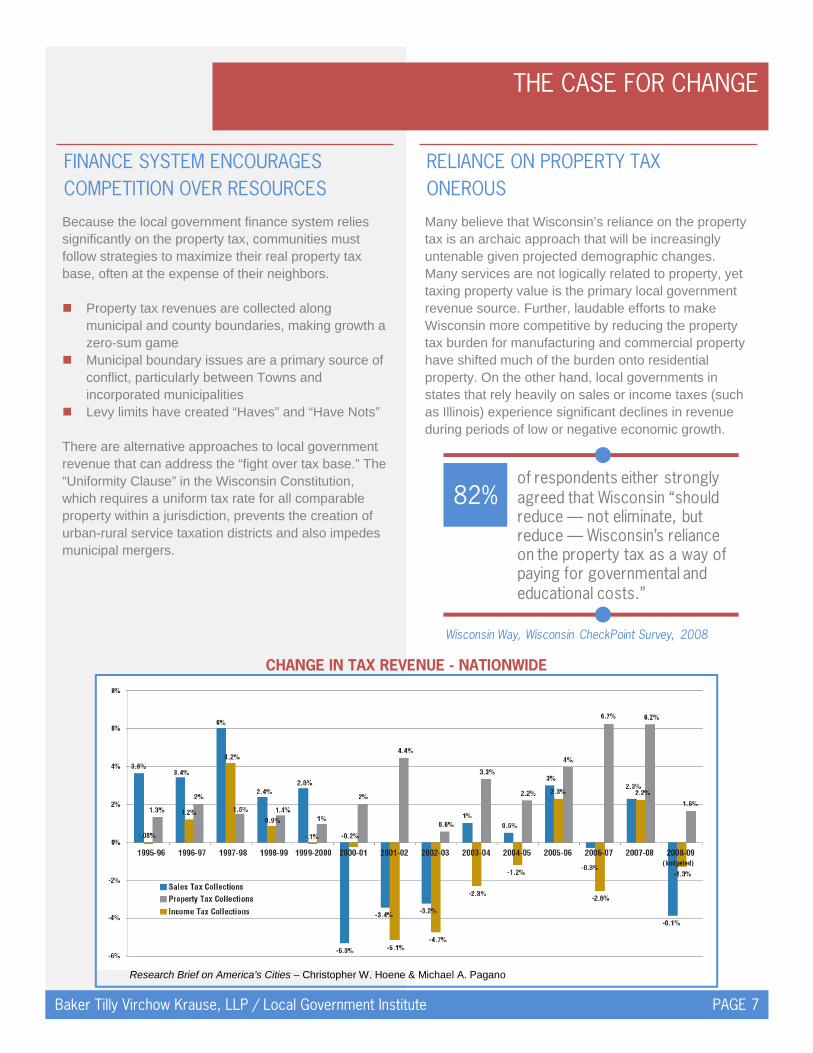
Research Brief on America’s Cities – Christopher W. Hoene & Michael A. Pagano
Because the local government finance system relies significantly on the property tax, communities must follow strategies to maximize their real property tax base, often at the expense of their neighbors. Property tax revenues are collected along
municipal and county boundaries, making growth a zero-sum game
Municipal boundary issues are a primary source of conflict, particularly between Towns and incorporated municipalities
Levy limits have created “Haves” and “Have Nots” There are alternative approaches to local government revenue that can address the “fight over tax base.” The “Uniformity Clause” in the Wisconsin Constitution, which requires a uniform tax rate for all comparable property within a jurisdiction, prevents the creation of urban-rural service taxation districts and also impedes municipal mergers.
Many believe that Wisconsin’s reliance on the property tax is an archaic approach that will be increasingly untenable given projected demographic changes. Many services are not logically related to property, yet taxing property value is the primary local government revenue source. Further, laudable efforts to make Wisconsin more competitive by reducing the property tax burden for manufacturing and commercial property have shifted much of the burden onto residential property. On the other hand, local governments in states that rely heavily on sales or income taxes (such as Illinois) experience significant declines in revenue during periods of low or negative economic growth.
RELIANCE ON PROPERTY TAX ONEROUS
CHANGE IN TAX REVENUE - NATIONWIDE
82%of respondents either strongly agreed that Wisconsin “should reduce — not eliminate, but reduce — Wisconsin’s reliance on the property tax as a way of paying for governmental and educational costs.”
Wisconsin Way, Wisconsin CheckPoint Survey, 2008
FINANCE SYSTEM ENCOURAGES COMPETITION OVER RESOURCES

THE CASE FOR CHANGE
Baker Tilly Virchow Krause, LLP / Local Government Institute PAGE 8
REVENUE SOURCE COUNTIES CITIES VILLAGES TOWNSTaxes 29.2% 28.5% 34.7% 43.9%
Intergovernmental Aid
Transportation Aid 1.8% 2.8% 3.2% 16.1%
Shared Revenue 2.2% 9.3% 5.4% 7.9%
Health and Human Services 20.1% 0.1% 0.0% 0.0%
All Other (inc. Direct Fed Aid) 5.6% 6.0% 3.0% 5.9%
Licenses and Permits 0.3% 1.4% 1.8% 2.6%
Fines and Foreitures 0.4% 0.8% 0.9% 0.5%
Public Charges for Services 20.3% 13.6% 14.7% 8.1%
Intergovernmental Charges 12.6% 6.2% 3.9% 0.7%
Long-term Debt 2.6% 9.5% 14.5% 6.6%
Interest Income 2.2% 3.6% 4.1% 3.9%
Utility Revenues 0.8% 15.0% 11.0% 1.6%
Other 1.9% 3.3% 2.9% 2.2%
TOTAL 100.0% 100.0% 100.0% 100.0%Source: Municipal and County Finance, WI Legislative Fiscal Bureau, 2009
Local governments in Wisconsin may only levy taxes that are specifically authorized by law, including: Property tax; Counties may levy sales and use tax of 0.5
percent; Municipalities and Counties may levy a “Wheel
Tax;” and Municipalities may levy a “Room Tax” on hotels,
resorts, and similar establishments. State law allows for the creation of special purpose districts that have the authority to levy property tax. Some specific types of special districts are allowed to levy taxes other than the property tax, such as Local Exposition Center Districts’ ability to levy a room tax, food and beverages taxes, and a car rental tax. While the State’s Municipal Aid Program (formerly known as shared revenue) represents a relatively small percentage of total local government revenues in comparison to taxes, total payments amounted to an estimated $915.9 million in 2009. The Legislative Fiscal Bureau estimates that County and Municipal Aid have fallen by 3.7% in absolute terms since 1999 on a statewide basis. The value of these payments have been further eroded by the effects of inflation. While inflation has been low in historical terms during this period, it has consistently ranged between 1.6% and 3.8% per year. Estimates of the value of a dollar suggest that a dollar of aid distributed in 2008 is worth $0.77 in 1999 terms.1
1 S Williamson, “Six Ways to Compute the Relative Value of a U.S. Dollar Amount, 1790 to present, Measuringworth, 2009
CURRENT REVENUE OPTIONS ARE
LIMITED
COUNTY AND MUNICIPAL AID IS FALLING
LOCAL GOVERNMENT REVENUE BY SOURCE2007, Percentage of Total Revenue
$876.3MILLION
in Shared Revenue payments were distributed by the State to local government in 2007.

IS THE ANSWER TO ELIMINATE LAYERS OF GOVERNMENT ?
Baker Tilly Virchow Krause, LLP / Local Government Institute PAGE 9
The number of local governments does not appear to be correlated with per-capita expenditures. A review of state and local expenditure data collected by the US Census Bureau suggests that factors other than the number of local government units may be more important in driving per capita expenditures. For example, there is very little difference in the
number of local governments in Wisconsin (2.0 per 1,000 residents) and Minnesota (1.5/1,000 residents), but there is a fairly significant difference in the level of expenditures (Minnesota expenditures are higher by $1,285 per capita).
Wisconsin appears to be near the average in both the number of local governments and local government expenditures per 1,000 population.
,THE NUMBER OF LOCAL GOVERNMENTS
It’s tempting to try to redraw governmental boundaries or, perhaps,
abolish an entire level of government… the problems of the information age do not need new
boundaries. Rather, they need innovative strategies to create
seamless government for Wisconsin’s citizens.
“
”KettlCommission, 2001
Oregon
$8,000
$7,000
$6,000
$5,000
$4,000
Minnesota
Montana
Illinois
WisconsinPennsylvania
New Hampshire
MichiganMissouri
Iowa
0 1 3 4 5
Relationship Between Number of Local Government Units andExpenditure per 1,000 population
2005
-200
6 Ex
pend
iture
s pe
r 1,
000
Popu
latio
n
More expenditures, fewer units of governments
Less expenditures, fewer units of governments
More expenditures, more units of governments
Less expenditures, more units of governments
Number of Local Governments per 1,000 Population
IS THE ANSWER TO ELIMINATE LAYERS OF GOVERNMENT ?
Baker Tilly Virchow Krause, LLP / Local Government Institute PAGE 10
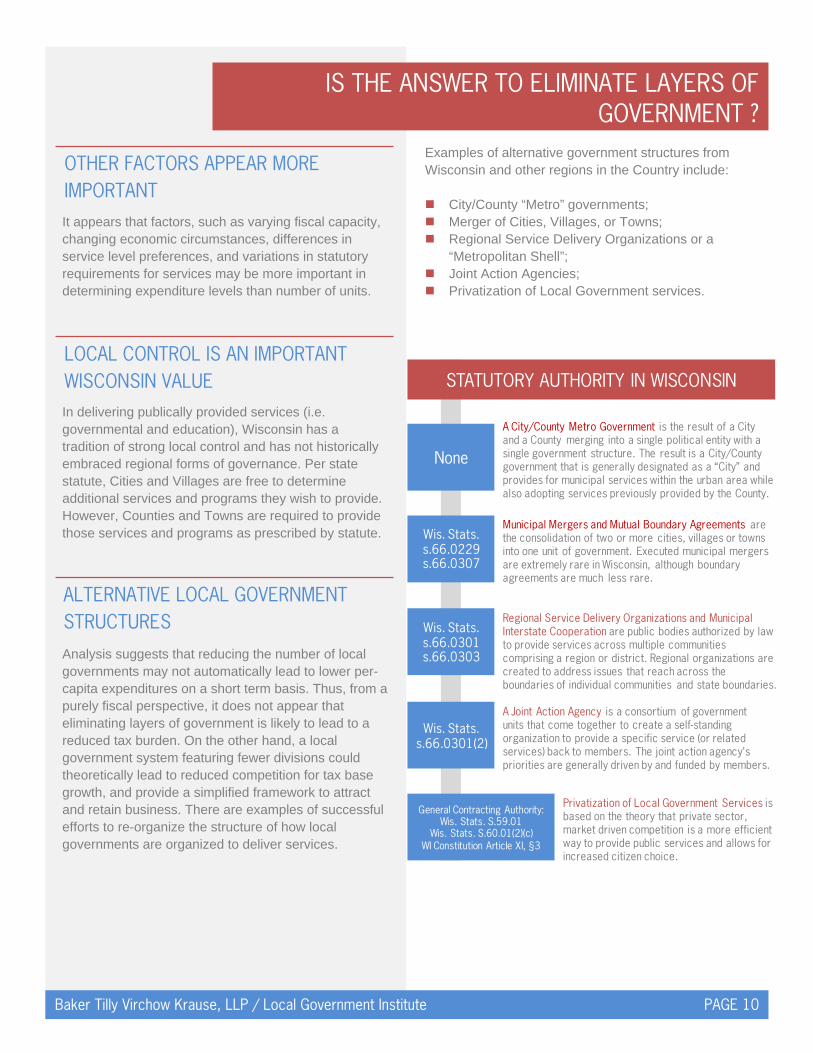
It appears that factors, such as varying fiscal capacity, changing economic circumstances, differences in service level preferences, and variations in statutory requirements for services may be more important in determining expenditure levels than number of units. In delivering publically provided services (i.e. governmental and education), Wisconsin has a tradition of strong local control and has not historically embraced regional forms of governance. Per state statute, Cities and Villages are free to determine additional services and programs they wish to provide. However, Counties and Towns are required to provide those services and programs as prescribed by statute. Analysis suggests that reducing the number of local governments may not automatically lead to lower per-capita expenditures on a short term basis. Thus, from a purely fiscal perspective, it does not appear that eliminating layers of government is likely to lead to a reduced tax burden. On the other hand, a local government system featuring fewer divisions could theoretically lead to reduced competition for tax base growth, and provide a simplified framework to attract and retain business. There are examples of successful efforts to re-organize the structure of how local governments are organized to deliver services.
Examples of alternative government structures from Wisconsin and other regions in the Country include: City/County “Metro” governments; Merger of Cities, Villages, or Towns; Regional Service Delivery Organizations or a
“Metropolitan Shell”; Joint Action Agencies; Privatization of Local Government services.
OTHER FACTORS APPEAR MORE IMPORTANT
LOCAL CONTROL IS AN IMPORTANT WISCONSIN VALUE
ALTERNATIVE LOCAL GOVERNMENT STRUCTURES
STATUTORY AUTHORITY IN WISCONSIN
None
A City/County Metro Government is the result of a City and a County merging into a single political entity with a single government structure. The result is a City/County government that is generally designated as a “City” and provides for municipal services within the urban area while also adopting services previously provided by the County.
Wis. Stats.s.66.0229s.66.0307
Municipal Mergers and Mutual Boundary Agreements are the consolidation of two or more cities, villages or towns into one unit of government. Executed municipal mergers are extremely rare in Wisconsin, although boundary agreements are much less rare.
Wis. Stats.s.66.0301s.66.0303
Regional Service Delivery Organizations and Municipal Interstate Cooperation are public bodies authorized by law to provide services across multiple communities comprising a region or district. Regional organizations are created to address issues that reach across the boundaries of individual communities and state boundaries.
Wis. Stats.s.66.0301(2)
A Joint Action Agency is a consortium of government units that come together to create a self-standing organization to provide a specific service (or related services) back to members. The joint action agency’s priorities are generally driven by and funded by members.
General Contracting Authority:Wis. Stats. S.59.01
Wis. Stats. S.60.01(2)(c)WI Constitution Article XI, §3
Privatization of Local Government Services is based on the theory that private sector, market driven competition is a more efficient way to provide public services and allows for increased citizen choice.
SHOULD WE FOCUS ON CHANGING STRUCTURE OR CHANGING RELATIONSHIPS?
Baker Tilly Virchow Krause, LLP / Local Government Institute PAGE 11
Previous reviews, particularly the Kettl Commission and the Sheehy Task Force, recommended that greater opportunities for efficiency are to be had through changing the relationships between local governments, rather than changing the fundamental structure of local governments. Based on the work in completing this project, it can be concluded that the key to improving local government service delivery efficiency is not likely to be found in structural mergers or annexations, or in eliminating layers of government. This research suggests that “Who” is ultimately accountable for delivering the service may be a less important question than “How” the service is delivered and “How Much” service is desired. Perhaps the only community in the state with appropriate geographic characteristics and population density to support a City/County Metro government in Wisconsin is in Milwaukee County. There are few other locations in the state where such a model would appear to be remotely feasible. Further, current efforts in southeastern Wisconsin to develop a regional approach to addressing regional issues, such as the Milwaukee Seven and the ongoing conversation regarding Southeast Wisconsin regional transit, may provide better results than attempting to redesign political structures in Milwaukee County.
Although Wisconsin Statutes provide authority for municipal mergers through consolidation, executed municipal mergers are extremely rare in Wisconsin. Only a few successful examples in Wisconsin have occurred in the past fifty years (Town of Preble/City of Green Bay and City/Town of Madison and City of Fitchburg/Town of Madison, not yet completed), excluding boundary and annexation agreements. A review of several case studies of failed mergers strongly suggests that Wisconsin’s Uniformity Clause was a major barrier from a financial impact standpoint. Past research by the University of Wisconsin-Madison’s Department of Agriculture and Applied Economics has documented the extensive use of contracting to provide certain types of local government services. Many local governments regularly review their service offerings to determine whether it is more cost effective to outsource.
“HOW” SERVICES ARE DELIVERED IS MORE IMPORTANT THAN “WHO”
CITY/COUNTY METRO GOVERNMENT APPLICABILITY LIMITED
TRACK RECORD OF MUNICIPAL MERGER FAILURES IN WISCONSIN
PRIVATIZATION ALREADY EXTENSIVELY USED
Local governments should create functional service delivery lines without regard to their political
boundaries.
“”
Sheehy Task Force on State and Local Government, 2003
SHOULD WE FOCUS ON CHANGING STRUCTURE OR CHANGING RELATIONSHIPS?
Baker Tilly Virchow Krause, LLP / Local Government Institute PAGE 12
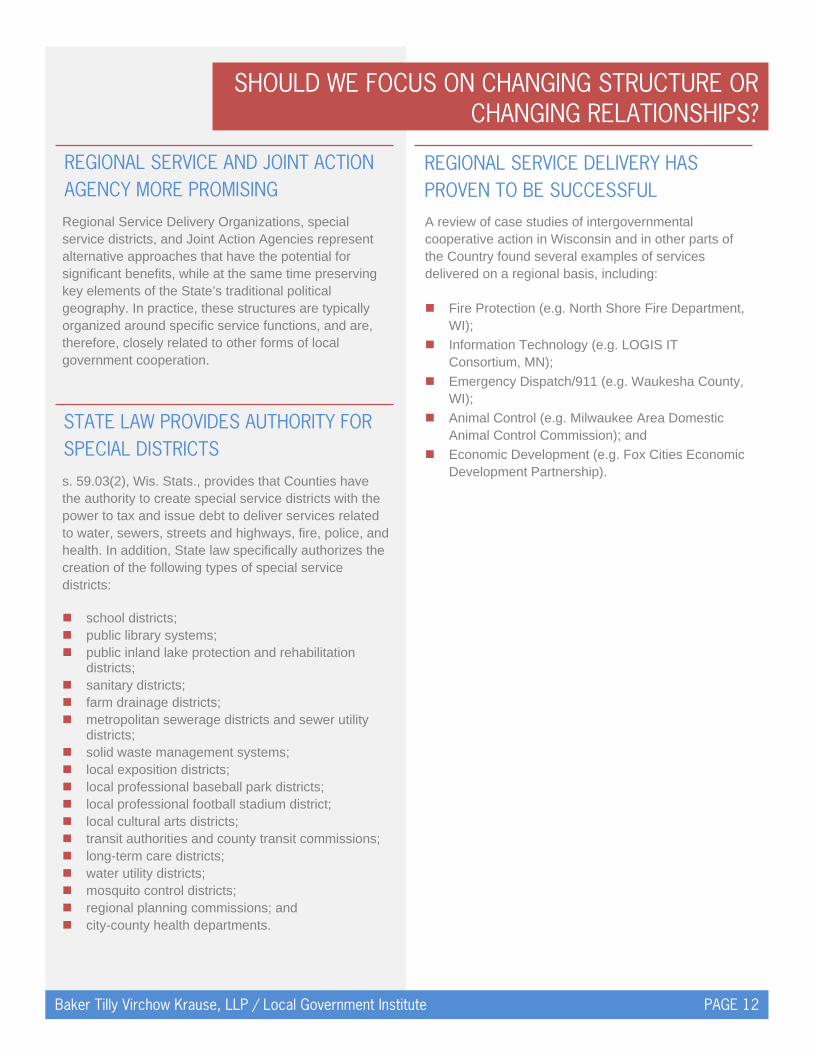
Regional Service Delivery Organizations, special service districts, and Joint Action Agencies represent alternative approaches that have the potential for significant benefits, while at the same time preserving key elements of the State’s traditional political geography. In practice, these structures are typically organized around specific service functions, and are, therefore, closely related to other forms of local government cooperation. s. 59.03(2), Wis. Stats., provides that Counties have the authority to create special service districts with the power to tax and issue debt to deliver services related to water, sewers, streets and highways, fire, police, and health. In addition, State law specifically authorizes the creation of the following types of special service districts: school districts; public library systems; public inland lake protection and rehabilitation
districts; sanitary districts; farm drainage districts; metropolitan sewerage districts and sewer utility
districts; solid waste management systems; local exposition districts; local professional baseball park districts; local professional football stadium district; local cultural arts districts; transit authorities and county transit commissions; long-term care districts; water utility districts; mosquito control districts; regional planning commissions; and city-county health departments.
A review of case studies of intergovernmental cooperative action in Wisconsin and in other parts of the Country found several examples of services delivered on a regional basis, including: Fire Protection (e.g. North Shore Fire Department,
WI);
Information Technology (e.g. LOGIS IT Consortium, MN);
Emergency Dispatch/911 (e.g. Waukesha County, WI);
Animal Control (e.g. Milwaukee Area Domestic Animal Control Commission); and
Economic Development (e.g. Fox Cities Economic Development Partnership).
REGIONAL SERVICE AND JOINT ACTION AGENCY MORE PROMISING
STATE LAW PROVIDES AUTHORITY FOR SPECIAL DISTRICTS
REGIONAL SERVICE DELIVERY HAS PROVEN TO BE SUCCESSFUL

SHOULDN’T LOCAL GOVERNMENT COOPERATE TO GAIN EFFICIENCIES?
Baker Tilly Virchow Krause, LLP / Local Government Institute PAGE 13
Local government in Wisconsin has a long tradition of cooperation with their neighbors. In rural areas with low population densities,
cooperation often occurs out of necessity. In many urban areas, there is a widespread
recognition that there are fiscal and service delivery advantages to cooperation.
Compliance with state requirements, such as NR 151, can often serve as the impetus for cooperation.
State law provide broad statutory authority for local governments to cooperate.
Cooperation takes many forms, ranging from mutual aid agreements, shared programs or equipment, joint purchasing, shared services through contracting arrangements, joint departments, and independent “Metro” departments. Mutual aid agreements are very widespread, and involve the least level of difficulty and lowest required investment to engage in. Shared services through contracting arrangements are relatively common, most typically seen in contract arrangements for Highways and law enforcement between Counties and Towns. Establishing an independent “Metro” service delivery organization offers the greatest potential for eliminating duplicative service delivery, but also is the most difficult to implement and also typically requires the largest amount of up-front investment.
HISTORY OF INTERGOVERNMENTAL COOPERATION
COOPERATION TAKES MANY FORMS
837Fire Departments serve 1,851 municipalities in Wisconsin, suggesting extensive cooperation in this service.
91%of local government officials responding to the Local Government Institute’s Fall 2009 survey indicated that their community currently has cooperative efforts with other local governments in at least one of the identified services.
LEVEL OF DIFFICULTY AND REQUIRED INVESTMENT
Intergovernmental Cooperation Continuum
Mutual Aid
Shared Programs or Equipment
Joint Purchasing
Shared Services thru Contract
Shared Facilities
Joint Departments
Independent “Metro”
Examples:Multi-jurisdictional
SWAT teams, Federal Byrne grant drug task
forces
Examples:Contracting for Road
Maintenance services from the County HWY
Department
Examples:Fredonia Town/
Village Hall
Examples:North Shore Fire
Department, MMSD
Examples:City/Town of
Pewaukee Park & Recreation
Department, Milton Joint fire Department,
Everest Metro PD
Examples:MABAS (Mutual Aid Box Alarm
Systems
Examples:Village of Plover / City of Stevens
Point Aerial Ladder Truck Purchase
Adapted from J. Ruggini, “Intergovernmental Service Sharing”, Government Finance Officers Association, 2007
SHOULDN’T LOCAL GOVERNMENT COOPERATE TO GAIN EFFICIENCIES?
Baker Tilly Virchow Krause, LLP / Local Government Institute PAGE 14
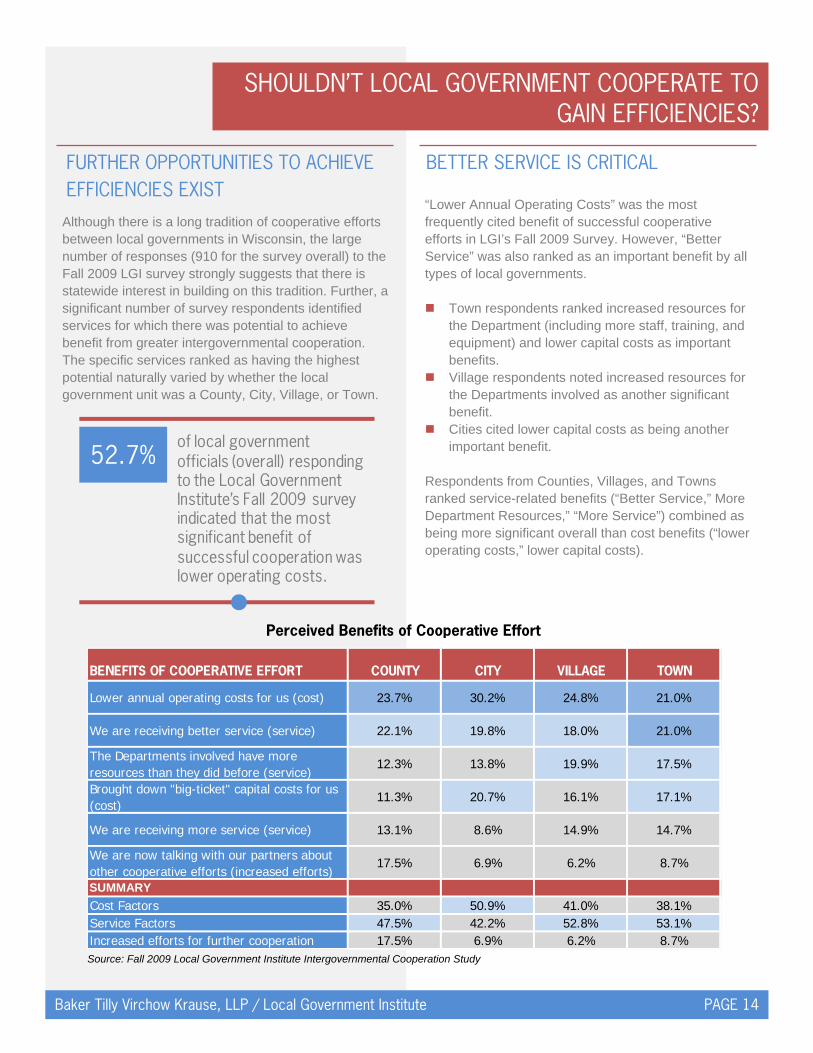
Although there is a long tradition of cooperative efforts between local governments in Wisconsin, the large number of responses (910 for the survey overall) to the Fall 2009 LGI survey strongly suggests that there is statewide interest in building on this tradition. Further, a significant number of survey respondents identified services for which there was potential to achieve benefit from greater intergovernmental cooperation. The specific services ranked as having the highest potential naturally varied by whether the local government unit was a County, City, Village, or Town.
“Lower Annual Operating Costs” was the most frequently cited benefit of successful cooperative efforts in LGI’s Fall 2009 Survey. However, “Better Service” was also ranked as an important benefit by all types of local governments. Town respondents ranked increased resources for
the Department (including more staff, training, and equipment) and lower capital costs as important benefits.
Village respondents noted increased resources for the Departments involved as another significant benefit.
Cities cited lower capital costs as being another important benefit.
Respondents from Counties, Villages, and Towns ranked service-related benefits (“Better Service,” More Department Resources,” “More Service”) combined as being more significant overall than cost benefits (“lower operating costs,” lower capital costs).
FURTHER OPPORTUNITIES TO ACHIEVE EFFICIENCIES EXIST
BETTER SERVICE IS CRITICAL
52.7%of local government officials (overall) responding to the Local Government Institute’s Fall 2009 survey indicated that the most significant benefit of successful cooperation was lower operating costs.
Source: Fall 2009 Local Government Institute Intergovernmental Cooperation Study
BENEFITS OF COOPERATIVE EFFORT COUNTY CITY VILLAGE TOWN
Lower annual operating costs for us (cost) 23.7% 30.2% 24.8% 21.0%
We are receiving better service (service) 22.1% 19.8% 18.0% 21.0%
The Departments involved have more resources than they did before (service)
12.3% 13.8% 19.9% 17.5%
Brought down "big-ticket" capital costs for us (cost)
11.3% 20.7% 16.1% 17.1%
We are receiving more service (service) 13.1% 8.6% 14.9% 14.7%
We are now talking with our partners about other cooperative efforts (increased efforts)
17.5% 6.9% 6.2% 8.7%
Cost Factors 35.0% 50.9% 41.0% 38.1%Service Factors 47.5% 42.2% 52.8% 53.1%Increased efforts for further cooperation 17.5% 6.9% 6.2% 8.7%
Perceived Benefits of Cooperative Effort
SUMMARY

SHOULDN’T LOCAL GOVERNMENT COOPERATE TO GAIN EFFICIENCIES?
Baker Tilly Virchow Krause, LLP / Local Government Institute PAGE 15
Reductions in municipal expenditures, in terms of significantly decreased annual operating costs, are not the most commonly-seen fiscal impact of functional service consolidation and other cooperative actions. This conclusion is based on research into specific case studies of services that are proven to be delivered more efficiently through cooperative local government action. Rather, an analysis of local government expenditure data from the WI Department of Revenue, and of information collected directly from the case studies, suggested that positive fiscal impacts are more commonly seen in the following two general ways: Significant savings are achieved through avoided
capital costs over the medium and long term. This appears to primarily be due to the fact that, under consolidated service delivery, partners can spread capital costs over a larger tax base, thereby reducing the per-capita cost of buildings, equipment, vehicles, and systems. Further, in some cases, consolidated Departments are able to eliminate duplicate equipment that would ordinarily have been replaced.
Reduced annual rates of increase in
expenditures. In several case studies, it was noted that a significant reduction (in some cases as much as by half) in the rate at which costs had historically been increasing. One possible explanation of why this may occur is that under consolidated service delivery, there is a powerful incentive to control costs in order to maintain the value proposition for the partners. Local governments in Wisconsin are very cost conscious about maintaining control over their own budgets. However, in the case of a consolidated or joint Department, there are multiple sets of eyes reviewing operating costs.
FOR EXAMPLE Due to their participation in the Fire Protection
Cooperation Agreement with the Village of Whiting, the Village of Plover will be able to avoid $585,000 in total apparatus replacement capital costs over the next three years because both communities now share each other’s equipment and vehicles;
The creation of the North Shore Fire Department resulted in the elimination of two aerial ladder trucks from the combined inventories of the seven participating municipalities, representing an estimated $1.6 million in avoided capital replacement costs;
Cost avoidance estimates completed for the LOGIS IT consortium in Minnesota suggests that a large municipality LOGIS participant would incur at least ten times the cost to procure a typical ERP system individually. Large municipalities typically pay roughly $48,500 for an HR/Payroll/Finance software implementation project received through the consortium. The same municipality might face costs ranging from $625,000 on the low end, up to $3.8 million on the high end, from a non-LOGIS vendor for software and implementation (based on costs in 2007);
Combined capital savings are estimated to be as much as $35 million over twenty-five years under the Brown-Outagamie-Winnebago Solid Waste Partnership, largely due to avoiding costs associated with maintaining and developing duplicative new landfill sites in each County; and
In the five years prior to the creation of the Everest Metro Police Department in 1992, expenditures for Law Enforcement services in the city of Schofield increased by a total of 59.0 percent and by 16.6 percent in the Town of Weston. In a comparable period after the Metro Department was created, costs increased by 23.3 percent for Schofield and by 8.2 percent for the Town.
ASSESSING THE IMPACT OF COOPERATIVE ACTION ON MUNICIPAL EXPENDITURES

SHOULDN’T LOCAL GOVERNMENT COOPERATE TO GAIN EFFICIENCIES?
Baker Tilly Virchow Krause, LLP / Local Government Institute PAGE 16
This is not to suggest that local governments implementing a consolidation will never reduce their operating costs; far from it. This effort also found case study examples where consolidations resulted in an absolute decrease in annual operating expenditures. However, local factors vary significantly, on a case by case basis, related to service delivery expectations and service levels, current per capita expenditures, and capital replacement needs. Further, service types vary in the extent to which consolidation provides the opportunity for reduced operating costs. Thus, it is impossible to categorically assert that consolidated service delivery will automatically result in lower annual operating costs in every case. Nevertheless: The total cost to operate a single County-wide joint
Dispatch Center in Waukesha County was $2.7 million lower on an annual basis than the combined operating cost for the ten dispatch centers in operation prior to the consolidation. The City of Brookfield, for example, has been able to eliminate an estimated $525,000 annually from their municipal budget because they partnered with the County, with no increase in the County property tax levy; and
The total cost to operate a merged County-wide Public Health Department in Rock County was an estimated $307,500 lower on an annual basis than had been the case when both the County and the City of Beloit operated independent Departments.
Under the new Maintenance of Effort for emergency services clause of the state budget signed this year, starting in 2010, municipalities and counties risk reductions in shared revenue from the state if they reduce operational expenditures for emergency services below 2009 levels. Specifically, the law requires the approval of the Department of Revenue to make any decrease in operating expenditures. The provision reads: A county or municipality may decrease the amount it spends for emergency services below its 2009 amount, with the department of revenue's approval, if the decrease in expenditures is a result of operating more efficiently, as determined by the department. The articulated intent of the provision is to ensure that service levels are maintained and that public safety is not impacted negatively by reductions in municipal labor expenditures.
IN SOME CIRCUMSTANCES, ABSOLUTE REDUCTION IN OPERATING COST IS FEASIBLE
CERTAIN RESTRICTIONS ON INCREASING COST EFFICIENCIES
WHERE ARE THE OPPORTUNITIES?
Baker Tilly Virchow Krause, LLP / Local Government Institute PAGE 17
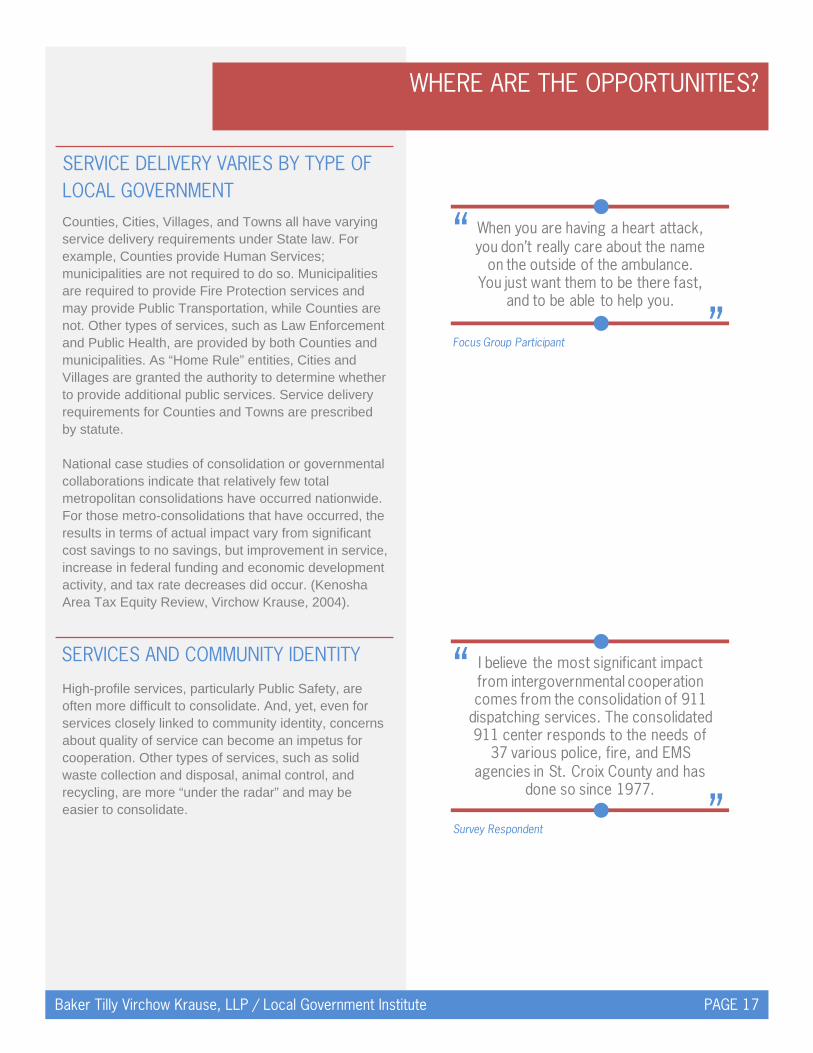
Counties, Cities, Villages, and Towns all have varying service delivery requirements under State law. For example, Counties provide Human Services; municipalities are not required to do so. Municipalities are required to provide Fire Protection services and may provide Public Transportation, while Counties are not. Other types of services, such as Law Enforcement and Public Health, are provided by both Counties and municipalities. As “Home Rule” entities, Cities and Villages are granted the authority to determine whether to provide additional public services. Service delivery requirements for Counties and Towns are prescribed by statute. National case studies of consolidation or governmental collaborations indicate that relatively few total metropolitan consolidations have occurred nationwide. For those metro-consolidations that have occurred, the results in terms of actual impact vary from significant cost savings to no savings, but improvement in service, increase in federal funding and economic development activity, and tax rate decreases did occur. (Kenosha Area Tax Equity Review, Virchow Krause, 2004). High-profile services, particularly Public Safety, are often more difficult to consolidate. And, yet, even for services closely linked to community identity, concerns about quality of service can become an impetus for cooperation. Other types of services, such as solid waste collection and disposal, animal control, and recycling, are more “under the radar” and may be easier to consolidate.
SERVICE DELIVERY VARIES BY TYPE OF LOCAL GOVERNMENT
SERVICES AND COMMUNITY IDENTITY
When you are having a heart attack, you don’t really care about the name
on the outside of the ambulance. You just want them to be there fast,
and to be able to help you.
“
”Focus Group Participant
I believe the most significant impact from intergovernmental cooperation comes from the consolidation of 911
dispatching services. The consolidated 911 center responds to the needs of
37 various police, fire, and EMS agencies in St. Croix County and has
done so since 1977.
“
”Survey Respondent
WHERE ARE THE OPPORTUNITIES?
Baker Tilly Virchow Krause, LLP / Local Government Institute PAGE 18
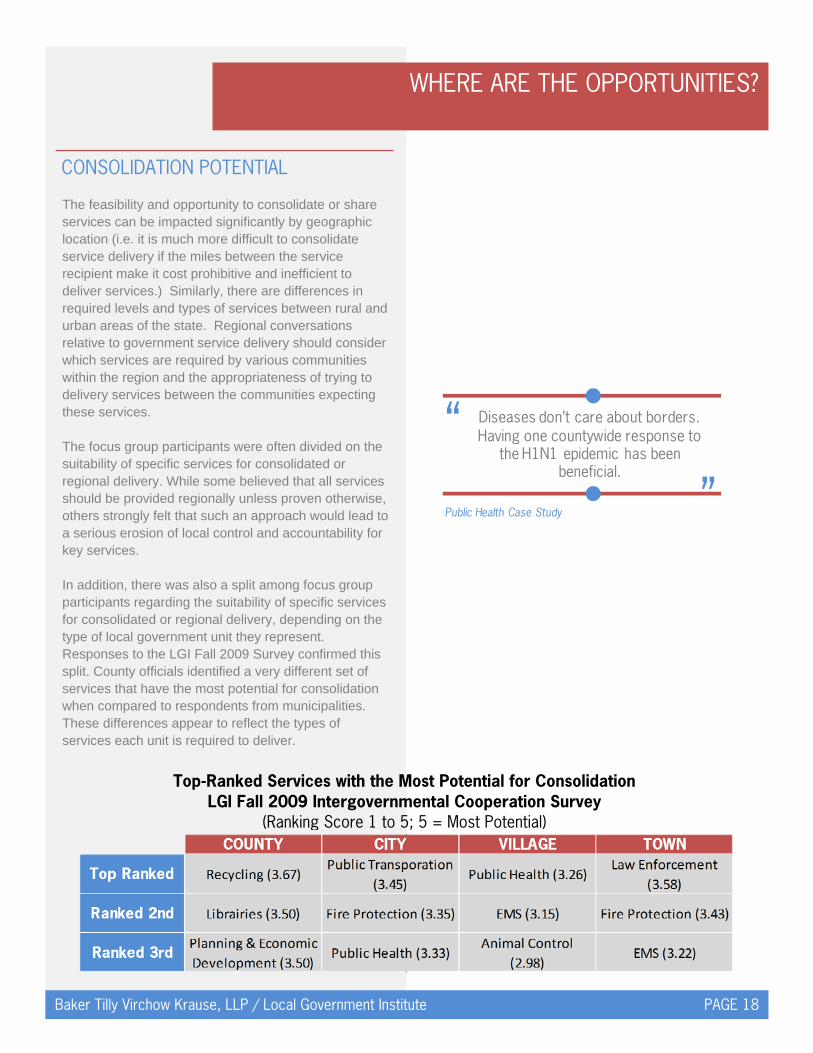
The feasibility and opportunity to consolidate or share services can be impacted significantly by geographic location (i.e. it is much more difficult to consolidate service delivery if the miles between the service recipient make it cost prohibitive and inefficient to deliver services.) Similarly, there are differences in required levels and types of services between rural and urban areas of the state. Regional conversations relative to government service delivery should consider which services are required by various communities within the region and the appropriateness of trying to delivery services between the communities expecting these services. The focus group participants were often divided on the suitability of specific services for consolidated or regional delivery. While some believed that all services should be provided regionally unless proven otherwise, others strongly felt that such an approach would lead to a serious erosion of local control and accountability for key services. In addition, there was also a split among focus group participants regarding the suitability of specific services for consolidated or regional delivery, depending on the type of local government unit they represent. Responses to the LGI Fall 2009 Survey confirmed this split. County officials identified a very different set of services that have the most potential for consolidation when compared to respondents from municipalities. These differences appear to reflect the types of services each unit is required to deliver.
CONSOLIDATION POTENTIAL
Diseases don’t care about borders. Having one countywide response to
the H1N1 epidemic has been beneficial.
“
”Public Health Case Study
Top-Ranked Services with the Most Potential for Consolidation LGI Fall 2009 Intergovernmental Cooperation Survey
(Ranking Score 1 to 5; 5 = Most Potential)
WHERE ARE THE OPPORTUNITIES?
Baker Tilly Virchow Krause, LLP / Local Government Institute PAGE 19
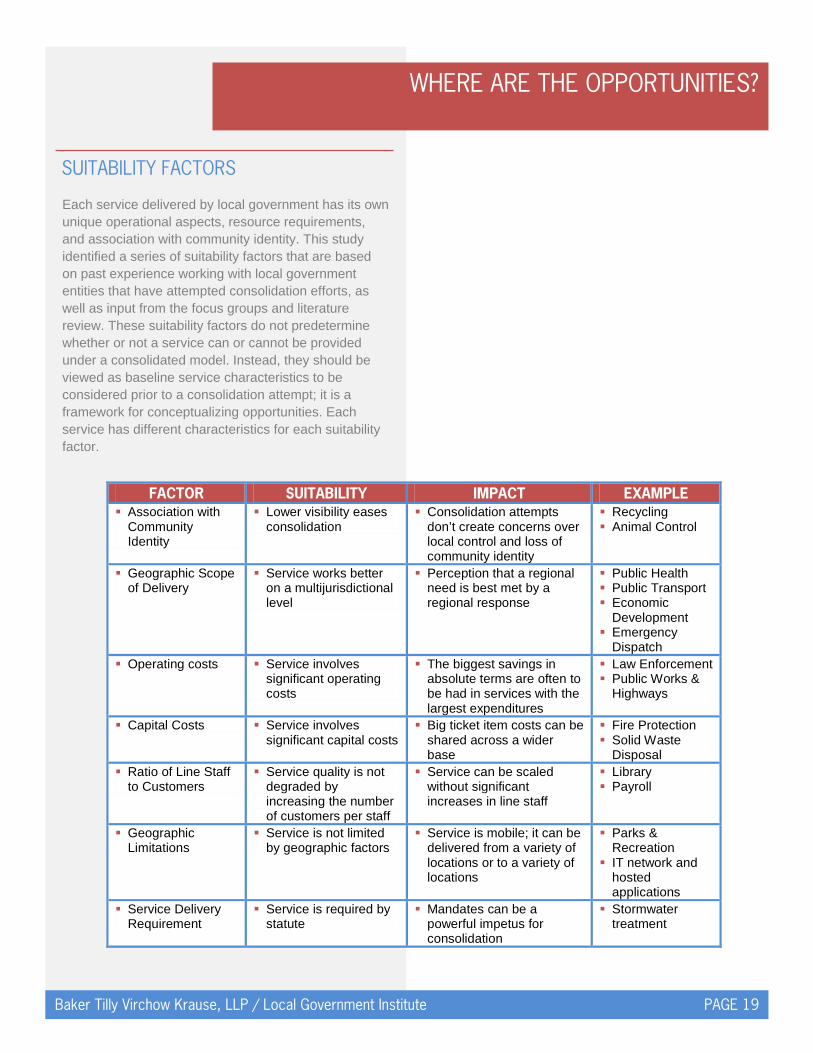
Each service delivered by local government has its own unique operational aspects, resource requirements, and association with community identity. This study identified a series of suitability factors that are based on past experience working with local government entities that have attempted consolidation efforts, as well as input from the focus groups and literature review. These suitability factors do not predetermine whether or not a service can or cannot be provided under a consolidated model. Instead, they should be viewed as baseline service characteristics to be considered prior to a consolidation attempt; it is a framework for conceptualizing opportunities. Each service has different characteristics for each suitability factor.
SUITABILITY FACTORS
FACTOR SUITABILITY IMPACT EXAMPLE Association with
Community Identity
Lower visibility eases consolidation
Consolidation attempts don’t create concerns over local control and loss of community identity
Recycling Animal Control
Geographic Scope of Delivery
Service works better on a multijurisdictional level
Perception that a regional need is best met by a regional response
Public Health Public Transport Economic
Development Emergency
Dispatch Operating costs Service involves
significant operating costs
The biggest savings in absolute terms are often to be had in services with the largest expenditures
Law Enforcement Public Works &
Highways
Capital Costs Service involves significant capital costs
Big ticket item costs can be shared across a wider base
Fire Protection Solid Waste
Disposal Ratio of Line Staff
to Customers Service quality is not
degraded by increasing the number of customers per staff
Service can be scaled without significant increases in line staff
Library Payroll
Geographic Limitations
Service is not limited by geographic factors
Service is mobile; it can be delivered from a variety of locations or to a variety of locations
Parks & Recreation
IT network and hosted applications
Service Delivery Requirement
Service is required by statute
Mandates can be a powerful impetus for consolidation
Stormwater treatment

WHAT IS REQUIRED TO INCREASE INTERGOVERNMENTAL COOPERATION?
Baker Tilly Virchow Krause, LLP / Local Government Institute PAGE 20
Having identified services that have potential for a consolidated or regional approach, and discussed suitability factors that need to be considered, the fact remains that each community must make its own determination as to whether or not to embark on new cooperative efforts. For those that do, the question is how to get there? This research suggests that there are six primary success factors underlying all successful intergovernmental cooperation. Themes were assessed comparing research studies, national case studies, and the LGI survey and focus groups. Respondents to the survey reported that there is an hierarchy among these factors, with service and cost concerns being uppermost. However, Focus Group participants emphasized that these two factors are necessary, but not sufficient, to achieve greater intergovernmental cooperation. These success factors and related issues include:
POSITIVE IMPACT ON SERVICES CLEAR FISCAL BENEFIT Cooperation allows communities to critically
examine service delivery needs. While short term costs may be required to invest in
a new cooperative venture, long term benefits can be significant.
Consolidated operations create greater capacity for service delivery through increased resource levels.
Fiscal benefits can be greatest where there are significant capital expenditures because of the opportunity to spread these costs over a larger base of residents.
Service gaps and distortions can be addressed through a cooperative approach.
While some counter examples exist, few case studies suggest that service expenditures will fall in absolute terms: benefits largely involve avoided costs.
TRUST LEADERSHIP Positive working relationships between officials
make discussions about new cooperative efforts easier.
Leadership involves taking the first step and beginning the discussion with partners.
Trust between officials, particularly between Towns and larger Cities, is often complicated by border conflicts.
Leadership also means being willing to move beyond “turf” and job protection issues.
Shared perception of equal partnership is vital. Careful attention must be given to the details of accountability, governance, and decision making to ensure that local control is respected
Full commitment of officials to objectively explore a new cooperative effort is vital.
COMMUNITY SUPPORT SHARED PERCEPTION OF NEED Involvement of business community and
economic development entities can be a powerful method of increasing community support. Reducing the marginal cost of doing business benefits the entire community.
A shared acknowledgement that the partners are in a shared moment of crisis or opportunity creates impetus for partners to come together.
Some services are “under the radar” and don’t result in significant public concern that local control will be lost.
While some opportunities and crisis events are unique to each circumstance, others are driven by new service delivery requirements or mandates.
Knowing the facts, staying on message, and responding to the concerns of opponents are all vital to building community support.
A desire by all partners to achieve a comparable level of services under a new cooperative effort is critical.
You can really get a lot done if you don’t care who gets the credit.“
”Focus Group Participant
WHAT IS REQUIRED TO INCREASE INTERGOVERNMENTAL COOPERATION?
Baker Tilly Virchow Krause, LLP / Local Government Institute PAGE 21
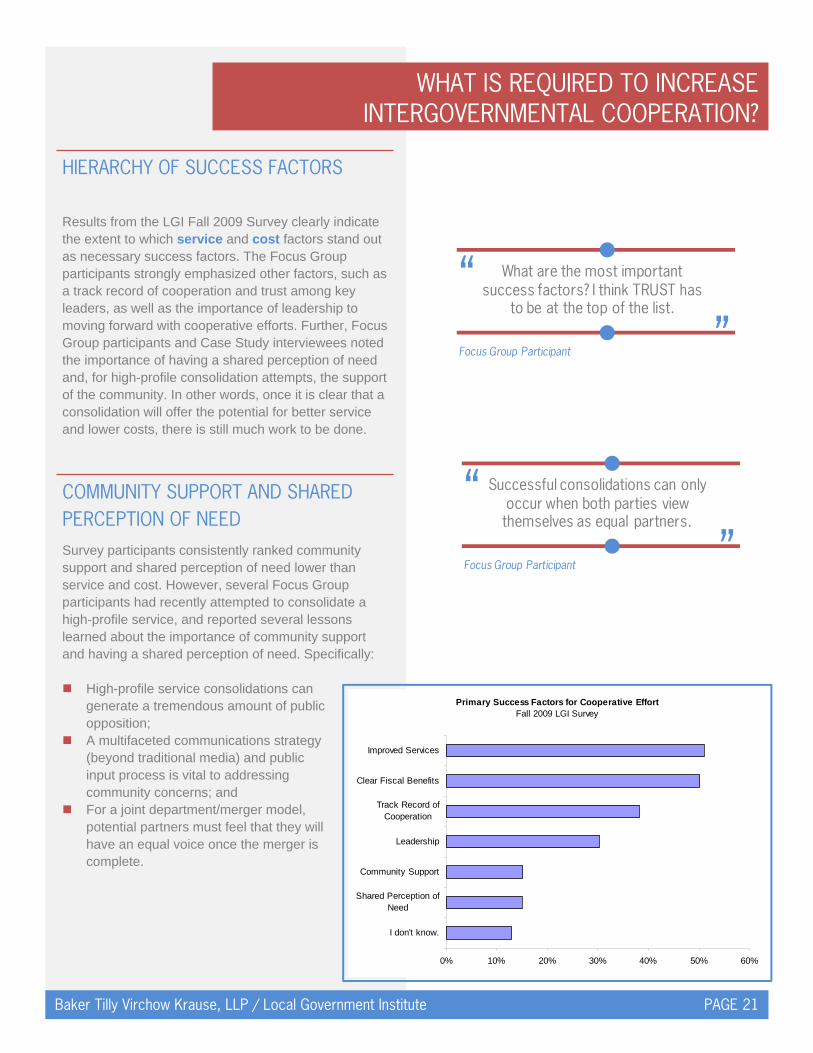
Primary Success Factors for Cooperative EffortFall 2009 LGI Survey
0% 10% 20% 30% 40% 50% 60%
I don't know.
Shared Perception ofNeed
Community Support
Leadership
Track Record ofCooperation
Clear Fiscal Benefits
Improved Services
Results from the LGI Fall 2009 Survey clearly indicate the extent to which service and cost factors stand out as necessary success factors. The Focus Group participants strongly emphasized other factors, such as a track record of cooperation and trust among key leaders, as well as the importance of leadership to moving forward with cooperative efforts. Further, Focus Group participants and Case Study interviewees noted the importance of having a shared perception of need and, for high-profile consolidation attempts, the support of the community. In other words, once it is clear that a consolidation will offer the potential for better service and lower costs, there is still much work to be done. Survey participants consistently ranked community support and shared perception of need lower than service and cost. However, several Focus Group participants had recently attempted to consolidate a high-profile service, and reported several lessons learned about the importance of community support and having a shared perception of need. Specifically: High-profile service consolidations can
generate a tremendous amount of public opposition;
A multifaceted communications strategy (beyond traditional media) and public input process is vital to addressing community concerns; and
For a joint department/merger model, potential partners must feel that they will have an equal voice once the merger is complete.
HIERARCHY OF SUCCESS FACTORS
COMMUNITY SUPPORT AND SHARED PERCEPTION OF NEED
Successful consolidations can only occur when both parties view themselves as equal partners.
“”Focus Group Participant
What are the most important success factors? I think TRUST has
to be at the top of the list.“
”Focus Group Participant
SUCCESS FACTOR: IMPROVED SERVICES
Baker Tilly Virchow Krause, LLP / Local Government Institute PAGE 22
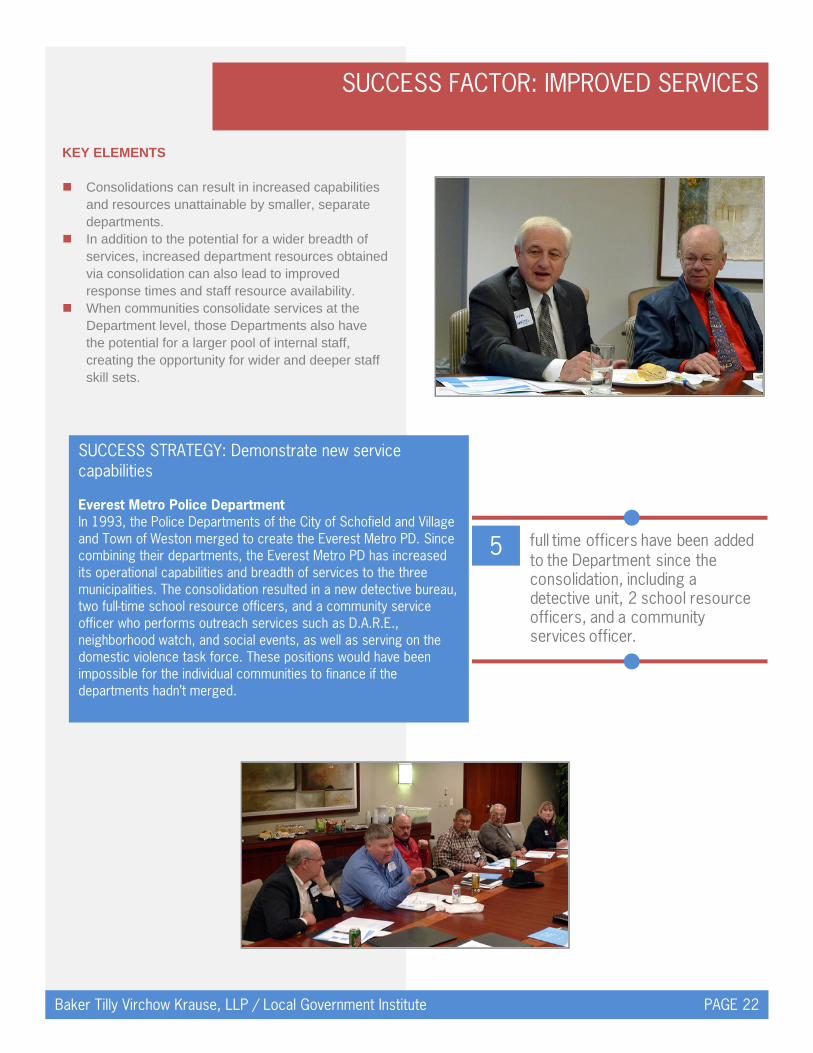
KEY ELEMENTS Consolidations can result in increased capabilities
and resources unattainable by smaller, separate departments.
In addition to the potential for a wider breadth of services, increased department resources obtained via consolidation can also lead to improved response times and staff resource availability.
When communities consolidate services at the Department level, those Departments also have the potential for a larger pool of internal staff, creating the opportunity for wider and deeper staff skill sets.
5 full time officers have been added to the Department since the consolidation, including a detective unit, 2 school resource officers, and a community services officer.
SUCCESS STRATEGY: Demonstrate new service capabilities Everest Metro Police Department In 1993, the Police Departments of the City of Schofield and Village and Town of Weston merged to create the Everest Metro PD. Since combining their departments, the Everest Metro PD has increased its operational capabilities and breadth of services to the three municipalities. The consolidation resulted in a new detective bureau, two full-time school resource officers, and a community service officer who performs outreach services such as D.A.R.E., neighborhood watch, and social events, as well as serving on the domestic violence task force. These positions would have been impossible for the individual communities to finance if the departments hadn’t merged.
SUCCESS FACTOR: IMPROVED SERVICES
Baker Tilly Virchow Krause, LLP / Local Government Institute PAGE 23
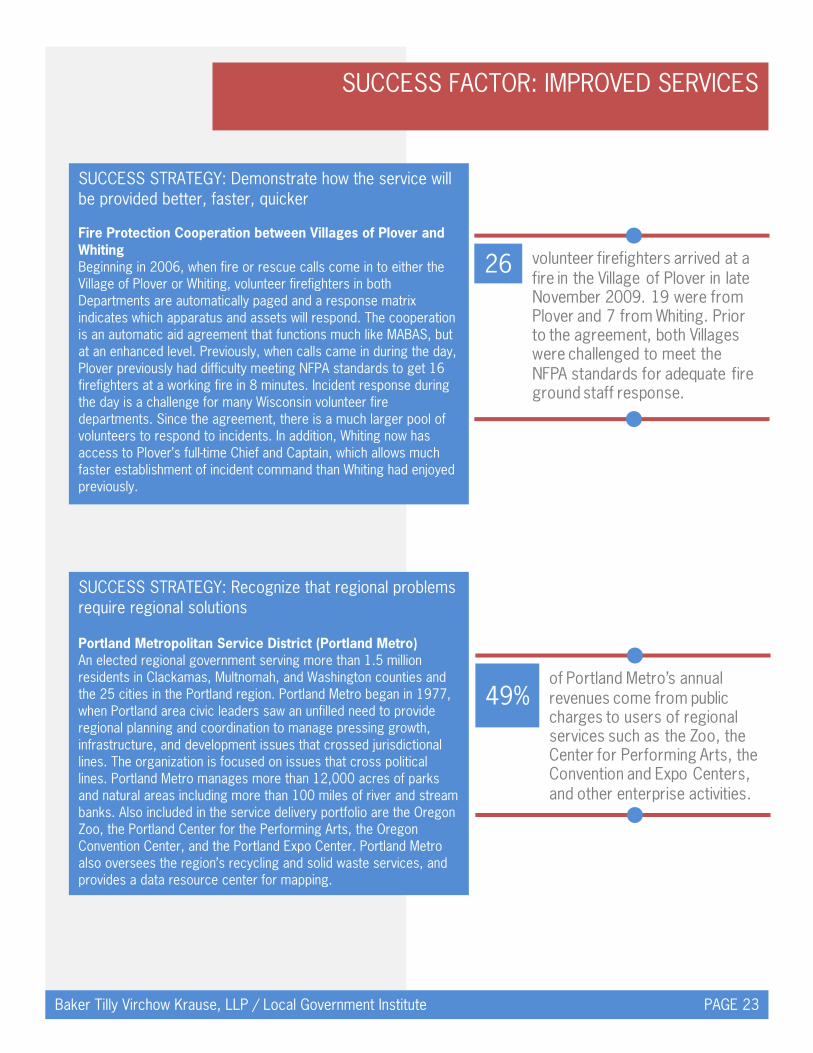
SUCCESS STRATEGY: Demonstrate how the service will be provided better, faster, quicker Fire Protection Cooperation between Villages of Plover and Whiting Beginning in 2006, when fire or rescue calls come in to either the Village of Plover or Whiting, volunteer firefighters in both Departments are automatically paged and a response matrix indicates which apparatus and assets will respond. The cooperation is an automatic aid agreement that functions much like MABAS, but at an enhanced level. Previously, when calls came in during the day, Plover previously had difficulty meeting NFPA standards to get 16 firefighters at a working fire in 8 minutes. Incident response during the day is a challenge for many Wisconsin volunteer fire departments. Since the agreement, there is a much larger pool of volunteers to respond to incidents. In addition, Whiting now has access to Plover’s full-time Chief and Captain, which allows much faster establishment of incident command than Whiting had enjoyed previously.
26 volunteer firefighters arrived at a fire in the Village of Plover in late November 2009. 19 were from Plover and 7 from Whiting. Prior to the agreement, both Villages were challenged to meet the NFPA standards for adequate fire ground staff response.
49%of Portland Metro’s annual revenues come from public charges to users of regional services such as the Zoo, the Center for Performing Arts, the Convention and Expo Centers, and other enterprise activities.
SUCCESS STRATEGY: Recognize that regional problems require regional solutions Portland Metropolitan Service District (Portland Metro) An elected regional government serving more than 1.5 million residents in Clackamas, Multnomah, and Washington counties and the 25 cities in the Portland region. Portland Metro began in 1977, when Portland area civic leaders saw an unfilled need to provide regional planning and coordination to manage pressing growth, infrastructure, and development issues that crossed jurisdictional lines. The organization is focused on issues that cross political lines. Portland Metro manages more than 12,000 acres of parks and natural areas including more than 100 miles of river and stream banks. Also included in the service delivery portfolio are the Oregon Zoo, the Portland Center for the Performing Arts, the Oregon Convention Center, and the Portland Expo Center. Portland Metro also oversees the region’s recycling and solid waste services, and provides a data resource center for mapping.
SUCCESS FACTOR: CLEAR FISCAL BENEFIT
Baker Tilly Virchow Krause, LLP / Local Government Institute PAGE 24
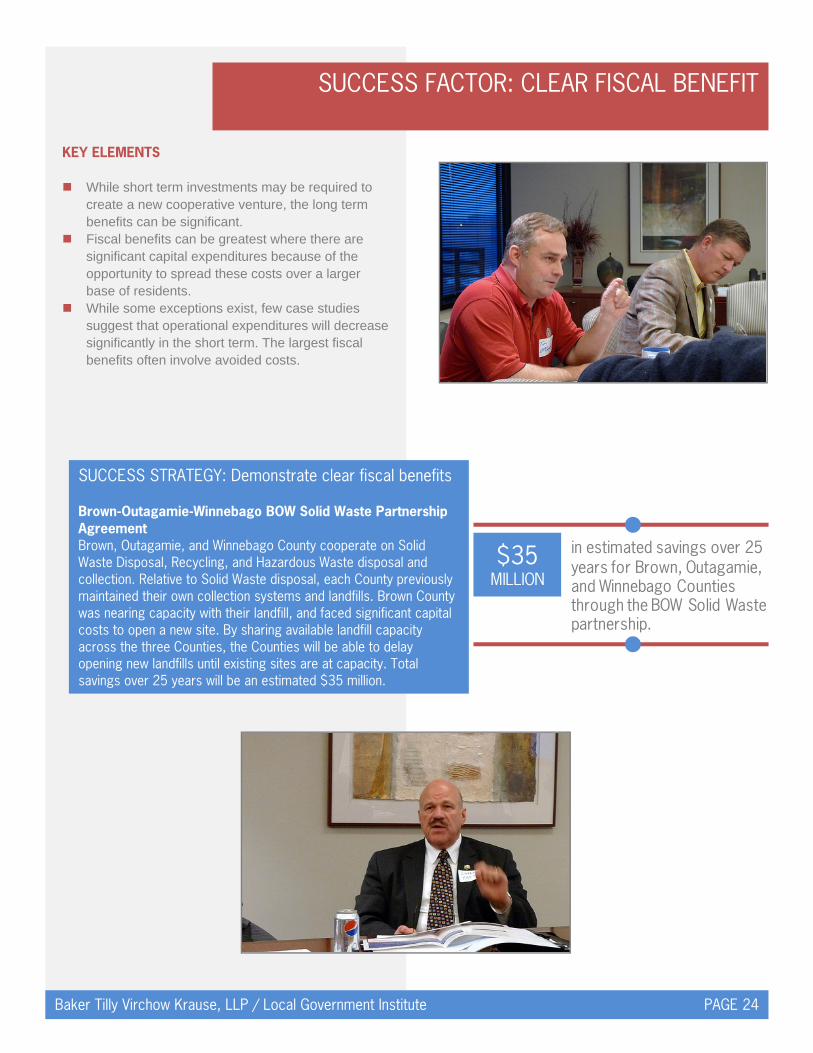
KEY ELEMENTS While short term investments may be required to
create a new cooperative venture, the long term benefits can be significant.
Fiscal benefits can be greatest where there are significant capital expenditures because of the opportunity to spread these costs over a larger base of residents.
While some exceptions exist, few case studies suggest that operational expenditures will decrease significantly in the short term. The largest fiscal benefits often involve avoided costs.
$35MILLION
in estimated savings over 25 years for Brown, Outagamie, and Winnebago Counties through the BOW Solid Waste partnership.
SUCCESS STRATEGY: Demonstrate clear fiscal benefits Brown-Outagamie-Winnebago BOW Solid Waste Partnership Agreement Brown, Outagamie, and Winnebago County cooperate on Solid Waste Disposal, Recycling, and Hazardous Waste disposal and collection. Relative to Solid Waste disposal, each County previously maintained their own collection systems and landfills. Brown County was nearing capacity with their landfill, and faced significant capital costs to open a new site. By sharing available landfill capacity across the three Counties, the Counties will be able to delay opening new landfills until existing sites are at capacity. Total savings over 25 years will be an estimated $35 million.
SUCCESS FACTOR: CLEAR FISCAL BENEFIT
Baker Tilly Virchow Krause, LLP / Local Government Institute PAGE 25
2 ladder trucks now serve the 7 municipalities of the North Shore Fire District, instead of the 4 that had been maintained in the years before the merger. New ladder trucks can cost $800,000 apiece, which represents an estimated $1.6 million in avoided costs.
SUCCESS STRATEGY: Think about savings in terms of avoided costs LOGIS IT Consortium, MN LOGIS is a consortium of 45 Minnesota local government units whose mission it is to "Facilitate leading edge, effective, and adaptable public sector technology solutions through the sharing of ideas, risks, and resources in a member-driven consortium." The consortium provides critical information technology services, products, and supports offering consortium members access to technology at significantly lower overall cost. Formed in 1972, the LOGIS model has been successful in those areas requiring a municipal-focused application that serves a broad functionality for all members. LOGIS was formed through a joint powers agreement. Members range in size from community populations of 2,500 to more than 100,000. Cost avoidance estimates completed for the LOGIS IT consortium in Minnesota suggests that a large municipality LOGIS participant would typically pay roughly $48,500 in just implementation costs for an HR/Payroll/Finance software implementation project received through the consortium. The same municipality might face implementation costs ranging from $625,000 on the low end, up to $3.8 million on the high end, from a non-LOGIS vendor for the same project. In addition, the cost of the initial software purchase by going through the consortium is reduced anywhere from four to ten times in comparison to purchasing it as a single city.
SUCCESS STRATEGY: Think about savings in terms of avoided costs North Shore Fire Department Seven suburban Milwaukee municipalities created a metropolitan fire department in 1995 in response to the City of Milwaukee no longer cooperating on mutual aid for fire protection. In the seven years previous to the merger, per capita expenditure in the municipalities that had full-time fire departments had grown by an average of 68 percent (total over the seven years, not annually). In the seven years after the merger, per capita expenditures increased by an average of 19 percent.
10Times More
cost to individually purchase and implement an ERP system as a stand-alone entity versus participating in a joint Information Technology consortium.

SUCCESS FACTOR: TRUST
Baker Tilly Virchow Krause, LLP / Local Government Institute PAGE 26
KEY ELEMENTS Trust is vital between key players involved in
creating intergovernmental cooperation agreements.
Many case studies that were reviewed suggest that formal intergovernmental cooperation agreements frequently begin with informal peer-to-peer conversations at the staff level.
Regardless of whether the conversation begins at the staff level or between elected officials, creating new intergovernmental agreements can carry significant risk. Trust in your partner is essential to an objective assessment of actual risk.
Once citizens could see that their services would not decrease they
were much more supportive.“
”Case Study Interviewee
SUCCESS STRATEGY: Build trust by jointly reviewing potential service and cost impacts with your partner in a transparent and objective way Rock County and City of Beloit Health Department Merger The City of Beloit may be the only City in the state to offer public health services before Rock County did. The two departments officially began operating as one public health department on January 1, 2007. Discussion had begun in fall of 2004 on a possible merger, but convincing residents of Beloit that they would receive the same level of service in the same service areas after consolidation was a major obstacle. To address this, the City and County hired an independent outside consultant to facilitate an objective assessment of the fiscal and service impacts of the merger. Staff said that the simple process of putting a plan down on paper for residents to read greatly increased the understanding and support of the merger. Having public hearings with the City Council was also a major turning point.
SUCCESS FACTOR: TRUST
Baker Tilly Virchow Krause, LLP / Local Government Institute PAGE 27
$89,000per year and a formal contract has brought the Town and the County into a partner relationship, and ensured a consistent level of service.
SUCCESS STRATEGY: Build trust by cooperating on limited initiatives before tackling the tougher issues Municipal Merger of Iron River, Stambaugh, and Mineral Hills, MI The City of Iron River was created as a consolidation of two small, rural cities and a village in the upper peninsula of Michigan – Iron River, Stambaugh, and Mineral Hills. The total population of the consolidated entities was 3,391. The consolidation of the three cities is the first and only in Michigan history. Perhaps the most critical success factor was that cooperation previously existed in the most visible and politically sensitive services such as public safety, water, and sewer. The gradual process of combining services over time, before the structural merger was attempted, served to build a trusting relationship between parties to the consolidation.
SUCCESS STRATEGY: Get it in writing: build the basis of an equal partnership through a formal agreement Town of Harrison As the Town of Harrison has grown in population it has also started to become more urban. The Town Board determined that the current level of service offered by the Calumet County Sheriff was insufficient for their needs and wanted more dedicated law enforcement. The Town of Harrison entered into a written contract for law enforcement service from Calumet County in 2005, receiving 2,080 annual hours of service (40 hours per week). Staff indicated there has been a much greater law enforcement presence in the community and the sheriff is more accessible.
IRON RIVERMichigan
represents the only successful municipal consolidation in Michigan history. Overcoming the barriers surrounding the loss of community identity was only possible due to a track record of cooperation on functional service delivery.
SUCCESS FACTOR: LEADERSHIP
Baker Tilly Virchow Krause, LLP / Local Government Institute PAGE 28
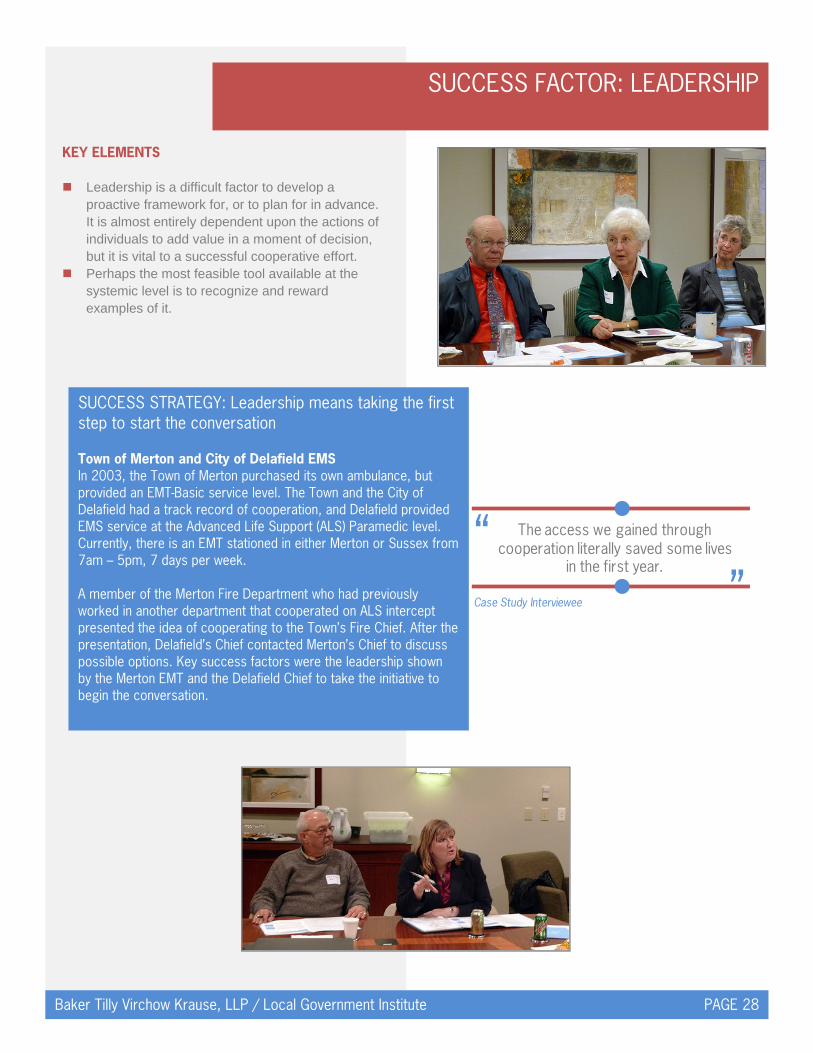
KEY ELEMENTS Leadership is a difficult factor to develop a
proactive framework for, or to plan for in advance. It is almost entirely dependent upon the actions of individuals to add value in a moment of decision, but it is vital to a successful cooperative effort.
Perhaps the most feasible tool available at the systemic level is to recognize and reward examples of it.
The access we gained through cooperation literally saved some lives
in the first year.“
”Case Study Interviewee
SUCCESS STRATEGY: Leadership means taking the first step to start the conversation Town of Merton and City of Delafield EMS In 2003, the Town of Merton purchased its own ambulance, but provided an EMT-Basic service level. The Town and the City of Delafield had a track record of cooperation, and Delafield provided EMS service at the Advanced Life Support (ALS) Paramedic level. Currently, there is an EMT stationed in either Merton or Sussex from 7am – 5pm, 7 days per week. A member of the Merton Fire Department who had previously worked in another department that cooperated on ALS intercept presented the idea of cooperating to the Town’s Fire Chief. After the presentation, Delafield’s Chief contacted Merton’s Chief to discuss possible options. Key success factors were the leadership shown by the Merton EMT and the Delafield Chief to take the initiative to begin the conversation.
SUCCESS FACTOR: LEADERSHIP
Baker Tilly Virchow Krause, LLP / Local Government Institute PAGE 29
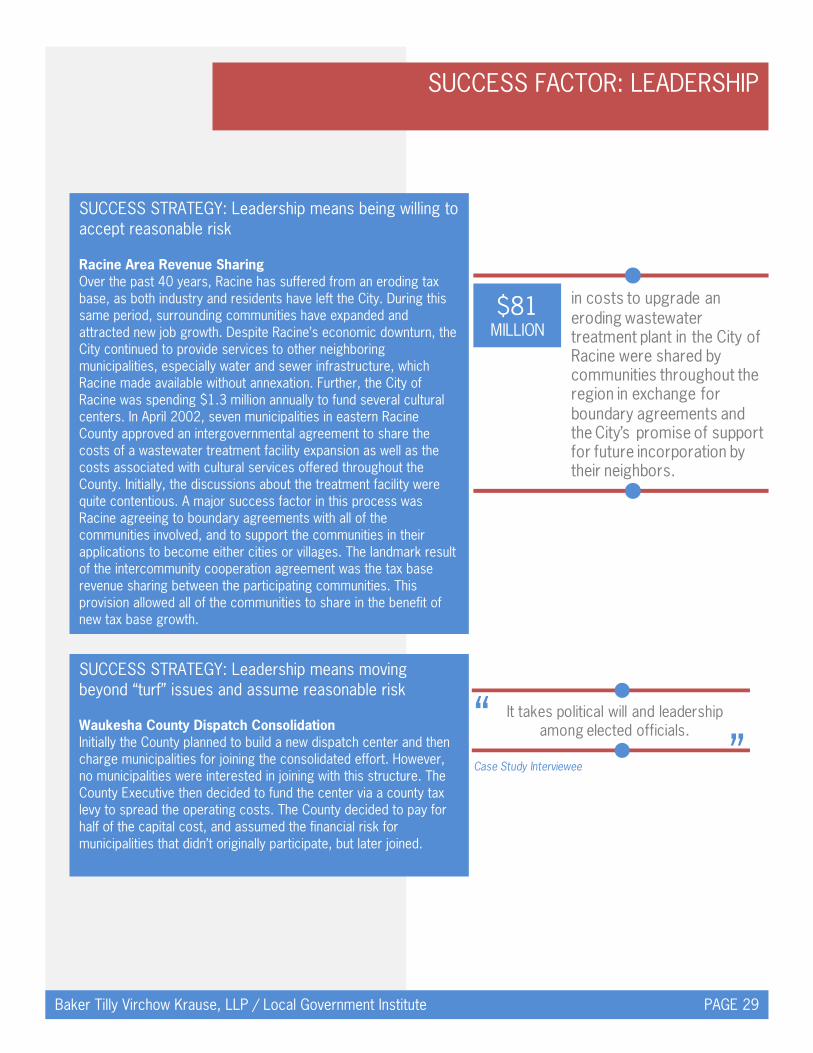
$81MILLION
in costs to upgrade an eroding wastewater treatment plant in the City of Racine were shared by communities throughout the region in exchange for boundary agreements and the City’s promise of support for future incorporation by their neighbors.
SUCCESS STRATEGY: Leadership means being willing to accept reasonable risk Racine Area Revenue Sharing Over the past 40 years, Racine has suffered from an eroding tax base, as both industry and residents have left the City. During this same period, surrounding communities have expanded and attracted new job growth. Despite Racine’s economic downturn, the City continued to provide services to other neighboring municipalities, especially water and sewer infrastructure, which Racine made available without annexation. Further, the City of Racine was spending $1.3 million annually to fund several cultural centers. In April 2002, seven municipalities in eastern Racine County approved an intergovernmental agreement to share the costs of a wastewater treatment facility expansion as well as the costs associated with cultural services offered throughout the County. Initially, the discussions about the treatment facility were quite contentious. A major success factor in this process was Racine agreeing to boundary agreements with all of the communities involved, and to support the communities in their applications to become either cities or villages. The landmark result of the intercommunity cooperation agreement was the tax base revenue sharing between the participating communities. This provision allowed all of the communities to share in the benefit of new tax base growth.
SUCCESS STRATEGY: Leadership means moving beyond “turf” issues and assume reasonable risk Waukesha County Dispatch Consolidation Initially the County planned to build a new dispatch center and then charge municipalities for joining the consolidated effort. However, no municipalities were interested in joining with this structure. The County Executive then decided to fund the center via a county tax levy to spread the operating costs. The County decided to pay for half of the capital cost, and assumed the financial risk for municipalities that didn’t originally participate, but later joined.
It takes political will and leadership among elected officials.“
”Case Study Interviewee

SUCCESS FACTOR: COMMUNITY SUPPORT
Baker Tilly Virchow Krause, LLP / Local Government Institute PAGE 30
KEY ELEMENTS Community Support can be an important success
factor, most particularly when the potential consolidation involves a “high profile” service that is connected to community identity, such as public safety.
Involving the business community can be a powerful strategy for enhancing community support.
Other success strategies for garnering community support include having a command of the facts, and staying on message.
It is vital to anticipate countering arguments and likely opponents, and including them and addressing their concerns in a transparent process to explore the feasibility and benefits of consolidation.
SUCCESS STRATEGY: Involve the business community DeForest and Windsor Now (DaWN) In response to several years of lackluster commercial and real estate development, several residents decided to create DaWN, (DeForest and Windsor Now), to promote cooperative planning between the Village of DeForest and Town of Windsor. Citizens realized that without new business investments, the tax base of the municipalities and the DeForest School District would stagnate. Led by a prominent local business leader, a nine person group was created with the goal of promoting joint progress between the two municipalities.
SUCCESS STRATEGY: Hold public forums to garner public support Prescott Fire Protection In 2005 the Towns of Clifton and Oak Grove signed an agreement with the City of Prescott for fire protection. Before committing to the agreement, a minimum of eighteen public listening sessions were held to inform residents of all aspects of the agreement, including budgetary increases. Information pertaining to the cooperation was also printed in area newspapers.

SUCCESS FACTOR: SHARED PERCEPTION OF NEED
Baker Tilly Virchow Krause, LLP / Local Government Institute PAGE 31
KEY ELEMENTS The final factor for successful consolidations is that
all partners must share a perception of the real need for the cooperative effort. After all, if a municipality is happy with how a service is currently being delivered, there is little incentive to spend the time and resources needed to change.
A shared perception of need may come from an objective assessment of service gaps in a municipality, or it may come from an external crisis or event.
We use [their] bucket truck and [they] use our skid loader. Now we both
don’t have to buy our own.“
”Case Study Interviewee
SUCCESS STRATEGY: Objectively assess where your service gaps are City of Onalaska Public Works Municipalities in La Crosse County have been cooperating on providing public works to citizens since 2004. The City of Onalaska has an agreement to share equipment with the Town of Holmen and has snow plowing arrangements with the Town of Onalaska. The City also contracts with La Crosse County for mowing services and rents equipment to fill cracked pavement. Heavy storms in 2004 and again in 2007 left considerable rain damage to streets, especially runoff areas, throughout La Crosse County. After speaking with each other at several meetings, public works directors at several municipalities realized they would have access to much more specialized equipment if they cooperated on providing service. The agreements to utilize each other’s unique resources have allowed citizens to receive better, more productive service without bearing any of the capital costs involved in purchasing these expensive apparatuses.
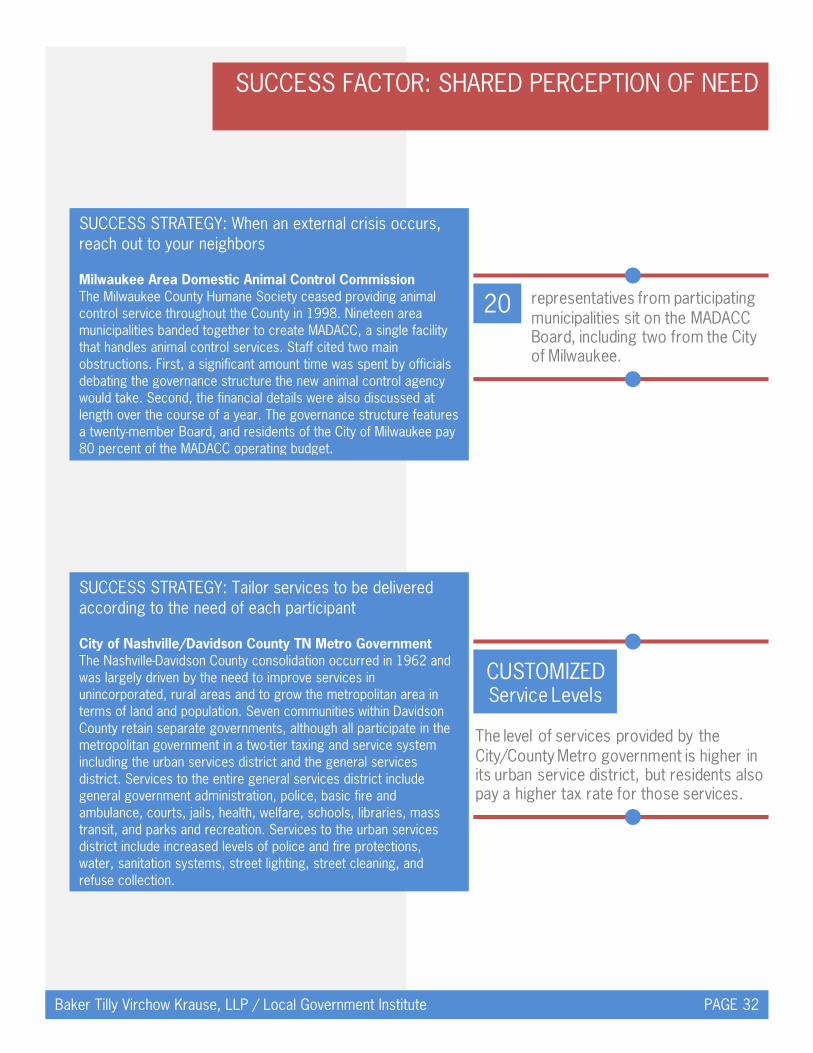
SUCCESS FACTOR: SHARED PERCEPTION OF NEED
Baker Tilly Virchow Krause, LLP / Local Government Institute PAGE 32
20 representatives from participating municipalities sit on the MADACC Board, including two from the City of Milwaukee.
SUCCESS STRATEGY: Tailor services to be delivered according to the need of each participant City of Nashville/Davidson County TN Metro Government The Nashville-Davidson County consolidation occurred in 1962 and was largely driven by the need to improve services in unincorporated, rural areas and to grow the metropolitan area in terms of land and population. Seven communities within Davidson County retain separate governments, although all participate in the metropolitan government in a two-tier taxing and service system including the urban services district and the general services district. Services to the entire general services district include general government administration, police, basic fire and ambulance, courts, jails, health, welfare, schools, libraries, mass transit, and parks and recreation. Services to the urban services district include increased levels of police and fire protections, water, sanitation systems, street lighting, street cleaning, and refuse collection.
SUCCESS STRATEGY: When an external crisis occurs, reach out to your neighbors Milwaukee Area Domestic Animal Control Commission The Milwaukee County Humane Society ceased providing animal control service throughout the County in 1998. Nineteen area municipalities banded together to create MADACC, a single facility that handles animal control services. Staff cited two main obstructions. First, a significant amount time was spent by officials debating the governance structure the new animal control agency would take. Second, the financial details were also discussed at length over the course of a year. The governance structure features a twenty-member Board, and residents of the City of Milwaukee pay 80 percent of the MADACC operating budget.
CUSTOMIZEDService Levels
The level of services provided by the City/County Metro government is higher in its urban service district, but residents also pay a higher tax rate for those services.
RECOMMENDATIONS TO ALIGN LOCAL AND REGIONAL INTEREST
Baker Tilly Virchow Krause, LLP / Local Government Institute PAGE 33
The Wisconsin Counties Association, the Wisconsin Towns Association, the League of Municipalities, and the Alliance of Cities should take the following actions for each success factor. SUCCESS FACTOR: IMPROVED SERVICE DELIVERY Success Strategies: Demonstrate new service capabilities Demonstrate how the service will be provided
better, faster, and quicker Recognize that regional problems require regional
solutions LGI Action Steps: 1. Support the creation of Legislative Council Study
Committees on Regional Collaboration, with the aim of creating enabling legislation for special taxation districts where necessary, including revenue frameworks and taxing authority, modifications to current law related to municipalities and counties, and that in the short term focus on the following critical services:
Multijurisdictional Recycling Districts; Multijurisdictional Public Health; County-level Law Enforcement; Metropolitan Fire and EMS Districts; and Animal Control Districts.
2. In the upcoming Annual Conferences for each
founding partner association, create a special forum for the many successful examples of consolidations to present and document the impacts of a consolidated approach on service delivery.
SUCCESS FACTOR: CLEAR FISCAL BENEFIT Success Strategies: Demonstrate Clear Fiscal Benefits Think about savings in terms of avoided costs LGI Action Steps: 3. Work to create a mechanism for communities to
overcome capital cost barriers to creating new cooperative efforts. Encourage the Legislature to create a revolving loan fund, or other mechanisms that can be used to support creation of consolidated service delivery.
4. Work to overturn the new “Maintenance of Effort” law which erodes local control and discourages spending efficiency initiatives.
5. Evaluate alternative local government revenue options at the state and local level to encourage regional distribution of resources and delivery of services where appropriate. These options should address the lack of positive financial incentives, but at a minimum should correct disincentives for local government efficiency.
SUCCESS FACTOR: TRUST Success Strategies: Build trust by jointly reviewing potential service and
cost impacts with your partner in a transparent and objective way
Get it in writing: build the basis of an equal partnership through a formal agreement
Build trust by cooperating on limited initiatives before tackling the tougher issues
LGI Action Steps: 6. Provide a platform for relationships to grow across
all levels of local government. Facilitate the creation of intergovernmental cooperation councils on a multijurisdictional basis, where they do not currently exist. These intergovernmental councils should be charged with:
Serving as a forum for building cooperative
relationships; Identifying potential cooperation and
consolidation opportunities;
RECOMMENDATIONS FOR LGI FOUNDING PARTNER ASSOCIATIONS

RECOMMENDATIONS TO ALIGN LOCAL AND REGIONAL INTEREST
Baker Tilly Virchow Krause, LLP / Local Government Institute PAGE 34
Facilitating objective feasibility analyses; and Promoting success stories.
7. Develop templates for governance structures and
oversight models that can be used as models for communities considering consolidated or metropolitan service delivery.
8. Address the fight over tax base by:
Encouraging the Legislature to provide financial incentives to Cities, Villages, and Towns to negotiate boundary agreements;
Drafting legislation to modify the current County and Municipal Aid program to encourage wider use of regional revenue sharing.
SUCCESS FACTOR: LEADERSHIP Success Strategies: Leadership means taking the first step to start the
conversation Leadership means being willing to accept
reasonable risk LGI Action Steps: 9. Raise the public visibility of leadership examples by
creating an LGI leadership forum and support a framework to educate municipal and community leaders about the benefits of and specific steps to mitigate risks relative to cooperative arrangements. This forum should be part of a joint conference or working group effort between the founding partner associations.
SUCCESS FACTOR: COMMUNITY SUPPORT Success Strategies: Involve the business community Assess consolidation feasibility using a process
transparent to the public and your partners LGI Action Steps: 10. Establish formal linkages between LGI and
regional business development groups, including the MMAC and M7, Thrive, New North, the Greater Racine Business Council, and others.
11. LGI founding partners should seek to participate
directly in efforts by business development groups to encourage a regional approach to solving regional problems. In collaboration with business development groups, develop a joint outreach plan that identifies priority services and creates an environment in which local leadership is encouraged to act on opportunities.
12. Encourage the Legislature to set aside a fund to
assist communities in paying for outside consolidation feasibility studies or facilitation services for those instances that would benefit from this type of assistance.
SUCCESS FACTOR: SHARED PERCEPTION OF NEED Success Strategies: Objectively assess where your service gaps are When an external crisis occurs, reach out to your
neighbors Tailor services to be delivered according to the
needs of each participant LGI Action Steps: 13. Encourage the Legislature to modify the County
and Municipal Aid program to incent regional or consolidated service delivery for highly suitable functional areas including:
Fire Protection and EMS; Law Enforcement; Recycling; Public Health; and Animal Control.
14. Pursuant to Action Step 10, facilitate the
distribution of quarterly information relative to economic indicators, potential business retention issues, and/or job creation variables in order to enhance local governments’ understanding of regional economic development conditions, issues, and needs.
CASE STUDIES
Baker Tilly Virchow Krause, LLP / Local Government Institute PAGE 35
Case Studies North Shore Fire Department
Waukesha County Dispatch Center
Brown, Outagamie, and Winnebago County Solid Waste Recycling and Hazardous Materials Disposal
Everest Metro Police Department
Town of Harrison Law Enforcement
City of Beloit and Rock County Public Health
Town of Merton Emergency Medical Service
Village of Plover Fire Protection
City of Prescott Fire Protection
Outagamie County Planning and Economic Development
Milwaukee Area Domestic Animal Control Commission
Outagamie‐Waupaca Library System
Racine Area Revenue Sharing
Valley Transit Public Transportation
City of Onalaska Public Works / Streets / Highways
DeForest and Windsor Cooperative Planning

CASE STUDY: NORTH SHORE FIRE DEPARTMENT
Baker Tilly Virchow Krause, LLP / Local Government Institute PAGE 36
AT A GLANCE Fire Protection Cooperation between Villages of
Bayside, Brown Deer, Fox Point, River Hills, Shorewood, Whitefish Bay, and City of Glendale.
Key Success Factors: Potential for service improvements, significant avoided costs, political leadership and trust, shared perception of need.
Key Benefits: Significantly reduced rate of increase in annual expenditures for five of seven municipalities, full-time fire protection services for two municipalities that had been volunteer-only, lower ISO ratings for all seven communities, and new fire station in Bayside.
Summary: In 1992, the municipalities of the North Shore Fire Department decided to investigate methods to more effectively provide fire services to their residents. The process started with each community’s board receiving a report detailing the resources currently being used by their community for fire protection from their respective fire chiefs. An organizational plan was developed that both the fire department and staff supported, and the plan was given to elected officials. Each community contributed between $5,000 and $10,000 to a fund to hire an outside consultant. Staff indicated that the most beneficial part of this ongoing, year-long process was the trust that was built between community leaders and fire officials while discussing future possibilities. The feasibility study took approximately one year to complete. In 1993 and 1994 a report was produced by the consulting firm and presented to the communities. The implementation process was guided by the work of three subcommittees, including: Governance, Finance, and Operations. The implementation effort took approximately two years. On October 1, 1994, the six communities of Brown Deer, Glendale, Fox Point, River Hills, Shorewood and Whitefish Bay committed to forming a consolidated fire department. Several weeks
later, Bayside decided to join the consortium as well. On January 1, 1995, the seven communities combined to create an independent metro department that would better serve their municipalities. Impetus: In 1992 the City of Milwaukee ceased providing mutual aid to surrounding communities, including the seven that make up the North Shore Fire Department. Also, the communities experienced a less than optimal response to two large commercial fires in the late 1980s and early 1990s. This highlighted, from an operational perspective, the risks inherent of having independent fire departments during a major incident. Barriers to Overcome: Department officials believed that concerns about cost impacts, service, and community concerns about governance and local control were the primary barriers. Success Factors: Department officials cited the trust that was built during the year-long feasibility study and exploration of consolidation as an important success factor. Emphasis was also given to the important role elected officials played in the entire process. Their leadership and ability to garner community support was repeatedly lauded. During the planning process, one public forum was held in each community with implementation subcommittee members present. After these initial seven meetings, each individual municipality held separate public hearings to discuss the merger with residents. Four of the seven municipalities saw a significant reduction in the rate at which expenditures for fire protection had historically increased. Two municipalities, Bayside and River Hills, actually saw costs increase after consolidation. This was due to the fact that these two communities had no full-time responders on call before the merger, making a rise in expenditures inevitable when beginning to fund a full-time fire department.
Government has the responsibility to lead and to use our residents’ tax
dollars wisely.“
”Case Study Interviewee
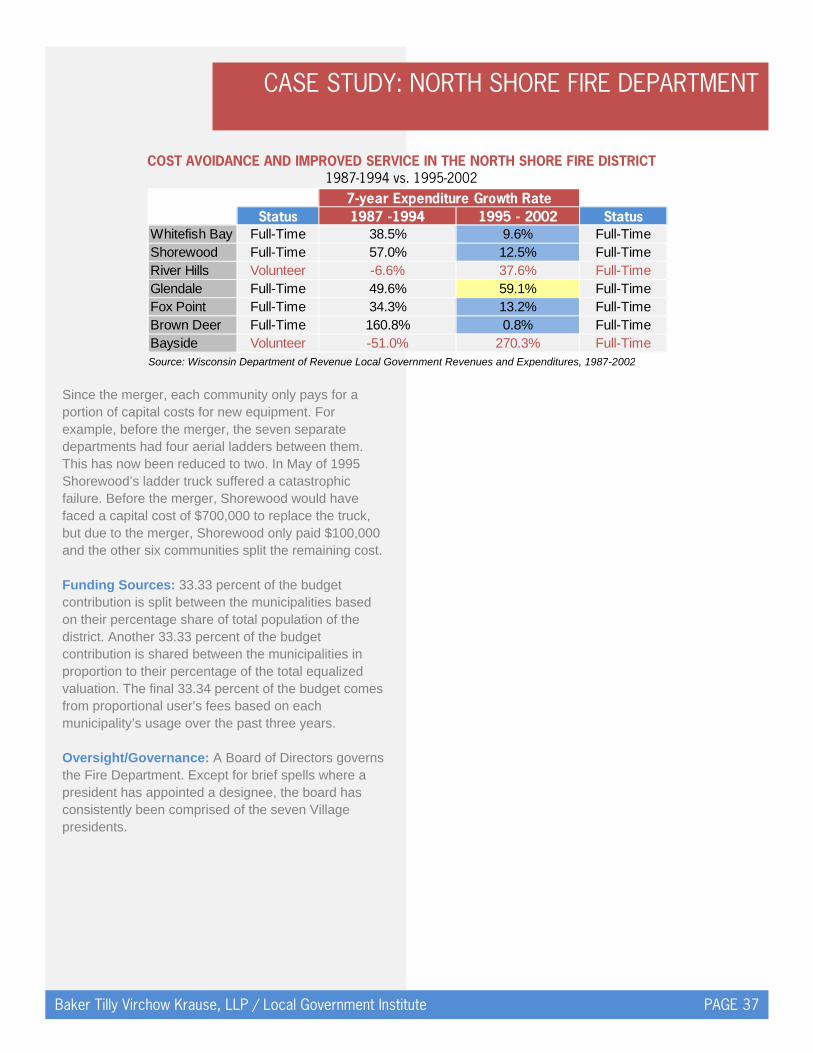
CASE STUDY: NORTH SHORE FIRE DEPARTMENT
Baker Tilly Virchow Krause, LLP / Local Government Institute PAGE 37
Since the merger, each community only pays for a portion of capital costs for new equipment. For example, before the merger, the seven separate departments had four aerial ladders between them. This has now been reduced to two. In May of 1995 Shorewood’s ladder truck suffered a catastrophic failure. Before the merger, Shorewood would have faced a capital cost of $700,000 to replace the truck, but due to the merger, Shorewood only paid $100,000 and the other six communities split the remaining cost. Funding Sources: 33.33 percent of the budget contribution is split between the municipalities based on their percentage share of total population of the district. Another 33.33 percent of the budget contribution is shared between the municipalities in proportion to their percentage of the total equalized valuation. The final 33.34 percent of the budget comes from proportional user’s fees based on each municipality’s usage over the past three years. Oversight/Governance: A Board of Directors governs the Fire Department. Except for brief spells where a president has appointed a designee, the board has consistently been comprised of the seven Village presidents.
COST AVOIDANCE AND IMPROVED SERVICE IN THE NORTH SHORE FIRE DISTRICT 1987-1994 vs. 1995-2002
Source: Wisconsin Department of Revenue Local Government Revenues and Expenditures, 1987-2002
Status 1987 -1994 1995 - 2002 StatusWhitefish Bay Full-Time 38.5% 9.6% Full-TimeShorewood Full-Time 57.0% 12.5% Full-TimeRiver Hills Volunteer -6.6% 37.6% Full-TimeGlendale Full-Time 49.6% 59.1% Full-TimeFox Point Full-Time 34.3% 13.2% Full-TimeBrown Deer Full-Time 160.8% 0.8% Full-TimeBayside Volunteer -51.0% 270.3% Full-Time
7-year Expenditure Growth Rate
CASE STUDY: WAUKESHA COUNTY DISPATCH CENTER
Baker Tilly Virchow Krause, LLP / Local Government Institute PAGE 38
AT A GLANCE Dispatch Center Consolidation between Lakes
Area Communications, Waukesha County Sheriff, and six other agencies.
Key Success Factors: Political leadership, significant avoided costs.
Key Benefits: Better service, capacity to provide support services to municipal dispatch centers, improved ability to deal with staff turnover, and evidence of lower annual operating costs.
Summary: In 2000, there were ten separate public safety answering points (PSAP) throughout Waukesha County. The County Executive, the Director of Administration, and the County Board saw the time as right to consolidate these individual facilities into one centralized structure serving the entire County. After four years of discussion and deliberation, the Waukesha County Communications Center (WCC) was formed in 2004. The WCC was a consolidation of Lakes Area Communications, the Waukesha County Sheriff, and six other agencies that were each dispatched via individual centers prior to creation of the WCC. In 2005, the City of Brookfield and the Village of Butler joined the center. As of 2009, the Waukesha County Dispatch Center serves twenty-nine communities and ten fire districts throughout Waukesha County. Impetus: Two main factors led to the consolidation of the dispatch centers. First, one of the PSAPs was having trouble retaining employees as they would often move to work at another area PSAP. Second, a lot of PSAPs were facing expensive capital system replacements, a situation that lent itself to consolidating services in an attempt to minimize costs to municipalities.
Barriers to Overcome: The most difficult obstacle was obtaining the critical mass necessary to make consolidation feasible. In order for the cooperative effort to create sufficient cost savings, several communities would have to partake. Also, several police chiefs wanted to control their own dispatch centers, mostly for political reasons. However, in many municipalities the city council or finance directors overruled the police chief’s wishes based strictly on a fiscal examination of the consolidation. Waukesha County tried for two years to develop a consortium to achieve the consolidation, but members of the consortium could not agree on the cost structure. Potential municipal partners indicated to the County the only way for the consolidation to become a reality would be for the County to take over the operation and have it managed separately from the Waukesha County Sheriff. There were also initial concerns that the additional costs of bringing the dispatch center into the County’s organizational structure and operating budget would increase the County tax levy. However, this proved not to be the case. For example, Brookfield saw its average tax rate decrease from $2.09 per $1,000 assessed value in 2007 to the current $1.78 per $1,000 assessed value in 2009. Success Factors: The consolidation effort took a great deal of political will and leadership from elected officials before it was ultimately implemented. The new centralized dispatch facility has reduced risk, since the County provides backup to municipal dispatch centers, specifically the Town Mukwonago and the Cities of Muskego and Waukesha. Due to the Communications Center’s organizational resources, it has been able to improve training and testing programs enabling it to better identify outstanding candidates. The County now has the ability to maintain an equipment replacement fund that allows the Communications Center to maintain an eight year schedule. The Center has benefitted from having a larger staff, as it is able to cope with turnover among its dispatchers with very little disruption in service, something that often cannot be said about dispatch offices with smaller staff numbers. Finally, and perhaps most importantly, the municipalities experienced significant declines in annual operating costs. For example, the City of Brookfield estimates that it is currently achieving
It takes political will and leadership among elected officials.“
”Case Study Interviewee
CASE STUDY: WAUKESHA COUNTY DISPATCH CENTER
Baker Tilly Virchow Krause, LLP / Local Government Institute PAGE 39
approximately $525,000 in annual operating savings due to its participation in the consolidated operation. Funding Sources: Waukesha County built the new dispatch center and paid 100 percent of the operating cost. The start-up capital costs were split evenly, with the County funding half and the municipalities paying the other half. Municipalities had the option of paying over eight years with no interest. Initially the County planned to build a new dispatch center and then charge municipalities for joining the consolidated effort. However, no municipalities were interested in joining with this structure. The County Executive then decided to fund the center via county tax levy to spread the operating costs. The County decided to pay for half of the capital cost, and loaned the money for the municipalities that didn’t originally participate. Some municipalities paid but maintained their own dispatch center, such as Mukwonago. The County established a capital cost payment formula based on equalized tax base and allowed former dispatcher staff to join County employment with their former seniority and enter the County union. This served as an incentive for municipalities to join: if they didn’t join, they would have to fund their own PSAP and pay the county property tax levy for the consolidated dispatch center they would not be using. Oversight/Governance: Waukesha County agreed to take control of the dispatching out of the County Sheriff’s hands and set up a separate agency responsible for dispatching calls under the control of the County Executive and the County Board. Member municipalities participate in the Dispatch Operations Commission (DOC), which provides oversight from a policy perspective. The County handles all human resources, including hiring. The DOC also includes Protocol and Technology subcommittees that consist of representatives of the thirty participating communities.
CASE STUDY: BROWN, OUTAGAMIE, AND WINNEBAGO COUNTY SOLID WASTE RECYCLING AND HAZARDOUS MATERIALS DISPOSAL
Baker Tilly Virchow Krause, LLP / Local Government Institute PAGE 40
AT A GLANCE Recycling Cooperation between Brown, Outagamie
and Winnebago Counties. Key Success Factors: Clear fiscal benefits, trust,
leadership. Key Benefits: Lower annual operating costs. Summary: Brown, Outagamie, and Winnebago County have cooperated on three projects, including Recycling, Solid Waste Disposal, and Hazardous Waste disposal and collection. Brown and Winnebago Counties initially began discussing cooperation in 2001. The cooperation is unique in that each County has maintained its own collection systems and landfills and the program features rotating use of each County’s landfill. In 2001, the Counties hired a consulting engineer to evaluate the utilization of the three landfills, factoring in transportation costs and capacity of each landfill. The existing capacity was planned to suffice for approximately twenty-five years. Brown County could have delayed opening the new landfill, but Winnebago County mothballed its landfill, which entailed some costs, transfers, and layoffs of employees. In the immediate term, all three counties sent waste to Outagamie’s landfill until it reached capacity in 2004. In 2005, Winnebago County’s landfill was reopened; Outagamie kept its landfill open to avoid a re-approval process from the Department of Natural Resources. Winnebago County’s landfill is scheduled to close in mid-2011 when it has reached its capacity. Outagamie will then open their partially-sited expansion which has a planned operation of about eight years. In 2020, the Outagamie landfill will close and both counties will begin disposing at the new Brown County landfill.
Solid Waste Collection: Each County kept their customers, transfer stations, and hauling operations. The intergovernmental agreement details the approved landfill costs each County must pay. Recycling Collection: Initially, three recycling facilities existed within 45 miles. The counties hired a consultant to evaluate their options to reduce duplication and Winnebago County was proposed as the lowest cost option, due largely to their access to prison labor through the Oshkosh Correctional Institution. The Counties decided to choose the next lowest cost alternative, the Brown County site. Brown County kept its facility, expanded its workforce, and began processing recycled goods from all three counties. An intergovernmental agreement was established that included both solid waste and recycling. Recycling services are set to be provided by Brown County for twelve years. Since Brown County’s recycling facility was incapable of processing paper, the county never collected paper goods for recycling. To circumvent this issue, Outagamie began receiving Winnebago’s paper, and Brown continued its past practice. In 2009 an amendment was written into the intergovernmental agreement to explore single stream recycling. The determination was made to remodel the Outagamie facility to process single stream recycling for all three Counties, a project totaling $10 million in capital investment. Hazardous Materials: In 1996, Brown County constructed a facility for limited processing of hazardous waste. At the time, Winnebago and Outagamie Counties contracted a private vendor to perform clean sweeps throughout their respective counties. Brown County received an exemption from the Wisconsin Department of Natural Resources to process waste from Winnebago and Outagamie Counties. The Counties are currently exploring options to expand Brown County’s operations to include hauling.
71%decrease in cost per pound of recycling since cooperation began.

CASE STUDY: BROWN, OUTAGAMIE, AND WINNEBAGO COUNTY SOLID WASTE RECYCLING AND HAZARDOUS MATERIALS DISPOSAL
Baker Tilly Virchow Krause, LLP / Local Government Institute PAGE 41
Impetus: The impetus came from the Winnebago County Solid Waste Manager and Brown County Solid Waste Director. Both were struggling to keep waste at a sufficiently high level, and Brown County planned on closing its landfill in 2003 and faced significant capital costs to develop a new landfill. Barriers to Overcome: Several major barriers presented themselves. First, County Board supervisors were concerned that transportation costs associated with hauling waste to other county landfills would negate potential savings. Second, private sector recycling vendors opposed the recycling option. Third, potential partners were concerned about how liability would be shared moving forward under co-ownership of landfills. Finally, agreement had to be reached over curbside pickup of recyclables, because Brown and Winnebago Counties relied on municipalities to collect recyclables; whereas Outagamie County provided this service. Success Factors: Trust and a positive working relationship between the County Solid Waste Directors as well as political leaders throughout the Counties was the driving force behind the cooperative effort. The cooperation is predicted to save a total of $35 million over twenty-five years in the three counties. Further, expansion of recycling efforts reduced costs per pound by 71 percent, thanks to a two-shift operation and the ability to pass on fixed costs across three counties. Finally, the fact that the recycling program was a profitable operation at the time of the agreement likely reduced the perceived risk for the recycling component of the agreement. Funding Sources: The BOW Partnership is run as an enterprise fund, a factor staff cited in forcing the partners to have a bottom line perspective to running their operations. Solid Waste Disposal: Solid waste efforts are paid for via tipping fees, as a separate charge to customers (typically on the property tax bill).
Recycling: Funding for the new single stream recycling facility was determined according to planned utilization of the facility. Outagamie County owns and operates the site, but Brown and Winnebago Counties have ownership rights to use the facility for fifteen years, after which each partner has a right to the depreciated salvage value. Winnebago and Brown County collect and run transfer stations at their own cost. Shared system costs include amortized capital costs and annual operating cost. Operating costs include hauling expenses, which are shared, even though Outagamie County ends up subsidizing Brown and Winnebago for hauling. The Counties also agreed to share any potential net profits. The BOW Partnership has an annual audit of the solid waste and recycling to reconcile amounts owed to or from each partner. Hazardous Materials: Brown County charges the partners by the pound to process hazardous materials. Outagamie County has five clean sweeps per year and Brown County hauls the material back under contract from Outagamie County. Oversight/Governance: An intergovernmental agreement was drafted between the three counties. The Directors of each County’s Solid Waste Department jointly oversee the operations. Any modifications to the intergovernmental agreement can be done only with the consensus of the three Directors. Winnebago has a Solid Waste Board, established per Wisconsin Statutes. The Winnebago County Board delegates their responsibility to the Solid Waste Board. Outagamie County does not have a Solid Waste Board; rather they have a Solid Waste Committee. Brown County has a Solid Waste Board, albeit without the power of approving their budget, as it requires County Board approval.
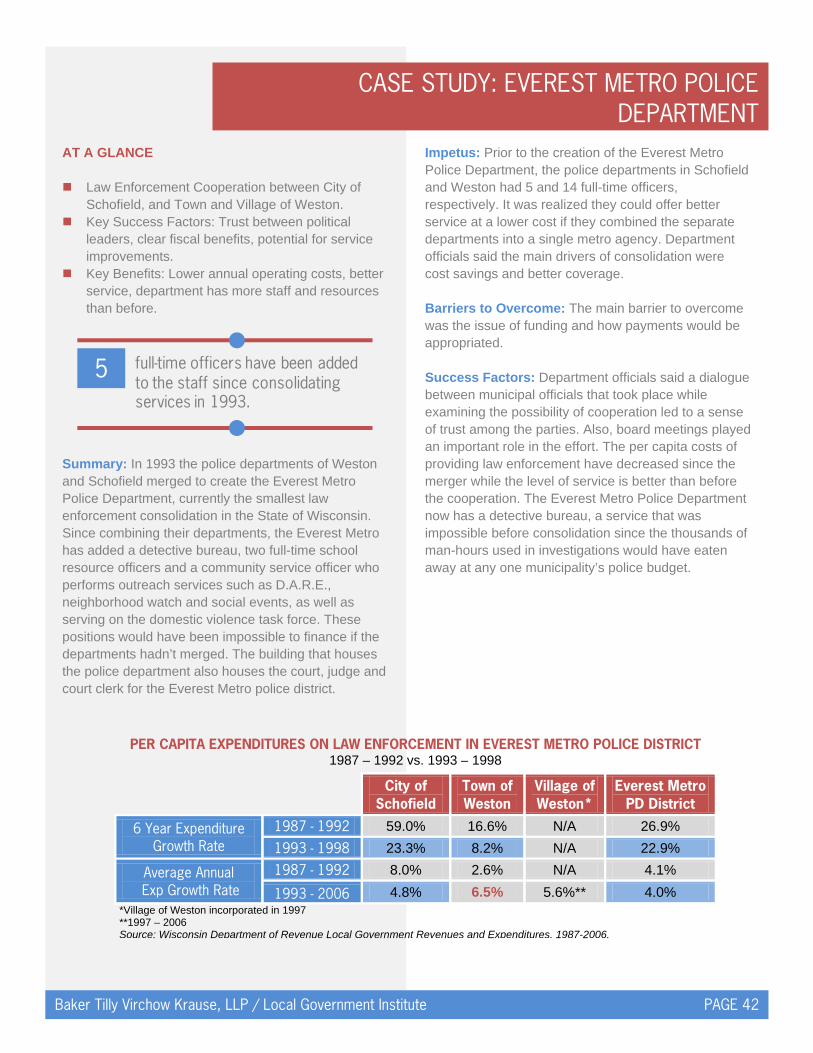
CASE STUDY: EVEREST METRO POLICE DEPARTMENT
Baker Tilly Virchow Krause, LLP / Local Government Institute PAGE 42
AT A GLANCE Law Enforcement Cooperation between City of
Schofield, and Town and Village of Weston. Key Success Factors: Trust between political
leaders, clear fiscal benefits, potential for service improvements.
Key Benefits: Lower annual operating costs, better service, department has more staff and resources than before.
Summary: In 1993 the police departments of Weston and Schofield merged to create the Everest Metro Police Department, currently the smallest law enforcement consolidation in the State of Wisconsin. Since combining their departments, the Everest Metro has added a detective bureau, two full-time school resource officers and a community service officer who performs outreach services such as D.A.R.E., neighborhood watch and social events, as well as serving on the domestic violence task force. These positions would have been impossible to finance if the departments hadn’t merged. The building that houses the police department also houses the court, judge and court clerk for the Everest Metro police district.
Impetus: Prior to the creation of the Everest Metro Police Department, the police departments in Schofield and Weston had 5 and 14 full-time officers, respectively. It was realized they could offer better service at a lower cost if they combined the separate departments into a single metro agency. Department officials said the main drivers of consolidation were cost savings and better coverage. Barriers to Overcome: The main barrier to overcome was the issue of funding and how payments would be appropriated. Success Factors: Department officials said a dialogue between municipal officials that took place while examining the possibility of cooperation led to a sense of trust among the parties. Also, board meetings played an important role in the effort. The per capita costs of providing law enforcement have decreased since the merger while the level of service is better than before the cooperation. The Everest Metro Police Department now has a detective bureau, a service that was impossible before consolidation since the thousands of man-hours used in investigations would have eaten away at any one municipality’s police budget.
5 full-time officers have been added to the staff since consolidating services in 1993.
City of Schofield
Town of Weston
Village of Weston*
Everest Metro PD District
6 Year Expenditure Growth Rate
1987 - 1992 59.0% 16.6% N/A 26.9%
1993 - 1998 23.3% 8.2% N/A 22.9%
Average Annual Exp Growth Rate
1987 - 1992 8.0% 2.6% N/A 4.1%
1993 - 2006 4.8% 6.5% 5.6%** 4.0%
PER CAPITA EXPENDITURES ON LAW ENFORCEMENT IN EVEREST METRO POLICE DISTRICT1987 – 1992 vs. 1993 – 1998
*Village of Weston incorporated in 1997 **1997 – 2006 Source: Wisconsin Department of Revenue Local Government Revenues and Expenditures, 1987-2006.
CASE STUDY: EVEREST METRO POLICE DEPARTMENT
Baker Tilly Virchow Krause, LLP / Local Government Institute PAGE 43
Funding Sources: Funding for the department was originally based on an eight factor formula. Each member’s contribution was based on:
1. Equalized Value 2. Population 3. Road Miles 4. Calls for Service 5. Part 1 Crimes 6. Traffic Accidents 7. Municipal Citations 8. Municipal Revenues
In 2010, municipal citations will be eliminated from the formula since they essentially track the same level of activity as municipal revenues, creating a seven factor formula. Costs have remained stable since the merger due largely to the fact that each department already had considerable equipment and resources that were combined when the merger took place. Also, the new department opted to purchase an old beer distributor’s warehouse for their new police building rather than constructing a completely new facility, saving them significant capital costs. Oversight/Governance: A legal contract was written when the municipalities agreed to merge their respective departments. A Joint Finance Committee governs the merged department. The Joint Finance Committee consists of seven members: the Village of Weston President and two Village trustees, the Mayor of Schofield and two City Council members, and the Town Chairman from Weston. A separate Police Commission consists of three Schofield residents, three Village residents, and one Town resident. The Joint Finance Committee sets the budget for the department and has fiduciary oversight. The Police Commission approves hiring, firing, promotions, and disciplinary measures. Department officials noted that, since three separate municipal boards look through the department’s budget, the department must be prepared to have their finances scrutinized, a fact that has required Everest Metro to maintain fiscal discipline while maintaining a high level of accountability.
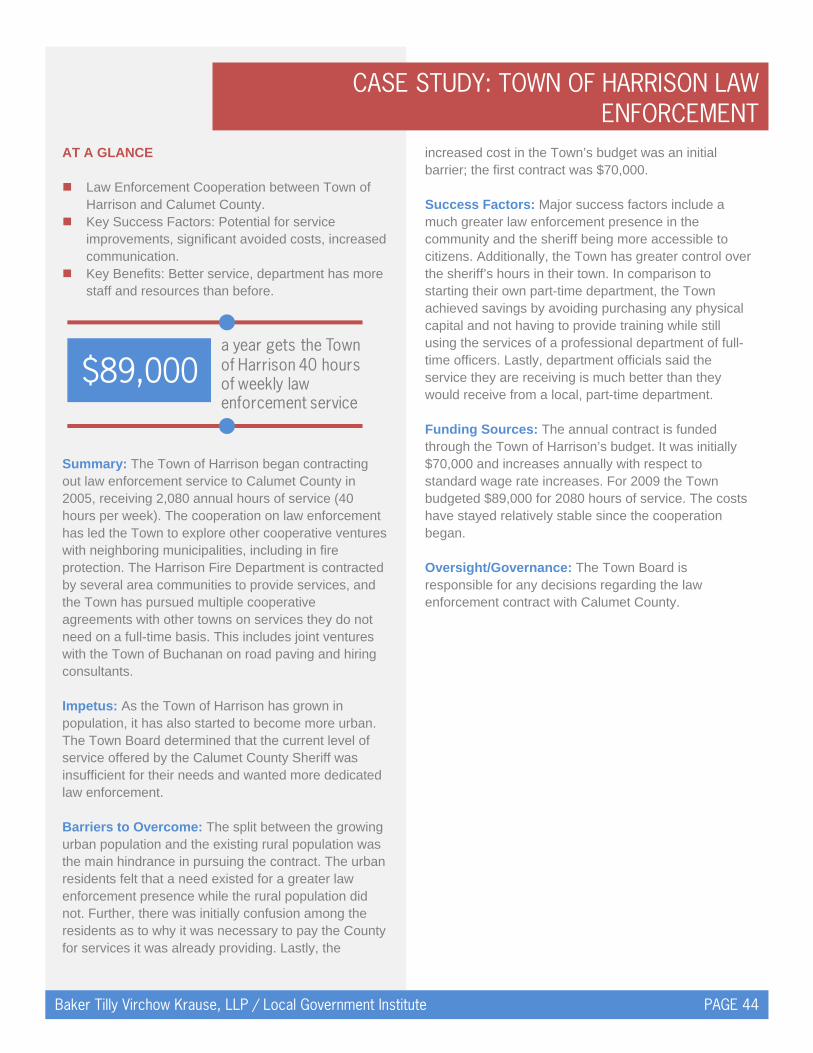
CASE STUDY: TOWN OF HARRISON LAW ENFORCEMENT
Baker Tilly Virchow Krause, LLP / Local Government Institute PAGE 44
AT A GLANCE Law Enforcement Cooperation between Town of
Harrison and Calumet County. Key Success Factors: Potential for service
improvements, significant avoided costs, increased communication.
Key Benefits: Better service, department has more staff and resources than before.
Summary: The Town of Harrison began contracting out law enforcement service to Calumet County in 2005, receiving 2,080 annual hours of service (40 hours per week). The cooperation on law enforcement has led the Town to explore other cooperative ventures with neighboring municipalities, including in fire protection. The Harrison Fire Department is contracted by several area communities to provide services, and the Town has pursued multiple cooperative agreements with other towns on services they do not need on a full-time basis. This includes joint ventures with the Town of Buchanan on road paving and hiring consultants. Impetus: As the Town of Harrison has grown in population, it has also started to become more urban. The Town Board determined that the current level of service offered by the Calumet County Sheriff was insufficient for their needs and wanted more dedicated law enforcement. Barriers to Overcome: The split between the growing urban population and the existing rural population was the main hindrance in pursuing the contract. The urban residents felt that a need existed for a greater law enforcement presence while the rural population did not. Further, there was initially confusion among the residents as to why it was necessary to pay the County for services it was already providing. Lastly, the
increased cost in the Town’s budget was an initial barrier; the first contract was $70,000. Success Factors: Major success factors include a much greater law enforcement presence in the community and the sheriff being more accessible to citizens. Additionally, the Town has greater control over the sheriff’s hours in their town. In comparison to starting their own part-time department, the Town achieved savings by avoiding purchasing any physical capital and not having to provide training while still using the services of a professional department of full-time officers. Lastly, department officials said the service they are receiving is much better than they would receive from a local, part-time department. Funding Sources: The annual contract is funded through the Town of Harrison’s budget. It was initially $70,000 and increases annually with respect to standard wage rate increases. For 2009 the Town budgeted $89,000 for 2080 hours of service. The costs have stayed relatively stable since the cooperation began. Oversight/Governance: The Town Board is responsible for any decisions regarding the law enforcement contract with Calumet County.
$89,000a year gets the Town of Harrison 40 hours of weekly law enforcement service

CASE STUDY: CITY OF BELOIT AND ROCK COUNTY PUBLIC HEALTH
Baker Tilly Virchow Krause, LLP / Local Government Institute PAGE 45
AT A GLANCE Public Health Cooperation between City of Beloit
and Rock County. Key Success Factors: Clear fiscal benefits,
potential for service improvements, significant avoided costs, public forums, absorbing almost 100 percent of staff.
Key Benefits: Better service. Summary: The City of Beloit is unique in that it offered health services before Rock County did. The Rock County Public Health Department and the City of Beloit Public Health Department officially began operating as one public health department on January 1, 2007. Discussion began in fall of 2004 on a possible merger and the decision to consolidate services was reached in fall of 2006. Impetus: Staff said the looming retirement of officials at the Public Health Departments made the consolidation of services easier to discuss. Also, around 2004, the State of Wisconsin changed State laws and no longer allowed cities to provide health services. Though existing cities were grandfathered in, staff says it was quite obvious the State preferred health services to be administered at the County level. Fiscal pressures also existed for both Rock County and Beloit. Barriers to Overcome: Convincing the residents of Beloit they would receive the same level of service in the same service areas after the consolidation proved difficult. Rock County agreed to determine if future services would change for residents of Beloit under the proposed cooperation. Staff said that the simple process of putting a plan down on paper for residents to read greatly increased the understanding and support of the merger.
Success Factors: Public hearings were held, a fact that was cited as a major turning point. Further, the County absorbed all of the City health staff and committed to having a health office in Beloit. Obvious fiscal benefits contributed to the success of this merger. Very often these took the form of reducing redundancies, such as eliminating one health director in order to have a countywide director, or having one agency that is able to present a unified response to health crises, such as the current H1N1 outbreak. The Public Health Department has been able to provide its services in a more efficient manner while still maintaining the same level of services as before. Lastly, initial projected savings proved very accurate and the department has stayed on target throughout its existence. Costs at the county level rose very minimally while Beloit’s costs decreased. Funding Sources: Before the cooperation began, Rock County Public Health was funded via tax levy funds. However, the taxes from the residents of Beloit were going towards the City of Beloit’s Public Health Department and not Rock County’s Department. Since the consolidation, Beloit taxpayer money now goes to the County as well. Oversight/Governance: The Rock County Health Board oversees the department. The County has committed to giving the next vacancy on the board to a Beloit resident. Although this practice is not legally required, officials indicated it is likely to continue.
Once citizens could see that their services would not decrease they
were much more supportive.“
”Case Study Interviewee

CASE STUDY: TOWN OF MERTON EMERGENCY MEDICAL SERVICE
Baker Tilly Virchow Krause, LLP / Local Government Institute PAGE 46
AT A GLANCE EMS Cooperation between Town of Merton, City of
Delafield and Village of Sussex. Key Success Factors: Taking initiative, clear fiscal
benefits, potential for service improvements, significant avoided costs.
Key Benefits: Better service. Summary: In 2003, the City of Delafield provided advanced life support (ALS) intercepts to area communities. Though Merton’s firefighters were also trained EMT-Basics, they were not certified at the same level as Delafield’s EMT-Paramedics. The Fire Chief of the Merton Fire Department noticed that Merton was increasingly using Delafield’s services. At this time, Delafield’s Fire Chief contacted the Fire Chiefs in Merton and Sussex and a proposal was crafted to station an ambulance in Merton five days a week for ten hours each day. Currently, there is an EMT-Paramedic stationed in either Merton or Sussex from 7am – 5pm, 7 days per week. Impetus: A member of the Merton Fire Department who had previously worked in another department that cooperated on ALS intercept presented the idea of cooperating to the Merton Fire Chief. Both the Merton Chief and Delafield’s Chief were interested in pursuing cooperation. After the presentation, the fire chiefs contacted one another to discuss possible options.
Barriers to Overcome: Both chiefs spoke in front of each other’s municipality’s board members. Some board members did not see the need for access to paramedic service since Merton was capable of handling EMT-Basic calls, which represent roughly 80 percent of all emergency calls. However, within the first year, the access to Delafield’s paramedics saved several lives, convincing skeptical board members of the importance of paramedics. Progress was made at a much higher pace after several larger communities in the area determined they were not interested in participating in cooperative efforts. Success Factors: Several factors led to the successful implementation of this proposal. First, Delafield’s Fire Chief took the initiative and contacted the Fire Chiefs in Merton and Sussex, opening the discussion. Also, officials said having three fire chiefs committed to the idea and that actively sought cooperation was vital to success. Since the cooperation started in 2006, Merton has been able to provide ALS intercepts while making the Fire Department more cost effective. It has also given the Town and Village access to paramedics without having to pay their wages or training. Funding Sources: Merton and Sussex sign an annual contract with Delafield agreeing to fulfill a usage quota each year. For example, in 2008, Sussex and Merton were required to use the service 132 times. If the municipalities don’t fulfill this quota they must pay the difference to Delafield from their respective budgets. In 2007 Merton failed to use its full allotment of calls and paid Delafield $7,680. Oversight/Governance: The Village of Merton Board, the Delafield Mayor, the Delafield City Council, and the Village of Sussex Board must all approve contracts. The Town of Merton Fire Department is a private company with a Board of Directors.
I’m concerned with doing the best we can for the patient, period. I
don’t worry about politics.“
”Case Study Interviewee
We’re getting the best of everything at a small cost to the community.“
”Case Study Interviewee
The access we gained through cooperation literally saved some
lives in the first year.“
”Case Study Interviewee
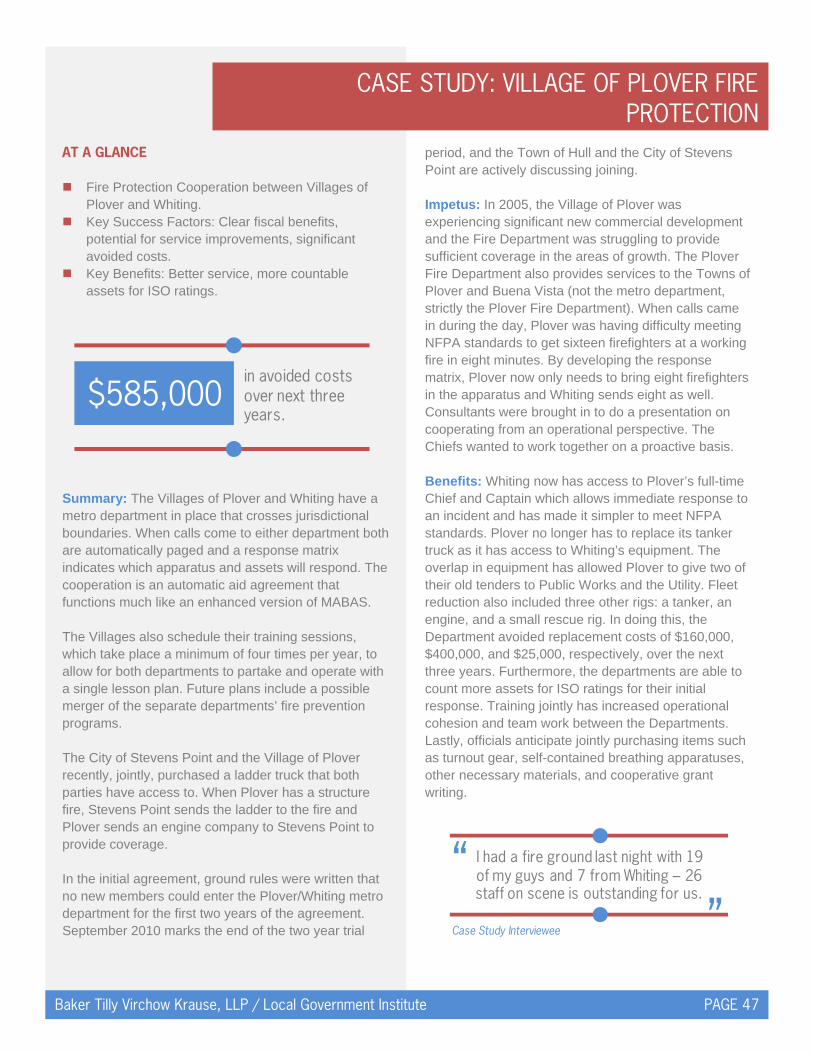
CASE STUDY: VILLAGE OF PLOVER FIRE PROTECTION
Baker Tilly Virchow Krause, LLP / Local Government Institute PAGE 47
AT A GLANCE Fire Protection Cooperation between Villages of
Plover and Whiting. Key Success Factors: Clear fiscal benefits,
potential for service improvements, significant avoided costs.
Key Benefits: Better service, more countable assets for ISO ratings.
Summary: The Villages of Plover and Whiting have a metro department in place that crosses jurisdictional boundaries. When calls come to either department both are automatically paged and a response matrix indicates which apparatus and assets will respond. The cooperation is an automatic aid agreement that functions much like an enhanced version of MABAS. The Villages also schedule their training sessions, which take place a minimum of four times per year, to allow for both departments to partake and operate with a single lesson plan. Future plans include a possible merger of the separate departments’ fire prevention programs. The City of Stevens Point and the Village of Plover recently, jointly, purchased a ladder truck that both parties have access to. When Plover has a structure fire, Stevens Point sends the ladder to the fire and Plover sends an engine company to Stevens Point to provide coverage. In the initial agreement, ground rules were written that no new members could enter the Plover/Whiting metro department for the first two years of the agreement. September 2010 marks the end of the two year trial
period, and the Town of Hull and the City of Stevens Point are actively discussing joining. Impetus: In 2005, the Village of Plover was experiencing significant new commercial development and the Fire Department was struggling to provide sufficient coverage in the areas of growth. The Plover Fire Department also provides services to the Towns of Plover and Buena Vista (not the metro department, strictly the Plover Fire Department). When calls came in during the day, Plover was having difficulty meeting NFPA standards to get sixteen firefighters at a working fire in eight minutes. By developing the response matrix, Plover now only needs to bring eight firefighters in the apparatus and Whiting sends eight as well. Consultants were brought in to do a presentation on cooperating from an operational perspective. The Chiefs wanted to work together on a proactive basis. Benefits: Whiting now has access to Plover’s full-time Chief and Captain which allows immediate response to an incident and has made it simpler to meet NFPA standards. Plover no longer has to replace its tanker truck as it has access to Whiting’s equipment. The overlap in equipment has allowed Plover to give two of their old tenders to Public Works and the Utility. Fleet reduction also included three other rigs: a tanker, an engine, and a small rescue rig. In doing this, the Department avoided replacement costs of $160,000, $400,000, and $25,000, respectively, over the next three years. Furthermore, the departments are able to count more assets for ISO ratings for their initial response. Training jointly has increased operational cohesion and team work between the Departments. Lastly, officials anticipate jointly purchasing items such as turnout gear, self-contained breathing apparatuses, other necessary materials, and cooperative grant writing.
$585,000in avoided costs over next three years.
I had a fire ground last night with 19 of my guys and 7 from Whiting – 26 staff on scene is outstanding for us.
“”Case Study Interviewee
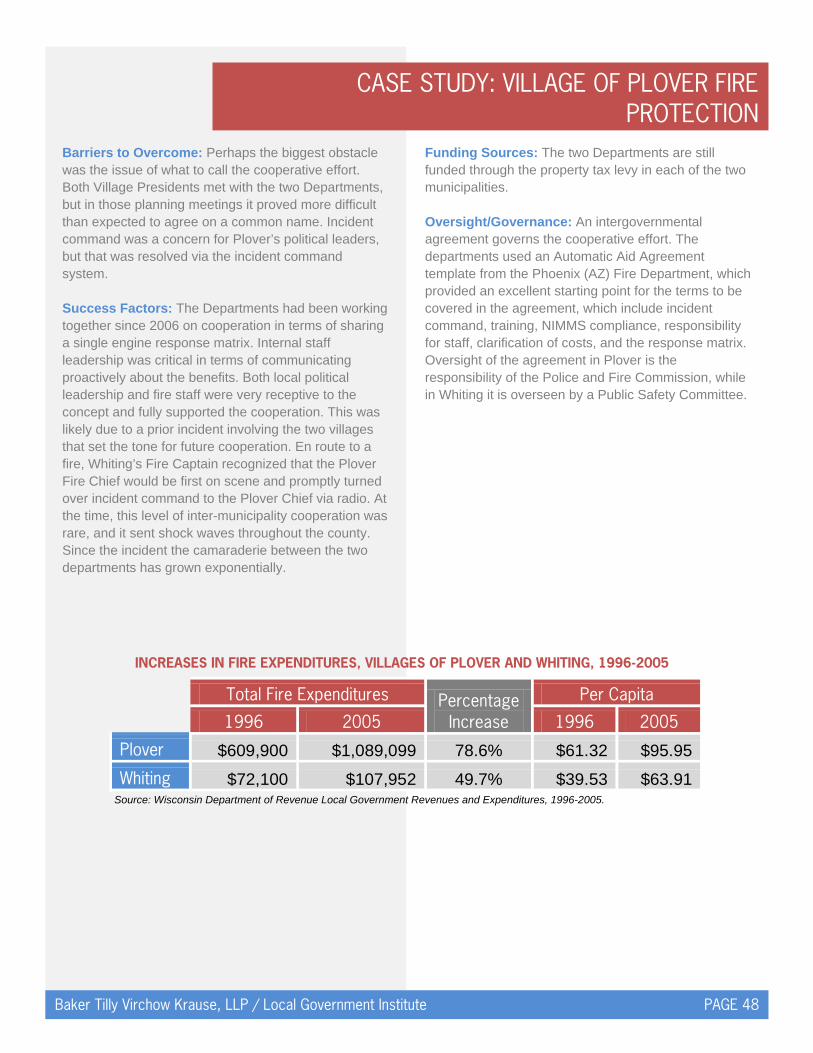
CASE STUDY: VILLAGE OF PLOVER FIRE PROTECTION
Baker Tilly Virchow Krause, LLP / Local Government Institute PAGE 48
Barriers to Overcome: Perhaps the biggest obstacle was the issue of what to call the cooperative effort. Both Village Presidents met with the two Departments, but in those planning meetings it proved more difficult than expected to agree on a common name. Incident command was a concern for Plover’s political leaders, but that was resolved via the incident command system. Success Factors: The Departments had been working together since 2006 on cooperation in terms of sharing a single engine response matrix. Internal staff leadership was critical in terms of communicating proactively about the benefits. Both local political leadership and fire staff were very receptive to the concept and fully supported the cooperation. This was likely due to a prior incident involving the two villages that set the tone for future cooperation. En route to a fire, Whiting’s Fire Captain recognized that the Plover Fire Chief would be first on scene and promptly turned over incident command to the Plover Chief via radio. At the time, this level of inter-municipality cooperation was rare, and it sent shock waves throughout the county. Since the incident the camaraderie between the two departments has grown exponentially.
Funding Sources: The two Departments are still funded through the property tax levy in each of the two municipalities. Oversight/Governance: An intergovernmental agreement governs the cooperative effort. The departments used an Automatic Aid Agreement template from the Phoenix (AZ) Fire Department, which provided an excellent starting point for the terms to be covered in the agreement, which include incident command, training, NIMMS compliance, responsibility for staff, clarification of costs, and the response matrix. Oversight of the agreement in Plover is the responsibility of the Police and Fire Commission, while in Whiting it is overseen by a Public Safety Committee.
Total Fire Expenditures PercentageIncrease
Per Capita
1996 2005 1996 2005
Plover $609,900 $1,089,099 78.6% $61.32 $95.95
Whiting $72,100 $107,952 49.7% $39.53 $63.91
INCREASES IN FIRE EXPENDITURES, VILLAGES OF PLOVER AND WHITING, 1996-2005
Source: Wisconsin Department of Revenue Local Government Revenues and Expenditures, 1996-2005.

CASE STUDY: CITY OF PRESCOTT FIRE PROTECTION
Baker Tilly Virchow Krause, LLP / Local Government Institute PAGE 49
AT A GLANCE Fire Protection Cooperation between City of
Prescott, Towns of Oak Grove and Town of Clifton. Key Success Factors: Public forums, improved
transparency. Key Benefits: Better service. Summary: In 2005, the Towns of Clifton and Oak Grove signed an agreement for fire protection services with the City of Prescott. As part of the agreement, each of the three municipalities now spend the same amount per capita on fire services, a feature that initially increased the costs in the Towns of Clifton and Oak Grove. Impetus: Before the agreement was signed, the Towns of Clifton and Oak Grove received fire service from Prescott but had no input on the fees or rate structure being charged. In 2003, the three municipalities began meeting to discuss cooperation. In April 2005, an agreement was signed by all three parties. Barriers to Overcome: The primary pushback came from fire and emergency medical service members who were wary of change to the existing system and setup. The community was supportive of the idea even though town residents would see their taxes increase. The townships, however, had one requirement: they wanted to know how their money was being spent and wanted representation on any board or council that governed the association. Lastly, incorporating Wisconsin Statute 62.13 (related to fire and police department oversight) into the agreement proved difficult.
Success Factors: The proposed cooperation was printed in area newspapers to inform the public. Also, a minimum of eighteen public forums during the 18 month deliberation period were held (town board and city council meetings, focus groups, and listening sessions). The cooperative effort has stressed complete transparency. The residents know the budget and know what they are paying for. The Chairman of the Board requires a high level of transparency so residents can easily understand the budget and know exactly the services they are paying for. Funding Sources: When the agreement took effect it raised the townships’ expenditures for fire services. Every resident of the Towns of Clifton and Oak Grove and the City of Prescott pay the same amount for fire service (same per capita expenditure in each municipality). User fees are assessed per call for ambulance and fire services. Oversight/Governance: A seven member board governs the department: three from the City of Prescott and two from each of the towns (written into agreement). The board meets annually to vote on a president and vice president and to update population figures. There is not really any temporal component to the agreement (e.g. doesn’t need to be renewed annually); however, if any of the members decide they are no longer interested in participating they must first settle all debts before exiting the agreement.
Everybody knows what everybody is doing. Towns know what fire and
ambulance are doing, and so does the City.
“”Case Study Interviewee

CASE STUDY: OUTAGAMIE COUNTY PLANNING AND ECONOMIC DEVELOPMENT
Baker Tilly Virchow Krause, LLP / Local Government Institute PAGE 50
AT A GLANCE Planning and Economic Development between
Brown, Calumet, Outagamie and Winnebago Counties.
Key Success Factors: Significant avoided costs. Key Benefits: Avoided duplication of services. Summary: Outagamie County has taken part in regional economic planning and development since joining the Fox Cities Economic Development Partnership in 1985. The County began working with neighboring counties in the late 1990s. Impetus: The Planning and Economic Development Departments in Brown and Outagamie Counties realized they could get a greater return on their investments if they pooled their resources. Also, the staffs knew that a large number of residents crossed county lines for work daily, so working on planning and development at the county level did not make as much sense as coordinating a more regional approach. Barriers to Overcome: Politicians in all the counties worried that cooperating on development would cause jobs to leave their county and go to neighboring counties. In reality, this was already occurring at a high rate.
Success Factors: During the two years prior to the creation of the Fox Cities Economic Development Partnership, an impact analysis was performed. The trust and understanding that developed during these two years were invaluable to the coordinated effort moving forward. Since the Fox Cities Partnership began in 1985 it has increased in size, from 12 original communities to 18 municipalities and counties. Initially participants realized economies of scale; officials cited the constant communication between the county departments as the greatest current benefit. The professional network that has developed as a result of the cooperation has given planners an arena to discuss ideas and eliminate overlapping services. Funding Sources: Although there are no contractual or legal obligations, staff said equitable arrangements are made at an ad hoc basis, usually reflecting population figures which are updated annually. Oversight/Governance: There is no board or commission that governs the cooperation. The respective counties have Committees that present and propose recommendations to the other counties.
If we only have a specific amount of dollars, let’s make the most of it.“
”Case Study Interviewee
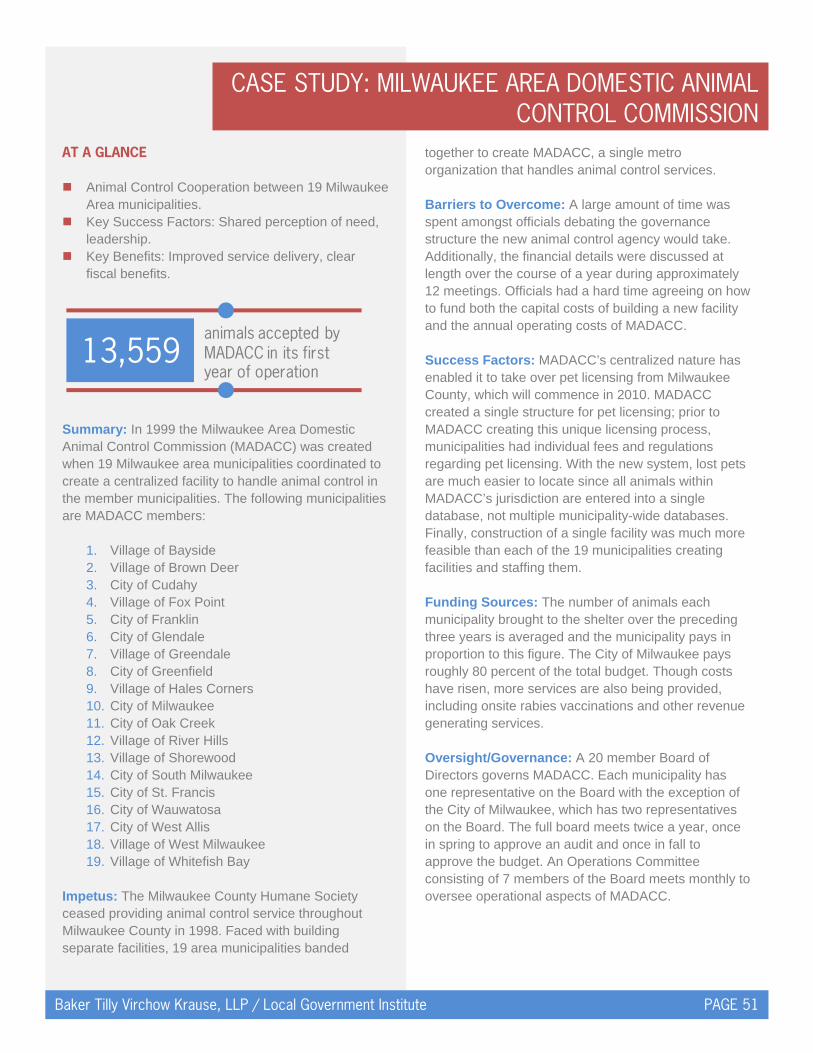
CASE STUDY: MILWAUKEE AREA DOMESTIC ANIMAL CONTROL COMMISSION
Baker Tilly Virchow Krause, LLP / Local Government Institute PAGE 51
AT A GLANCE Animal Control Cooperation between 19 Milwaukee
Area municipalities. Key Success Factors: Shared perception of need,
leadership. Key Benefits: Improved service delivery, clear
fiscal benefits. Summary: In 1999 the Milwaukee Area Domestic Animal Control Commission (MADACC) was created when 19 Milwaukee area municipalities coordinated to create a centralized facility to handle animal control in the member municipalities. The following municipalities are MADACC members:
1. Village of Bayside 2. Village of Brown Deer 3. City of Cudahy 4. Village of Fox Point 5. City of Franklin 6. City of Glendale 7. Village of Greendale 8. City of Greenfield 9. Village of Hales Corners 10. City of Milwaukee 11. City of Oak Creek 12. Village of River Hills 13. Village of Shorewood 14. City of South Milwaukee 15. City of St. Francis 16. City of Wauwatosa 17. City of West Allis 18. Village of West Milwaukee 19. Village of Whitefish Bay
Impetus: The Milwaukee County Humane Society ceased providing animal control service throughout Milwaukee County in 1998. Faced with building separate facilities, 19 area municipalities banded
together to create MADACC, a single metro organization that handles animal control services. Barriers to Overcome: A large amount of time was spent amongst officials debating the governance structure the new animal control agency would take. Additionally, the financial details were discussed at length over the course of a year during approximately 12 meetings. Officials had a hard time agreeing on how to fund both the capital costs of building a new facility and the annual operating costs of MADACC. Success Factors: MADACC’s centralized nature has enabled it to take over pet licensing from Milwaukee County, which will commence in 2010. MADACC created a single structure for pet licensing; prior to MADACC creating this unique licensing process, municipalities had individual fees and regulations regarding pet licensing. With the new system, lost pets are much easier to locate since all animals within MADACC’s jurisdiction are entered into a single database, not multiple municipality-wide databases. Finally, construction of a single facility was much more feasible than each of the 19 municipalities creating facilities and staffing them. Funding Sources: The number of animals each municipality brought to the shelter over the preceding three years is averaged and the municipality pays in proportion to this figure. The City of Milwaukee pays roughly 80 percent of the total budget. Though costs have risen, more services are also being provided, including onsite rabies vaccinations and other revenue generating services. Oversight/Governance: A 20 member Board of Directors governs MADACC. Each municipality has one representative on the Board with the exception of the City of Milwaukee, which has two representatives on the Board. The full board meets twice a year, once in spring to approve an audit and once in fall to approve the budget. An Operations Committee consisting of 7 members of the Board meets monthly to oversee operational aspects of MADACC.
13,559animals accepted by MADACC in its first year of operation
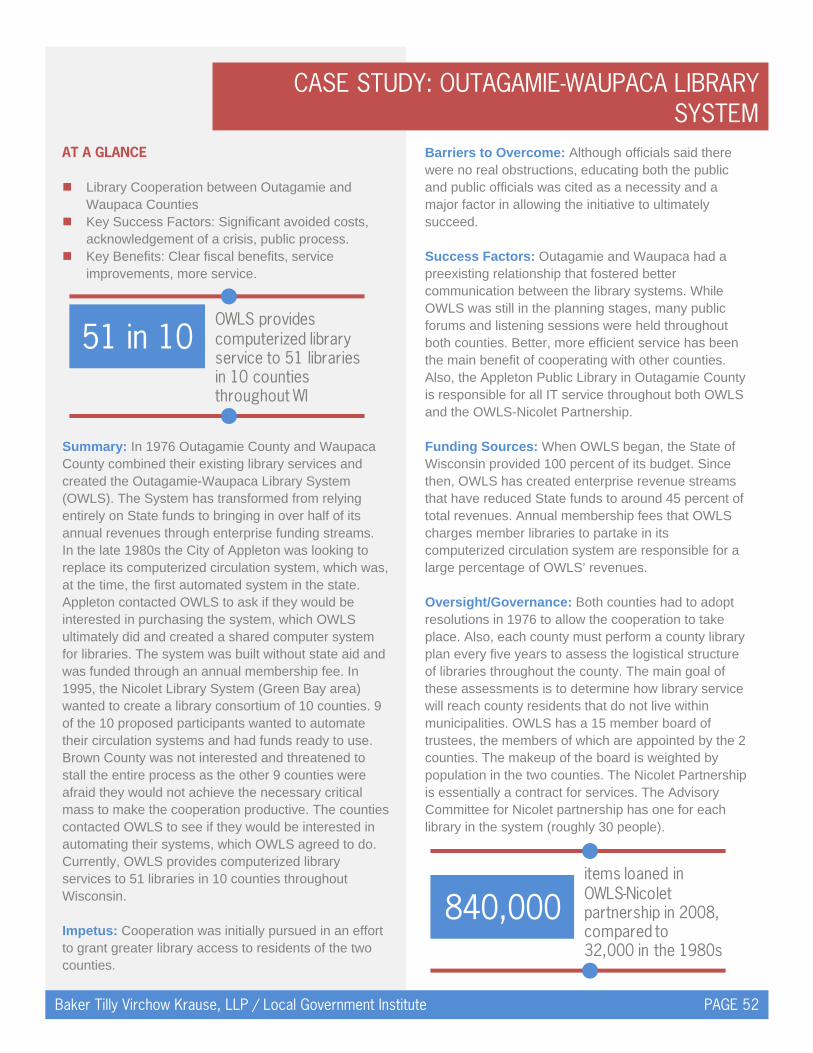
CASE STUDY: OUTAGAMIE-WAUPACA LIBRARY SYSTEM
Baker Tilly Virchow Krause, LLP / Local Government Institute PAGE 52
AT A GLANCE Library Cooperation between Outagamie and
Waupaca Counties Key Success Factors: Significant avoided costs,
acknowledgement of a crisis, public process. Key Benefits: Clear fiscal benefits, service
improvements, more service. Summary: In 1976 Outagamie County and Waupaca County combined their existing library services and created the Outagamie-Waupaca Library System (OWLS). The System has transformed from relying entirely on State funds to bringing in over half of its annual revenues through enterprise funding streams. In the late 1980s the City of Appleton was looking to replace its computerized circulation system, which was, at the time, the first automated system in the state. Appleton contacted OWLS to ask if they would be interested in purchasing the system, which OWLS ultimately did and created a shared computer system for libraries. The system was built without state aid and was funded through an annual membership fee. In 1995, the Nicolet Library System (Green Bay area) wanted to create a library consortium of 10 counties. 9 of the 10 proposed participants wanted to automate their circulation systems and had funds ready to use. Brown County was not interested and threatened to stall the entire process as the other 9 counties were afraid they would not achieve the necessary critical mass to make the cooperation productive. The counties contacted OWLS to see if they would be interested in automating their systems, which OWLS agreed to do. Currently, OWLS provides computerized library services to 51 libraries in 10 counties throughout Wisconsin. Impetus: Cooperation was initially pursued in an effort to grant greater library access to residents of the two counties.
Barriers to Overcome: Although officials said there were no real obstructions, educating both the public and public officials was cited as a necessity and a major factor in allowing the initiative to ultimately succeed. Success Factors: Outagamie and Waupaca had a preexisting relationship that fostered better communication between the library systems. While OWLS was still in the planning stages, many public forums and listening sessions were held throughout both counties. Better, more efficient service has been the main benefit of cooperating with other counties. Also, the Appleton Public Library in Outagamie County is responsible for all IT service throughout both OWLS and the OWLS-Nicolet Partnership. Funding Sources: When OWLS began, the State of Wisconsin provided 100 percent of its budget. Since then, OWLS has created enterprise revenue streams that have reduced State funds to around 45 percent of total revenues. Annual membership fees that OWLS charges member libraries to partake in its computerized circulation system are responsible for a large percentage of OWLS’ revenues. Oversight/Governance: Both counties had to adopt resolutions in 1976 to allow the cooperation to take place. Also, each county must perform a county library plan every five years to assess the logistical structure of libraries throughout the county. The main goal of these assessments is to determine how library service will reach county residents that do not live within municipalities. OWLS has a 15 member board of trustees, the members of which are appointed by the 2 counties. The makeup of the board is weighted by population in the two counties. The Nicolet Partnership is essentially a contract for services. The Advisory Committee for Nicolet partnership has one for each library in the system (roughly 30 people).
51 in 10OWLS provides computerized library service to 51 libraries in 10 counties throughout WI
840,000items loaned in OWLS-Nicolet partnership in 2008, compared to 32,000 in the 1980s
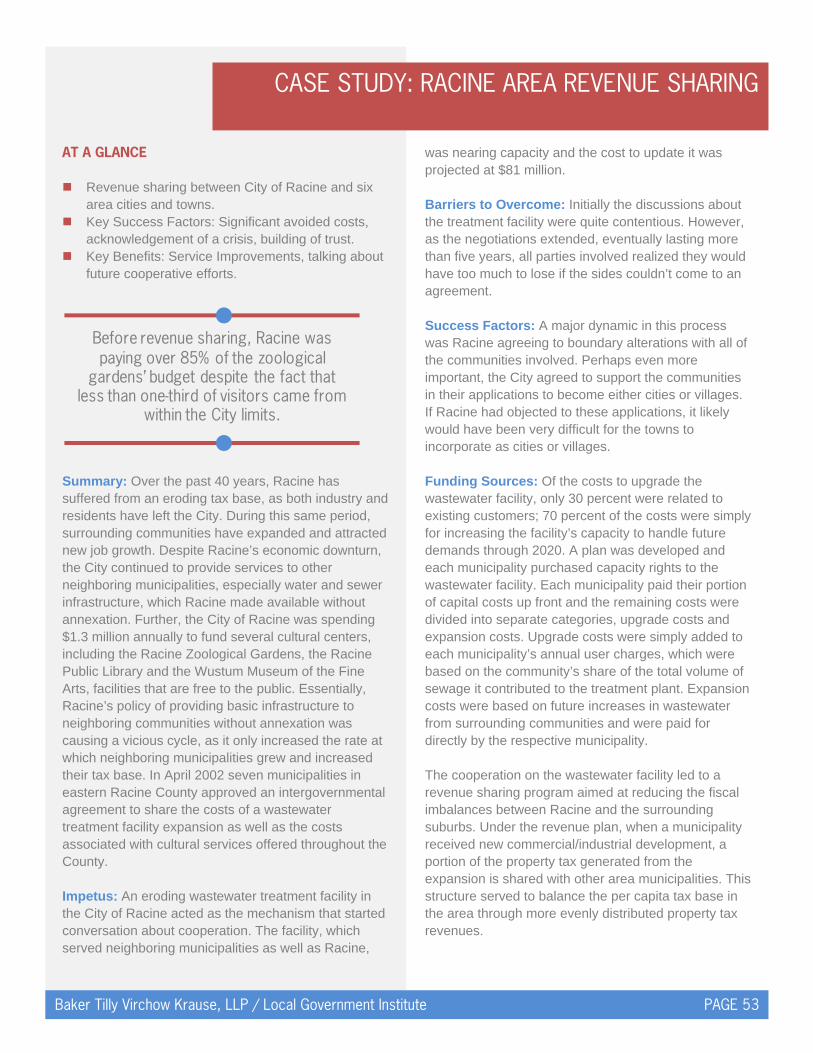
CASE STUDY: RACINE AREA REVENUE SHARING
Baker Tilly Virchow Krause, LLP / Local Government Institute PAGE 53
AT A GLANCE Revenue sharing between City of Racine and six
area cities and towns. Key Success Factors: Significant avoided costs,
acknowledgement of a crisis, building of trust. Key Benefits: Service Improvements, talking about
future cooperative efforts. Summary: Over the past 40 years, Racine has suffered from an eroding tax base, as both industry and residents have left the City. During this same period, surrounding communities have expanded and attracted new job growth. Despite Racine’s economic downturn, the City continued to provide services to other neighboring municipalities, especially water and sewer infrastructure, which Racine made available without annexation. Further, the City of Racine was spending $1.3 million annually to fund several cultural centers, including the Racine Zoological Gardens, the Racine Public Library and the Wustum Museum of the Fine Arts, facilities that are free to the public. Essentially, Racine’s policy of providing basic infrastructure to neighboring communities without annexation was causing a vicious cycle, as it only increased the rate at which neighboring municipalities grew and increased their tax base. In April 2002 seven municipalities in eastern Racine County approved an intergovernmental agreement to share the costs of a wastewater treatment facility expansion as well as the costs associated with cultural services offered throughout the County. Impetus: An eroding wastewater treatment facility in the City of Racine acted as the mechanism that started conversation about cooperation. The facility, which served neighboring municipalities as well as Racine,
was nearing capacity and the cost to update it was projected at $81 million. Barriers to Overcome: Initially the discussions about the treatment facility were quite contentious. However, as the negotiations extended, eventually lasting more than five years, all parties involved realized they would have too much to lose if the sides couldn’t come to an agreement. Success Factors: A major dynamic in this process was Racine agreeing to boundary alterations with all of the communities involved. Perhaps even more important, the City agreed to support the communities in their applications to become either cities or villages. If Racine had objected to these applications, it likely would have been very difficult for the towns to incorporate as cities or villages. Funding Sources: Of the costs to upgrade the wastewater facility, only 30 percent were related to existing customers; 70 percent of the costs were simply for increasing the facility’s capacity to handle future demands through 2020. A plan was developed and each municipality purchased capacity rights to the wastewater facility. Each municipality paid their portion of capital costs up front and the remaining costs were divided into separate categories, upgrade costs and expansion costs. Upgrade costs were simply added to each municipality’s annual user charges, which were based on the community’s share of the total volume of sewage it contributed to the treatment plant. Expansion costs were based on future increases in wastewater from surrounding communities and were paid for directly by the respective municipality. The cooperation on the wastewater facility led to a revenue sharing program aimed at reducing the fiscal imbalances between Racine and the surrounding suburbs. Under the revenue plan, when a municipality received new commercial/industrial development, a portion of the property tax generated from the expansion is shared with other area municipalities. This structure served to balance the per capita tax base in the area through more evenly distributed property tax revenues.
Before revenue sharing, Racine was paying over 85% of the zoological
gardens’ budget despite the fact that less than one-third of visitors came from
within the City limits.

CASE STUDY: RACINE AREA REVENUE SHARING
Baker Tilly Virchow Krause, LLP / Local Government Institute PAGE 54
Finally, the municipalities wrote into the agreement that a portion of the revenues generated by the new wastewater facility would be returned to the City of Racine who would in turn use the funds for financing the zoo, library and museum. Oversight/Governance: Revenue sharing is overseen by the City of Racine Wastewater Commission. In reality, the commission represents the greater Racine area, not just the City of Racine. When the municipalities agreed on the revenue sharing plan, the existing Racine Wastewater Commission expanded from 10 to 15 board members to include representatives from each municipality taking part in the revenue sharing agreement.
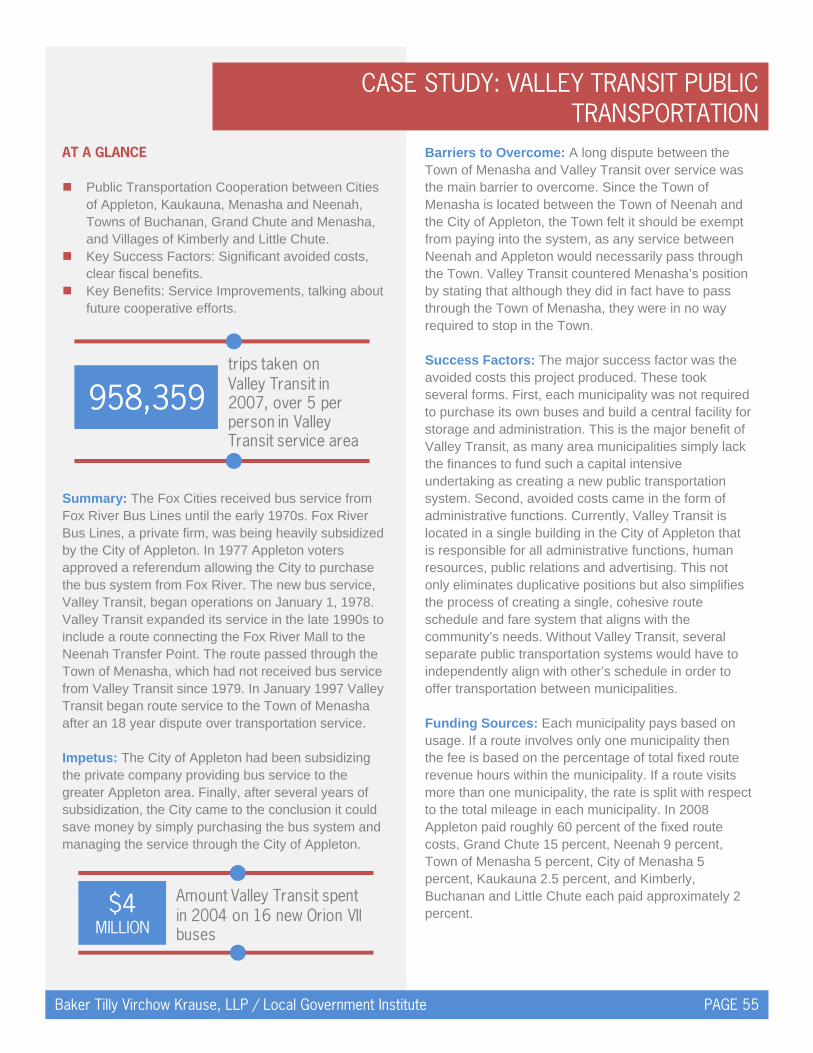
CASE STUDY: VALLEY TRANSIT PUBLIC TRANSPORTATION
Baker Tilly Virchow Krause, LLP / Local Government Institute PAGE 55
AT A GLANCE Public Transportation Cooperation between Cities
of Appleton, Kaukauna, Menasha and Neenah, Towns of Buchanan, Grand Chute and Menasha, and Villages of Kimberly and Little Chute.
Key Success Factors: Significant avoided costs, clear fiscal benefits.
Key Benefits: Service Improvements, talking about future cooperative efforts.
Summary: The Fox Cities received bus service from Fox River Bus Lines until the early 1970s. Fox River Bus Lines, a private firm, was being heavily subsidized by the City of Appleton. In 1977 Appleton voters approved a referendum allowing the City to purchase the bus system from Fox River. The new bus service, Valley Transit, began operations on January 1, 1978. Valley Transit expanded its service in the late 1990s to include a route connecting the Fox River Mall to the Neenah Transfer Point. The route passed through the Town of Menasha, which had not received bus service from Valley Transit since 1979. In January 1997 Valley Transit began route service to the Town of Menasha after an 18 year dispute over transportation service. Impetus: The City of Appleton had been subsidizing the private company providing bus service to the greater Appleton area. Finally, after several years of subsidization, the City came to the conclusion it could save money by simply purchasing the bus system and managing the service through the City of Appleton.
Barriers to Overcome: A long dispute between the Town of Menasha and Valley Transit over service was the main barrier to overcome. Since the Town of Menasha is located between the Town of Neenah and the City of Appleton, the Town felt it should be exempt from paying into the system, as any service between Neenah and Appleton would necessarily pass through the Town. Valley Transit countered Menasha’s position by stating that although they did in fact have to pass through the Town of Menasha, they were in no way required to stop in the Town. Success Factors: The major success factor was the avoided costs this project produced. These took several forms. First, each municipality was not required to purchase its own buses and build a central facility for storage and administration. This is the major benefit of Valley Transit, as many area municipalities simply lack the finances to fund such a capital intensive undertaking as creating a new public transportation system. Second, avoided costs came in the form of administrative functions. Currently, Valley Transit is located in a single building in the City of Appleton that is responsible for all administrative functions, human resources, public relations and advertising. This not only eliminates duplicative positions but also simplifies the process of creating a single, cohesive route schedule and fare system that aligns with the community’s needs. Without Valley Transit, several separate public transportation systems would have to independently align with other’s schedule in order to offer transportation between municipalities. Funding Sources: Each municipality pays based on usage. If a route involves only one municipality then the fee is based on the percentage of total fixed route revenue hours within the municipality. If a route visits more than one municipality, the rate is split with respect to the total mileage in each municipality. In 2008 Appleton paid roughly 60 percent of the fixed route costs, Grand Chute 15 percent, Neenah 9 percent, Town of Menasha 5 percent, City of Menasha 5 percent, Kaukauna 2.5 percent, and Kimberly, Buchanan and Little Chute each paid approximately 2 percent.
958,359trips taken on Valley Transit in 2007, over 5 per person in Valley Transit service area
$4MILLION
Amount Valley Transit spent in 2004 on 16 new Orion VII buses
CASE STUDY: VALLEY TRANSIT PUBLIC TRANSPORTATION
Baker Tilly Virchow Krause, LLP / Local Government Institute PAGE 56
Oversight/Governance: Valley Transit is governed by the Fox Cities Transit Commission. The Commission is responsible for all policies and procedures at Valley Transit and consists of two City Council members from Appleton, one representative from the Heart of the Valley (Buchanan, Little Chute, Kaukauna, and Kimberly), one representative from Neenah or the City of Menasha, one representative from Grand Chute or the Town of Menasha, and three residents appointed by the Mayor of Appleton. The Heart of the Valley has an internal rotation to allow residents of each municipality to serve on the commission every few years; in reality, the four municipalities have chosen to send the same official to the commission for several consecutive years as they are all satisfied with work the representative is performing. The representatives from both Neenah/City of Menasha and Grand Chute/Town of Menasha are elected to three year terms, at which point a resident of the other municipality must be elected for a three year term. The Appleton Common Council has final decision making authority over budget and major service changes.
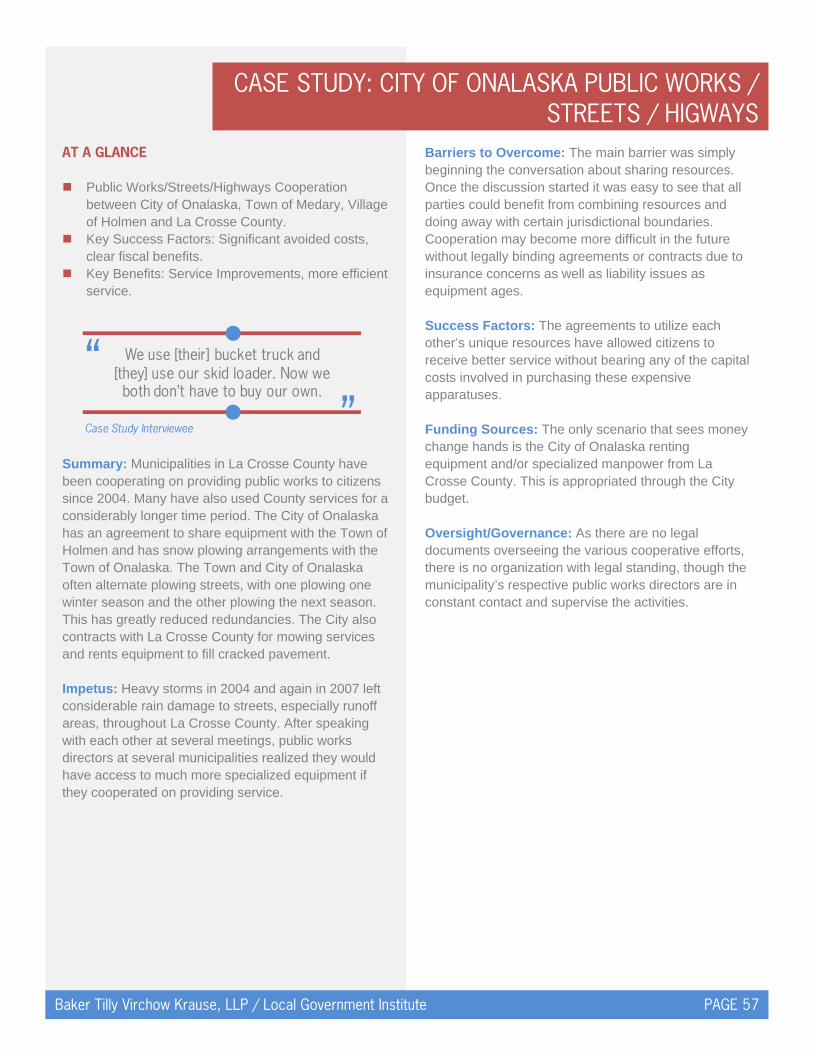
CASE STUDY: CITY OF ONALASKA PUBLIC WORKS / STREETS / HIGWAYS
Baker Tilly Virchow Krause, LLP / Local Government Institute PAGE 57
AT A GLANCE Public Works/Streets/Highways Cooperation
between City of Onalaska, Town of Medary, Village of Holmen and La Crosse County.
Key Success Factors: Significant avoided costs, clear fiscal benefits.
Key Benefits: Service Improvements, more efficient service.
Summary: Municipalities in La Crosse County have been cooperating on providing public works to citizens since 2004. Many have also used County services for a considerably longer time period. The City of Onalaska has an agreement to share equipment with the Town of Holmen and has snow plowing arrangements with the Town of Onalaska. The Town and City of Onalaska often alternate plowing streets, with one plowing one winter season and the other plowing the next season. This has greatly reduced redundancies. The City also contracts with La Crosse County for mowing services and rents equipment to fill cracked pavement. Impetus: Heavy storms in 2004 and again in 2007 left considerable rain damage to streets, especially runoff areas, throughout La Crosse County. After speaking with each other at several meetings, public works directors at several municipalities realized they would have access to much more specialized equipment if they cooperated on providing service.
Barriers to Overcome: The main barrier was simply beginning the conversation about sharing resources. Once the discussion started it was easy to see that all parties could benefit from combining resources and doing away with certain jurisdictional boundaries. Cooperation may become more difficult in the future without legally binding agreements or contracts due to insurance concerns as well as liability issues as equipment ages. Success Factors: The agreements to utilize each other’s unique resources have allowed citizens to receive better service without bearing any of the capital costs involved in purchasing these expensive apparatuses. Funding Sources: The only scenario that sees money change hands is the City of Onalaska renting equipment and/or specialized manpower from La Crosse County. This is appropriated through the City budget. Oversight/Governance: As there are no legal documents overseeing the various cooperative efforts, there is no organization with legal standing, though the municipality’s respective public works directors are in constant contact and supervise the activities.
We use [their] bucket truck and [they] use our skid loader. Now we both don’t have to buy our own.
“”Case Study Interviewee
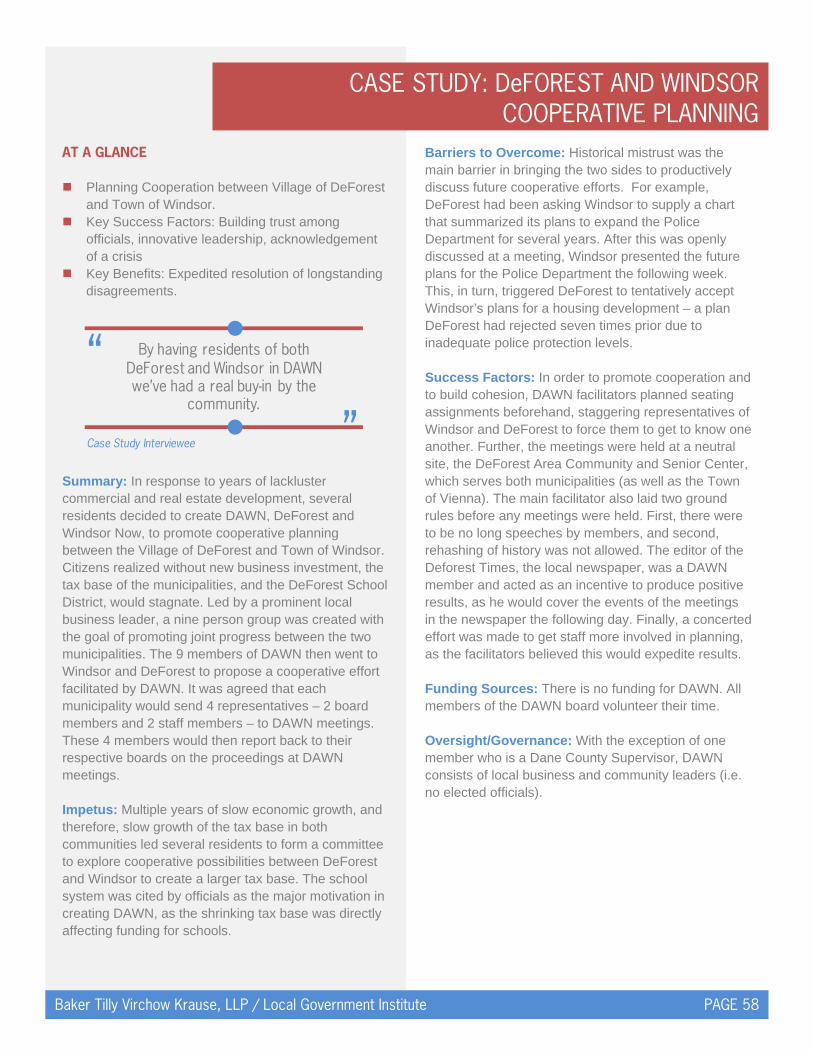
CASE STUDY: DeFOREST AND WINDSOR COOPERATIVE PLANNING
Baker Tilly Virchow Krause, LLP / Local Government Institute PAGE 58
AT A GLANCE Planning Cooperation between Village of DeForest
and Town of Windsor. Key Success Factors: Building trust among
officials, innovative leadership, acknowledgement of a crisis
Key Benefits: Expedited resolution of longstanding disagreements.
Summary: In response to years of lackluster commercial and real estate development, several residents decided to create DAWN, DeForest and Windsor Now, to promote cooperative planning between the Village of DeForest and Town of Windsor. Citizens realized without new business investment, the tax base of the municipalities, and the DeForest School District, would stagnate. Led by a prominent local business leader, a nine person group was created with the goal of promoting joint progress between the two municipalities. The 9 members of DAWN then went to Windsor and DeForest to propose a cooperative effort facilitated by DAWN. It was agreed that each municipality would send 4 representatives – 2 board members and 2 staff members – to DAWN meetings. These 4 members would then report back to their respective boards on the proceedings at DAWN meetings. Impetus: Multiple years of slow economic growth, and therefore, slow growth of the tax base in both communities led several residents to form a committee to explore cooperative possibilities between DeForest and Windsor to create a larger tax base. The school system was cited by officials as the major motivation in creating DAWN, as the shrinking tax base was directly affecting funding for schools.
Barriers to Overcome: Historical mistrust was the main barrier in bringing the two sides to productively discuss future cooperative efforts. For example, DeForest had been asking Windsor to supply a chart that summarized its plans to expand the Police Department for several years. After this was openly discussed at a meeting, Windsor presented the future plans for the Police Department the following week. This, in turn, triggered DeForest to tentatively accept Windsor’s plans for a housing development – a plan DeForest had rejected seven times prior due to inadequate police protection levels. Success Factors: In order to promote cooperation and to build cohesion, DAWN facilitators planned seating assignments beforehand, staggering representatives of Windsor and DeForest to force them to get to know one another. Further, the meetings were held at a neutral site, the DeForest Area Community and Senior Center, which serves both municipalities (as well as the Town of Vienna). The main facilitator also laid two ground rules before any meetings were held. First, there were to be no long speeches by members, and second, rehashing of history was not allowed. The editor of the Deforest Times, the local newspaper, was a DAWN member and acted as an incentive to produce positive results, as he would cover the events of the meetings in the newspaper the following day. Finally, a concerted effort was made to get staff more involved in planning, as the facilitators believed this would expedite results. Funding Sources: There is no funding for DAWN. All members of the DAWN board volunteer their time. Oversight/Governance: With the exception of one member who is a Dane County Supervisor, DAWN consists of local business and community leaders (i.e. no elected officials).
By having residents of both DeForest and Windsor in DAWN we’ve had a real buy-in by the
community.
“
”Case Study Interviewee
APPENDICES
Baker Tilly Virchow Krause, LLP / Local Government Institute PAGE 59
In the course of completing this research, we prepared several interim workpapers, summaries, and tools. These are included as Appendices, including: Appendix 1: Methodology for Correlation diagram
(units of local Government vs. Per Capita expenditures)
Appendix 2: Alternative Governmental Structures in Other Parts of the Country
Appendix 3: Survey Summary Appendix 4: Intergovernmental Cooperation Survey
Instrument Appendix 5: Focus Group Synthesis
AT A GLANCE
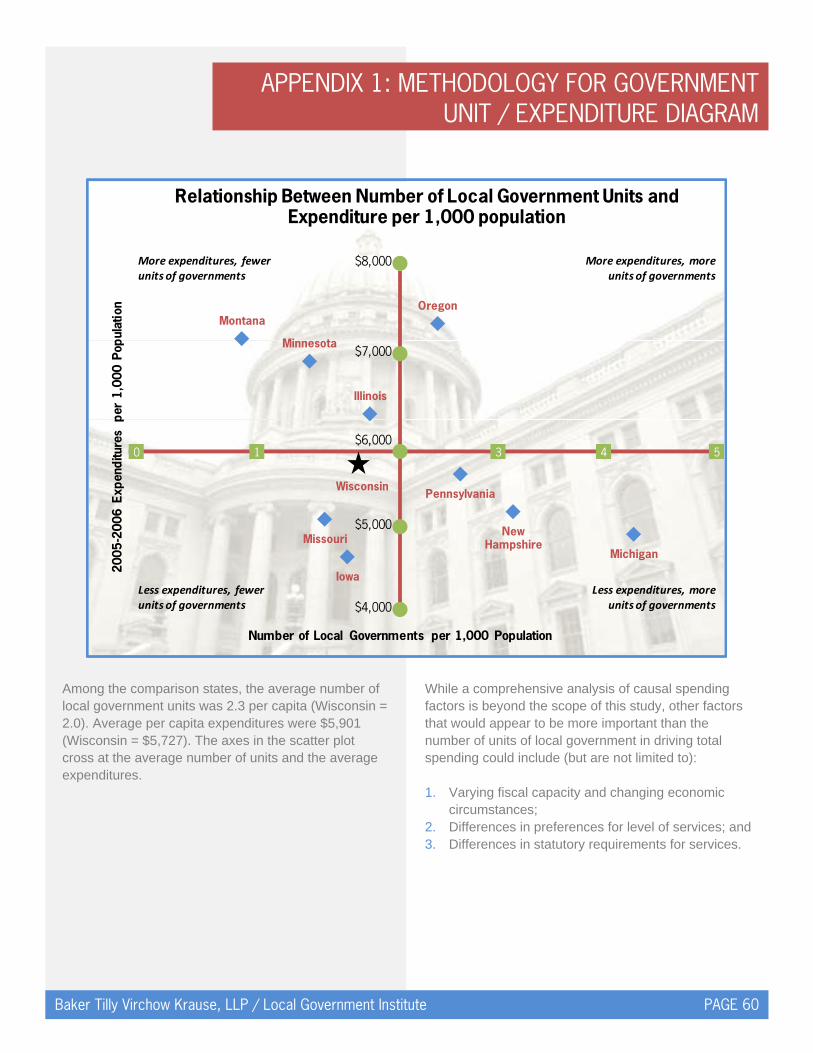
APPENDIX 1: METHODOLOGY FOR GOVERNMENT UNIT / EXPENDITURE DIAGRAM
Baker Tilly Virchow Krause, LLP / Local Government Institute PAGE 60
Among the comparison states, the average number of local government units was 2.3 per capita (Wisconsin = 2.0). Average per capita expenditures were $5,901 (Wisconsin = $5,727). The axes in the scatter plot cross at the average number of units and the average expenditures.
While a comprehensive analysis of causal spending factors is beyond the scope of this study, other factors that would appear to be more important than the number of units of local government in driving total spending could include (but are not limited to): 1. Varying fiscal capacity and changing economic
circumstances; 2. Differences in preferences for level of services; and 3. Differences in statutory requirements for services.
Oregon
$8,000
$7,000
$6,000
$5,000
$4,000
Minnesota
Montana
Illinois
WisconsinPennsylvania
New Hampshire
MichiganMissouri
Iowa
0 1 3 4 5
Relationship Between Number of Local Government Units andExpenditure per 1,000 population
2005
-200
6 Ex
pend
iture
s pe
r 1,
000
Popu
latio
n
More expenditures, fewer units of governments
Less expenditures, fewer units of governments
More expenditures, more units of governments
Less expenditures, more units of governments
Number of Local Governments per 1,000 Population
APPENDIX 1: METHODOLOGY FOR GOVERNMENT UNIT / EXPENDITURE DIAGRAM
Baker Tilly Virchow Krause, LLP / Local Government Institute PAGE 61
ASSUMPTIONS TO CORRELATION ANALYSIS Comparison states were selected based on the following eight factors: Cost of Living Increase (COLI)-adjusted per capita
personal income, Total paved road miles per capita, Dominant political culture2, Average snowfall, Local spending as a percent of total state/local
spend, COLI adjusted per capita transportation spending, COLI adjusted per capita public safety spending,
and COLI adjusted per capita social services spending. All comparison states had to be within +/- 25 percent of Wisconsin’s values for five of eight factors to be included. The closest comparison state to Wisconsin was Minnesota, which was within +/-25 percent of Wisconsin in seven of the eight comparison criteria. When comparing Minnesota and Wisconsin on a one-to-one basis, there is very little difference in the number of local governments, but there is a fairly significant ($1,285 per capita) difference in the level of expenditures (Minnesota expenditures are higher). Local governments include counties, cities, villages, towns, and special districts. Local government spending includes the following service spending categories as defined by the US Census Bureau: social services and income maintenance, transportation, public safety, environment and housing, Governmental administration, utility, general, and insurance cost.
2 See Elazar, American Federalism: A View from the States, 1972.
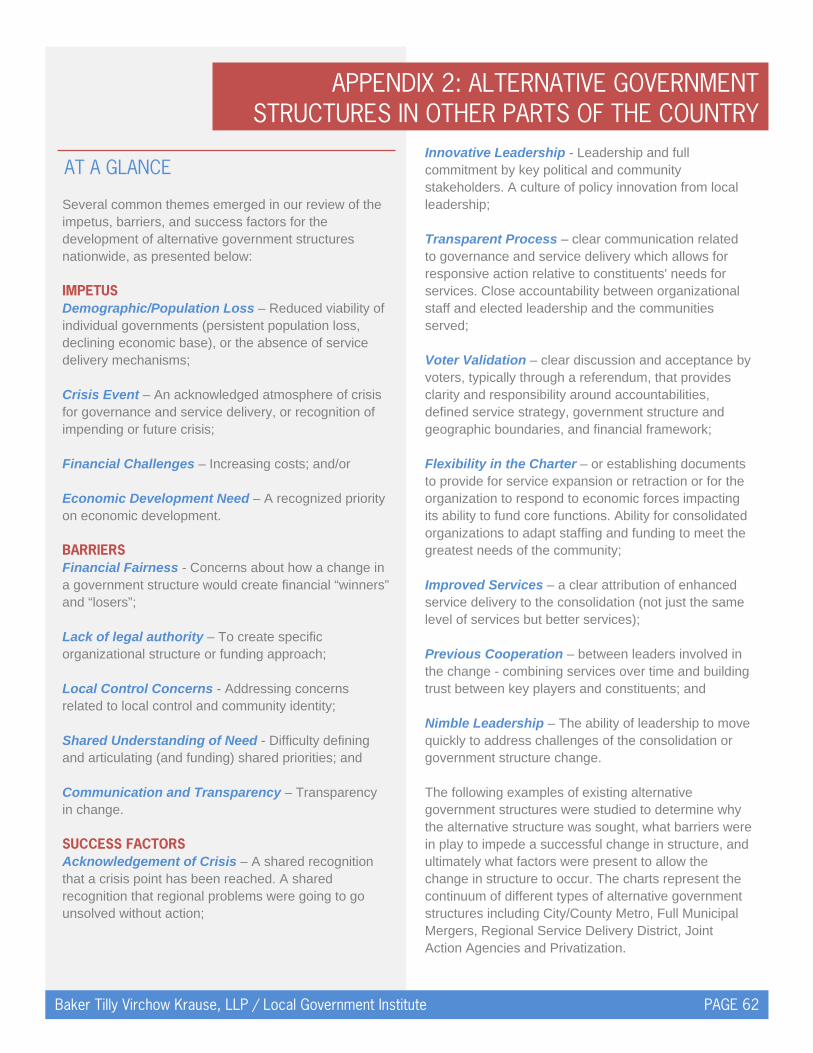
APPENDIX 2: ALTERNATIVE GOVERNMENT STRUCTURES IN OTHER PARTS OF THE COUNTRY
Baker Tilly Virchow Krause, LLP / Local Government Institute PAGE 62
Several common themes emerged in our review of the impetus, barriers, and success factors for the development of alternative government structures nationwide, as presented below: IMPETUS Demographic/Population Loss – Reduced viability of individual governments (persistent population loss, declining economic base), or the absence of service delivery mechanisms; Crisis Event – An acknowledged atmosphere of crisis for governance and service delivery, or recognition of impending or future crisis; Financial Challenges – Increasing costs; and/or Economic Development Need – A recognized priority on economic development. BARRIERS Financial Fairness - Concerns about how a change in a government structure would create financial “winners” and “losers”; Lack of legal authority – To create specific organizational structure or funding approach; Local Control Concerns - Addressing concerns related to local control and community identity; Shared Understanding of Need - Difficulty defining and articulating (and funding) shared priorities; and Communication and Transparency – Transparency in change. SUCCESS FACTORS Acknowledgement of Crisis – A shared recognition that a crisis point has been reached. A shared recognition that regional problems were going to go unsolved without action;
Innovative Leadership - Leadership and full commitment by key political and community stakeholders. A culture of policy innovation from local leadership; Transparent Process – clear communication related to governance and service delivery which allows for responsive action relative to constituents' needs for services. Close accountability between organizational staff and elected leadership and the communities served; Voter Validation – clear discussion and acceptance by voters, typically through a referendum, that provides clarity and responsibility around accountabilities, defined service strategy, government structure and geographic boundaries, and financial framework; Flexibility in the Charter – or establishing documents to provide for service expansion or retraction or for the organization to respond to economic forces impacting its ability to fund core functions. Ability for consolidated organizations to adapt staffing and funding to meet the greatest needs of the community; Improved Services – a clear attribution of enhanced service delivery to the consolidation (not just the same level of services but better services); Previous Cooperation – between leaders involved in the change - combining services over time and building trust between key players and constituents; and Nimble Leadership – The ability of leadership to move quickly to address challenges of the consolidation or government structure change. The following examples of existing alternative government structures were studied to determine why the alternative structure was sought, what barriers were in play to impede a successful change in structure, and ultimately what factors were present to allow the change in structure to occur. The charts represent the continuum of different types of alternative government structures including City/County Metro, Full Municipal Mergers, Regional Service Delivery District, Joint Action Agencies and Privatization.
AT A GLANCE
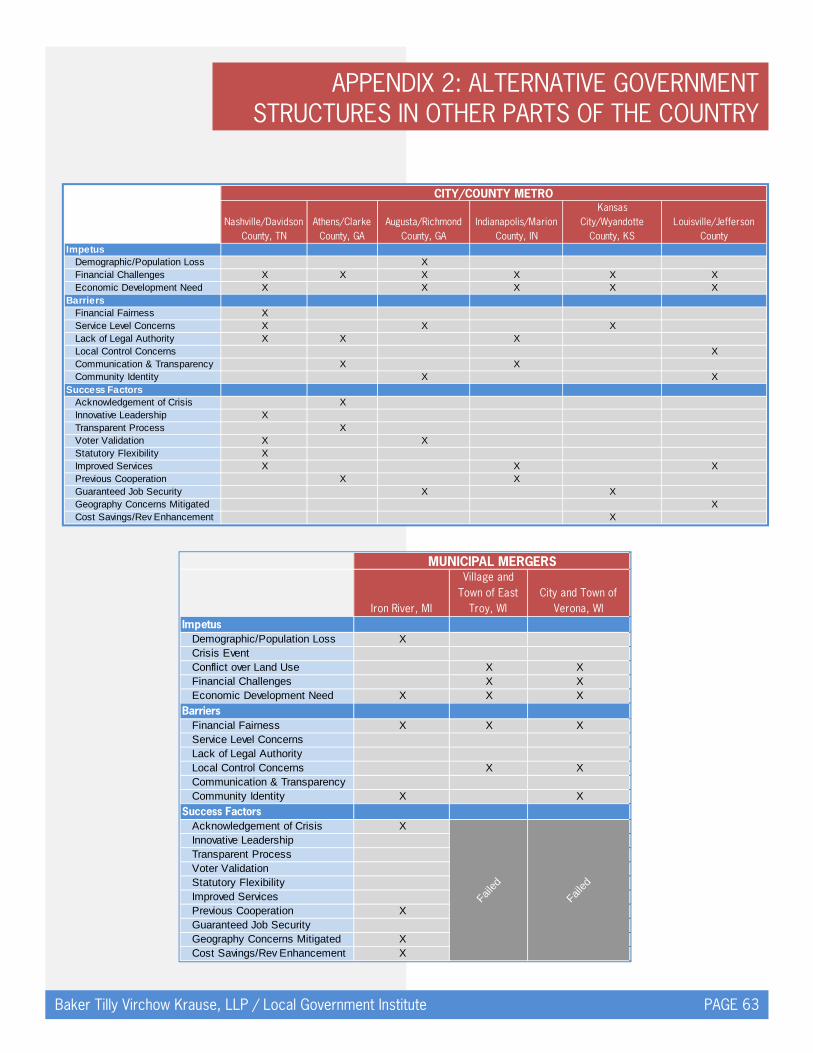
APPENDIX 2: ALTERNATIVE GOVERNMENT STRUCTURES IN OTHER PARTS OF THE COUNTRY
Baker Tilly Virchow Krause, LLP / Local Government Institute PAGE 63
Nashville/Davidson County, TN
Athens/Clarke County, GA
Augusta/Richmond County, GA
Indianapolis/Marion County, IN
Kansas City/Wyandotte
County, KSLouisville/Jefferson
CountyImpetus
Demographic/Population Loss XFinancial Challenges X X X X X XEconomic Development Need X X X X X
BarriersFinancial Fairness XService Level Concerns X X XLack of Legal Authority X X XLocal Control Concerns XCommunication & Transparency X XCommunity Identity X X
Success FactorsAcknowledgement of Crisis XInnovative Leadership XTransparent Process XVoter Validation X XStatutory Flexibility XImproved Services X X XPrevious Cooperation X XGuaranteed Job Security X XGeography Concerns Mitigated XCost Savings/Rev Enhancement X
CITY/COUNTY METRO
Iron River, MI
Village and Town of East
Troy, WICity and Town of
Verona, WIImpetus
Demographic/Population Loss XCrisis EventConflict over Land Use X XFinancial Challenges X XEconomic Development Need X X X
BarriersFinancial Fairness X X XService Level ConcernsLack of Legal AuthorityLocal Control Concerns X XCommunication & TransparencyCommunity Identity X X
Success Factors
MUNICIPAL MERGERS
Failed
Failed
Acknowledgement of Crisis XInnovative LeadershipTransparent ProcessVoter ValidationStatutory FlexibilityImproved ServicesPrevious Cooperation XGuaranteed Job SecurityGeography Concerns Mitigated XCost Savings/Rev Enhancement X
Failed
Failed

APPENDIX 2: ALTERNATIVE GOVERNMENT STRUCTURES IN OTHER PARTS OF THE COUNTRY
Baker Tilly Virchow Krause, LLP / Local Government Institute PAGE 64
PRIVATIZATIONSandy Springs, GA Portland Metro ALF LOGIS MADACC
ImpetusDemographic/Population Loss XCrisis Event X X XConflict over Land UseFinancial Challenges X X X XEconomic Development Need X
BarriersFinancial Fairness X X XService Level Concerns X X XLack of Legal Authority XLocal Control Concerns X XCommunication & Transparency X XCommunity Identity
Success FactorsAcknowledgement of Crisis X XInnovative Leadership X XTransparent Process X X XVoter Validation X XStatutory FlexibilityImproved Services X X XPrevious Cooperation X X X XGuaranteed Job Security XGeography Concerns Mitigated X XCost Savings/Rev Enhancement
REGIONAL SERVICE DELIVERY ORGANIZATION JOINT ACTION AGENCY
APPENDIX 3: SURVEY SUMMARY
Baker Tilly Virchow Krause, LLP / Local Government Institute PAGE 65
The Intergovernmental Cooperation Survey was a state-wide on-line web-based survey designed to collect information on cooperative government service delivery efforts between Counties, Cities, Villages, and Towns in Wisconsin. The survey was distributed via an email invitation sent to the members of the Wisconsin Counties Association, the Wisconsin League of Municipalities, the Wisconsin Alliance of Cities, and the “urban town” members of the Wisconsin Towns Association. In addition, other members of the Wisconsin Towns Association, many of whom do not have an official email address, were also notified of the survey through the October 2009 Towns Association newsletter, and invited to participate in the survey via a link on the Towns Association website. This survey is similar in some respects to earlier surveys completed by the Wisconsin Public Policy Forum (2006), and the Wisconsin Department of Revenue (2004). Specifically, the LGI survey collected information about current cooperative efforts across a series of key services, including: Fire Protection, Emergency Medical Services, Libraries, Law Enforcement, Animal Control, Public Health, Recreation & Culture, Recycling, Public Transportation, Solid Waste Collection & Disposal, Youth Services, Human Services, Public Housing, Administrative Functions (HR, Payroll, Finance, Procurement, Building Services, Information Technology, Fleet), Planning & Economic Development, and Public Works/Streets/Highways. However, unlike the previous surveys, the LGI survey also collected information about the type of intergovernmental cooperation (i.e. sharing equipment, facilities, or programs, contracting from or to other local governments, joint departments, independent “metro” departments, etc.). Further, the survey respondents were requested to assess the potential for additional cooperative efforts in each of the service areas. Finally, the survey collected information on the “most significant” intergovernmental cooperative effort in their community, including the key benefits.
It is important to note that the survey specifically excluded Mutual Aid and Joint Purchasing, due to the prevalence of these types of cooperative efforts in Wisconsin. There are several key overall findings: As was the case in earlier surveys of
intergovernmental cooperation in Wisconsin, the survey respondents reported a significant number of cooperative efforts with other local governments. 90.6 percent of survey respondents indicated that their community currently has cooperative efforts with other local governments in at least one of the identified services;
Survey respondents had significant differences in the services they identified as having the greatest potential for additional cooperative efforts, depending on the type of local government in which they serve. This is logical, given the marked differences in the service delivery profiles of each of these types of local governments;
Although there is a long tradition of cooperative efforts between local governments in Wisconsin, the large number of responses to the survey strongly suggests that there is statewide interest in building on this tradition. Further, a significant number of survey respondents identified services for which there was potential to achieve benefit from greater intergovernmental cooperation;
On the other hand, no service received more than a 3.67 rating (out of 5) relative to the potential for greater intergovernmental cooperation in their specific community. County respondents ranked Recycling, with a 3.67 out of 5, as a service which their community should strongly consider for greater intergovernmental cooperation. Overall, the relatively lower scores may be due to the fact that respondents felt that all the “low hanging fruit” has already been picked, and that increased consolidation or shared service approaches face significant challenges to implement;
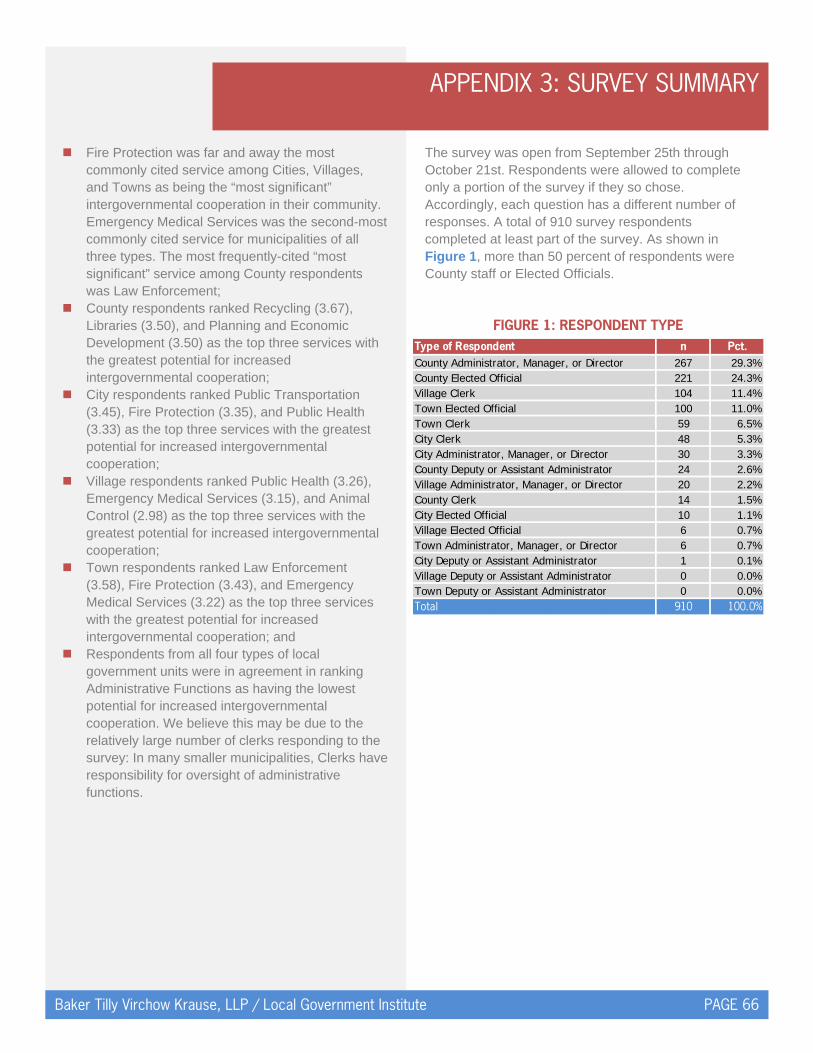
APPENDIX 3: SURVEY SUMMARY
Baker Tilly Virchow Krause, LLP / Local Government Institute PAGE 66
Fire Protection was far and away the most commonly cited service among Cities, Villages, and Towns as being the “most significant” intergovernmental cooperation in their community. Emergency Medical Services was the second-most commonly cited service for municipalities of all three types. The most frequently-cited “most significant” service among County respondents was Law Enforcement;
County respondents ranked Recycling (3.67), Libraries (3.50), and Planning and Economic Development (3.50) as the top three services with the greatest potential for increased intergovernmental cooperation;
City respondents ranked Public Transportation (3.45), Fire Protection (3.35), and Public Health (3.33) as the top three services with the greatest potential for increased intergovernmental cooperation;
Village respondents ranked Public Health (3.26), Emergency Medical Services (3.15), and Animal Control (2.98) as the top three services with the greatest potential for increased intergovernmental cooperation;
Town respondents ranked Law Enforcement (3.58), Fire Protection (3.43), and Emergency Medical Services (3.22) as the top three services with the greatest potential for increased intergovernmental cooperation; and
Respondents from all four types of local government units were in agreement in ranking Administrative Functions as having the lowest potential for increased intergovernmental cooperation. We believe this may be due to the relatively large number of clerks responding to the survey: In many smaller municipalities, Clerks have responsibility for oversight of administrative functions.
The survey was open from September 25th through October 21st. Respondents were allowed to complete only a portion of the survey if they so chose. Accordingly, each question has a different number of responses. A total of 910 survey respondents completed at least part of the survey. As shown in Figure 1, more than 50 percent of respondents were County staff or Elected Officials.
FIGURE 1: RESPONDENT TYPE
Type of Respondent n Pct.267 29.3%
County Elected Official 221 24.3%Village Clerk 104 11.4%Town Elected Official 100 11.0%Town Clerk 59 6.5%City Clerk 48 5.3%City Administrator, Manager, or Director 30 3.3%County Deputy or Assistant Administrator 24 2.6%Village Administrator, Manager, or Director 20 2.2%County Clerk 14 1.5%City Elected Official 10 1.1%Village Elected Official 6 0.7%Town Administrator, Manager, or Director 6 0.7%City Deputy or Assistant Administrator 1 0.1%Village Deputy or Assistant Administrator 0 0.0%Town Deputy or Assistant Administrator 0 0.0%Total 910 100.0%
County Administrator, Manager, or Director
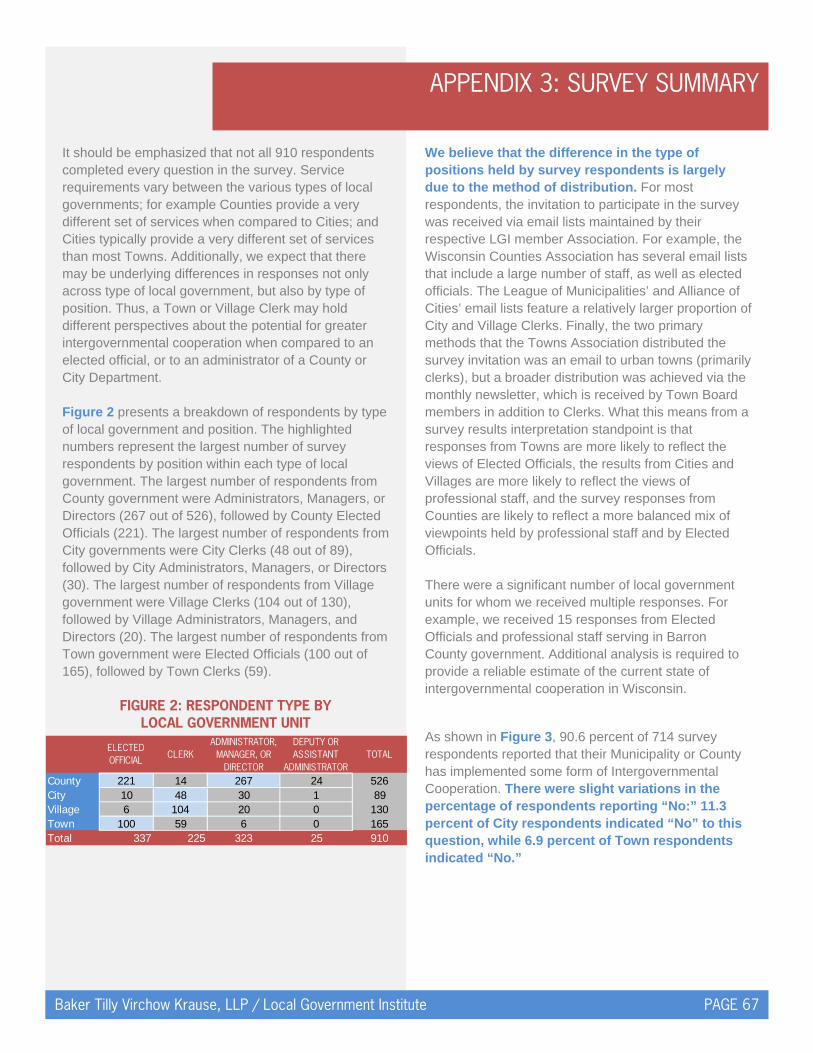
APPENDIX 3: SURVEY SUMMARY
Baker Tilly Virchow Krause, LLP / Local Government Institute PAGE 67
It should be emphasized that not all 910 respondents completed every question in the survey. Service requirements vary between the various types of local governments; for example Counties provide a very different set of services when compared to Cities; and Cities typically provide a very different set of services than most Towns. Additionally, we expect that there may be underlying differences in responses not only across type of local government, but also by type of position. Thus, a Town or Village Clerk may hold different perspectives about the potential for greater intergovernmental cooperation when compared to an elected official, or to an administrator of a County or City Department. Figure 2 presents a breakdown of respondents by type of local government and position. The highlighted numbers represent the largest number of survey respondents by position within each type of local government. The largest number of respondents from County government were Administrators, Managers, or Directors (267 out of 526), followed by County Elected Officials (221). The largest number of respondents from City governments were City Clerks (48 out of 89), followed by City Administrators, Managers, or Directors (30). The largest number of respondents from Village government were Village Clerks (104 out of 130), followed by Village Administrators, Managers, and Directors (20). The largest number of respondents from Town government were Elected Officials (100 out of 165), followed by Town Clerks (59).
FIGURE 2: RESPONDENT TYPE BY LOCAL GOVERNMENT UNIT
We believe that the difference in the type of positions held by survey respondents is largely due to the method of distribution. For most respondents, the invitation to participate in the survey was received via email lists maintained by their respective LGI member Association. For example, the Wisconsin Counties Association has several email lists that include a large number of staff, as well as elected officials. The League of Municipalities’ and Alliance of Cities’ email lists feature a relatively larger proportion of City and Village Clerks. Finally, the two primary methods that the Towns Association distributed the survey invitation was an email to urban towns (primarily clerks), but a broader distribution was achieved via the monthly newsletter, which is received by Town Board members in addition to Clerks. What this means from a survey results interpretation standpoint is that responses from Towns are more likely to reflect the views of Elected Officials, the results from Cities and Villages are more likely to reflect the views of professional staff, and the survey responses from Counties are likely to reflect a more balanced mix of viewpoints held by professional staff and by Elected Officials. There were a significant number of local government units for whom we received multiple responses. For example, we received 15 responses from Elected Officials and professional staff serving in Barron County government. Additional analysis is required to provide a reliable estimate of the current state of intergovernmental cooperation in Wisconsin.
As shown in Figure 3, 90.6 percent of 714 survey respondents reported that their Municipality or County has implemented some form of Intergovernmental Cooperation. There were slight variations in the percentage of respondents reporting “No:” 11.3 percent of City respondents indicated “No” to this question, while 6.9 percent of Town respondents indicated “No.”
ELECTED OFFICIAL
CLERKADMINISTRATOR,
MANAGER, OR DIRECTOR
DEPUTY OR ASSISTANT
ADMINISTRATORTOTAL
County 221 14 267 24 526City 10 48 30 1 89Village 6 104 20 0 130Town 100 59 6 0 165Total 337 225 323 25 910

APPENDIX 3: SURVEY SUMMARY
Baker Tilly Virchow Krause, LLP / Local Government Institute PAGE 68
FIGURE 3: HAS YOUR MUNICIPALITY OR COUNTY IMPLEMENTED INTERGOVERNMENTAL
COOPERATION? BY TYPE OF LOCAL GOVERNMENT
There were significant differences in the ratings provided by survey respondents in the services their County or Municipality should strongly consider for consolidation into a "Metro" agency, joint service delivery, shared facilities, equipment, or programs, or shared services with other local governments. As shown on Figure 4, the top three services ranked by County respondents were not ranked as highly by respondents from municipalities. There were three services (Fire Protection, Public Health, EMS) that Cities, Villages, and Towns ranked as having strong potential for greater cooperative efforts, although the order and ranking varied, as did the relative ranked scores.
FIGURE 4 TOP THREE SERVICES WITH HIGHEST POTENTIAL
FOR INCREASED INTERGOVERNMENTAL COOPERATION
BY TYPE OF LOCAL GOVERNMENT These differences are illustrative of response variances across local government type. As noted, this may be in part due to differences in service delivery mix (i.e. what is “typical” for a County, City, Village, or Town to provide). They also may be due to differences in viewpoint when comparing Elected Officials versus professional staff: Professional Staff were the largest category of respondents for Cities and Villages, while there was a greater proportion of Elected Officials among survey respondents in Towns and Counties.
As shown in Figure 5, County respondents ranked Recycling (3.67), Libraries (3.50), and Planning and Economic Development (3.50) as the top three services with the greatest potential for increased intergovernmental cooperation. The lowest ranked services were Administrative Functions (2.74), Public Housing (2.84) and Youth Services (3.01).
FIGURE 5: WHICH SERVICES SHOULD YOUR COMMUNITY STRONGLY CONSIDER FOR
CONSOLIDATION? COUNTIES
County City Village Town
Top RankedRecycling (3.67)
Public Transportation (3.45)
Public Health (3.26)Law Enforcement
(3.58)
Ranked 2ndLibraries (3.50) Fire Protection (3.35) EMS (3.15) Fire Protection (3.43)
Ranked 3rdPlanning & Econ
Development (3.50) Public Health (3.33)
Animal Control (2.98)
EMS (3.22)
n Avg
Recycling 192 3.67
Libraries 136 3.50
Planning & Econ Development 266 3.50
Law Enforcement 271 3.45
Public Works/Streets/Highways 277 3.39
Solid Waste Collection & Disposa 182 3.32
Public Transportation 213 3.32
Public Health 204 3.30
Emergency Medical Services 147 3.25
Human Services 219 3.22
Recreation & Culture 269 3.20
Animal Control 201 3.19
Fire Protection 151 3.12
Youth Services 243 3.01
Public Housing 212 2.84
Administrative Functions 305 2.74
Highest Potential - Counties
County City Village Town TotalPct. Pct. Pct. Pct. Pct.
90.0% 88.7% 90.9% 93.1% 90.6%10.0% 11.3% 9.1% 6.9% 9.4%100.0% 100.0% 100.0% 100.0% 100.0%Total
YesNo
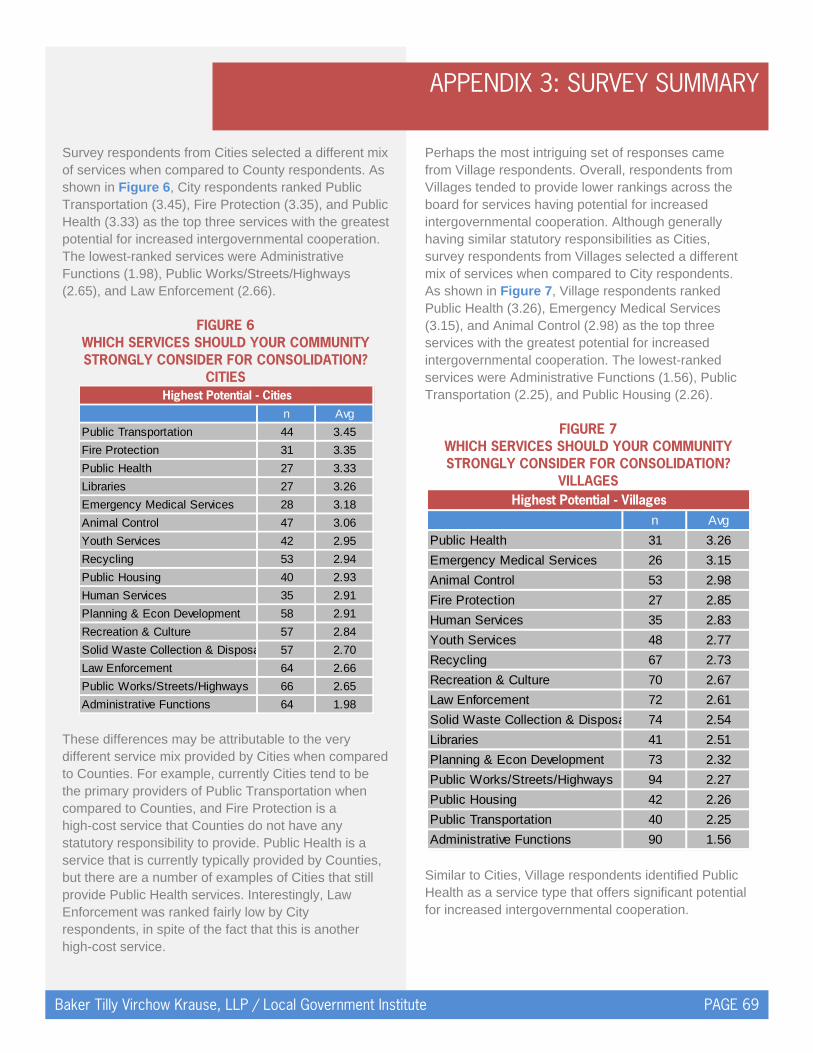
APPENDIX 3: SURVEY SUMMARY
Baker Tilly Virchow Krause, LLP / Local Government Institute PAGE 69
Survey respondents from Cities selected a different mix of services when compared to County respondents. As shown in Figure 6, City respondents ranked Public Transportation (3.45), Fire Protection (3.35), and Public Health (3.33) as the top three services with the greatest potential for increased intergovernmental cooperation. The lowest-ranked services were Administrative Functions (1.98), Public Works/Streets/Highways (2.65), and Law Enforcement (2.66).
FIGURE 6
WHICH SERVICES SHOULD YOUR COMMUNITY STRONGLY CONSIDER FOR CONSOLIDATION?
CITIES
These differences may be attributable to the very different service mix provided by Cities when compared to Counties. For example, currently Cities tend to be the primary providers of Public Transportation when compared to Counties, and Fire Protection is a high-cost service that Counties do not have any statutory responsibility to provide. Public Health is a service that is currently typically provided by Counties, but there are a number of examples of Cities that still provide Public Health services. Interestingly, Law Enforcement was ranked fairly low by City respondents, in spite of the fact that this is another high-cost service.
Perhaps the most intriguing set of responses came from Village respondents. Overall, respondents from Villages tended to provide lower rankings across the board for services having potential for increased intergovernmental cooperation. Although generally having similar statutory responsibilities as Cities, survey respondents from Villages selected a different mix of services when compared to City respondents. As shown in Figure 7, Village respondents ranked Public Health (3.26), Emergency Medical Services (3.15), and Animal Control (2.98) as the top three services with the greatest potential for increased intergovernmental cooperation. The lowest-ranked services were Administrative Functions (1.56), Public Transportation (2.25), and Public Housing (2.26).
FIGURE 7
WHICH SERVICES SHOULD YOUR COMMUNITY STRONGLY CONSIDER FOR CONSOLIDATION?
VILLAGES
Similar to Cities, Village respondents identified Public Health as a service type that offers significant potential for increased intergovernmental cooperation.
n Avg
Public Transportation 44 3.45
Fire Protection 31 3.35
Public Health 27 3.33
Libraries 27 3.26
Emergency Medical Services 28 3.18
Animal Control 47 3.06
Youth Services 42 2.95
Recycling 53 2.94
Public Housing 40 2.93
Human Services 35 2.91
Planning & Econ Development 58 2.91
Recreation & Culture 57 2.84
Solid Waste Collection & Disposa 57 2.70
Law Enforcement 64 2.66
Public Works/Streets/Highways 66 2.65
Administrative Functions 64 1.98
Highest Potential - Cities
n Avg
Public Health 31 3.26
Emergency Medical Services 26 3.15
Animal Control 53 2.98
Fire Protection 27 2.85
Human Services 35 2.83
Youth Services 48 2.77
Recycling 67 2.73
Recreation & Culture 70 2.67
Law Enforcement 72 2.61
Solid Waste Collection & Disposa 74 2.54
Libraries 41 2.51
Planning & Econ Development 73 2.32
Public Works/Streets/Highways 94 2.27
Public Housing 42 2.26
Public Transportation 40 2.25
Administrative Functions 90 1.56
Highest Potential - Villages

APPENDIX 3: SURVEY SUMMARY
Baker Tilly Virchow Krause, LLP / Local Government Institute PAGE 70
As shown in Figure 8, Town respondents ranked Law Enforcement (3.58), Fire Protection (3.43), and Emergency Medical Services (3.22) as the top three services with the greatest potential for increased intergovernmental cooperation. Very similar to Villages, the lowest-ranked services among Town respondents were Administrative Functions (1.76), Public Housing (2.32) and Public Transportation (2.60).
FIGURE 8
WHICH SERVICES SHOULD YOUR COMMUNITY STRONGLY CONSIDER FOR CONSOLIDATION?
TOWNS
The three top-ranked services by Town respondents are all relatively high-cost; specifically Law Enforcement, Fire Protection, and Emergency Medical Services. Interestingly, Law Enforcement services are already provided to many Towns via the County Sheriff Department.
As shown in Figure 9, Fire Protection was rated by survey respondents as being the most significant current intergovernmental cooperation effort by survey respondents overall, with respondents from Cities, Villages, and Towns all selecting Fire Protection as being the most significant. On the other hand, many more County respondents cited Law Enforcement as being the most significant cooperative effort. County respondents also represented the largest percentage of responses for most of the other service types, including Planning and Economic Development, Public Works/Highways, Public Health, Libraries, Recycling, Human Services, and Solid Waste. Most of these service types are often already provided at the County level.
FIGURE 9 MOST SIGNIFICANT INTERGOVERNMENTAL
COOPERATION EFFORT IN OUR COMMUNITY
n Avg
Law Enforcement 38 3.58
Fire Protection 37 3.43
Emergency Medical Services 36 3.22
Recycling 70 3.17
Solid Waste Collection & Disposa 75 3.11
Public Health 35 3.03
Human Services 37 3.03
Animal Control 58 2.98
Public Works/Streets/Highways 85 2.94
Youth Services 41 2.90
Libraries 31 2.84
Recreation & Culture 69 2.75
Planning & Econ Development 68 2.69
Public Transportation 42 2.60
Public Housing 37 2.32
Administrative Functions 87 1.76
Highest Potential - Towns
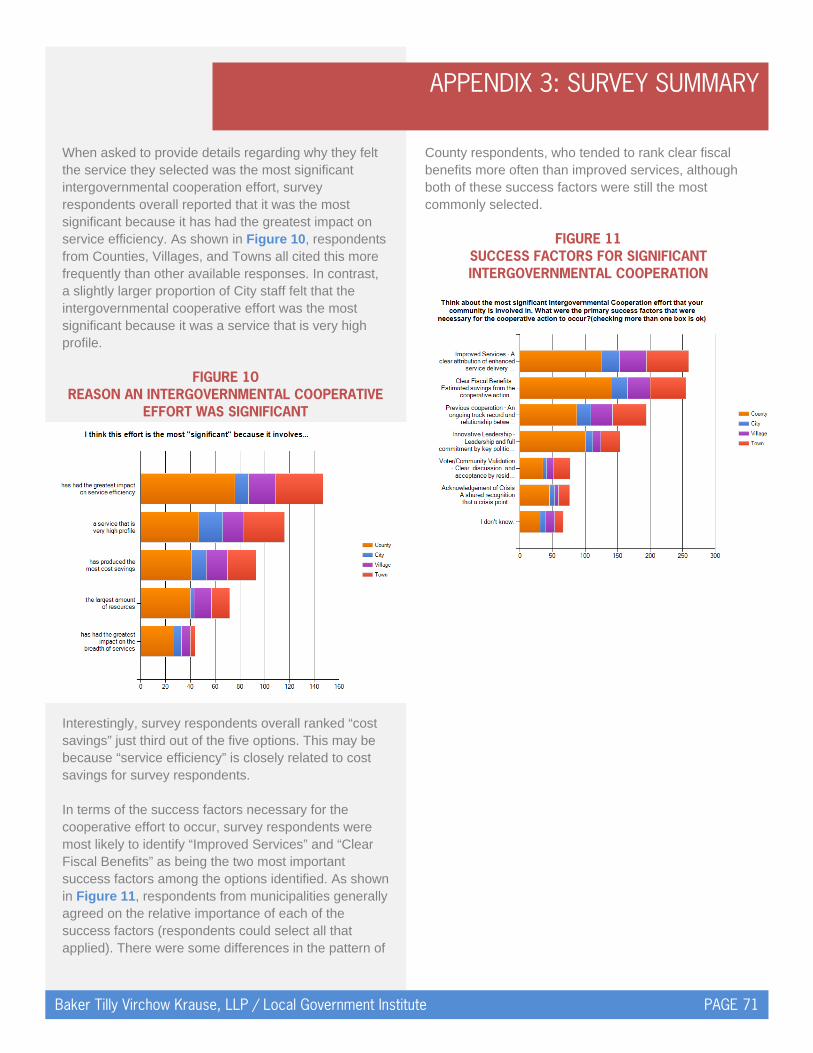
APPENDIX 3: SURVEY SUMMARY
Baker Tilly Virchow Krause, LLP / Local Government Institute PAGE 71
When asked to provide details regarding why they felt the service they selected was the most significant intergovernmental cooperation effort, survey respondents overall reported that it was the most significant because it has had the greatest impact on service efficiency. As shown in Figure 10, respondents from Counties, Villages, and Towns all cited this more frequently than other available responses. In contrast, a slightly larger proportion of City staff felt that the intergovernmental cooperative effort was the most significant because it was a service that is very high profile.
FIGURE 10 REASON AN INTERGOVERNMENTAL COOPERATIVE
EFFORT WAS SIGNIFICANT Interestingly, survey respondents overall ranked “cost savings” just third out of the five options. This may be because “service efficiency” is closely related to cost savings for survey respondents. In terms of the success factors necessary for the cooperative effort to occur, survey respondents were most likely to identify “Improved Services” and “Clear Fiscal Benefits” as being the two most important success factors among the options identified. As shown in Figure 11, respondents from municipalities generally agreed on the relative importance of each of the success factors (respondents could select all that applied). There were some differences in the pattern of
County respondents, who tended to rank clear fiscal benefits more often than improved services, although both of these success factors were still the most commonly selected.
FIGURE 11 SUCCESS FACTORS FOR SIGNIFICANT INTERGOVERNMENTAL COOPERATION
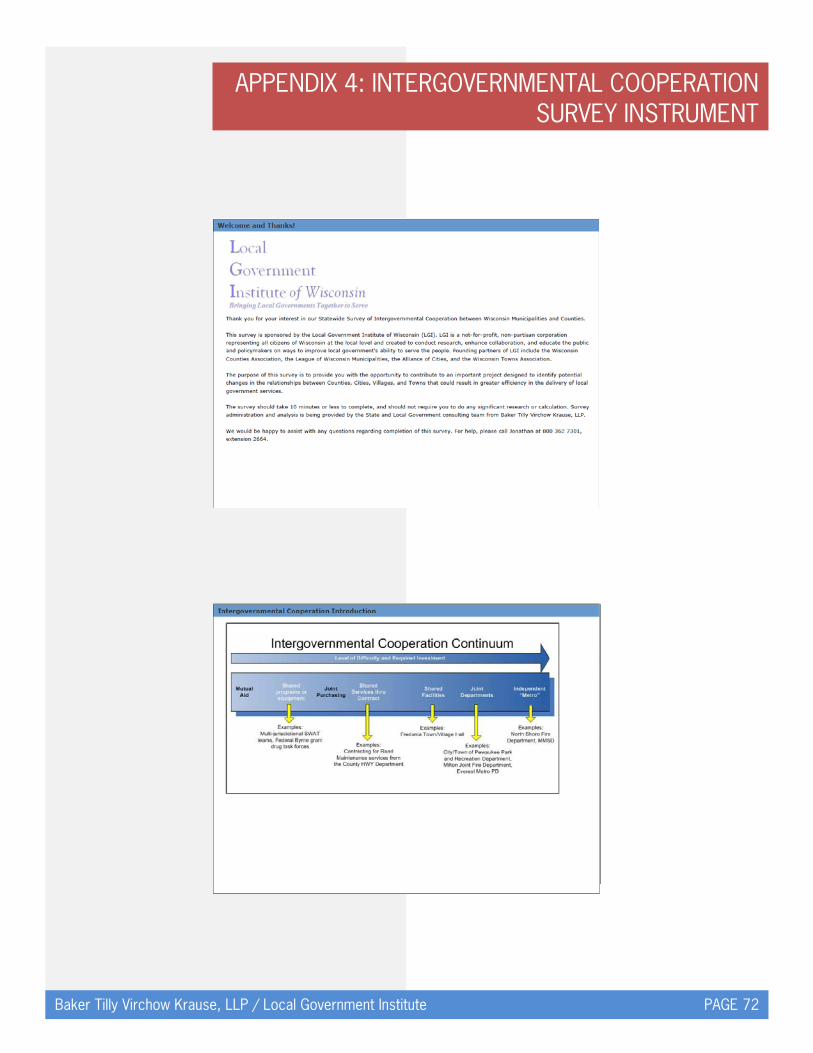
APPENDIX 4: INTERGOVERNMENTAL COOPERATION SURVEY INSTRUMENT
Baker Tilly Virchow Krause, LLP / Local Government Institute PAGE 72
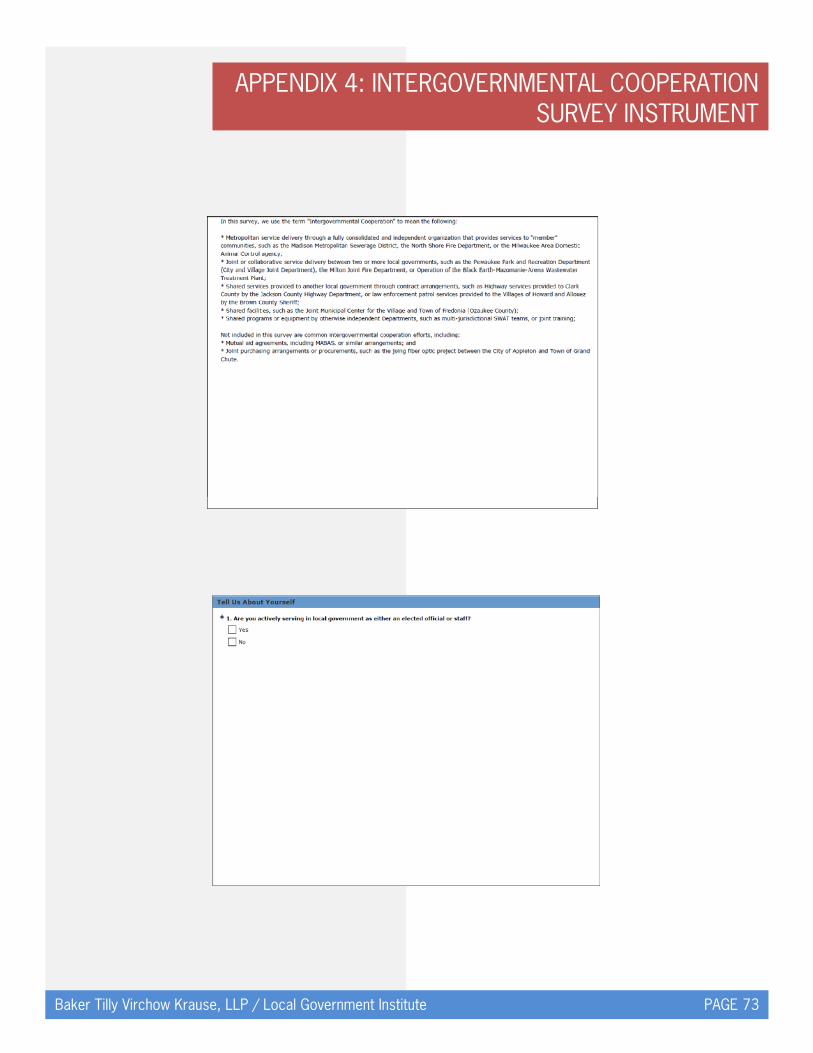
APPENDIX 4: INTERGOVERNMENTAL COOPERATION SURVEY INSTRUMENT
Baker Tilly Virchow Krause, LLP / Local Government Institute PAGE 73

APPENDIX 4: INTERGOVERNMENTAL COOPERATION SURVEY INSTRUMENT
Baker Tilly Virchow Krause, LLP / Local Government Institute PAGE 74
APPENDIX 4: INTERGOVERNMENTAL COOPERATION SURVEY INSTRUMENT
Baker Tilly Virchow Krause, LLP / Local Government Institute PAGE 75

APPENDIX 4: INTERGOVERNMENTAL COOPERATION SURVEY INSTRUMENT
Baker Tilly Virchow Krause, LLP / Local Government Institute PAGE 76
APPENDIX 4: INTERGOVERNMENTAL COOPERATION SURVEY INSTRUMENT
Baker Tilly Virchow Krause, LLP / Local Government Institute PAGE 77
APPENDIX 4: INTERGOVERNMENTAL COOPERATION SURVEY INSTRUMENT
Baker Tilly Virchow Krause, LLP / Local Government Institute PAGE 78
APPENDIX 4: INTERGOVERNMENTAL COOPERATION SURVEY INSTRUMENT
Baker Tilly Virchow Krause, LLP / Local Government Institute PAGE 79
APPENDIX 5: FOCUS GROUP SYNTHESIS
Baker Tilly Virchow Krause, LLP / Local Government Institute PAGE 80
We conducted four focus group sessions at locations throughout the state. Participation varied at the focus group sessions. In the Eau Claire focus group held on October 27th, attendees included four (4) Town Board Chairs. At the Milwaukee focus group held on October 28th, attendees included eleven (11) individuals representing Counties, Cities, Villages, Towns, as well as business leaders from the private and non-profit sectors. At the Madison focus group held on November 4th, attendees included 16 individuals representing Counties, Cities, Villages, and Towns. At the Appleton focus group held on November 5th, attendees included eight (8) individuals representing Counties, Cities, and Towns. Several key themes emerged from the focus groups. The themes presented below do not reflect the sum total of all discussion threads and concepts raised in the focus group sessions. Instead, they represent a summary of themes that appeared to garner a level of shared agreement approaching consensus: INTERGOVERNMENTAL COOPERATION SUCCESS FACTORS Trust among elected leadership and staff is a
critical success factor. A track record of working together on cooperative efforts is helpful, but nothing can replace a cooperative and trusting relationship when considering new approaches to service delivery. Personal credibility of leaders is vital to achieving new approaches to service delivery;
Demonstrated fiscal benefits are a critical success factor. Focus group participants stressed that for an intergovernmental cooperative effort to make sense, it must result in fiscal savings for the communities involved. These savings need not be immediate, but they must be significant over the medium- to long-term. The savings can be expressed in terms of either avoided costs or in actual reductions in expenditures;
All partners should share a recognition of opportunity or crisis that compels the communities to consider partnering for a joint or consolidated service delivery;
There must be a willingness to examine services independent of issues related to community identity and individual concerns over job protection. Critically, there must be a mechanism in place to address concerns related to local control, such as through a formal governance structure or procedures;
Community Support can be an important success factor, when the potential consolidation involves a “high profile” service that is connected to community identity, such as public safety. Success strategies for garnering community support include having a command of the facts, staying on message, anticipating negative comments and likely opponents, and including them and their concerns in a transparent process to explore the feasibility and benefits of consolidation;
Involvement of business leaders in being part of the solution is a critical success factor relative to long-term success.
FINANCE SYSTEM INCENTIVES/DISINCENTIVES Focus group participants strongly emphasized that
the current system of local government finance creates an environment that all too frequently leads to border issues among municipalities – the so-called “Fight over Tax Base.” Because local government revenue is so strongly linked to changes in the value of real property in their respective jurisdictions, municipalities are strongly incentivized to pursue strategies that maximize their tax base, often at the expense of their neighbors;
Centralized control of municipal aid and shared revenue funding at the state level has introduced distortions of the original intent of these programs. State lawmakers have too often seen shared revenue and municipal aid programs as an area of opportunity for budget reductions to the detriment of local government units;
Several focus group participants strongly objected to the State’s new “Maintenance of Effort” law, which requires communities to maintain or increase their expenditures for public safety services or face a punitive reduction in Shared Revenue. Focus group participants felt this new law not only
APPENDIX 5: FOCUS GROUP SYNTHESIS
Baker Tilly Virchow Krause, LLP / Local Government Institute PAGE 81
violated Wisconsin’s tradition of local control, but also discouraged efforts to provide public safety services more efficiently and/or at lower cost, including savings achieved through consolidation;
Focus group participants noted that in addition to these disincentives, the corresponding lack of financial mechanisms that provide structural incentives for intergovernmental cooperation is a significant gap;
Variances in communities’ ability to afford needed services is a key feature of local government finance and governance, and is a primary reason for Wisconsin’s system of equalization and aid. However, the extent to which that system has been distorted over time was the subject of considerable debate;
Focus group participants felt that some form of regional revenue sharing, whereby communities within a region would jointly benefit from economic development without regard to municipal boundaries could help address some of the pernicious effects of the fight over tax base;
Some focus group participants felt that the State’s current approach to taxation within and across municipal boundaries should be revisited; specifically the uniformity clause and the potential for special taxing districts should strongly be considered to provide other options for local government to raise revenue that would be more closely aligned with regional service delivery.
REGIONALISM IN SERVICE DELIVERY Focus group participants emphasized that many
services currently provided with a local focus could theoretically be provided regionally;
Examples of services that could readily be provided at a regional level include Recycling and Libraries;
Some focus group participants argued strongly that for regional service delivery to be feasible, some mechanism for allowing local control must be preserved, particularly in those services, such as property assessment, that have traditionally been a local function.