Road Policing Programme (RPP), 2011/12 - nzta.govt.nz · The 2011/12 Road Policing Programme (RPP)...
21
2011/12 Road Policing Programme (RPP) A variation of the 2009/12 RPP
Transcript of Road Policing Programme (RPP), 2011/12 - nzta.govt.nz · The 2011/12 Road Policing Programme (RPP)...
2011/12Road Policing Programme
(RPP)
A variation of the 2009/12 RPP

ISSN 2230-4002 (electronic)
The 2011/12 Road Policing Programme (RPP) is a variation of the 2009/12 RPP. It was prepared by the NZ Transport
Agency, and approved by the Minister of Transport in consultation with the Minister of Police, in accordance with
section 18 of the Land Transport Management Act 2003.
2011/12 Road Policing Programme
1
2011/12 Road Policing Programme (RPP) Contents
1 Introduction ....................................................................................................................................3
2 Legislative provisions ................................................................................................................3
3 Strategic context...........................................................................................................................4
4 Road safety outcomes................................................................................................................6
5 RPP developments........................................................................................................................7
6 Police delivery arrangements .................................................................................................8
7 Performance monitoring and reporting..........................................................................10
8 2011/12 RPP investment.......................................................................................................11
9 Work programme – activities and performance measures.....................................13
2011/12 Road Policing Programme
2
2011/12 Road Policing Programme
3
1 Introduction 2011/12 RPP –
pilot of a new
approach,
linked to Safer Journeys
This 2011/12 Road Policing Programme (RPP) is the first step in the implementation of
the review of the road policing activity class. The RPP pilots the new outcome
investment model the NZ Transport Agency (NZTA) has developed for National Land
Transport Programme (NLTP) activities. This model assists in ensuring road policing
activities make an optimal contribution to desired road safety outcomes.
There are two parts to this RPP. The first part, sections 1 to 8, details the legislative
and strategic context for the RPP. The government’s road safety strategy to 2020 Safer
Journeys provides the vision and shape for the RPP, and Police road policing activities
align with the strategy’s priority areas in order to implement the Safer Journeys Action
Plan. An overview of the delivery arrangements for road policing – with particular
emphasis on targeting resources to risk – is also included, along with investment
details.
The second part of this RPP, section 9, is the work programme for 2011/12. It is
structured to align with the Safer Journeys areas of concern. For each area of concern
the work programme details:
the NZTA’s investment expectations
the desired road safety outcomes for road policing activities to contribute to
the activities the Police will deliver
how the Police will measure the quantity and quality of the activities
the estimated level of demand and resources for each activity.
2 Legislative provisions
2.1 Land Transport Management Act 2003 (LTMA)
The 2011/12 RPP has been prepared as a variation to the 2009/12 RPP in accordance
with section 18 of the Land Transport Management Act 2003 (LTMA). It forms part of
the 2009/12 RPP, and is funded from the National Land Transport Fund (NLTF).
2011/12 Road Policing Programme
4
3 Strategic context
3.1 Government Policy Statement on Land Transport Funding 2009/10 – 2018/19
The NZTA gives
effect to the
GPS when
making its
investment
recommend-
ations
The Government Policy Statement on Land Transport Funding 2009/10 – 2018/19
(GPS) provides details of the government’s desired outcomes and funding priorities for
the use of the NLTF to support activities in the land transport sector.
The NZTA uses its Investment and Revenue Strategy (IRS) as an investment decision-
making tool to give effect to the GPS. The IRS uses strategic fit, effectiveness and
economic efficiency to help prioritise the funding bids received for NLTP funds. The
assessment criteria used for the RPP are based on the IRS but tailored to road policing.
The GPS identifies the importance of reducing deaths and serious injuries as a result
of road crashes. The government’s road safety strategy to 2020, Safer Journeys,
expands on this objective.
3.2 Safer Journeys
The RPP is
structured to
address Safer Journeys and a
Safe System
approach to
road safety
The government’s road safety strategy Safer Journeys, has the vision for a ‘safe road
system increasingly free of death and serious injury’, and is available at
www.transport.govt.nz/saferjourneys/. The road policing activities in the RPP are
aligned to Safer Journeys and include Police actions from the Safer Journeys Action
Plan.
Safer Journeys recognises that a Safe System approach to road safety is needed if
New Zealand is to make real progress in reducing the number of road deaths and
serious injuries. The Safe System approach acknowledges:
people make mistakes, and crashes are therefore inevitable
the body has limited ability to withstand crash forces
system designers and system users must all share responsibility for managing
crash forces to a level that does not result in death or serious injury
it will take a system-wide approach – safe roads and roadsides, vehicles, speeds
and road users to improve road safety in New Zealand.
Using this approach, road safety is the responsibility of all New Zealanders and
something to which we can all contribute.
2011/12 Road Policing Programme
5
3.3 The Safer Journeys Action Plan
An inter-
agency
approach has
been used to
develop an
action plan.
The RPP
enables the
Police to
complete their
actions.
The Safer Journeys Action Plan for the 2011 and 2012 years, which is available at
www.transport.govt.nz/saferjourneys/, outlines the actions to be advanced in order to
achieve the strategy’s road safety objectives. The plan is designed to help all stakeholders,
communities and individuals to take their own actions to improve the safety of our roads.
Partner agencies that belong to the National Road Safety Committee1 (NRSC) have a
key role in road safety and in the implementation of the Action Plan, along with
regional transport committees, local authorities and community organisations.
Processes such as road safety action planning provide collaborative approaches to
achieving road safety outcomes at the regional and local levels.
The RPP provides for the Police to implement the actions for which they are responsible.
3.4 Road policing and the Safe System
The Safe
System
approach is
about working
to understand
all the risk
factors
involved in
crashes and
not just
focusing solely
on the fault of
road users
What the Safe System approach means for road policing is instead of focusing on the
fault of road users, there is a need to look at all risk factors that lead to death and
serious injury. This enables road policing interventions to be delivered in the context
of an integrated plan to reduce fatal and serious injury crashes. For example:
The safe roads and roadsides element requires roads to be predictable, promote
safe behaviour, and be more forgiving of human error. Most of these outcomes will
be addressed through infrastructure solutions. However an appropriate road
policing response includes that local Police, who understand and target high-risk
rural roads and high-risk intersections, consider KiwiRAP, which is available at
www.kiwirap.org.nz/, and other risk-targeting tools, are aware of local road and
roadside issues in their areas, and provide feedback on these issues to road
controlling authorities as part of the road safety action planning (RSAP) process.
The safe speeds element requires speeds to suit the function and level of safety
of the road. The appropriate road policing response includes that local Police, who
understand and target areas where speed has a high-risk profile, encourage road
users to comply with speed limits and to drive to the conditions, investigate
alternative methods of promoting speed compliance, and engage with the setting
of safe speed limit processes in their areas.
The safe vehicles element requires vehicles to incorporate emerging collision
avoidance technologies and modern warning and other safety features to help
prevent crashes and protect road users from crash forces. The appropriate road
policing response includes that local Police, who understand and target unsafe
vehicles, promote safe vehicle ownership and operation in their areas.
The safe road use element requires users to be skilled and competent, proactive
in managing hazards, predictable, alert, unimpaired, compliant and able to make
safe vehicle choices. The appropriate road policing response is that local Police,
who understand, identify and target high-risk drivers, promote alert and compliant
road user behaviour and a positive public road safety culture in their areas.
1 Partner agencies are the Ministry of Transport, Police, the NZ Transport Agency, the Accident Compensation Corporation and Local Government New Zealand. The Ministries of Labour, Health and Justice are associate agencies.
2011/12 Road Policing Programme
6
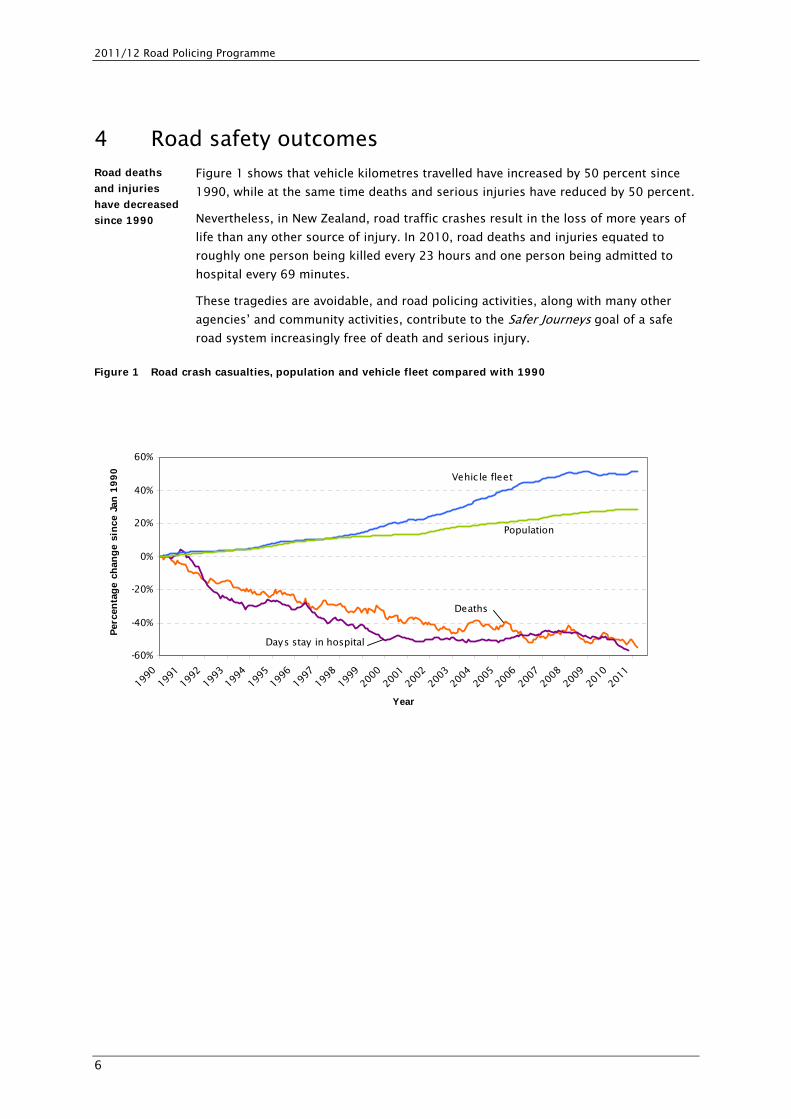
4 Road safety outcomes Road deaths
and injuries
have decreased
since 1990
Figure 1 shows that vehicle kilometres travelled have increased by 50 percent since
1990, while at the same time deaths and serious injuries have reduced by 50 percent.
Nevertheless, in New Zealand, road traffic crashes result in the loss of more years of
life than any other source of injury. In 2010, road deaths and injuries equated to
roughly one person being killed every 23 hours and one person being admitted to
hospital every 69 minutes.
These tragedies are avoidable, and road policing activities, along with many other
agencies’ and community activities, contribute to the Safer Journeys goal of a safe
road system increasingly free of death and serious injury.
Figure 1 Road crash casualties, population and vehicle fleet compared with 1990
-60%
-40%
-20%
0%
20%
40%
60%
1990
1991
1992
1993
1994
1995
1996
1997
1998
1999
2000
2001
2002
2003
2004
2005
2006
2007
2008
2009
2010
2011
Year
Per
centa
ge
chan
ge
since
Jan
1990
Vehic le fleet
Deaths
Days stay in hospital
Population
2011/12 Road Policing Programme
7
5 RPP developments
5.1 Planning and investing for outcomes
A planning and
investing for
outcomes
approach for
the RPP mirrors
the approach
used to assess
the rest of the
National Land
Transport
Programme
The new outcome investment model being piloted for the 2011/12 RPP is helping to
ensure road policing activities make an optimal contribution to desired road safety
outcomes. It is a result of the review of the road policing activity class and will be
more fully implemented in the 2012/15 RPP.
The new model fits with the NZTA’s broader vision of streamlining its investment
processes and moving to an outcome investment approach for all NLTP activity
classes.
The NZTA has outlined in its Road Policing Investment Framework the investment
expectations, desired outcomes and intermediate outcomes to which road policing
activities must contribute as well as the assessment criteria the NZTA would apply.
This has provided the Police with clear investment signals regarding the outcomes the
sector are seeking to achieve and enabled the Police to prepare their Road Policing
Investment Proposal. This 2011/12 RPP variation is the NZTA’s investment
recommendation for the road policing activities the Police will deliver in order to
contribute to improving outcomes.
Developing the RPP in this manner has provided a more strategic and systematic way
of aligning road policing investment with Safer Journeys, and directed road policing
activities to highest risk. These changes are being piloted for the 2011/12 RPP, with
full implementation planned for the 2012/15 investment period.
Key aspects of the NZTA’s overall investment approach are the focus on planning and
investing for outcomes. Specifically this approach:
demonstrates clear cause-and-effect linkages from investment to outcome
shows the incremental cost per improvement of an outcome
has transparent assumptions
ensures drill-down capability for insight, learning and improvement
grows a face-to-face investment relationship based on trust.
When applied to the RPP, the key components include:
developing the Road Safety Intelligence Centre (RSIC) to support a collective
approach to data, evidence and analysis to enable a shared identification of road
policing issues and solutions
identifying clear road safety outcomes to which NZ Police contribute, and the
associated road policing activities that achieve value for money
providing the Police with greater operational flexibility and enabling road policing
activities to be better targeted towards road safety risk
ensuring accountability is maintained by the Police owning and accounting for the
delivery of operational solutions
basing road policing interventions on evidence at both strategic and tactical levels,
both nationally and locally.
2011/12 Road Policing Programme
8
6 Police delivery arrangements Road policing
is about
increasing the
perception of
apprehension
Road policing is about achieving safe and efficient traffic on the New Zealand roading
network. Limited resources are maximised to produce widespread behaviour change
and driver compliance with the road environment. This is based on the notion that
road user compliance for high-risk offending and potential offending drivers depends
on their perceptions of the likelihood of apprehension.
To maximise perceptions of apprehension, and therefore compliance, road-policing
resources are deployed to be as visible as possible, to engage with large volumes of
the driving population so as to increase awareness, and to be unpredictable in order to
create uncertainty about where the Police are. An example of where the Police use the
general deterrence approach is the booze bus operations, where large numbers of
motorists are breath tested, despite only a small number of them being processed for
excess breath alcohol.
6.1 Risk targeted road policing
Intelligence is
critical to
targeting the
delivery of road
policing
activities
The Police recognise, in order to improve road safety outcomes within existing
funding levels, there is a need to act smarter, utilise technology, increase the
identification of risk, demonstrate value for money and effectively deploy resources.
Intelligence is a key part of this equation.
Intelligence shapes our understanding of the road policing environment: it supports
critical decisions and informs the proper exercise of discretion. Good intelligence
saves lives on roads, reduces crime and promotes public safety. At the heart of Police
deployment is the identification of crash risks from historic, current and predictive
perspectives.
Risks are identified through a number of mechanisms including the examination of
crash data, recorded offending levels, traffic complaints, and details about repeat
offenders and repeat offending. Risk-targeted road policing operates through the
Police tasking and coordination process which occurs at national, district and area
level. Part of this process is the collection, collation, analysis and dissemination of
data to produce intelligence which is then used to inform decisions about deployment
based on risk. Risk targeting is based on historical data which is supplemented with
current intelligence about things such as events and anticipated traffic movements.
Risk-targeted road policing is the fundamental basis of road policing. Using a
predictive risk assessment approach to identify at-risk drivers and driving, enables the
appropriate action to be taken.
The Police will use this intelligence-led approach to develop an annual thematic
calendar of higher risk events and times, which will also influence the planning of the
national road safety advertising programme run by the NZTA, to enhance the
effectiveness of both.
2011/12 Road Policing Programme
9
6.2 Police tasking and coordination
Tasking and
co-ordination:
recognising
local risk
enables local
Police to
respond
accordingly
Tasking and coordination is a process developed by the Police that supports
intelligence-led policing and the community policing model. It encompasses a whole-
of-Police approach to problem solving.
The tasking and coordination process:
empowers key decision makers to drive operational activity
allows key decision makers to prioritise delivery
ensures across-the-board accountability for actions undertaken
is forward-looking, evidence-based and proactive, with an emphasis on outcomes
and solutions
links participation, partnerships, community priorities and protection in the
community policing approach.
Tasking and coordination offers many benefits because it allows the Police to:
maximise the use and impact of all Police resources
provide a clear link between deployment decisions and business priorities
increase the focus on the road and community safety in a way that supports a
cooperative, whole-of-government approach
use a risk-targeted deployment approach that targets defined individual and
collective risk
have more impact on priority community problems through engagement and
cooperation with partners.
Tasking and coordination is undertaken at the national, district and area level. This
recognises the national focus while factoring in the local risks.
Best practice is transferred through a number of mechanisms, including sharing
knowledge at road policing managers’ conferences, the use of Sharepoint, and the
Police manuals of best practice.
Building consistent quality across Police in developing road safety assessments and
district knowledge profiles is a continuing area of focus for 2011/12.
6.3 Road safety action planning
Road safety
action planning
is a process for
local
engagement
and co-
ordination on
road safety
issues
Road policing staff engage with other road safety partners to work towards common
goals. Partnerships exist at a range of different levels. For example, at the national
level road policing works with agencies, such as MoT, the NZTA, the Alcohol Advisory
Council of NZ (ALAC) and the Accident Compensation Corporation (ACC) to develop
road safety programmes, share ideas and work towards joint solutions. At a regional
and local level the Police work with other partners, such as local authorities, to design
appropriate policing and educational strategies. This local level consultation is
integrated through the entire planning, design and development of the road policing
product, and is formalised through a number of processes, such as the RSAP process.
2011/12 Road Policing Programme
10
Effective RSAP requires a collaborative approach from participating partners to provide
focus, commitment and urgency in order to address and mitigate road safety risks,
especially in terms of Safer Journeys high-priority road safety issues (speed, alcohol
and drugs, motorcycling, young drivers, and roads and roadsides) for the local area.
The RPP and RSAP processes are designed to consider local road policing priorities to
establish the nature of local risks and operational needs. RSAP groups meet quarterly
throughout the year to re-evaluate road-safety problems due to the changing nature of
road safety risks, and to review the appropriateness of existing services. These
reviews are informed by using local road safety information drawn from a variety of
sources, particularly that collected by Police intelligence analysts.
Developing a shared intelligence product in 2011/12 as part of the Road Safety
Intelligence Centre (RSIC), which is contributed to by all participating agencies, is seen
as a way forward to improve the evidence base upon which decisions about road
safety actions are made.
7 Performance monitoring and reporting
7.1 Performance monitoring
The NZTA
monitors and
reports on the
delivery of road
policing
activities and
the achievement
of road safety
outcomes
The performance monitoring framework for the RPP is documented in the performance
agreement between the Minister of Transport, the Minister of Police, and the
Commissioner of Police. The Police monitor the delivery of road policing activities and
report on progress quarterly to the transport sector.
In this context, the NZTA undertakes quarterly performance reviews with the Police,
the purpose of which is to give both parties the opportunity to assess the delivery of
road policing activities and to provide feedback about what is working, what is not,
and what needs to be changed.
Reporting
structured on
Safer Journeys
priority areas
The Police quarterly road policing reports set out Police contributions by Safer
Journeys areas of concern.
Each quarterly report addresses:
risk-targeting approach and tools
progress against Police activity performance measures and quarterly reporting
requirements as set out in the RPP
the status of new initiatives, plus any remaining initiatives not yet complete from
previous fiscal years
delivery and expenditure.
2011/12 Road Policing Programme
11
7.2 Police accountability
In addition to existing external reporting described above, the Police have internal
systems and processes to monitor Police delivery of RPP activities which are included
in the Police National Business Plan (NBP). In order to implement the NBP each Police
district, as well as relevant work groups within Police National Headquarters, produces
a business delivery plan. These plans are produced annually in time for the beginning
of each new financial year.
Quarterly reports against business plan delivery are submitted to the Police Business
Planning Group. In addition, the Police Performance Group (assisted by the Police
Finance Group) produces a monthly management report for the Police Executive
Committee against RPP performance measures; and every six months a Police Deputy
Commissioner accompanies the Police Performance Group on district visits to monitor
performance against deliverables in each district business plan.
8 2011/12 RPP investment
8.1 Overall 2011/12 investment
Road policing
investment for
2011/12 totals
$297 million
Investment for the 2011/12 RPP aligns with Budget 2011: Vote Police output class 7,
because, although the programme is funded by the NLTF, it comprises output class 7
of Vote Police. The amount of $1 million of new initiatives for the 2011/12 RPP has
been funded as set out below.
Table 1 2011/12 RPP investment
2011/12 RPP
Budget 2011: Vote Police output class 7 $295.945m
New investment
Police mobility technology expansion $1.000m
Total investment for 2011/12 RPP variation $296.945m
Other revenue Revenue, offsetting other costs, which is applicable to Police activities in this programme for the
2009/10 year, and is to be received by the Commissioner from sources other than the National
Land Transport Fund, is estimated to total $2.510 million.
The investment is for the following purposes:
$296.945 million for operating costs, which is the Budget 2011 level of NLTF
investment for Vote Police output class 7
$1 million new investment to purchase and support approximately 220 hand-held
Police mobility devices and accessories to expand their use by Police staff delivering
road policing activities – which is part of the Police’s mobility programme.
In addition, the Police and NZTA will be developing a joint business case for a safety
camera package to be implemented in the 2011/12 financial year. Further investment
will be dependent on the business case.
2011/12 Road Policing Programme
12
8.1.1 Expanding the use of hand-held Police mobility devices for road policing enforcement
The use of
Police mobility
devices results
in a range of
efficiencies
The $1 million to purchase more hand-held Police mobility devices will enable the
Police to build on the successes of testing these devices and to achieve further gains
by expanding the use of Police mobility devices across staff working in road policing
service delivery.
The gains are likely to be:
further reductions in delays in processing notices
increased numbers of notices with no serious flaws
the Police will be able to remain on active patrol for longer periods
increased ability to carry out high-volume roadside driver licence checks using
barcode scanning capability
access to radio checks and the speed at which these can be managed, which offers
considerable savings.
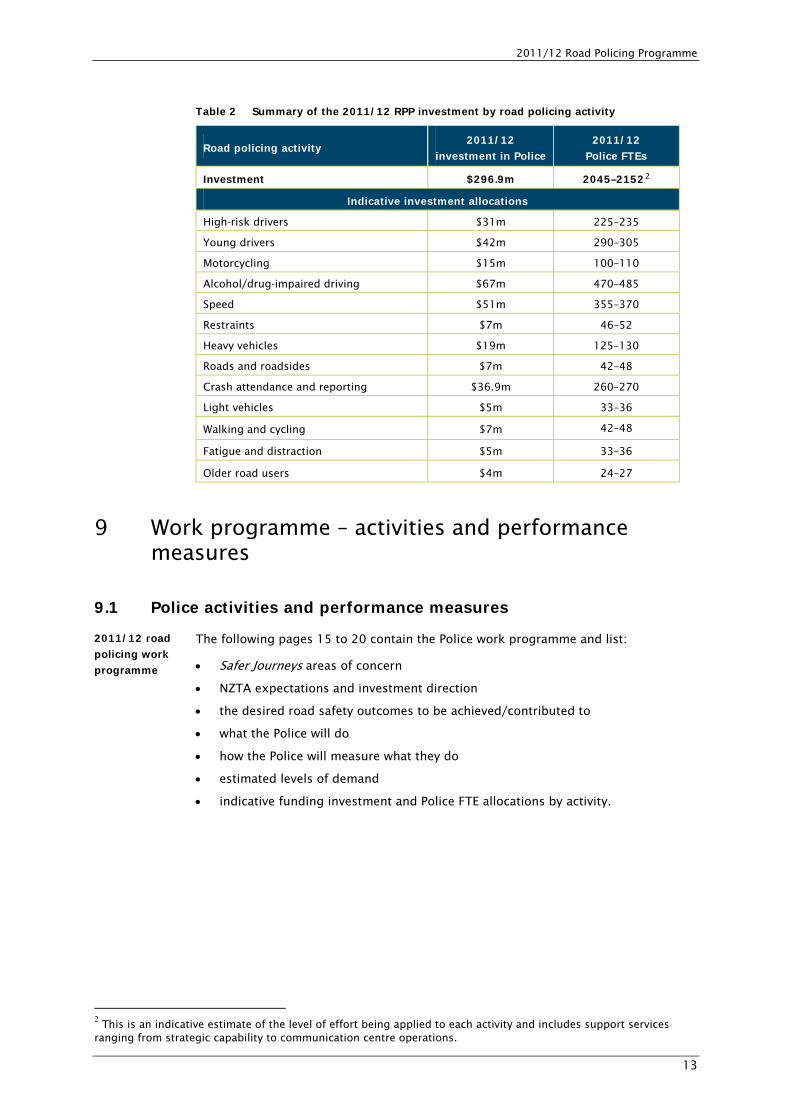
8.2 Investment for road policing activities
The RPP
activities and
level of
investment are
aligned with
Safer Journeys
Police activities are aligned with Safer Journeys, and address the strategy’s areas of
high and medium concern. The allocations for Police activities provided in table 2 are
guides only, given that through the RPP process investment is being made in activities
to achieve intermediate outcomes such as reducing speeds and drink-driving, and final
outcomes which are reductions in deaths and injuries and the associated social cost.
To achieve these outcomes may require adjustments in levels of activity during the
year.
Road policing investment funds all police costs for road policing; such as on-road and
support personnel costs, equipment maintenance including its calibration, ‘booze
buses’, the Police Infringement Bureau which includes the Traffic Camera Office, road
policing management and strategic capability, depreciation which funds capital items
such as Police vehicles and other equipment, and a proportional contribution for Police
buildings and corporate overheads including IT and radio network costs. In other
words, built into the investment are both the direct and indirect costs of road policing.
See section 9 for the work programme, including performance measures, for the
following activities.
2011/12 Road Policing Programme
13
Table 2 Summary of the 2011/12 RPP investment by road policing activity
Road policing activity 2011/12
investment in Police
2011/12
Police FTEs
Investment $296.9m 2045–21522
Indicative investment allocations
High-risk drivers $31m 225–235
Young drivers $42m 290–305
Motorcycling $15m 100–110
Alcohol/drug-impaired driving $67m 470–485
Speed $51m 355–370
Restraints $7m 46–52
Heavy vehicles $19m 125–130
Roads and roadsides $7m 42–48
Crash attendance and reporting $36.9m 260–270
Light vehicles $5m 33–36
Walking and cycling $7m 42–48
Fatigue and distraction $5m 33–36
Older road users $4m 24–27
9 Work programme – activities and performance measures
9.1 Police activities and performance measures
2011/12 road
policing work
programme
The following pages 15 to 20 contain the Police work programme and list:
Safer Journeys areas of concern
NZTA expectations and investment direction
the desired road safety outcomes to be achieved/contributed to
what the Police will do
how the Police will measure what they do
estimated levels of demand
indicative funding investment and Police FTE allocations by activity.
2 This is an indicative estimate of the level of effort being applied to each activity and includes support services ranging from strategic capability to communication centre operations.
Glossary of abbreviations used in table
ANPR automatic number plate recognition CoF/WoF certificate/warrant of fitness GDL graduated driver licence MBT mobile breath test SRSE school road safety education
ATSB Australian Transport Safety Bureau CVIR commercial vehicle inspection report GDLS graduated driver licensing scheme P1 priority one STST school traffic safety team
BAC blood alcohol concentration CVIU commercial vehicle investigation unit HMV heavy motor vehicle PEO Police education officer T&C tasking and coordination
CBT compulsory breath test EBT evidential breath test ICPP iwi-led crime and crash prevention plan PIB Police Infringement Bureau TCR Traffic Crash Report
CIT compulsory impairment test (drug) FTE full time equivalent staff ION infringement offence notice RUC road user charges TON traffic offence notice
14
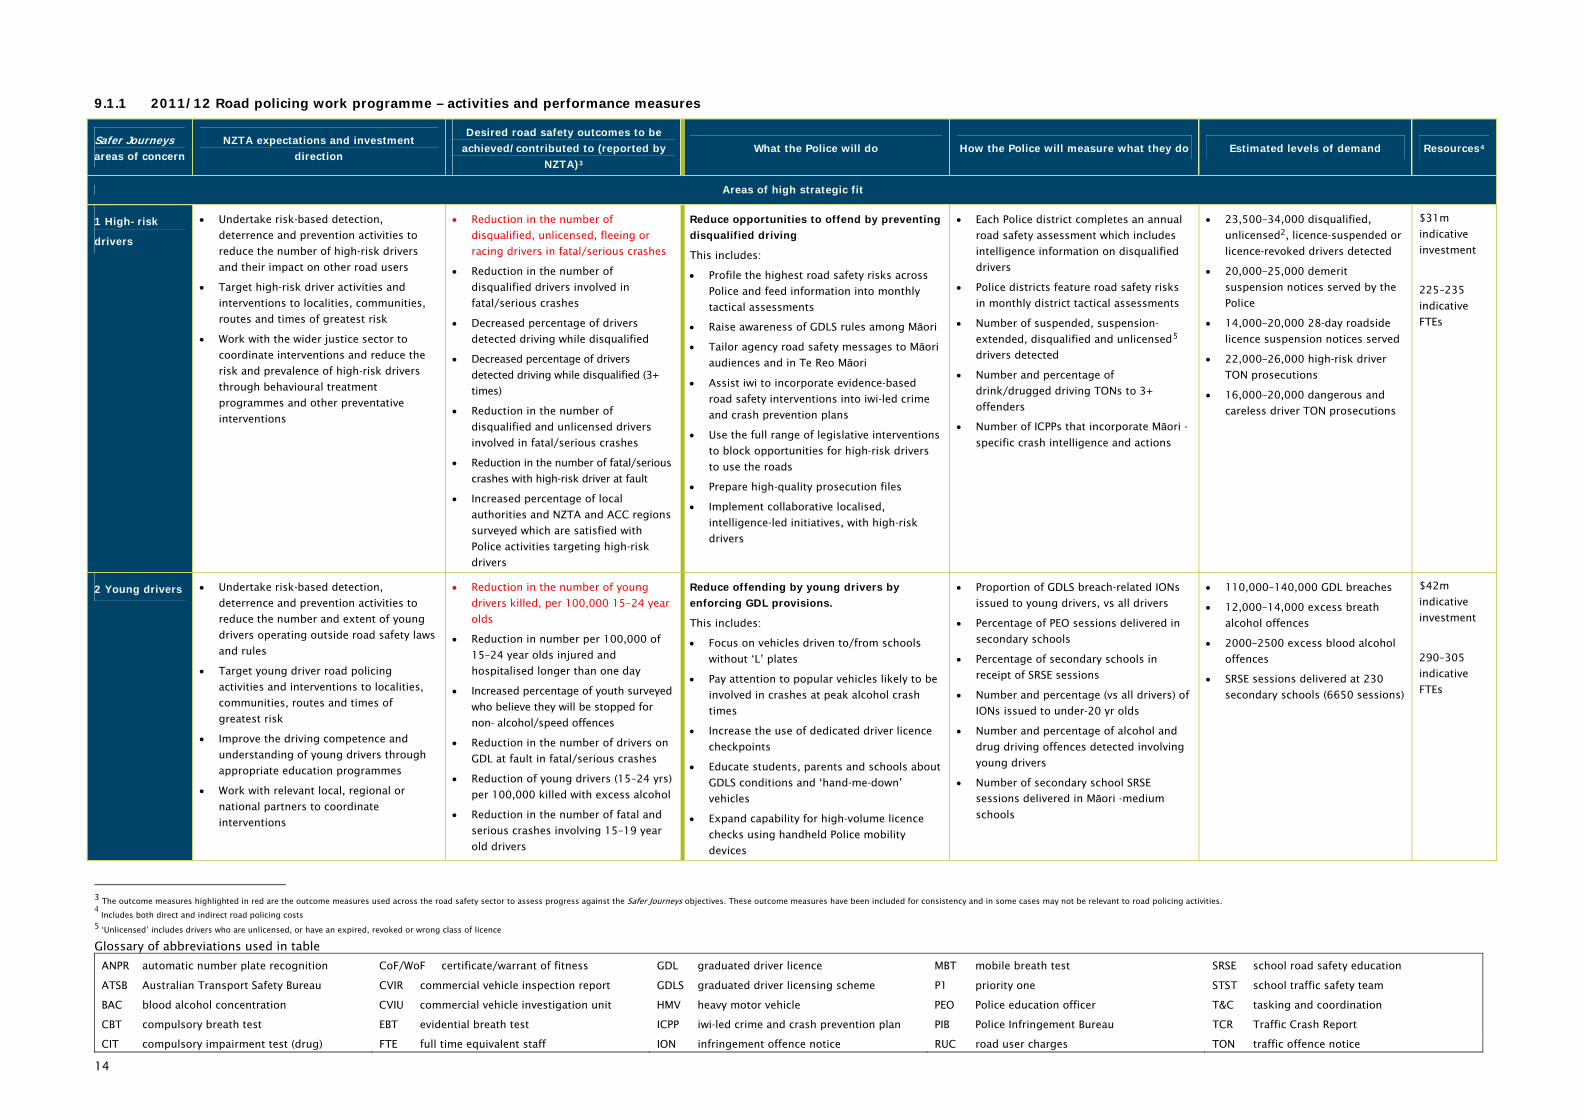
9.1.1 2011/12 Road policing work programme – activities and performance measures
Safer Journeys
areas of concern
NZTA expectations and investment
direction
Desired road safety outcomes to be
achieved/contributed to (reported by
NZTA)3
What the Police will do How the Police will measure what they do Estimated levels of demand Resources4
Areas of high strategic fit
1 High-risk
drivers
Undertake risk-based detection,
deterrence and prevention activities to
reduce the number of high-risk drivers
and their impact on other road users
Target high-risk driver activities and
interventions to localities, communities,
routes and times of greatest risk
Work with the wider justice sector to
coordinate interventions and reduce the
risk and prevalence of high-risk drivers
through behavioural treatment
programmes and other preventative
interventions
Reduction in the number of
disqualified, unlicensed, fleeing or
racing drivers in fatal/serious crashes
Reduction in the number of
disqualified drivers involved in
fatal/serious crashes
Decreased percentage of drivers
detected driving while disqualified
Decreased percentage of drivers
detected driving while disqualified (3+
times)
Reduction in the number of
disqualified and unlicensed drivers
involved in fatal/serious crashes
Reduction in the number of fatal/serious
crashes with high-risk driver at fault
Increased percentage of local
authorities and NZTA and ACC regions
surveyed which are satisfied with
Police activities targeting high-risk
drivers
Reduce opportunities to offend by preventing
disqualified driving
This includes:
Profile the highest road safety risks across
Police and feed information into monthly
tactical assessments
Raise awareness of GDLS rules among Māori
Tailor agency road safety messages to Māori
audiences and in Te Reo Māori
Assist iwi to incorporate evidence-based
road safety interventions into iwi-led crime
and crash prevention plans
Use the full range of legislative interventions
to block opportunities for high-risk drivers
to use the roads
Prepare high-quality prosecution files
Implement collaborative localised,
intelligence-led initiatives, with high-risk
drivers
Each Police district completes an annual
road safety assessment which includes
intelligence information on disqualified
drivers
Police districts feature road safety risks
in monthly district tactical assessments
Number of suspended, suspension-
extended, disqualified and unlicensed5
drivers detected
Number and percentage of
drink/drugged driving TONs to 3+
offenders
Number of ICPPs that incorporate Māori -
specific crash intelligence and actions
23,500–34,000 disqualified,
unlicensed2, licence-suspended or
licence-revoked drivers detected
20,000–25,000 demerit
suspension notices served by the
Police
14,000–20,000 28-day roadside
licence suspension notices served
22,000–26,000 high-risk driver
TON prosecutions
16,000–20,000 dangerous and
careless driver TON prosecutions
$31m
indicative
investment
225–235
indicative
FTEs
2 Young drivers Undertake risk-based detection,
deterrence and prevention activities to
reduce the number and extent of young
drivers operating outside road safety laws
and rules
Target young driver road policing
activities and interventions to localities,
communities, routes and times of
greatest risk
Improve the driving competence and
understanding of young drivers through
appropriate education programmes
Work with relevant local, regional or
national partners to coordinate
interventions
Reduction in the number of young
drivers killed, per 100,000 15–24 year
olds
Reduction in number per 100,000 of
15–24 year olds injured and
hospitalised longer than one day
Increased percentage of youth surveyed
who believe they will be stopped for
non- alcohol/speed offences
Reduction in the number of drivers on
GDL at fault in fatal/serious crashes
Reduction of young drivers (15–24 yrs)
per 100,000 killed with excess alcohol
Reduction in the number of fatal and
serious crashes involving 15–19 year
old drivers
Reduce offending by young drivers by
enforcing GDL provisions.
This includes:
Focus on vehicles driven to/from schools
without ‘L’ plates
Pay attention to popular vehicles likely to be
involved in crashes at peak alcohol crash
times
Increase the use of dedicated driver licence
checkpoints
Educate students, parents and schools about
GDLS conditions and ‘hand-me-down’
vehicles
Expand capability for high-volume licence
checks using handheld Police mobility
devices
Proportion of GDLS breach-related IONs
issued to young drivers, vs all drivers
Percentage of PEO sessions delivered in
secondary schools
Percentage of secondary schools in
receipt of SRSE sessions
Number and percentage (vs all drivers) of
IONs issued to under-20 yr olds
Number and percentage of alcohol and
drug driving offences detected involving
young drivers
Number of secondary school SRSE
sessions delivered in Māori -medium
schools
110,000–140,000 GDL breaches
12,000–14,000 excess breath
alcohol offences
2000–2500 excess blood alcohol
offences
SRSE sessions delivered at 230
secondary schools (6650 sessions)
$42m
indicative
investment
290–305
indicative
FTEs
3 The outcome measures highlighted in red are the outcome measures used across the road safety sector to assess progress against the Safer Journeys objectives. These outcome measures have been included for consistency and in some cases may not be relevant to road policing activities. 4 Includes both direct and indirect road policing costs
5 ‘Unlicensed’ includes drivers who are unlicensed, or have an expired, revoked or wrong class of licence
Glossary of abbreviations used in table
ANPR automatic number plate recognition CoF/WoF certificate/warrant of fitness GDL graduated driver licence MBT mobile breath test SRSE school road safety education
ATSB Australian Transport Safety Bureau CVIR commercial vehicle inspection report GDLS graduated driver licensing scheme P1 priority one STST school traffic safety team
BAC blood alcohol concentration CVIU commercial vehicle investigation unit HMV heavy motor vehicle PEO Police education officer T&C tasking and coordination
CBT compulsory breath test EBT evidential breath test ICPP iwi-led crime and crash prevention plan PIB Police Infringement Bureau TCR Traffic Crash Report
CIT compulsory impairment test (drug) FTE full time equivalent staff ION infringement offence notice RUC road user charges TON traffic offence notice
15
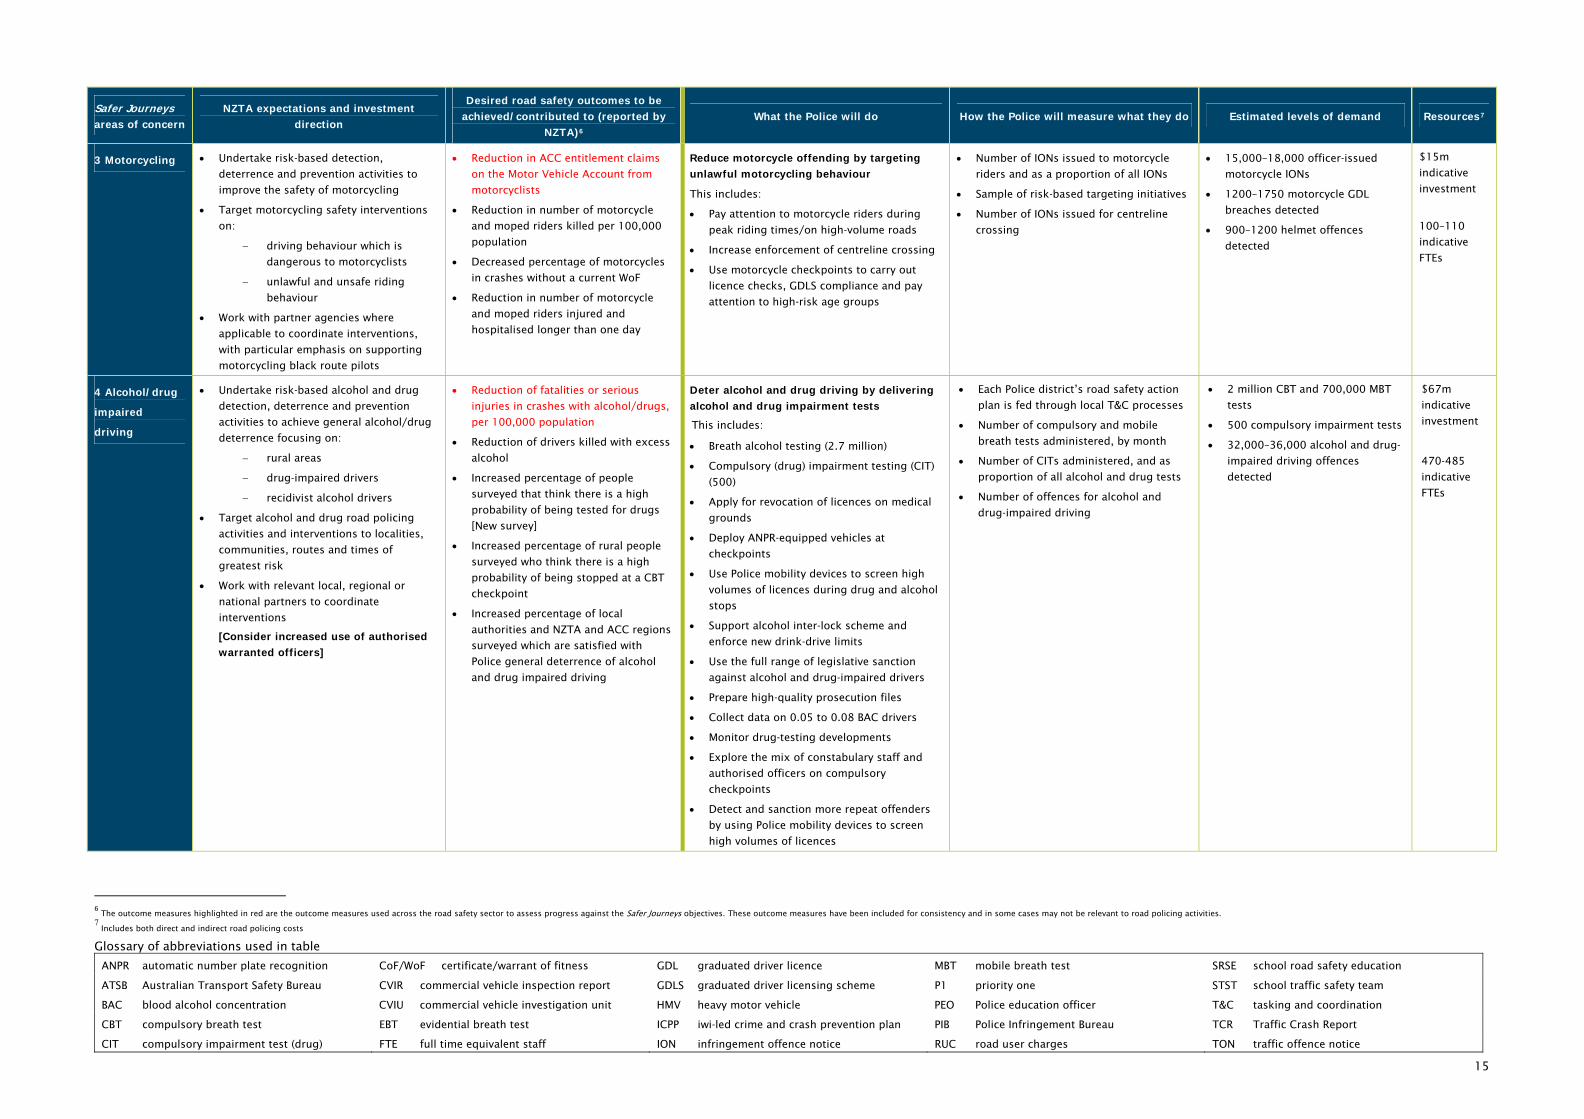
Safer Journeys
areas of concern
NZTA expectations and investment
direction
Desired road safety outcomes to be
achieved/contributed to (reported by
NZTA)6
What the Police will do How the Police will measure what they do Estimated levels of demand Resources7
3 Motorcycling Undertake risk-based detection,
deterrence and prevention activities to
improve the safety of motorcycling
Target motorcycling safety interventions
on:
driving behaviour which is
dangerous to motorcyclists
unlawful and unsafe riding
behaviour
Work with partner agencies where
applicable to coordinate interventions,
with particular emphasis on supporting
motorcycling black route pilots
Reduction in ACC entitlement claims
on the Motor Vehicle Account from
motorcyclists
Reduction in number of motorcycle
and moped riders killed per 100,000
population
Decreased percentage of motorcycles
in crashes without a current WoF
Reduction in number of motorcycle
and moped riders injured and
hospitalised longer than one day
Reduce motorcycle offending by targeting
unlawful motorcycling behaviour
This includes:
Pay attention to motorcycle riders during
peak riding times/on high-volume roads
Increase enforcement of centreline crossing
Use motorcycle checkpoints to carry out
licence checks, GDLS compliance and pay
attention to high-risk age groups
Number of IONs issued to motorcycle
riders and as a proportion of all IONs
Sample of risk-based targeting initiatives
Number of IONs issued for centreline
crossing
15,000–18,000 officer-issued
motorcycle IONs
1200–1750 motorcycle GDL
breaches detected
900–1200 helmet offences
detected
$15m
indicative
investment
100–110
indicative
FTEs
4 Alcohol/drug
impaired
driving
Undertake risk-based alcohol and drug
detection, deterrence and prevention
activities to achieve general alcohol/drug
deterrence focusing on:
rural areas
drug-impaired drivers
recidivist alcohol drivers
Target alcohol and drug road policing
activities and interventions to localities,
communities, routes and times of
greatest risk
Work with relevant local, regional or
national partners to coordinate
interventions
[Consider increased use of authorised
warranted officers]
Reduction of fatalities or serious
injuries in crashes with alcohol/drugs,
per 100,000 population
Reduction of drivers killed with excess
alcohol
Increased percentage of people
surveyed that think there is a high
probability of being tested for drugs
[New survey]
Increased percentage of rural people
surveyed who think there is a high
probability of being stopped at a CBT
checkpoint
Increased percentage of local
authorities and NZTA and ACC regions
surveyed which are satisfied with
Police general deterrence of alcohol
and drug impaired driving
Deter alcohol and drug driving by delivering
alcohol and drug impairment tests
This includes:
Breath alcohol testing (2.7 million)
Compulsory (drug) impairment testing (CIT)
(500)
Apply for revocation of licences on medical
grounds
Deploy ANPR-equipped vehicles at
checkpoints
Use Police mobility devices to screen high
volumes of licences during drug and alcohol
stops
Support alcohol inter-lock scheme and
enforce new drink-drive limits
Use the full range of legislative sanction
against alcohol and drug-impaired drivers
Prepare high-quality prosecution files
Collect data on 0.05 to 0.08 BAC drivers
Monitor drug-testing developments
Explore the mix of constabulary staff and
authorised officers on compulsory
checkpoints
Detect and sanction more repeat offenders
by using Police mobility devices to screen
high volumes of licences
Each Police district’s road safety action
plan is fed through local T&C processes
Number of compulsory and mobile
breath tests administered, by month
Number of CITs administered, and as
proportion of all alcohol and drug tests
Number of offences for alcohol and
drug-impaired driving
2 million CBT and 700,000 MBT
tests
500 compulsory impairment tests
32,000–36,000 alcohol and drug-
impaired driving offences
detected
$67m
indicative
investment
470-485
indicative
FTEs
6 The outcome measures highlighted in red are the outcome measures used across the road safety sector to assess progress against the Safer Journeys objectives. These outcome measures have been included for consistency and in some cases may not be relevant to road policing activities.
7 Includes both direct and indirect road policing costs
Glossary of abbreviations used in table
ANPR automatic number plate recognition CoF/WoF certificate/warrant of fitness GDL graduated driver licence MBT mobile breath test SRSE school road safety education
ATSB Australian Transport Safety Bureau CVIR commercial vehicle inspection report GDLS graduated driver licensing scheme P1 priority one STST school traffic safety team
BAC blood alcohol concentration CVIU commercial vehicle investigation unit HMV heavy motor vehicle PEO Police education officer T&C tasking and coordination
CBT compulsory breath test EBT evidential breath test ICPP iwi-led crime and crash prevention plan PIB Police Infringement Bureau TCR Traffic Crash Report
CIT compulsory impairment test (drug) FTE full time equivalent staff ION infringement offence notice RUC road user charges TON traffic offence notice
16
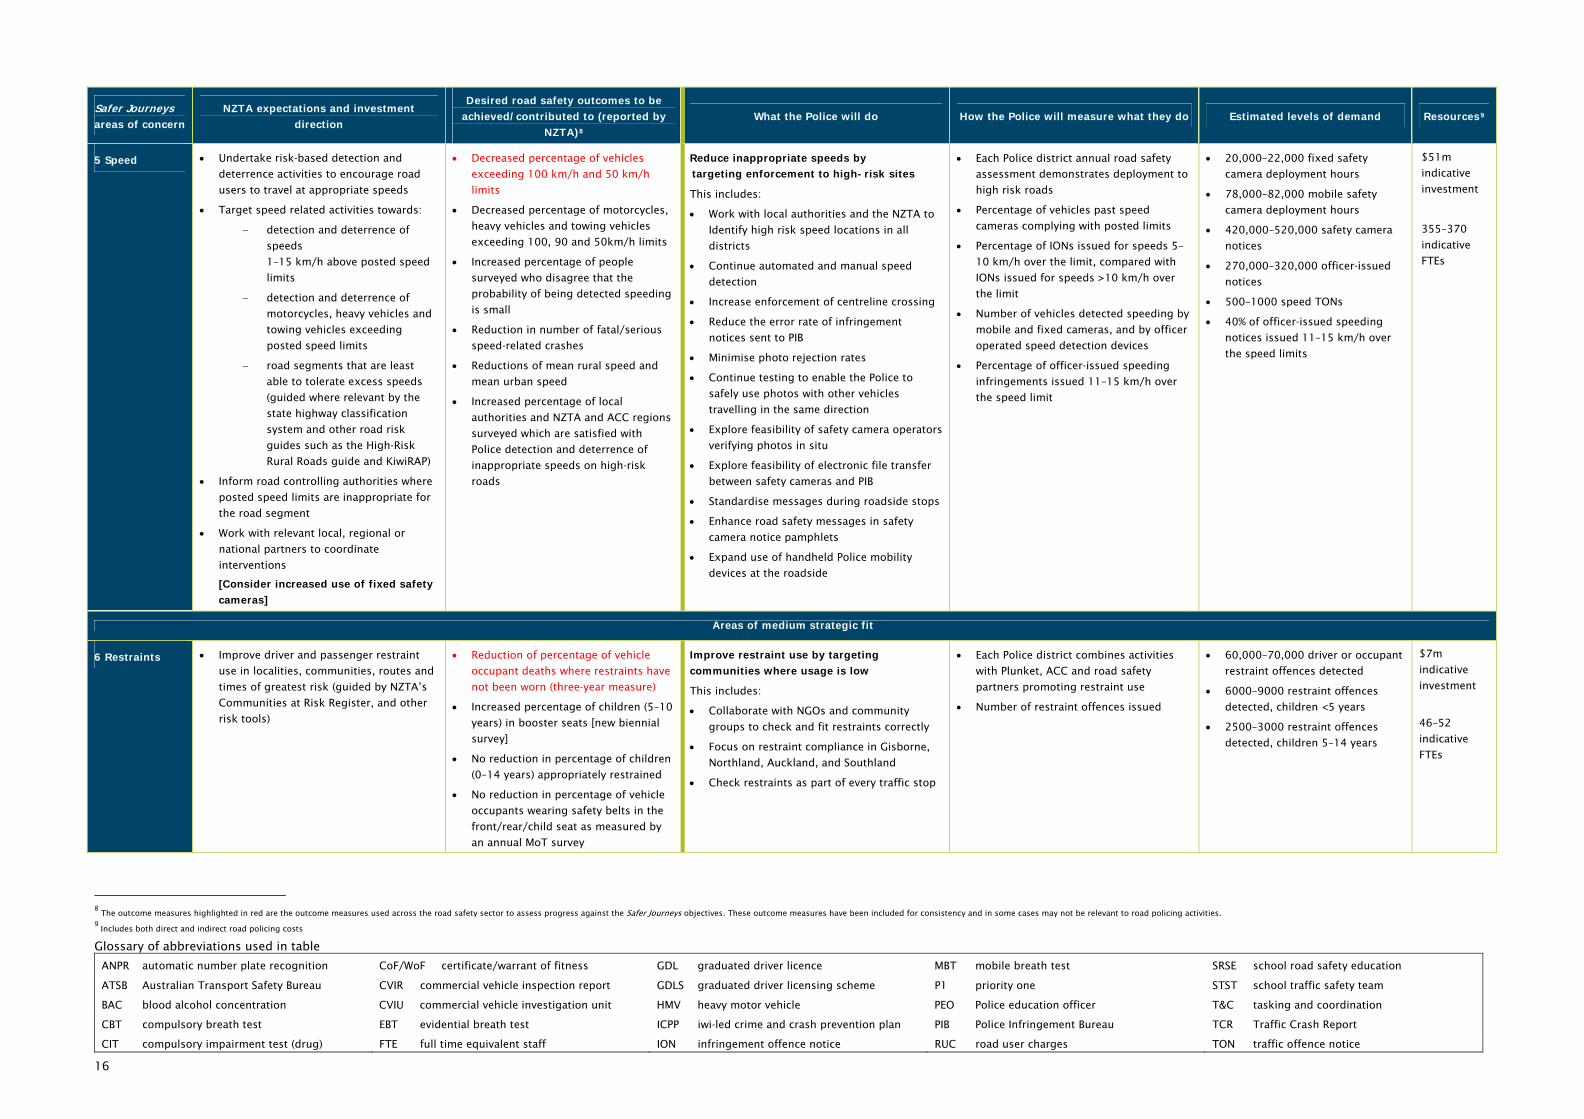
Safer Journeys
areas of concern
NZTA expectations and investment
direction
Desired road safety outcomes to be
achieved/contributed to (reported by
NZTA)8
What the Police will do How the Police will measure what they do Estimated levels of demand Resources9
5 Speed Undertake risk-based detection and
deterrence activities to encourage road
users to travel at appropriate speeds
Target speed related activities towards:
detection and deterrence of
speeds
1–15 km/h above posted speed
limits
detection and deterrence of
motorcycles, heavy vehicles and
towing vehicles exceeding
posted speed limits
road segments that are least
able to tolerate excess speeds
(guided where relevant by the
state highway classification
system and other road risk
guides such as the High-Risk
Rural Roads guide and KiwiRAP)
Inform road controlling authorities where
posted speed limits are inappropriate for
the road segment
Work with relevant local, regional or
national partners to coordinate
interventions
[Consider increased use of fixed safety
cameras]
Decreased percentage of vehicles
exceeding 100 km/h and 50 km/h
limits
Decreased percentage of motorcycles,
heavy vehicles and towing vehicles
exceeding 100, 90 and 50km/h limits
Increased percentage of people
surveyed who disagree that the
probability of being detected speeding
is small
Reduction in number of fatal/serious
speed-related crashes
Reductions of mean rural speed and
mean urban speed
Increased percentage of local
authorities and NZTA and ACC regions
surveyed which are satisfied with
Police detection and deterrence of
inappropriate speeds on high-risk
roads
Reduce inappropriate speeds by
targeting enforcement to high-risk sites
This includes:
Work with local authorities and the NZTA to
Identify high risk speed locations in all
districts
Continue automated and manual speed
detection
Increase enforcement of centreline crossing
Reduce the error rate of infringement
notices sent to PIB
Minimise photo rejection rates
Continue testing to enable the Police to
safely use photos with other vehicles
travelling in the same direction
Explore feasibility of safety camera operators
verifying photos in situ
Explore feasibility of electronic file transfer
between safety cameras and PIB
Standardise messages during roadside stops
Enhance road safety messages in safety
camera notice pamphlets
Expand use of handheld Police mobility
devices at the roadside
Each Police district annual road safety
assessment demonstrates deployment to
high risk roads
Percentage of vehicles past speed
cameras complying with posted limits
Percentage of IONs issued for speeds 5–
10 km/h over the limit, compared with
IONs issued for speeds >10 km/h over
the limit
Number of vehicles detected speeding by
mobile and fixed cameras, and by officer
operated speed detection devices
Percentage of officer-issued speeding
infringements issued 11–15 km/h over
the speed limit
20,000–22,000 fixed safety
camera deployment hours
78,000–82,000 mobile safety
camera deployment hours
420,000–520,000 safety camera
notices
270,000–320,000 officer-issued
notices
500–1000 speed TONs
40% of officer-issued speeding
notices issued 11–15 km/h over
the speed limits
$51m
indicative
investment
355–370
indicative
FTEs
Areas of medium strategic fit
6 Restraints Improve driver and passenger restraint
use in localities, communities, routes and
times of greatest risk (guided by NZTA’s
Communities at Risk Register, and other
risk tools)
Reduction of percentage of vehicle
occupant deaths where restraints have
not been worn (three-year measure)
Increased percentage of children (5–10
years) in booster seats [new biennial
survey]
No reduction in percentage of children
(0–14 years) appropriately restrained
No reduction in percentage of vehicle
occupants wearing safety belts in the
front/rear/child seat as measured by
an annual MoT survey
Improve restraint use by targeting
communities where usage is low
This includes:
Collaborate with NGOs and community
groups to check and fit restraints correctly
Focus on restraint compliance in Gisborne,
Northland, Auckland, and Southland
Check restraints as part of every traffic stop
Each Police district combines activities
with Plunket, ACC and road safety
partners promoting restraint use
Number of restraint offences issued
60,000–70,000 driver or occupant
restraint offences detected
6000–9000 restraint offences
detected, children <5 years
2500–3000 restraint offences
detected, children 5–14 years
$7m
indicative
investment
46–52
indicative
FTEs
8 The outcome measures highlighted in red are the outcome measures used across the road safety sector to assess progress against the Safer Journeys objectives. These outcome measures have been included for consistency and in some cases may not be relevant to road policing activities.
9 Includes both direct and indirect road policing costs
Glossary of abbreviations used in table
ANPR automatic number plate recognition CoF/WoF certificate/warrant of fitness GDL graduated driver licence MBT mobile breath test SRSE school road safety education
ATSB Australian Transport Safety Bureau CVIR commercial vehicle inspection report GDLS graduated driver licensing scheme P1 priority one STST school traffic safety team
BAC blood alcohol concentration CVIU commercial vehicle investigation unit HMV heavy motor vehicle PEO Police education officer T&C tasking and coordination
CBT compulsory breath test EBT evidential breath test ICPP iwi-led crime and crash prevention plan PIB Police Infringement Bureau TCR Traffic Crash Report
CIT compulsory impairment test (drug) FTE full time equivalent staff ION infringement offence notice RUC road user charges TON traffic offence notice
17
Safer Journeys
areas of concern
NZTA expectations and investment
direction
Desired road safety outcomes to be
achieved/contributed to (reported by
NZTA)10
What the Police will do How the Police will measure what they do Estimated levels of demand Resources11
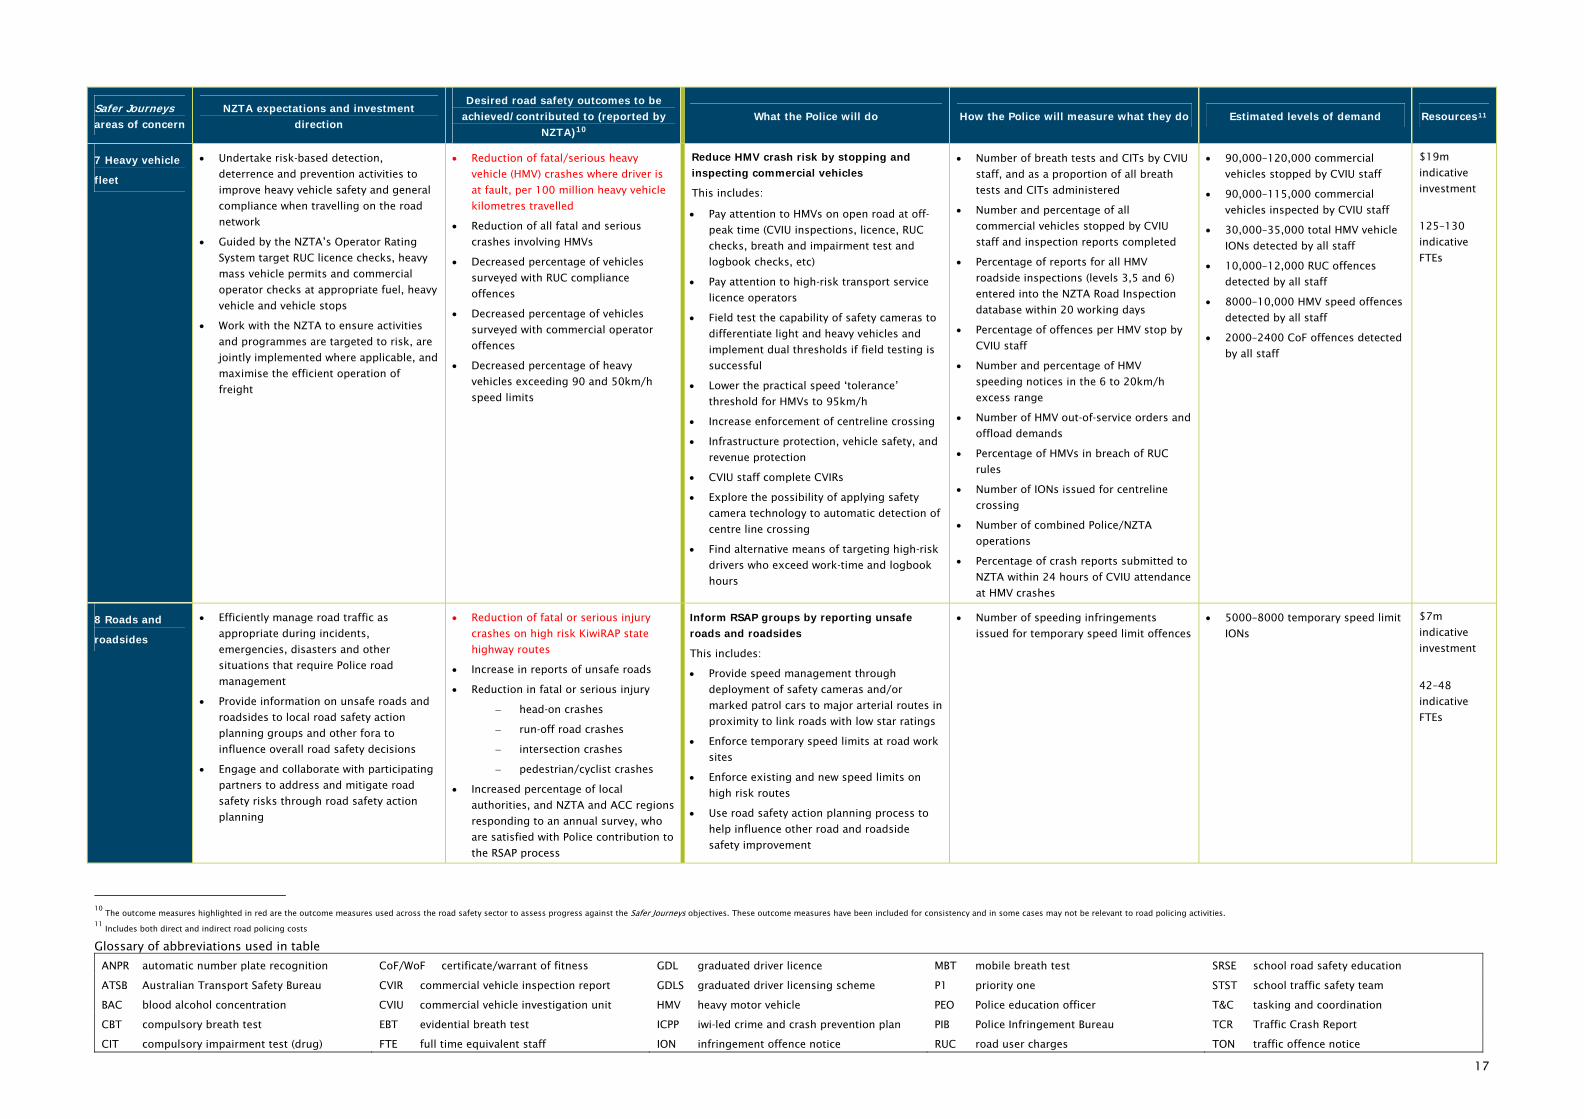
7 Heavy vehicle
fleet
Undertake risk-based detection,
deterrence and prevention activities to
improve heavy vehicle safety and general
compliance when travelling on the road
network
Guided by the NZTA’s Operator Rating
System target RUC licence checks, heavy
mass vehicle permits and commercial
operator checks at appropriate fuel, heavy
vehicle and vehicle stops
Work with the NZTA to ensure activities
and programmes are targeted to risk, are
jointly implemented where applicable, and
maximise the efficient operation of
freight
Reduction of fatal/serious heavy
vehicle (HMV) crashes where driver is
at fault, per 100 million heavy vehicle
kilometres travelled
Reduction of all fatal and serious
crashes involving HMVs
Decreased percentage of vehicles
surveyed with RUC compliance
offences
Decreased percentage of vehicles
surveyed with commercial operator
offences
Decreased percentage of heavy
vehicles exceeding 90 and 50km/h
speed limits
Reduce HMV crash risk by stopping and
inspecting commercial vehicles
This includes:
Pay attention to HMVs on open road at off-
peak time (CVIU inspections, licence, RUC
checks, breath and impairment test and
logbook checks, etc)
Pay attention to high-risk transport service
licence operators
Field test the capability of safety cameras to
differentiate light and heavy vehicles and
implement dual thresholds if field testing is
successful
Lower the practical speed ‘tolerance’
threshold for HMVs to 95km/h
Increase enforcement of centreline crossing
Infrastructure protection, vehicle safety, and
revenue protection
CVIU staff complete CVIRs
Explore the possibility of applying safety
camera technology to automatic detection of
centre line crossing
Find alternative means of targeting high-risk
drivers who exceed work-time and logbook
hours
Number of breath tests and CITs by CVIU
staff, and as a proportion of all breath
tests and CITs administered
Number and percentage of all
commercial vehicles stopped by CVIU
staff and inspection reports completed
Percentage of reports for all HMV
roadside inspections (levels 3,5 and 6)
entered into the NZTA Road Inspection
database within 20 working days
Percentage of offences per HMV stop by
CVIU staff
Number and percentage of HMV
speeding notices in the 6 to 20km/h
excess range
Number of HMV out-of-service orders and
offload demands
Percentage of HMVs in breach of RUC
rules
Number of IONs issued for centreline
crossing
Number of combined Police/NZTA
operations
Percentage of crash reports submitted to
NZTA within 24 hours of CVIU attendance
at HMV crashes
90,000–120,000 commercial
vehicles stopped by CVIU staff
90,000–115,000 commercial
vehicles inspected by CVIU staff
30,000–35,000 total HMV vehicle
IONs detected by all staff
10,000–12,000 RUC offences
detected by all staff
8000–10,000 HMV speed offences
detected by all staff
2000–2400 CoF offences detected
by all staff
$19m
indicative
investment
125–130
indicative
FTEs
8 Roads and
roadsides
Efficiently manage road traffic as
appropriate during incidents,
emergencies, disasters and other
situations that require Police road
management
Provide information on unsafe roads and
roadsides to local road safety action
planning groups and other fora to
influence overall road safety decisions
Engage and collaborate with participating
partners to address and mitigate road
safety risks through road safety action
planning
Reduction of fatal or serious injury
crashes on high risk KiwiRAP state
highway routes
Increase in reports of unsafe roads
Reduction in fatal or serious injury
head-on crashes
run-off road crashes
intersection crashes
pedestrian/cyclist crashes
Increased percentage of local
authorities, and NZTA and ACC regions
responding to an annual survey, who
are satisfied with Police contribution to
the RSAP process
Inform RSAP groups by reporting unsafe
roads and roadsides
This includes:
Provide speed management through
deployment of safety cameras and/or
marked patrol cars to major arterial routes in
proximity to link roads with low star ratings
Enforce temporary speed limits at road work
sites
Enforce existing and new speed limits on
high risk routes
Use road safety action planning process to
help influence other road and roadside
safety improvement
Number of speeding infringements
issued for temporary speed limit offences
5000–8000 temporary speed limit
IONs
$7m
indicative
investment
42–48
indicative
FTEs
10
The outcome measures highlighted in red are the outcome measures used across the road safety sector to assess progress against the Safer Journeys objectives. These outcome measures have been included for consistency and in some cases may not be relevant to road policing activities. 11
Includes both direct and indirect road policing costs
Glossary of abbreviations used in table
ANPR automatic number plate recognition CoF/WoF certificate/warrant of fitness GDL graduated driver licence MBT mobile breath test SRSE school road safety education
ATSB Australian Transport Safety Bureau CVIR commercial vehicle inspection report GDLS graduated driver licensing scheme P1 priority one STST school traffic safety team
BAC blood alcohol concentration CVIU commercial vehicle investigation unit HMV heavy motor vehicle PEO Police education officer T&C tasking and coordination
CBT compulsory breath test EBT evidential breath test ICPP iwi-led crime and crash prevention plan PIB Police Infringement Bureau TCR Traffic Crash Report
CIT compulsory impairment test (drug) FTE full time equivalent staff ION infringement offence notice RUC road user charges TON traffic offence notice
18
Safer Journeys
areas of concern
NZTA expectations and investment
direction
Desired road safety outcomes to be
achieved/contributed to (reported by
NZTA)12
What the Police will do How the Police will measure what they do Estimated levels of demand Resources13
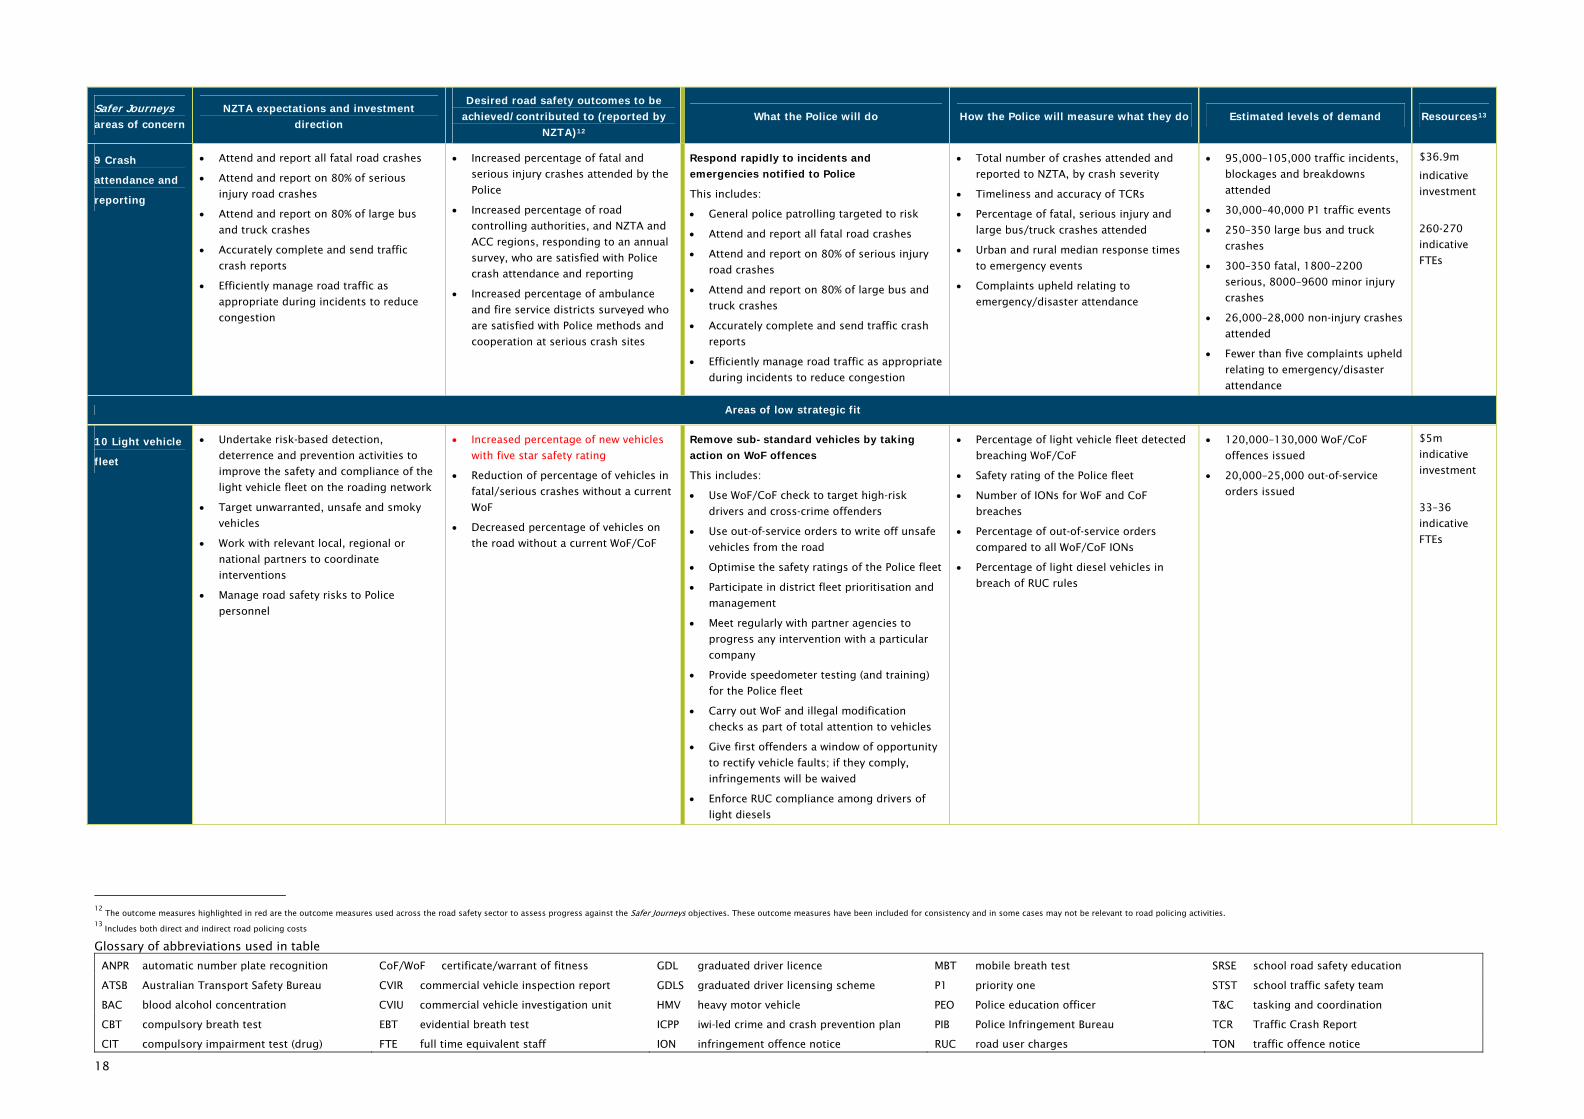
9 Crash
attendance and
reporting
Attend and report all fatal road crashes
Attend and report on 80% of serious
injury road crashes
Attend and report on 80% of large bus
and truck crashes
Accurately complete and send traffic
crash reports
Efficiently manage road traffic as
appropriate during incidents to reduce
congestion
Increased percentage of fatal and
serious injury crashes attended by the
Police
Increased percentage of road
controlling authorities, and NZTA and
ACC regions, responding to an annual
survey, who are satisfied with Police
crash attendance and reporting
Increased percentage of ambulance
and fire service districts surveyed who
are satisfied with Police methods and
cooperation at serious crash sites
Respond rapidly to incidents and
emergencies notified to Police
This includes:
General police patrolling targeted to risk
Attend and report all fatal road crashes
Attend and report on 80% of serious injury
road crashes
Attend and report on 80% of large bus and
truck crashes
Accurately complete and send traffic crash
reports
Efficiently manage road traffic as appropriate
during incidents to reduce congestion
Total number of crashes attended and
reported to NZTA, by crash severity
Timeliness and accuracy of TCRs
Percentage of fatal, serious injury and
large bus/truck crashes attended
Urban and rural median response times
to emergency events
Complaints upheld relating to
emergency/disaster attendance
95,000–105,000 traffic incidents,
blockages and breakdowns
attended
30,000–40,000 P1 traffic events
250–350 large bus and truck
crashes
300–350 fatal, 1800–2200
serious, 8000–9600 minor injury
crashes
26,000–28,000 non-injury crashes
attended
Fewer than five complaints upheld
relating to emergency/disaster
attendance
$36.9m
indicative
investment
260-270
indicative
FTEs
Areas of low strategic fit
10 Light vehicle
fleet
Undertake risk-based detection,
deterrence and prevention activities to
improve the safety and compliance of the
light vehicle fleet on the roading network
Target unwarranted, unsafe and smoky
vehicles
Work with relevant local, regional or
national partners to coordinate
interventions
Manage road safety risks to Police
personnel
Increased percentage of new vehicles
with five star safety rating
Reduction of percentage of vehicles in
fatal/serious crashes without a current
WoF
Decreased percentage of vehicles on
the road without a current WoF/CoF
Remove sub-standard vehicles by taking
action on WoF offences
This includes:
Use WoF/CoF check to target high-risk
drivers and cross-crime offenders
Use out-of-service orders to write off unsafe
vehicles from the road
Optimise the safety ratings of the Police fleet
Participate in district fleet prioritisation and
management
Meet regularly with partner agencies to
progress any intervention with a particular
company
Provide speedometer testing (and training)
for the Police fleet
Carry out WoF and illegal modification
checks as part of total attention to vehicles
Give first offenders a window of opportunity
to rectify vehicle faults; if they comply,
infringements will be waived
Enforce RUC compliance among drivers of
light diesels
Percentage of light vehicle fleet detected
breaching WoF/CoF
Safety rating of the Police fleet
Number of IONs for WoF and CoF
breaches
Percentage of out-of-service orders
compared to all WoF/CoF IONs
Percentage of light diesel vehicles in
breach of RUC rules
120,000–130,000 WoF/CoF
offences issued
20,000–25,000 out-of-service
orders issued
$5m
indicative
investment
33–36
indicative
FTEs
12
The outcome measures highlighted in red are the outcome measures used across the road safety sector to assess progress against the Safer Journeys objectives. These outcome measures have been included for consistency and in some cases may not be relevant to road policing activities. 13
Includes both direct and indirect road policing costs
Glossary of abbreviations used in table
ANPR automatic number plate recognition CoF/WoF certificate/warrant of fitness GDL graduated driver licence MBT mobile breath test SRSE school road safety education
ATSB Australian Transport Safety Bureau CVIR commercial vehicle inspection report GDLS graduated driver licensing scheme P1 priority one STST school traffic safety team
BAC blood alcohol concentration CVIU commercial vehicle investigation unit HMV heavy motor vehicle PEO Police education officer T&C tasking and coordination
CBT compulsory breath test EBT evidential breath test ICPP iwi-led crime and crash prevention plan PIB Police Infringement Bureau TCR Traffic Crash Report
CIT compulsory impairment test (drug) FTE full time equivalent staff ION infringement offence notice RUC road user charges TON traffic offence notice
19
Safer Journeys
areas of concern
NZTA expectations and investment
direction
Desired road safety outcomes to be
achieved/contributed to (reported by
NZTA)14
What the Police will do How the Police will measure what they do Estimated levels of demand Resources15
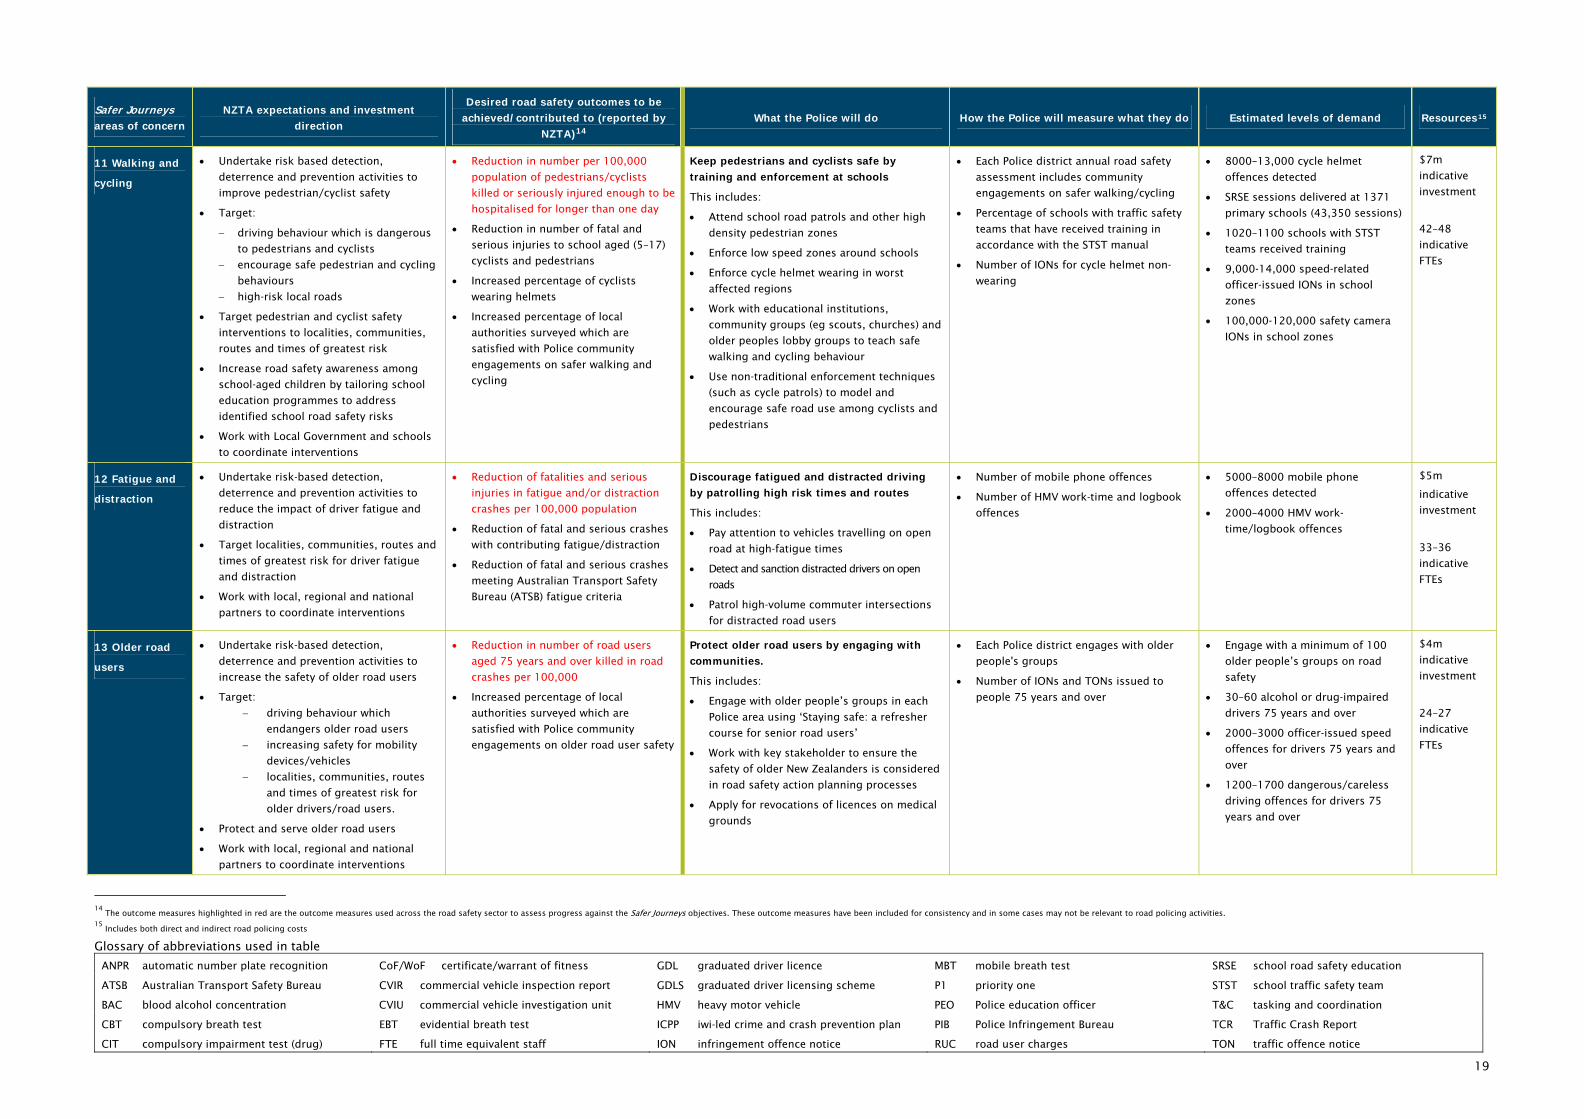
11 Walking and
cycling
Undertake risk based detection,
deterrence and prevention activities to
improve pedestrian/cyclist safety
Target:
driving behaviour which is dangerous
to pedestrians and cyclists
encourage safe pedestrian and cycling
behaviours
high-risk local roads
Target pedestrian and cyclist safety
interventions to localities, communities,
routes and times of greatest risk
Increase road safety awareness among
school-aged children by tailoring school
education programmes to address
identified school road safety risks
Work with Local Government and schools
to coordinate interventions
Reduction in number per 100,000
population of pedestrians/cyclists
killed or seriously injured enough to be
hospitalised for longer than one day
Reduction in number of fatal and
serious injuries to school aged (5–17)
cyclists and pedestrians
Increased percentage of cyclists
wearing helmets
Increased percentage of local
authorities surveyed which are
satisfied with Police community
engagements on safer walking and
cycling
Keep pedestrians and cyclists safe by
training and enforcement at schools
This includes:
Attend school road patrols and other high
density pedestrian zones
Enforce low speed zones around schools
Enforce cycle helmet wearing in worst
affected regions
Work with educational institutions,
community groups (eg scouts, churches) and
older peoples lobby groups to teach safe
walking and cycling behaviour
Use non-traditional enforcement techniques
(such as cycle patrols) to model and
encourage safe road use among cyclists and
pedestrians
Each Police district annual road safety
assessment includes community
engagements on safer walking/cycling
Percentage of schools with traffic safety
teams that have received training in
accordance with the STST manual
Number of IONs for cycle helmet non-
wearing
8000–13,000 cycle helmet
offences detected
SRSE sessions delivered at 1371
primary schools (43,350 sessions)
1020–1100 schools with STST
teams received training
9,000-14,000 speed-related
officer-issued IONs in school
zones
100,000-120,000 safety camera
IONs in school zones
$7m
indicative
investment
42–48
indicative
FTEs
12 Fatigue and
distraction
Undertake risk-based detection,
deterrence and prevention activities to
reduce the impact of driver fatigue and
distraction
Target localities, communities, routes and
times of greatest risk for driver fatigue
and distraction
Work with local, regional and national
partners to coordinate interventions
Reduction of fatalities and serious
injuries in fatigue and/or distraction
crashes per 100,000 population
Reduction of fatal and serious crashes
with contributing fatigue/distraction
Reduction of fatal and serious crashes
meeting Australian Transport Safety
Bureau (ATSB) fatigue criteria
Discourage fatigued and distracted driving
by patrolling high risk times and routes
This includes:
Pay attention to vehicles travelling on open
road at high-fatigue times
Detect and sanction distracted drivers on open
roads
Patrol high-volume commuter intersections
for distracted road users
Number of mobile phone offences
Number of HMV work-time and logbook
offences
5000–8000 mobile phone
offences detected
2000–4000 HMV work-
time/logbook offences
$5m
indicative
investment
33–36
indicative
FTEs
13 Older road
users
Undertake risk-based detection,
deterrence and prevention activities to
increase the safety of older road users
Target:
driving behaviour which
endangers older road users
increasing safety for mobility
devices/vehicles
localities, communities, routes
and times of greatest risk for
older drivers/road users.
Protect and serve older road users
Work with local, regional and national
partners to coordinate interventions
Reduction in number of road users
aged 75 years and over killed in road
crashes per 100,000
Increased percentage of local
authorities surveyed which are
satisfied with Police community
engagements on older road user safety
Protect older road users by engaging with
communities.
This includes:
Engage with older people’s groups in each
Police area using ‘Staying safe: a refresher
course for senior road users’
Work with key stakeholder to ensure the
safety of older New Zealanders is considered
in road safety action planning processes
Apply for revocations of licences on medical
grounds
Each Police district engages with older
people's groups
Number of IONs and TONs issued to
people 75 years and over
Engage with a minimum of 100
older people’s groups on road
safety
30–60 alcohol or drug-impaired
drivers 75 years and over
2000–3000 officer-issued speed
offences for drivers 75 years and
over
1200–1700 dangerous/careless
driving offences for drivers 75
years and over
$4m
indicative
investment
24–27
indicative
FTEs
14
The outcome measures highlighted in red are the outcome measures used across the road safety sector to assess progress against the Safer Journeys objectives. These outcome measures have been included for consistency and in some cases may not be relevant to road policing activities. 15
Includes both direct and indirect road policing costs