RNI No.: MPENG01246/12/1/2014-TC ISSN-0972-1479(Print ...
137
RNI No.: MPENG01246/12/1/2014-TC ISSN-0972-1479(Print) | ISSN-2395-6127 (Online) Indian Journal of Accounting General Impact Factor 2.4602 (Indexed in COSMOS Foundation & Electronic Journal Library EZB, Germany) Volume: 51 (1) June, 2019 Regd. No. : 429/68-69 A National Bi-annual Double Blind Peer Reviewed Refereed Journal of IAA
Transcript of RNI No.: MPENG01246/12/1/2014-TC ISSN-0972-1479(Print ...

RNI No.: MPENG01246/12/1/2014-TCISSN-0972-1479(Print) | ISSN-2395-6127 (Online)
Indian Journal of Accounting
General Impact Factor 2.4602
(Indexed in COSMOS Foundation & Electronic Journal Library EZB, Germany)
Volume: 51 (1) June, 2019
Regd. No. : 429/68-69
A National Bi-annual Double Blind Peer Reviewed Refereed Journal of IAA

EDITORIAL BOARD - IJAChIEF EDItOr
prOFEssOr (Dr.) ss MODIFormer Head
Department of Accountancy and Business StatisticsFaculty of Commerce, PG School of Commerce
University of Rajasthan, Jaipur-302004 Rajasthan (India)25, Modi Sadan, Sudama Nagar, Opp. Glass Factory, Tonk Road, Jaipur-302018 Rajasthan
Email ID: [email protected], [email protected] No. +91-98293 21067
EDItOrs Dr. Daksha Pratap Sinh Chauhan
Professor, Head & Dean, Department of CommerceSaurashtra University, Rajkot - 360005 Gujarat
Email ID: [email protected]
Dr. M. C. SharmaFormer Professor, Head & Dean
Deptt. of Accountancy and Business StatisticsUniversity of Rajasthan, Jaipur 302004Email ID: [email protected]
AssOCIAtE EDItOrs
ADVIsOry CuM rEVIEWErs BOArD Prof. B. Banerjee
Ex- President IAA, Kolkata
Prof. Nageshwar RaoEx- President IAA & VC
Uttarakhand Open University, Dehradun
Prof. M. B. ShuklaEx- President IAA, Varanasi
Prof. G. L. DaveEx- President IAA, Jodhpur
Prof. K. Sasi KumarEx- President IAA, Thiuvananthapuram
Prof. Rajendra P.SrivastavaDirector-CARAT, USA
Prof. Arvind Kumar President IAA, Lucknow
Prof. K.S. ThakurJiwaji University, Gwalior
Prof. G. Soral M.L.S.U., Udaipur
Prof. M. L. VaderaManipal University, Jaipur
Prof. Sanjay Bhayani Saurashtra University, Rajkot
Dr. Sunita Srivastava Lucknow University, Lucknow
Prof. N. M. KhandelwalEx- President IAA, Ajmer
Prof. B. RameshEx- President IAA, Goa
Prof. B. MohanEx- President IAA, Tirupati
Prof. Ranjan K. BalEx-President IAA, Bhubaneswar
Prof. Harish OzaEx- President IAA, Ahmedabad
Prof. Pratap Sinh Chauhan Ex-President IAA & VC
Saurashtra University, Rajkot
Prof. Karmajeet SinghPanjab University, Chandigarh
Prof. H. K. Singh Banaras Hindu University, Varanasi
Prof. Ram MilanLucknow University, Lucknow
Prof. J.K. Jain H.S.Gaur University, Sagar
Prof. Arindam GuptaVidya Sagar University, Midnapur
Dr. Prakash SharmaUniversity of Rajasthan, Jaipur
Prof. R. K. Gupta V.C. Maharaja Agrasen University
Himachal Pradesh
Prof. K.R.SharmaEx-President IAA, Udaipur
Prof. K. EresiEx-President IAA, Bangalore
Prof. B.S. RajpurohitEx- President IAA, Jodhpur
Prof. K.V. AchalapatiEx-President IAA, Hyderabad
Prof. Umesh HolaniEx- President IAA, Gwalior
Prof. D. Prabhakara Rao Ex- President IAA, Visakhapatnam
Prof. M. RajuBangalore University, Bengaluru
Prof. Prashant KumarVaranasi
Prof. M. Ramachandra GowdaBangalore University, Bengaluru
Prof. S. K. Khatik Barkatullah University, Bhopal
Dr. Ravi SharmaMahaveer Comm. College, Jaipur
Prof. Jitendra K SharmaProfessor
GGD SD (PG & Research) CentrePalwal-121102 Haryana
Email ID: [email protected]
CMA Dr. B.L. GuptaFormer Associate Professor
Department of ABSTUniversity of Rajasthan
Jaipur-302004 RajasthanEmail ID: [email protected]
Dr. Pushpendra Misra Associate Prof., Department of Comm.
Dr. Shakuntala Misra National Rehab. Univ. (D.S.M.N.R.U.) Lucknow-226017 U.P.
Email ID: [email protected]
Dr. R. K. TailorHead, Deptt. of Accounting & Taxation
The IIS University, MansarovarJaipur-302020 Rajasthan
Email ID: [email protected]
Dr. Vinod Kumar BhatnagarHead and Associate ProfessorInstitute of Professional Studies
Gwalior- 474001 M.P.Email ID: [email protected]
Dr. Ravi Kant ModiAsst. Prof., Department of CommerceLBS PG College, Affil. to Univ. of Raj.Tilak Nagar, Jaipur-302004 Rajasthan
Email ID: [email protected]

* Indian Journal of Accounting is an official publication of Indian Accounting Association.
It is a blind reviewed refereed indexed journal published twice a year, in June and
December respectively with an ISSN-0972-1479. The scope of journal encompasses all
areas of Accounting including Corporate Accounting, Auditing, Taxation, Management
Accounting, Cost Accounting, finance and Information Systems. Manuscripts should be
addressed to Professor (Dr.) S.S. Modi, Chief Editor, Indian Journal of Accounting,
25, Modi Sadan, Sudama Nagar Opp. Glass Factory, Tonk Road, Jaipur –302018 (Raj).
(M) 9829321067 Email: [email protected]
Guidelines for Submission
All submitted manuscripts must be original. Paper submission must accompany a
certificate/ declaration by the author(s) that the paper is his/ their original work and has
neither been published nor submitted for publication elsewhere.
Manuscript must be in MS Word processor in Calibri font 12 pt font size on A-4 size paper
with 1" margin from all sides with 1.5 line spacing, and justified.
References should appear at the end of the paper printed in single space with 10pt. font
size. References should be listed as per the APA Citation Format latest Edition.
The length of the paper should be limited to approximately 12 pages including references
(as per the specified layout) excluding tables and figures.
Tables, figures, etc. should be serially numbered and duly acknowledged. Sources of the
data need to be given below each table or figure.
All but very short mathematical expressions should be displayed on a separate line and
centered. Equations must be numbered consecutively on the right margin, using Arabic
numerals in parentheses.
Papers should have an abstract of about 150-250 words.
The cover page of the paper should contain-Title of the paper, Name of author(s),
Professional affiliation of author(s), Address for correspondence with email and
telephone numbers.
The name of the author(s) should not appear on the manuscript to facilitate blind review.
Editorial decision regarding publication will be communicated within a month from
receipt of the manuscript.
The views expressed in the papers do not reflect the opinions of Indian Accounting
Association.
Prof. (Dr.) S.S. ModiChief Editor
Indian Journal of Accounting (IJA)
Former Head, Department of ABST, Faculty of Commerce, University of Rajasthan
Jaipur, Rajasthan, India.
CALL FOR PAPERS

This Journal is sent free of charge to all members of Indian Accounting Association
Cost is less than ` 48/-
Prof. (Dr.) S. S. ModiChief Editor, Indian Journal of Accounting
25, Modi Sadan, Sudama NagarOpp. Glass Factory, Tonk Road, Jaipur-302018
Web: indianaccounting.orgEmail:- [email protected]
(M) : 098293-21067
Printed in India by at Published Prof. (Dr.) S. S. Modi Akrati Advertisers, Jaipur, Rajasthan and by him on behalf of the Indian Accounting Association, Udaipur -313001, Rajasthan.
INDIAN JOURNAL OF ACCOUNTING (IJA)
Please send your subscription through Bank Draft to “Treasurer, Indian Accounting Association Rajkot” addressed to Dr. Sanjay Bhyani, Professor, Smt. R. D. Gardi Dept. of Business Management, Saurashtra University, Rajkot- 360 005.
Annual Annual Life Membership
Individuals ` 500 ` 3,600 US $ 50 US $ 200
Institutions ` 2,000 ` 8,000 US $ 150 US $ 500
Life Membership
India Outside India

RNI NO.: MPENG01246/12/1/2014-TC
ISSN-0972-1479(PRINT) | ISSN-2395-6127 (ONLINE) REGD. NO. : 429/68-69
INDIAN JOURNAL OF ACCOUNTING
GENERAL IMPACT FACTOR 2.4602
(INDEXED IN COSMOS FOUNDATION & ELECTRONIC JOURNAL LIBRARY EZB, GERMANY)
Volume 51 No. 01 June, 2019
CONTENTS
S.
No. Title of the Research Paper
Page
No.
1. MANDATORY ADOPTION OF IND AS (IFRS CONVERGED STANDARDS): A STUDY ON DISCLOSURE PRACTICE OF INDIAN COMPANIES
Professor (Dr.) Satyajit Dhar
01-09
2. UNVEIL THE SCOPE OF ADOPTION OF COMPUTER ASSISTED
AUDIT TOOLS AND TECHNIQUES (CAATTs)
Neelam Yadav & Dr. Shurveer S. Bhanawat
10-24
3. ROLE OF XBRL IN PROMOTING THE INTEGRATED REPORTING IN
INDIAN SCENARIO
Dr. M L Ashok & Abhishek N
25-33
4. STOCK MARKET VOLATILITY IN MAJOR INDICES OF WORLD: AN
ANALYTICAL STUDY OF BSE SENSEX, NASDAQ, HANG SANG,
NIKKEI AND DOW JONES
Dr. S.K. Khatik & Mr. Milind Patil
34-42
5. AN ANALYSIS OF FINANCIAL PERFORMANCE OF PETROLEUM
COMPANIES BY USING ALTMAN Z - SCORE ANALYSIS (WITH
SPECIAL REFERENCE TO BHARAT PETROLEUM CORPORATION
LTD, INDIAN OIL CORPORATION LTD & HINDUSTAN PETROLEUM
CORPORATION LTD.)
C.Ramshesh & Dr. Sreenivas
43-50
6. INVESTOR PERCEPTION ON THE USEFULNESS OF INTERIM
FINANCIAL REPORTS IN INDIA: AN EMPIRICAL STUDY
Dr. Ramdhan Saini & Dr. Prakash Sharma
51-58
7. ROBOT HUMAN INTERACTION: ROLE OF ARTIFICIAL
INTELLIGENCE IN ACCOUNTING AND AUDITING
Dr. Om Prakash Gusai
59-62

ii
8. IMPACT OF STOCK SPLIT ON SHORT-TERM LIQUIDITY OF STOCKS
IN EX-SPLIT PERIOD: EVIDENCE FROM INDIAN STOCK MARKET
Dr. Pradipta Banerjee
63-72
9. DOES CORPORATE REPORTING UNDER IFRS IMPACT GLOBAL
CAPITAL MOBILIZATION?: A CASE STUDY OF DR. REDDY’S
LABORATORIES LIMITED
MD Suleman
73-79
10. STATUS OF NOMINATION AND REMUNERATION COMMITTEE IN
THE LIGHT OF SEBI’S LODR 2015 REGULATIONS (A CASE STUDY
OF BANKING AND HOUSING FINANCE SECTOR COMPANIES
INCLUDED BSE SENSEX COMPANIES)
CMA Dr. Meenu Maheshwari
80-84
11. A STUDY ON QUANTUM OF DISCLOSURE AND ITS ASSOCIATION
WITH CORPORATE ATTRIBUTES (WITH SPECIAL REFERENCE TO
PHARMACEUTICAL COMPANIES)
Dr. Sarika Jindal & Dr. Satish Maheshwari
85-90
12. AWARENESS AND IMPACT OF GST AMONG SMALL BUSINESS
OWNERS: A STUDY OF MANDSAUR CITY IN M.P.
Dr. Mukesh K. Sharma & Suniti Saini
91-100
13. FDI POLICY IN INDIA: EMERGING ISSUES
Dr. Arvind S. Luhar & Dr. Shama Shah
101-106
14. A STUDY ON IMPACT OF MERGER OF CMC ON FINANCIAL
PERFORMANCE OF TCS
Ms. Dhartiben P. Rami, Dr. Kamini Shah & Prof (Dr) Sandip Bhatt
107-112
15. FINANCIAL LEVERAGE, EARNINGS AND DIVIDEND: AN EMPIRICAL
ANALYSIS OF SELECTED STEEL COMPANIES IN INDIA
Dr. Butalal Ajmera
113-121
16. CONCEPTUAL FRAMEWORK OF CLOUD ACCOUNTING
Ravikant Jaiswal & Prof. K.S Jaiswal
122-124
17. BOOK REVIEW
QUALITY CONTROL PROCEDURES FOR STATUTORY FINANCIAL
AUDIT: AN EMPIRICAL STUDY
Dr. Bikram Singh
125-127

Indian Journal of Accounting (IJA) 1ISSN : 0972-1479 (Print) 2395-6127 (Online) Vol. 51 (1), June, 2019, pp. 01-09
MANDATORY ADOPTION OF IND AS(IFRS CONVERGED STANDARDS):
A STUDY ON DISCLOSURE PRACTICE OF INDIAN COMPANIES
Professor (Dr.) Satyajit Dhar
ABSTRACT
Indian financial reporting is having a historic and landmark change through thetransition from Indian GAAP to Ind-AS from annual period beginning on or after April 1, 2016.Convergence with IFRS set of standards is made in India with carve outs to take care of localissues relevant to the country. IFRS converged standards are known as Indian AccountingStandards (Ind-AS) and containing a good number of carve outs from IFRS. The studyanalyzes the disclosure practice of companies who are required to adopt Ind-AS in the firstphase w.e.f. 1.4.2016. The companies are selected on random basis from the population ofListed first phase Ind-AS adopters. The disclosures in 2015-16 financial year (FY) or 2015calendar year along with disclosures in the interim financial results of the first quarter of 2016-17 are studied . The results of the study indicate that there is wide diversity among the samplecompanies regarding disclosure on Ind-AS adoption. A depth analysis of contents of disclosurereveals the companies are not forthcoming with detailed disclosure. It may be hoped thatquality of disclosure will improve over time and the issues of diversity will be addressed overtime through learning process and regulatory interventions.
KEYWORDS: IFRS, Financial Reporting, Convergence, Ind-AS, Emerging Markets,._______________
IntroductionIndian financial reporting is having a historic and landmark change through the
transition from Indian GAAP to IFRS converged standards from annual period beginning on orafter April 1, 2016. Convergence with IFRS set of standards is made in two ways. One isadoption of IFRS set of standards in totality and other is preparation of IFRS converged set ofstandards with carve outs to take care of local issues relevant to the country concerned. Indiahas taken the second method of adoption and its IFRS converged standards are known asIndian Accounting Standards (IndAS) and containing a good number of carve outs from IFRS.The Ministry of Corporate Affairs(MCA) has laid down the road map for application of IFRSconverged standards(Ind AS) to Indian companies in a phased manner and mandatory phasehas started from the financial year beginning on or after April 1, 2016 for listed companiesmeeting prescribed threshold conditions.
Against this backdrop, the study is aimed to analyze the disclosure practice ofcompanies who are required to adopt Ind AS in the first phase w.e.f. 1.4.2016. The companiesare selected on random basis from the population of Listed first phase Ind AS adopters. The
Department of Business Administration, University of Kalyani, Kalyani, Nadia, West Bengal, India.

2 Indian Journal of Accounting (IJA) Vol. 51 (1), June, 2019
disclosures in 2015-16 financial year (FY) or 2015 calendar year along with disclosures in theinterim financial results of the first quarter of 2016-17 are studied. The data regardingdisclosure were first handpicked from Annual Reports and quarterly financial result submittedwith stock exchanges. The paper also investigates the impact of IFRS adoption on quarterlyresults of the sample companies.
This is a unique study on impact on quarterly financial results of mandatory IFRSconverged standards on quarterly financial results. Some earlier studies have dealt with suchimpact for voluntary adoption. But voluntary adopters may have different incentives forpreparation of financial statements based on IFRS. Our contribution to literature includes studyon disclosures in quarterly results.
The remainder of the paper is designed as follows: Section 2 gives a brief overview ofthe literature relevant to this paper. The journey of IFRS implementation in India and importantevents are discussed in Section 3.Section 4 provides details about data and methodologyadopted. Section 5 focuses on the findings relating to the extent of disclosure in the interimresults and diversities in such disclosures. In section 6, impact of Ind AS adoption on profit ofsample companies is reported and analyzed. The final section concludes the paper.Review of Earlier Studies
In general, accounting literature provides evidences that accounting qualify hassignificant bearing on economic decision making of stakeholders and thus it has economicconsequences. Obviously, change of GAAP is likely to affect accounting quality. There are agood number of studies, mostly, in the context of European Union Countries, dealing witheconomic consequences of accounting standard changes. It is argued that IFRS adoption willincrease the accounting quality and following economic consequences may follow: Information asymmetry should decrease. Earning management should decrease. Accounting data should be more value relevant. The cost of capital should decrease. Efficiency of capital allocation should increase. Mobility of capital should increase.
Soderstrom& Sun (2007) is a good review article on IFRS adoption and accountingquality. Some important studies in this area include Ashbaugh & Pincus (2001), Cuijpers &Buijink (2005), van Tendeloo & Vanstraelen (2005), Barth et.al. (2006), Bushman et.al. (2006),Hung & Subramanyam (2007), and Armstrong et.al. (2010).
IFRS implementation and related issues are studied from different perspectives. Theimportant areas of different studies may be divided into following categories. Motivation behind convergence with IFRS set of standards. The level of convergence with IFRS among different countries adopting IFRS. The processes of IFRS implementation and differences of these processes. Effects of IFRS implementation particularly, effects on quality of financial reporting
comprising areas like comparability, transparency, disclosure etc. Effects of implementation of IFRS accounting system on the financial performance and
financial position of reporting entities. Value relevance of IFRS based accounting. Value relevance implies the ability of
accounting number to predict changes in the market value of shares of reportingentities.As our study relates to above sub-topics, we concentrate on those and also discuss
India related studies on the process of IFRS implementation.

Professor (Dr.) Satyajit Dhar: Mandatory Adoption of Ind as (IFRS Converged Standards): A...... 3
Convergence with IFRS may be formal and generally imposed through regulatoryprocess. This is called convergence (Craner et al.,2000). Studies on the implementationprocess give stress on the issue of the impact of the national movement. It is assumed thatlocal political and economic institutions have a great impact on the level of convergence andenforcement (Ball, 2006). A good number authors posit that international differences in thefinancial reporting practices will not disappear and diversity will exist as such differences areendogenous and interpretations are influenced by accounting culture and past practice of thecountry concerned (Tokar, 2005;Schipper,2005; Hoogerdoorn,2006;Alexander and Servalli,2009). Studies on convergence process also deals with a particular country or a few countriestogether. Albu et al., 2011 is a detailed study about IAS/ IRFS implementation in Romania. Thestudy investigates in depth the two stages of IAS/ IRFS implementation and reports that theoutcome of implementation is more significant in the 2nd stages although it covers only listedcompanies.
Jermakowicz et al. (2006) analyzed the process of implementation of IFRS Europeanpublicly funded companies and according to the authors approach towards conversion (i.e.,only consolidation or comprehensive beyond consolidation) is important to harness thebenefits of conversion to IFRS set of standards.
The study by Fearnley and Hines (2007) attempted to trace the development of attributestowards IFRS convergence before 2005. It is argued that from the perspectives of smallercompanies, IFRS is overly complex and the needs of Small & Medium Enterprises are not givendue importance in the convergence process. Similarly, the study of Chand & White (2007) onconvergence of domestic standards with IFRS indicates that the influence of MultinationalEnterprises and big accounting firms has a role in transfer of economic resources in their favourand in most of the cases the interest of general public of the country concerned is ignored.
There is lack of empirical studies in Indian context on IFRS adoption. Most of the studiesare descriptive in nature or case study type. Jain (2011) discusses about opportunity andchallenges of IFRS implementation in India. Swamynathun & Sindhu (2011) examined impact onfinancial statements due to adoption of IFRS. It is a case study on Wipro Ltd. The studyconcluded that IFRS is less conservative than Indian GAAP as in IFRS based financialstatements total assets have been increased. Bhargava & Sikha (2013) also examined impact ofIFRS adoption for Wipro Ltd. This study examined the effect on financial ratios. Muniraju &Ganesh (2016) examined the awareness of stakeholders towards the implementation of IFRS inIndia. The authors also discuss about likely effect of IFRS implementation on different industrysectors. Overall, these studies are not designed very rigorously and lack empirical analysis.
Achalapati (2015) is a detailed study to identify the statistically significant differencesbetween the Indian GAAP based on IFRS based financial statements of sample companies.The author used financial ratios to identify differences. The study is based on 10 companiesthat have voluntarily adopted IFRS reporting. The results of the study indicate that adoption ofIFRS has led to significant increases in liquidity, profitability and valuation ratios.IFRS Implementation in India
In India, attempts were made time to time for convergence of Indian GAAP with IFRS.One of the basic advantages of India is its Anglo-Saxon model of accounting in preference tothe code law system. Indian accounting standards are formulated based on IFRS set ofstandards but there are various exclusions and a few important standards are not introduced.India took convergence root for implementation of IFRS in India. The adoption of IFRS-converged Indian Accounting Standards is now a reality after almost a-decade-longdeliberations and a failed attempt in 2011. The quarter ending June 30, 2016 is the first quarterof Ind AS compliant financial statement reporting for companies fulfilling the prescribedconditions in the first phase.

4 Indian Journal of Accounting (IJA) Vol. 51 (1), June, 2019
The events that were important from the context of IFRS implementation in India arelisted in Exhibit I chronologically.
Exhibit 1Journey to IFRS
Year & Month Event2011, February Converged Standards (Ind AS) formulated.2010, January Time line of implementation notified by the Central Government2011, February Postponement of adoption of Converged Standards.2015, February IFRS converged standards (Ind AS) are given legal recognition through notification
of rules.2016, January Roadmap prescribed.2016, March Deferment of implementation of Ind. As 115 “Revenue from Construction Contract
with Customers”
The roadmap of IFRS implementation as given below indicates that there was wouldbe phased adoption and banking and non-banking finance companies (NBFC) were excludedin the first phase.Phase I
Ind AS set of standards are mandatorily applicable to the following companies forperiods beginning on or after 1 April 2016, with comparatives for the period ending 31 March2016 or thereafter: Companies whose equity and/or debt securities are listed or are in the process of
listing on any stock exchange in India or outside India and having net worth of 500crore INR or more excluding any banking company and Non-banking FinancialCompany(NBFC).
Companies having net worth of 500 crore INR or more other than those coveredabove.
Holding, subsidiary, joint venture or associate companies of companies coveredabove.
Phase IIInd AS standards are made be mandatorily applicable to the following companies for
periods beginning on or after 1 April 2017, with comparatives for the period ending 31 March2017 or thereafter: Companies whose equity and/or debt securities are listed or are in the process of
being listed on any stock exchange in India or outside India and having net worth ofless than rupees 500 Crore.
Unlisted companies other than those covered in Phase I and Phase II whose net worthare more than 250 crore INR but less than 500 crore INR.
Holding, subsidiary, joint venture or associate companies of above companiesFor the purpose of determining applicability, net worth will be determined based on the
standalone accounts of the company as on 31 March 2014 or the first audited period endingafter that date. It is also clarified that Ind AS will apply to both consolidated and stand-alonefinancial statements of a company covered by the roadmap.Sample & Methodology
The study is an early attempt to determine the nature of disclosure by the IFRSconverged standards adopters who are required to prepare their accounts following Ind ASw.e.f.1.4.2016. The major objective of this study is to analyze disclosure practice relating tofirst time adoption of Ind AS by listed companies in India fulfilling prescribed thresholdcondition i.e., having net worth more than Rs. 500 crores. Due to time and resource

Professor (Dr.) Satyajit Dhar: Mandatory Adoption of Ind as (IFRS Converged Standards): A...... 5
constraints we have restricted ourselves to BSE 500 companies. Our choice is based on thefact that 500 companies comprising BSE 500 index represent 94% of total marketcapitalization of all listed companies. It is observed that 411 firms comprising BSE 500 indexare having net worth amounting to Rs. 500 crores or more. From 411 companies meeting thethreshold conditions, we choose 20 companies randomly through computer using “RandeBetween” function. List of sample companies is given in Annexure 1. Our sample is broadbased. Segment classification of sample companies is given in Table 1 below.
Table 1: Segment Classification of Sample CompaniesIndustry Segment No. Of Companies
Private Sector Companies PSUs MNEs TotalAuto Components 3 1 4FMCGs 2 1 3Logistics - 1 - 1Oil Exploration - 1 1 2Oil Marketing - 2 - 2Pharma 1 - 1 2Power - 1 - 1Metal 2 1 - 3Others 2 - - 2
Total 10 6 4 20Source: CMIE Prowess Database. Results Computed
In our sample, there are 6 PSUs and 4 MNEs. There are companies from differentindustry segments and no industry segment has more than 3 companies.
The quarter ended 30.6.2016 is the first quarter in which accounts are prepared by theprescribed companies following Ind AS. Accordingly, for the purpose of analysis we haveconsidered interim results for the quarter ended 30th June 2016. Our analysis was made to findout nature of disclosure and diversity in disclosure among sample companies. We have alsomade analysis of impact on profit as compared to that of previous quarter. For such analysiswe have used disclosure in the reconciliation of profit section as provided in the notes toresults statement.
We have obtained interim financial results related data from the filing of theconcerned companies with stock exchange. Scanned copy of such filings as available throughthe website of stock exchanges are downloaded and used for depth analysis. We havehandpicked the required data through close scrutiny of quarterly results.Disclosures in Interim Results
We have considered disclosures in the quarterly results for the quarter ended30thJune,2016, being the first quarterly results where the companies need to make disclosureregarding transition to Ind AS from Indian GAAP for preparation of financial statements. We alsoconsidered disclosure in the annual report of the financial year preceding 1stApril,2016. We madecontent analysis to extract the disclosures by the sample companies and analyzed thedisclosures to identify the exhaustiveness and level of transparency of such disclosures.Furthermore, it is attempted to analyze diversity of such disclosures among the samplecompanies. The preparation of interim results including disclosure by listed companies is nowgoverned by the Securities and Exchange Board of India (Listing Obligations And DisclosureRequirements) Regulations, 2015 (w.e.f. 1.12.2015).The Securities and Exchange Board of India(SEBI) is the regulatory authority for preparation of interim results by listed companies in India.
All sample companies have given at least one note to explain the transition. Generally,there is only a mention about the transition but no details are given about nature of changes inmajor accounting policies. As per Ind AS 101, a company needs to give reconciliation of profit

6 Indian Journal of Accounting (IJA) Vol. 51 (1), June, 2019
as per previous GAAP and that as par IFRS in respect of three periods viz., correspondingquarter, preceding quarter and last financial year audited. For interim results for the quarterended 30.06.2016, preceding quarter is q/e 31.3.2016, corresponding quarter is q/e30.06.2015 and last audited financial is year ended 31.03.2016. However, SEBI vide itsCircular No. CIR/CFD/FAC/62/2016 dt. July 05, 2016 has given exemption regarding providingreconciliation of profit for preceding quarter and previous financial year. Our analysis revealsthat sample companies are not adopted uniform approach for availing of this particularexemption. Out of 20 sample companies 8 companies have provided reconciliation for all thethree period viz., Quarter ended 30.6.2015, Quarter ended 31.3.2016 and year ended31.3.2016. All other companies have provided reconciliation of profit for the quarter ended30.6.2015 only. One sample company has provided reconciliation of profit for all the precedingfour quarters and for the preceding year.
Disclosure regarding transition is generally made through one note and reconciliationis provided in another note in the statement. The areas of diversities are as under: Sample companies have not provided details of changes in accounting policies
uniformly. 4 sample companies provided some explanatory notes about changes inaccounting policies due to transition and explained the effects on Ind AS related profitof the corresponding quarter.
Two sample companies have provided clarificatory notes about not providingreconciliation of profit for preceding year and preceding quarter. Others are silentabout this issue.
Two sample companies have provided reconciliation of equity. Since, equity capital &reserves are disclosed in the interim results, such reconciliation is helpful. If no changein equity happens due to transition that may also require disclosure.
Two sample companies have provided reconciliation of profit upto net profit onlyinstead of that upto comprehensive Income. This type of disclosure is not in conformitywith the requirement of the relevant accounting standard.
In respect of 5 sample companies, auditors have given a disclaimer in the limitedreview report that related figures of corresponding quarter and preceding year havenot been checked by the auditor. In few cases, the company also given a noteexplaining that restated figures are prepared by the management and those are notsubjected to limited review.
A few sample companies have not mentioned the transition date i.e., 1.4.2015.Effects of Ind AS Adoption on Financial Performance
IFRS set of standards and Ind AS set of standards are not same since there are manycarve outs. Carve outs are deviations and those are generally perceived as non-desirable,since they dilute the key purpose of converging with IFRS (i.e., to have a common set ofaccounting standards across countries, provide seamless access to international capital.Nevertheless, there are major differences between erstwhile Indian GAAP and Ind AS set ofstandards. Obviously, transition to Ind AS requires change in measurement and disclosure inmany areas. In the transition year, a company is required to provide reconciliation of profit andcomprehensive income as restated by applying IFRS set of standards with those presented byapplying erstwhile GAAP the previous year. This requirement applies to reporting of interimresults also.
As mentioned elsewhere in this paper, all sample companies have providedreconciliation of profit of corresponding quarter of the previous year. Accordingly, an analysis ismade about effect on profit due to transition. This analysis is informative in the sense that, ithelps investors and stakeholders to assess the likely effect of transition on reported profit. All thesample companies have reported profit in the quarter under consideration. There are 13 cases of
Professor (Dr.) Satyajit Dhar: Mandatory Adoption of Ind as (IFRS Converged Standards): A...... 7
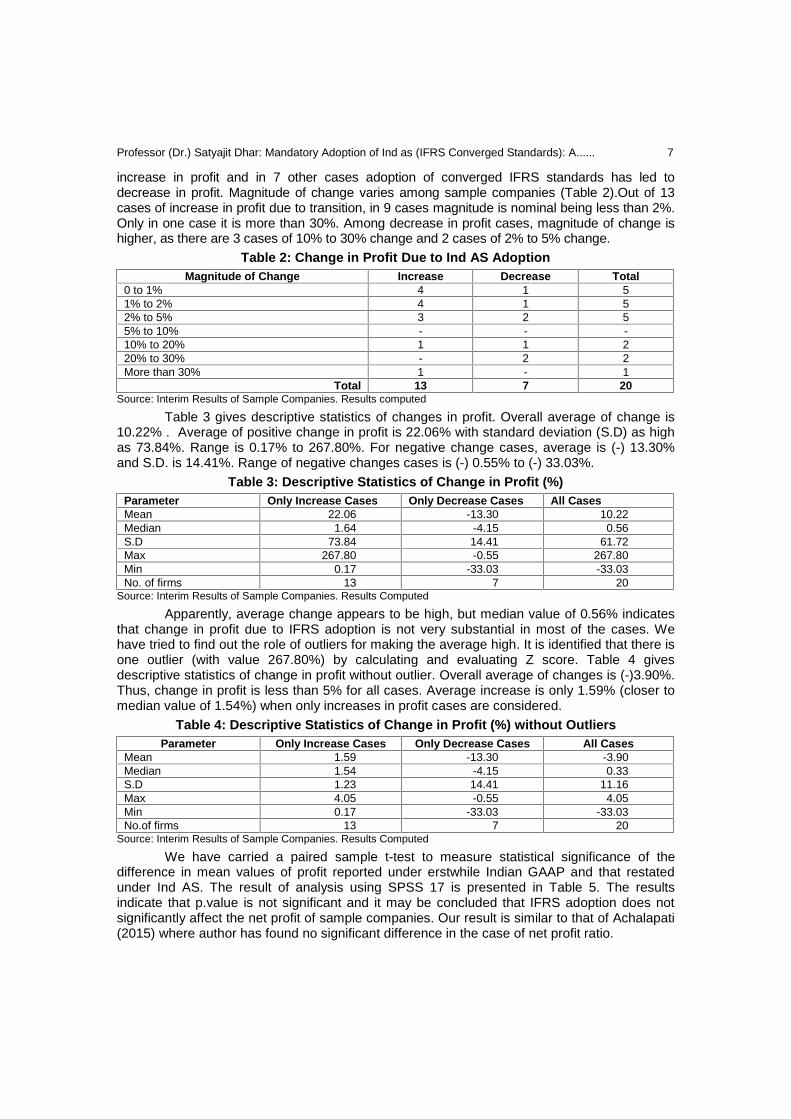
increase in profit and in 7 other cases adoption of converged IFRS standards has led todecrease in profit. Magnitude of change varies among sample companies (Table 2).Out of 13cases of increase in profit due to transition, in 9 cases magnitude is nominal being less than 2%.Only in one case it is more than 30%. Among decrease in profit cases, magnitude of change ishigher, as there are 3 cases of 10% to 30% change and 2 cases of 2% to 5% change.
Table 2: Change in Profit Due to Ind AS AdoptionMagnitude of Change Increase Decrease Total
0 to 1% 4 1 51% to 2% 4 1 52% to 5% 3 2 55% to 10% - - -10% to 20% 1 1 220% to 30% - 2 2More than 30% 1 - 1
Total 13 7 20Source: Interim Results of Sample Companies. Results computed
Table 3 gives descriptive statistics of changes in profit. Overall average of change is10.22% . Average of positive change in profit is 22.06% with standard deviation (S.D) as highas 73.84%. Range is 0.17% to 267.80%. For negative change cases, average is (-) 13.30%and S.D. is 14.41%. Range of negative changes cases is (-) 0.55% to (-) 33.03%.
Table 3: Descriptive Statistics of Change in Profit (%)Parameter Only Increase Cases Only Decrease Cases All CasesMean 22.06 -13.30 10.22Median 1.64 -4.15 0.56S.D 73.84 14.41 61.72Max 267.80 -0.55 267.80Min 0.17 -33.03 -33.03No. of firms 13 7 20
Source: Interim Results of Sample Companies. Results Computed
Apparently, average change appears to be high, but median value of 0.56% indicatesthat change in profit due to IFRS adoption is not very substantial in most of the cases. Wehave tried to find out the role of outliers for making the average high. It is identified that there isone outlier (with value 267.80%) by calculating and evaluating Z score. Table 4 givesdescriptive statistics of change in profit without outlier. Overall average of changes is (-)3.90%.Thus, change in profit is less than 5% for all cases. Average increase is only 1.59% (closer tomedian value of 1.54%) when only increases in profit cases are considered.
Table 4: Descriptive Statistics of Change in Profit (%) without OutliersParameter Only Increase Cases Only Decrease Cases All Cases
Mean 1.59 -13.30 -3.90Median 1.54 -4.15 0.33S.D 1.23 14.41 11.16Max 4.05 -0.55 4.05Min 0.17 -33.03 -33.03No.of firms 13 7 20
Source: Interim Results of Sample Companies. Results Computed
We have carried a paired sample t-test to measure statistical significance of thedifference in mean values of profit reported under erstwhile Indian GAAP and that restatedunder Ind AS. The result of analysis using SPSS 17 is presented in Table 5. The resultsindicate that p.value is not significant and it may be concluded that IFRS adoption does notsignificantly affect the net profit of sample companies. Our result is similar to that of Achalapati(2015) where author has found no significant difference in the case of net profit ratio.

8 Indian Journal of Accounting (IJA) Vol. 51 (1), June, 2019
Table 5: Paired Samples Test (Profit as per Indian GAAP and Ind AS)N Paired Differences
Mean S.D. Std. Error t p20 (-) 9.37 43.98 9.8355 (-)0.953 0.353
Source: SPSS 17 Output
ConclusionOverall, results indicate that in India, adoption of IFRS converged has some impact on
profit. Indian GAAP standards are formulated substantially on the basis of IFRS. Besides,there are many crave outs in Ind AS. Hence, impact on profit of sample companies in most ofthe cases is not substantial. Investors and financial analyst should pay particular attention tosituation of each company and make decision after identifying the causes of changes.Furthermore, unrealized gains and losses are not considered in profit calculation and reportedas a part of comprehensive income. This issue also requires depth analysis. The impact onratio level may show different picture as absolute change in profit is only considered in thisstudy due to lack of data. The empirical results of our initial exploration raise some interestingquestions and suggest the need for further research. First, our sample size is small and thereis scope of making detailed research with larger sample size. Second, apart from effect onfinancial results, IFRS adoption has impact on balance sheet data and financial ratios. Suchdata being not available in the interim results, such an analysis could not be attempted. Theresults of the study indicate that there is wide diversity among the sample companiesregarding disclosure on Ind AS adoption. A depth analysis of contents of disclosure reveals thecompanies are not forthcoming with detailed disclosure. It may be hoped that quality ofdisclosure will improve over time and the issues of diversity will be addressed over timethrough learning process and regulatory interventions.References Albu, N., Albu, C.N., Bunea, S., Calu, D.A. Girbina, M. (2011). A story about
IAS/IFRS implementation in Romania. Journal of Accounting in EmergingEconomies, 1 (1), 76 – 100.
Alexander, D. and Servalli, S. (2009). Accounting regulatory change: towards ageneral model, paper presented at the 32nd Annual Congress of the EuropeanAccounting Association, Tampere, and 13-15 May.
Armstrong, C. S., Barth, M. E., Mary, Jagolinzer, A. D., Riedl, E. J. (2010). Marketreaction to the adoption of IFRS in Europe. The Accounting Review, 85(1), 31-61.
Ashbaugh, H. & Pincus, M. (2001).Domestic accounting standards, InternationalAccounting Standards and the predictability of earnings, Journal of AccountingResearch, 39, 417-434.
Ball, R. (2006). International Financial Reporting Standards (IFRS): pros and cons forinvestors. Accounting and Business Research, 1, 5-27.
Barth, M. E., Mary, Landsman, W.R., Lang, M. H. (2008). International AccountingStandards and accounting quality. Journal of Accounting Research, 46 (3), 467.
Bhargava, V. and Sikha D. (2013).The Impact of International Financial ReportingStandards on Financial Statements and Ratios. The International Journal ofManagement, 2(2), 1-15.
Chand, P., White, M. (2007).A critique of the influence of globalization andconvergence of accounting standards in Fiji. Critical Perspective on Accounting, 18(5), 605.

Professor (Dr.) Satyajit Dhar: Mandatory Adoption of Ind as (IFRS Converged Standards): A...... 9
Craner, J., Krzywda, D., Novotny, J. and Schroeder, M. (2000).The determination of agroup for accounting purposes in the UK, Poland, and the Czech Republic in asupranational context. The International Journal of Accounting, 35( 3), 355-97.
Cuijpers. R. and Buijinik, W. (2005).Voluntary adoption of non-local GAAP in theEuropean Union: a study of determinants and consequences.European AccountingReview, 14(3), 487-524.
Hoogendoorn, M. (2006), International accounting regulation and IFRS implementationin Europe and beyond – experiences with first-time adoption in Europe. Accounting inEurope, 3(1), 6-23.
Hung, M. and Subramanyam .K.R. (2007). Financial statement effects of adoptingInternational Standards: the case of Germany. Review of Accounting Studies.12 (4),623-657.
Jain, P. (2011). IFRS Implementation in India: Opportunities and Challenges.World.Journal of Social Sciences, 1(1), 125-136.
M. Muniraju and Ganesh. S.R. (2016). A study on the impact of International FinancialReporting Standards convergence on Indian corporate sector. IOSR Journal ofBusiness and Management, 8(4), 34-41.
Schipper, K. (2005), The introduction of IAS in Europe: Implications for internationalconvergence. European Accounting Review, 14(1), 101-126.
Swamynathan, S. and Sindhu.(2011). Financial statement effects on convergence toIFRS – A case study in India. Zenith International Journal of MultidisciplinaryResearch. 1(7).
Tokar, M. (2005).Convergence and the implementation of a single set of globalstandards: the real-life challenge. Accounting in Europe, 2(1), 47-68.
Annexure 1List of Sample Companies Balkrishna Ltd. Bharat Forge Ltd. Cadila Healthcare Ltd Colgate Palmolive (India) Ltd. Container Corporation of India Ltd. Cummins India Ltd. Dabur India Ltd. Emami Ltd. Glaxosmithkline Pharmaceuticals Ltd. Hindustan Petroleum Corporation Ltd. Hindustan Zinc Ltd. Indian Oil Corporation Ltd. JSW Steel Ltd. Motherson Sumi Systems Ltd. NHPC Ltd. Oil India Ltd. Piramal Enterprises Ltd. PVR Ltd. United Breweries Ltd. Vedanta Ltd.

Indian Journal of Accounting (IJA) 10ISSN : 0972-1479 (Print) 2395-6127 (Online) Vol. 51 (1), June, 2019, pp. 10-24
UNVEIL THE SCOPE OF ADOPTION OFCOMPUTER ASSISTED AUDIT TOOLS AND TECHNIQUES (CAATTs)
Neelam Yadav
Dr. Shurveer S. Bhanawat
ABSTRACT
Now a days, Computer Assisted Audit Tools and Techniques (CAATTs) becomes amost popular audit tool for audit firm. It is being used to assist audit firms in order to efficientand effective external and internal audit work. It comes in operation with bundles ofadvantages to the audit firm. The objective of the study is to unveil the scope/area anddeterminant factors for the adoption of computer-assisted auditing tools and techniques. Toachieve this objective data collected through questionnaire survey method from various 80audit experts. For data analysis, descriptive statistics, ANOVA (Analysis of Variance) testhas been administered. For testing of opinion survey data reliability, Cronbach's Alphareliability test has been used. The results concluded that all scope/area where ComputerAssisted Audit Tools and Techniques can be used in the audit process is independent andhaving an individual independent significant impact. Results also found that there is asignificant difference among various determinant factors for the adoption of ComputerAssisted Audit Tools and Techniques. It means each and every determinant factor havingnot the same significance level. The factors identified through survey analysis are notequally significant. On the basis of mean score, results found that most importantdeterminant factors for the adoption of Computer Assisted Audit Tools and Techniques i.e.Lack of training on how to use IT for work, Staff’s interest to learn how to use CAATTs, Lackof skill on how to use it, Cost of acquisition, The attitude of staffs towards CAATTs, Lowawareness about CAATTs and Size of the audit client. Result of factor analysis shows that30 scopes are reduced in 5 factors i.e. System audit, IT Communication System,Computational work, testing of Accounts and Audit Planning.
KEYWORDS: CAATTs, Determinant Factors of CAATTs, Computerized Environment._______________
IntroductionThe modern computerized environment, in which each audited entity carries on
business, creates new opportunities but also new risks, additional rules for security, thuspermanently influencing the work of auditors. Increasing the complexity of accounting systemsERP (Enterprise Resource Planning) and the large volume of transactions currently underwayhave led to the ever-increasing replacement of classical, "manual" audit techniques, withmodern computer-aided techniques, known by the name of CAATTs (Computer Assisted AuditTools and Techniques).
Senior Research Fellow, Department of Accountancy and Business Statistics, Mohanlal SukhadiaUniversity, Udaipur, Rajasthan, India.
Professor, Department of Accountancy and Business Statistics, Mohanlal Sukhadia University, Udaipur,Rajasthan, India.

Neelam Yadav & Dr. Shurveer S. Bhanawat: Unveil the Scope of Adoption of Computer Assisted...... 11
Computer Assisted Audit Tools and Techniques are becoming more popularthroughout our profession. CAATTs is commonly used by auditors to extract and analyze dataand perform application control tests. Adoption of CAATTs in audit firm comes with bundles ofadvantages. Now more than ever before, these tools are being used throughout the industry toassist internal auditors in their search for irregularities in data files, to help internal accountingdepartments with more detailed analysis and to support the forensic accountant withextrapolating large amounts of data for further analysis and fraud detection. Audit processwhich was previously conducted manually are now being aided through the use of software.Computer technology gives auditors a new set of techniques for examining the automatedbusiness environment. CAATTs hold the promise of enhanced audit effectiveness andefficiency (Kotb & Roberts, 2011)1.Computer Assisted Audit Tools and Techniques are usedin various areas in any business, for checking and testing data accuracy in the audit process.Significance of the Study
If increasing the efficiency and effectiveness of auditors in the use of audit software foraudit process could be enhanced if determinant factors for this are identified. Furthermore,studies of this type could help software developers on how audit software could be improved tobetter suit for auditing process if the cause for the inefficiency and avoidance of using the auditsoftware determinant factors are identified. Also, this type of study help in identifying importantscope/areas in which currently Computer Assisted Auditing Tools and Techniques used in theAudit process.Review of Literature
In order to better understand CAATTs and why such technology is being used, anintensive review of the literature has been made. The review of literature is divided into threesections viz., Previous CAATTs Research Role of CAATTs in the Audit process Factors influencing auditor’s use of CAATTs Previous CAATTs Research
(Ernest, 2015)2 provide detailed information about the concept of auditing to itsrelevance in a computerized accounting system. Also give a brief explanation on the termscomputer, auditing, and computerized accounting system and analyzed the procedure forauditing a computerized accounting system. Computerized accounting offers several morebenefits than manual accounting, the function of manual accounting will never go awaycompletely. Examining auditor use of CAATTs is important because CAATTs hold out thepromise of improving audit efficiency and effectiveness. (Bierstaker, et al., 2013)3. Adoptionof CAATTs in audit firm comes with bundles of advantages but the expenses of adoption canonly be adopted by large companies. (Zainol, et al., 2017)4. Role of CAATTs in Audit Process
Adoption of CAATTs in audit process is very crucial in the current informationtechnology environment. In their study ( Zuca & Țînța, 2018)5 his explore CAATTs contributionin Business Intelligence Instruments in Financial Audit. Most financial auditors use only thetools provided by the computer to perform the financial audit. When using computer-assistedauditing techniques, the auditor finds that his work is improved and much more efficientbecause has many advantages over the traditional system of documentary and financialstatement verification. In another study conducted through (Olasanmi, 2013)6 explore the roleof CAATTs in fraud detection in a firm and also studied the impact of CAATTs in theperformance of a firm. Result found that CAATTs have played a major role in fraud detection.CAATTs can also help to improve the auditors’ performance. Result also concluded that

12 Indian Journal of Accounting (IJA) Vol. 51 (1), June, 2019
CAATTs can help in the transparency of financial reports within organizations. In the currentcomputerized environment uses of CAATTs for audit process in any organization is veryimportant for increasing effectiveness and efficiency of a company. In this context ( Pedrosa &Costa, 2014)7 studied the challenges of CAs on adoption of CAATTs and current uses ofCAATTs in their audit work. Studies are descriptive in nature. Result found that “DataExtraction and Analytics” and “Sampling” tools are the most common Information Technologieson Auditing work. Computer Assisted Techniques related to data mining are still not expressivein this reference group or are only utilized by a small group of experts, mainly at bigcompanies. Result also shows new Trends of CAATTs for Chartered Accountant i.e. Big DataAnalysis, Cloud Analytics, Security and Privacy Tools and BYODi. Factors Influencing Auditor’s Use of CAATTs
To achieve rapid advances in client technology, audit standards urge auditors to usecomputer-assisted audit tools and techniques (CAATTs). Previous research suggests CAATTsadoption was very low. ( Bierstaker, et al., 2013)3. ( Konthong, et al.)8, (Mansour , 2016)9, (Shamsuddin, et al., 2015)10, ( Bierstaker, et al., 2013)3all have applied Unified Theory ofAcceptance and Use of Technology (UTAUT)ii model for identifying factors influencing auditorsadoption of CAATTs. (Mansour , 2016)9 in UTAUT model found that performance expectancyand firms facilitating conditions are more influencing factors and ( Bierstaker, et al., 2013)3,(Mansour , 2016)9,both studies found that effort expectancy and social influence factors do notplay a vital role in the adoption of CAATTs through UTAUT model. But on the other hand (Shamsuddin, et al., 2015)10explored in their study that effort expectancy is the mostinfluencing factor that affects the usage level of CAATTs by internal auditors compared toother factors i.e. performance expectancy, social influence and facilitating condition.(Zainol, etal., 2017)4. ( Ebimobowei, et al., 2013)11 have applied UTAUT model for identifying thefactors on the adoption of CAATTs. In this study, they found that in all UTAUT models fourfactors i.e. performance expectancy, social influence, effort expectancy and facilitatingcondition are positively associated with the usage of CAATTs by accounting firms. (Mahzan &Lymer, 2014)12also studied factors underlying successful CAATTs adoptions would be helpfulfor the development of these technologies in internal audit functions. They applied the UTAUTmodel. This study found performance expectancy, facilitating conditions important factorsinfluencing successful adoptions of GASiii. This study also supported that social influence andeffort expectancy factors are not found to be significant in the adoption of CAATTs. Authorsapplied models for factors determination but (Janvrin, et al., 2009 )13 studied the extent towhich computer-related audit procedures are used and whether two factors, control riskassessment, and audit firm size, influence computer-related audit procedures . Resultsindicated that computer-related audit procedures are generally used when obtaining anunderstanding of the client system and business processes and testing computer controls.Results also suggest that client IT complexity influences the nature of audit testing, and givesstandard setters insights into how auditors adjust audit programs in response to control riskassessments.
Some authors applied other models other than UTAUT model for effectivedeterminantfactorsof CAATTs. In this context (Shihab, et al., 2017)14has applied TAMiv framework modelto understanding the antecedents of CAATT adoption by external auditors in public accountingfirms. Results provided empirical evidence that CAATT adoption was directly influenced bybehavioural intention, perceived usefulness and perceived ease of use. Finally, perceivedease of use was influenced by the technological complexity and computer self-efficacy.
Some authors also identified factors of CAATTs using another model like TOEv model.(Rosli, et al., 2016)15, (Awa & Ojiabo, 2016)16 all have used TOE model. Our survey indicatesthat the role played by professional body support is important to increase its adoption. ICTinfrastructures, technical know-how, perceived compatibility, perceived values, security, and

Neelam Yadav & Dr. Shurveer S. Bhanawat: Unveil the Scope of Adoption of Computer Assisted...... 13
firm’s size were found statistically significant adoption determinants. Although the scope ofbusiness operations, trading partners’ readiness, demographic composition, subjective norms,external supports, and competitive pressures were equally critical their negative coefficientssuggest that they pose less of an obstacle to adopters than to non-adopters. Another study (Rosli, et al., 2012)17have applied I-TOEmodel. This model focused on both organization andindividual factors. It integrates both Unified Theory of Acceptance and Use of Technology 2and Technology-Organization-Environment framework. I-TOE provides a comprehensivemodel that helps audit firms and regulatory bodies to develop strategies and policies toincrease CAATTs adoption.
All above studies, applied ICT adoption model for identifying effective factors ofCAATTs but ( Ahmi, et al., 2017)18 studied other external and internal factors. The objectiveof this study is toexamine the implementation of CAATTs by internal auditors in the publicsector. For the study interviews made from 12 internal auditors head. Result found that theimplementation of CAATTs by internal auditors in public sector is still low due to lack of expert,high implementation and maintenance cost, limited access of auditor’s data, and most of themprefer to conduct the audit manually. The results implied that training for future auditors inCAATTs to ensure the successful implementation is important. For the successful adoption ofCAATTs, the head of internal audit must have the awareness about the importance of CAATTsas well as enforcement of its implementation.
Using word cloud software, the most frequent words occurred in thereview of literaturehave recognized in order to check the relevant review of these objectives is undertaken. Byusing this software, the following diagram is drawn.Objectives To unveil the scope of Computer Assisted Audit Tools and Techniques (CAATTs). To explore determinant factors for adoption of Computer Assisted Audit Tools and
Techniques (CAATTs).HypothesesH01: There is no specific area in which Computer Assisted Audit Tools and Techniques
(CAATTs) can be used. The different areas identified through survey analysis areequally important and Computer Assisted Audit Tools and Techniques (CAATTs) canbe applied in all the identified areas.
H02: There is no significant difference among various determinant factors for adoption ofComputer Assisted Audit Tools and Techniques (CAATTs). It means each and everydeterminant factor having the same level of significance to adopt CAATTs.

14 Indian Journal of Accounting (IJA) Vol. 51 (1), June, 2019
Sample Design/ Techniques of Data AnalysisIn order to examine the scope of Computer Assisted Audit Tools Techniques and
determinant factors for adoption of Computer Assisted Audit Tools Techniques, the opinion ofrespondents has been obtained from the questionnaire survey method. Responses haveobtained on the basis of five points Likert measurement scale, from 80 respondents, itsbelonging to various audit positions i.e. Partner, Senior Auditor, Consultant, Senior Manager,Junior Auditor, Junior Manager, and Accounting Technician. For data analysis, DescriptiveStatistics, ANOVA have been administered. In order to check consistency regarding therespondent’s opinion, the Coefficient of Variation (C.V.) has been administered. For testing ofopinion survey data reliability, Cronbach's Alpha reliability test has been used.For testing anysignificant difference exist in various scope/area of computer-assisted auditing tools andtechniques and any significant difference among various determinants factors for computer-assisted auditing tools and techniques, Analysis of Variance (ANOVA) is applied. In order toreduce variables with minimum loss of information, factor analysis technique have applied.Data has been analyzed using MS Excel and SPSS software.
Table 1: Respondent’s Demographic ProfileGender Wise
Participant Wise
Male63%
Female38%
Gender
Soleproprietor
20%
Partner inAudit firm
45%
Employee35%
Participant
14 Indian Journal of Accounting (IJA) Vol. 51 (1), June, 2019
Sample Design/ Techniques of Data AnalysisIn order to examine the scope of Computer Assisted Audit Tools Techniques and
determinant factors for adoption of Computer Assisted Audit Tools Techniques, the opinion ofrespondents has been obtained from the questionnaire survey method. Responses haveobtained on the basis of five points Likert measurement scale, from 80 respondents, itsbelonging to various audit positions i.e. Partner, Senior Auditor, Consultant, Senior Manager,Junior Auditor, Junior Manager, and Accounting Technician. For data analysis, DescriptiveStatistics, ANOVA have been administered. In order to check consistency regarding therespondent’s opinion, the Coefficient of Variation (C.V.) has been administered. For testing ofopinion survey data reliability, Cronbach's Alpha reliability test has been used.For testing anysignificant difference exist in various scope/area of computer-assisted auditing tools andtechniques and any significant difference among various determinants factors for computer-assisted auditing tools and techniques, Analysis of Variance (ANOVA) is applied. In order toreduce variables with minimum loss of information, factor analysis technique have applied.Data has been analyzed using MS Excel and SPSS software.
Table 1: Respondent’s Demographic ProfileGender Wise
Participant Wise

Neelam Yadav & Dr. Shurveer S. Bhanawat: Unveil the Scope of Adoption of Computer Assisted...... 15
Age Wise
Place Wise
Position in the Audit Firm
Ahmedabad2%
Jaipur2%
Kanpur2%
Mumbai7%
Delhi5%
Udaipur Ahmedabad
Delhi Nagaur
Consultant7%
Senior Manager7%
Junior Auditor5%
Junior Manager3%
Accountingtechnician
10%
Partner
Senior Manager
Accounting technician
Neelam Yadav & Dr. Shurveer S. Bhanawat: Unveil the Scope of Adoption of Computer Assisted...... 15
Age Wise
Place Wise
Position in the Audit Firm
65%
27%
5%3%
0%
Age of the Respondent
Between 20 to 30
Between 31 to 40
Between 41 to 50
Between 51 to 60
Between 61 to 70
Udaipur70%Ahmedabad
2%
Delhi5% Nagaur
3%
Rajsamand3% Indore
3%
Guwahati3%
Place of Respondent
Ahmedabad Jaipur Kanpur Mumbai
Nagaur Rajsamand Indore Guwahati
Partner45%
Senior Auditor15%
Consultant7%
Senior Manager7%
Junior Manager3%
Accountingtechnician
10%
Others8%
Position in Audit Firm
Senior Auditor Consultant
Junior Auditor Junior Manager
Accounting technician Others
Neelam Yadav & Dr. Shurveer S. Bhanawat: Unveil the Scope of Adoption of Computer Assisted...... 15
Age Wise
Place Wise
Position in the Audit Firm
Between 20 to 30
Between 31 to 40
Between 41 to 50
Between 51 to 60
Between 61 to 70
Place of Respondent
Mumbai
Guwahati
Position in Audit Firm
Junior Manager

16 Indian Journal of Accounting (IJA) Vol. 51 (1), June, 2019
Analysis and Discussion Scope/Areas of Computer Assisted Audit Tools and Techniques
List of scope/areas where CAATTs used in audit process derived from a review ofliterature have been examined on the basis of five-point Likert measurement scale. The scorehave been summarized in the following table no. 2. The data have been analyzed throughMean score and rank has been assigned on the basis of mean.
Table 2: Scope/Area where CAATTs Used Statistical MeasurementS. No. Scope Mean Value Rank C. V.1. Depreciation calculations 3.77 1 37.922. Tax calculations 3.7 2 39.033. E-Mail 3.56 3 43.494. Electronic Spreadsheet 3.5 4 44.075. Interest expense/income computation 3.45 5 46.096. Financial Analysis 3.35 6 42.777. Investment calculations 3.22 7 51.028. Pension computation 3.15 8 52.759. Word processing 3.1 9 51.7310. Communication with other members of the audit team 2.97 10 51.0111. Sample selection and analyzingwork 2.95 11 51.1312. Communication with clients 2.95 11 56.5413. Data extraction and analysis 2.92 12 53.5114. Audit report 2.92 12 52.3915. Make lists 2.87 13 52.6116. Test of inventory 2.85 14 47.0717. Risk analysis 2.85 14 53.8618. Data transport 2.82 15 54.5419. Automated Audit working paper 2.8 16 54.0220. Databases 2.78 17 56.7021. Test of account payable 2.75 18 52.2322. Test of account receivables 2.72 19 54.7623. Statistical analysis 2.68 20 63.9224. Audit planning 2.65 21 46.9325. Graphics 2.62 22 60.4226. Audit memos 2.52 23 58.4227. Planning work 2.47 24 66.1828. Parallel Simulation in audit process 2.45 25 60.8829. Continuous auditing / Embedded Audit Module 2.37 26 64.0430. Test data generator 2.32 27 65.20
Source: Own Calculation on Ms-Excel 2013
In the above table 2 presents various scope/ area where Computer Assisted AuditTools and Techniques are used. In order to get the opinion of respondents regarding thepreference of various scope, opinion has been collected through questionnaire. Out of 30scope/area, respondents believe that currently computer-assisted auditing tools andtechniques are predominantly used in depreciation calculations. It is evident by highest meanscore i.e. 3.775. Respondents believe that the second most predominantly used scope/area bycomputer-assisted audit tools and technique is tax calculations. It is evident by second highestmean score i.e. 3.7. The scope that ranked third by the respondents is E-Mail. It is evident bythird highest mean score i.e. 3.56. Respondent’s opinion comes that fourth scope/areaelectronic spreadsheet where the Computer Assisted Auditing tools are mostly used. It isevident by fourth highest mean score i.e. 3.5. Respondents believe the fifth scope/area wherecomputer-assisted audit tools are used is Interest expense/income computation. It is evident

Neelam Yadav & Dr. Shurveer S. Bhanawat: Unveil the Scope of Adoption of Computer Assisted...... 17
by fifth highest mean score i.e. 3.45. The result of above table shows that top 5 scopes/areawhere currently computer-assisted auditing tools and techniques are predominantly used buton the other hand out of 30 scopes/area, results also identified 5 scopes/area wherecomputer-assisted auditing tools and techniques are rarely used. Respondents believe thatcomputer-assisted audit tools and techniques are rarely used in various areas viz., test datagenerator, Continuous auditing / Embedded Audit Module, Parallel Simulation in the auditprocess and audit memos. It is evident by its lowest mean score. Above table shows that thereis no consistency regarding respondents opinion about the scope/ area, where Computer-assisted auditing tools and techniques are used, It is evident by Coefficient of Variation (C.V.).
The reliability test of data collected through an opinion survey is ensured by usingCronbach’s Alpha. The Alpha of Cronbach's is derived at 0.972 that it is much higher than thethreshold limit of 0.70. It indicates that data are fully reliable for statistical analysis.
The above analysis and discussion revel a wide range of scope where CAATTs usedin the audit process. The significance of each scope has been identified by calculating themean score of Likert Scale data of scope of CAATTs. Now it has to check whether there isany significant difference is available among different scope/area of CAATTs or not. For thispurpose a hypothesis has been developed as “There is no specific area in which CAATTscan be used. The different areas identified through survey analysis are equally important andComputer Assisted Audit Tools and Techniques (CAATTs) can be applied in all the identifiedareas.” In order to check this hypothesis, ANOVA Technique has been used. The statisticaloutputs of ANOVA have been summarized in the following table:
Table 3: ANOVA TableSource of Variation SS df MS F P-value F critBetween Groups 343.0871 29 11.83059 5.047968 5.41E-17 1.472296Within Groups 5554.413 2370 2.343634
Total 5897.5 2399Source: Own Calculation on Ms-Excel 2013
It is observed from the above table no. 3 that the calculated F value (5.047968) is veryhigh than the tabulated value (1.472296) at 5% significance level and P-value is less than0.05. Hence, the null hypothesis (H01) is rejected. It indicates that all specific area in whichCAATTs can be used are independent and having an individual independent significantimpact. Each and every scope of adoption of CAATTs has owned its merits and demerits andall are equally good, it’s revealed through our statistical analysis.Factor Analysis
Factor analysis is a technique that used to reduce larger data set into smaller set ofnew factors with minimum loss of information. In order to construct the new factors of scope ofCAATTs the factor analysis technique has been used. For Factor analysis, there should besufficient correlation between variables to produce representative factors. To ensure that thepresent data matrix has significant correlation between variables and to check theappropriateness of factor analysis, two approaches have been followed i.e. KMO and Bartlett'stest of sampling adequacy Sphericity. KMO is measure of sampling adequacy and theBartlett's test of sampling adequacy is a statistical test for the presence of correlations amongthe variables. The following table the results of KMO and Bartlett's test:
KMO and Bartlett's TestKaiser-Meyer-Olkin Measure of Sampling Adequacy. 0.748164Bartlett's Test of Sphericity Approx. Chi-Square 3494.865
df 435Sig. 0

18 Indian Journal of Accounting (IJA) Vol. 51 (1), June, 2019
Measure of sampling adequacy values must exceed .50 and as per the above tableKMO value is 0.748 which indicates appropriateness of factor analysis for the study. HereBartlett's Test of Sphericity significant value is 0 which is less than .05 (sig. < .05), indicatesthat sufficient correlation exist between variables.Criterion for Selection of Factors
For the factor analysis, Principal Component method is applied. The selection criteriafor the factor are based on eigen values. Factors having eigen value more than 1were chosen.The factor loading is important in interpreting the factor matrix. Loading 0.50 or greater areconsidered for factor analysis. On the basis of this criteria five factors are selected namely F1,F2, F3, F4 and F5.30 Variables of scope for adoption of CAATTs are reduced in 5 factorsthrough factor analysis.Factor - I System Audit
After introducing SPSS, first factor was named as a system audit. All this variables arerelated to system audit requirements. The below table showsall variables which are included insystem audit with their loadings.
Variables LoadingData Extraction and analysis 0.830Continuous Auditing / Embedded Audit Module 0.795Planning 0.793Test data generator 0.792Parallel Simulation 0.764Sample selection and analysing work 0.718Statistical Analysis 0.704Risk Analysis 0.598Audit Memos 0.516Automated Audit Working Paper 0.515
Factor – II IT Communication SystemSecond important scope (factor) is IT Communication System, which includes general
computer audit work. The below table shows all the variables which are related to ITCommunication System with their factor loadings.
Variables LoadingWord Processing 0.863Communication with other audit team members 0.787Electronic Spreadsheet 0.785Email 0.762Graphics 0.719Communication with Clients 0.717Make Lists 0.664Financial Analysis 0.632Audit Report 0.553
Factor – III Computational workThird number of scope (factor) is computational work which includes calculation work
of financial accounts. The below table shows all the variables which are related toComputational work with their factor loadings.
Variables LoadingInterest expense/income Computation 0.854Investment Calculation 0.771Tax calculations 0.692Depreciation calculation 0.676Pension calculation 0.645Database 0.506

Neelam Yadav & Dr. Shurveer S. Bhanawat: Unveil the Scope of Adoption of Computer Assisted...... 19
Factor – IV Testing of AccountsFactor fourth is named as a testing of accounts. Its covers testing work of accounts.
The below table shows name of variables with their factor loading.Variables Loading
Test of Inventory 0.862Test of account payable 0.844Test of accounts receivables 0.809
Factor – V Audit planningFifth factor is audit planning. It includes only one variable i.e. audit planning.
Variables LoadingAudit planning 0.809
The below table shows name of the factors with their percentage of variance explained:Name of New Factors with Percentage of Variance
Factor Name Percentage of Variance1 System audit 23.2482 Information system 22.5453 Computational work 16.6064 Testing of Accounts 13.3065 Audit Planning 4.562
Total Variance 80.267Source: SPSS output
Determinant Factors for Adoption of Computer Assisted Audit Tools andTechniques(CAATTs)In order to identify responsible determinant factors of effective utilization of CAATTs,
Mean and ANOVA have been calculated. Table 4 below gives a list of the determinant factorsfor adoption of CAATTs. All these factors are arranged on the basis of a mean value obtainedand given rank accordingly.
Table 4: Determinant Factors of CAATTsS. No. Factors Average Rank C. V.1. Lack of training on how to use IT for work 3.85 1 29.542. Staff’s interest to learn how to use CAATTs 3.77 2 26.313. Lack of skill on how to use it 3.77 2 29.494. Cost of acquisition 3.75 3 23.045. Attitude of staffs towards CAATTs 3.7 4 22.096. Low awareness 3.7 4 31.127. Size of audit client 3.6 5 24.848. Usefulness of the software 3.5 6 28.029. Personal attitude of the user 3.5 6 28.0210. Availability of in-house or supplier training 3.4 7 30.9011. Availability of support/ guidance from the supplier 3.27 8 29.9312. Client resistance or cooperativeness 3.15 9 33.16
Source: Own Calculation on Ms-Excel 2013
In the above table no. 4, presents various determinant factors for adoption of ComputerAssisted Auditing Tools and Techniques in the audit process. Out of 12 factors, respondentsbelieve that lack of training on how to use information Technology for audit process is a mostimportant determinant factor on the adoption of CAATTs. It is evident by highest mean score i.e.3.85. Second most influencing factors of adoption of CAATTs that’s two factors, Staff’s interest tolearn on how to use CAATTs and Lack of skill on how to use it. It is evident by second highestmean score i.e. 3.775. The factor that ranked third by the respondents is the cost of acquisition. It

20 Indian Journal of Accounting (IJA) Vol. 51 (1), June, 2019
is evident by third highest mean score i.e. 3.75. Respondent’s opinion laid out the fourth mostimportant determinant factors that are Attitude of staffs towards CAATTs and Low awarenessabout CAATTs. It is evident by fourth highest mean score i.e. 3.7. Respondent believes that theSize of the audit client is a fifth determinant factor of adoption of CAATTs. It is evident by fifthhighest mean score i.e. 3.6. Above table shows that there is no consistency regardingrespondent's opinion and about determinant factors of Computer-assisted auditing tools andtechniques. It is evident by Coefficient of Variation (C.V.).
On the basis of mean score the following most important determinant factors on theadoption of computer-assisted auditing tools in the audit process are identified: Lack of training on how to use IT for work. Staff’s interest to learn how to use CAATTs. Lack of skill on how to use it. Cost of acquisition. The attitude of staffs towards CAATTs. Low awareness about CAATTs. Size of the audit client.
The reliability test of data collected through an opinion survey is ensured by usingCronbach's Alpha. The Alpha of Cronbach's is derived at .0905 that is much higher than thethreshold limit of 0.70. It indicates data are fully reliable for statistical analysis.
The above analysis revealsdeterminant factors of effective utilization of CAATTs. Thesignificance of each factor has been identified by calculating the mean score of Likert Scaledeterminant factors data. Now it has to be checked whether there is any significant differenceis available among different determinant factors of adoption of CAATTs or not. For thispurpose, a hypothesis has been developed as “that there is no significant differences amongvarious determinant factors for adoption of Computer Assisted Audit Tools and Techniques(CAATTs). It means each and every determinant factors having the same level of significanceto adopt CAATTs”.
In order to check this hypothesis, ANOVA technique has been used. The statisticaloutput of the ANOVA has been summarized in the following table:
Table 5: ANOVA TableSource of Variation SS df MS F P-value F critBetween Groups 42.4125 11 3.855682 3.810463 2.22E-05 1.798737Within Groups 959.25 948 1.011867
Total 1001.663 959Source: Own Calculation on Ms-Excel 2013
It is observed from the above table no. 5 that the calculated F value (3.810463) is veryhigh than the tabulated value (1.798737) at 5% significance level and P-value is less than0.05. Hence, the null hypothesis (H02) is rejected. It indicates that there is a significantdifference among various determinant factors of CAATTs. It means each and everydeterminant factor having not the same significance level. The factors identified through surveyanalysis are not equally significant. The result of ANOVA shows that factors are independentand are having an individual independent significant impact.Concluding Remark
In the computerized era of this business environment, the adoption of ComputerAssisted Auditing tools and techniques in the audit process is very essential. For effectiveutilization of computer-assisted audit tools and techniques, it is important to identifyscopes/area where computer-assisted audit tools and techniques are used and determinantfactors of adoption of computer-assisted audit tools and techniques. The objective of the

Neelam Yadav & Dr. Shurveer S. Bhanawat: Unveil the Scope of Adoption of Computer Assisted...... 21
present study is to unveil the scope and determinant factors of computer-assisted auditingtools and techniques. Results of the study show that the use of CAATTs in Audit process isvery low. Results concluded that all specific area in which CAATTs can be used areindependent and having an individual independent significant impact. Result also concludesthat there is a significant difference among various determinant factors of CAATTs. It meanseach and every determinant factor does not the same significance level. Both null hypotheseshave been rejected. This type of study also helps to identify the areas in which CAATTs arerarely used and what are the areas in which they are most predominately used and the reasonfor the same. It will help the software developers to design the future software accordingly. Onthe basis of factor analysis, 30 scopes are reduce in 5 factors i.e. System audit, ITCommunication System, Computational work, testing of Accounts and Audit Planning. Forachieving the objective of the study five scopes for using CAATTs were identified on the basisof mean score. The results of mean score basis are summarised below.
On basis of statistical analysis (mean score), top five scopes/area wherepredominantly computer-assisted auditing tools and techniques are used. These are: Depreciation Calculation Tax Calculations E-Mail Electronic Spreadsheet Interest expense/income computation
On basis of statistical analysis (mean score), following five scopes/area are identifiedwhere computer-assisted audit tools and techniques are rarely used. Test data generator Continuous auditing / Embedded Audit Module Parallel Simulation in the audit process Planning software Audit memos
On the basis of mean score the following most important determinant factors on theadoption of computer-assisted auditing tools in the audit process are identified: Lack of training on how to use IT for work. Staff’s interest to learn how to use CAATTs. Lack of skill on how to use it. Cost of acquisition. The attitude of staffs towards CAATTs. Low awareness about CAATTs. Size of the audit client.References1. Kotb, A., & Roberts, C. (2011, July ). The Impact of E‐Business on the Audit Process:
An Investigation of the Factors Leading to Change. Internatioanl Journal of Auditing,15(2), 150-175. doi:https://doi.org/10.1111/j.1099-1123.2011.00427
2. Ernest, O. O. (2015). The Relevance of Auditing in a Computerized AccountingSystem. International Journal of Management and Applied Science, 1(11), 79-83.Retrieved September 04, 2018
3. Bierstaker, J., Janvrin, D., & Lowe, D. J. (2013). What factors influence auditors' use ofcomputer-assisted audit techniques? Advances in Accounting, incorporating Advancesin International Accounting, 1-8. Retrieved october 15, 2018, fromwww.elsevier.com/locate/adiac

22 Indian Journal of Accounting (IJA) Vol. 51 (1), June, 2019
4. Zainol, S. B., Samsuri, A. B., Tunku Arifin, T. B., Hussin, S. B., Othman, M. B., & Jie,S. J. (2017, May ). Determinants of Computer Assisted Audit Techniques (CAATS)Adoption. A Study in Small and Medium Practices in Malaysia. European Journal ofBusiness and Social Sciences, 6(2), 135-150. Retrieved October 03, 2018, fromhttp://www.ejbss.com/recent.aspx-/
5. Zuca, M., & Țînța, A. (2018, March). The Contribution of Computer Assisted AuditingTechniques (CAAT) and of the Business Intelligence Instruments in Financial Audit.Academic Journal of Economic Studies, 4(1), 183-191. Retrieved October 28, 2018
6. Olasanmi, O. O. (2013). Computer Aided Audit Techniques and Fraud Detection.Research Journal of Finance and Accounting, 4(5), 67-79. Retrieved October 03,2018, from www.iiste.org
7. Pedrosa, I., & Costa, C. J. (2014). New trends on CAATTs: what are the CharteredAccountants’ new challenges? ISDOC’14. Lisbon, Portugal: Research Gate. RetrievedOctober 11, 2018, from https://www.researchgate.net/publication/262398586
8. Konthong, K., Sangboon, K., & Srimuangtong, N. (n.d.). Understanding The ComputerAssisted Audit Techniques Acceptance of CPAs in Thailand: A Conceptual Paper.Proceedings of the Academy of Management Information and Decision Sciences.19(2), pp. 6-15. Jordan Whitney Enterprises, Inc, Weaverville, NC, USA. RetrievedOctober 17, 2018
9. Mansour , E. M. (2016). Factors Affecting the Computer Assisted Auditing Techniquesin Audit process: Findings from Jordon. Business and Economic Research, 6(1), 248-271. Retrieved October 17, 2018, from www.macrothink.org/ber
10. Shamsuddin, A., Rajasharen, L. A., Maran, D. A., Mohamed Ameer, M. F., & Muthu, P.A. (2015, April ). Factors Influencing Usage Level of Computer Assisted AuditTechniques (CAATs) By Internal Auditors in Malayisa. South East Asia Journal ofContemporary Business, Economics and Law, 6(1), 17-24. Retrieved october 11,2018, from https://www.researchgate.net/publication/299411834
11. Ebimobowei, A., Ogbonna, G. N., & Enebraye, Z. P. (2013). Auditors’ Usage ofComputer Assisted Audit Tools and Techniques: Empirical Evidence from Nigeria.Research Journal of Applied Sciences, Engineering and Technology, 6(2), 187-195.doi:10.19026/rjaset.6.4057
12. Mahzan, N., & Lymer, A. (2014). Examining the adoption of computer-assisted audittools and techniques Cases of generalized audit software use by internal auditors.Managerial Auditing Journal, 29(4), 327-349. doi:10.1108/MAJ-05-2013-0877
13. Janvrin, D., Bierstaker, J., & Lowe, D. J. (2009). An Investigation of Factors Influencingthe Use of Computer-Related Audit Procedures. Journal of Information Systems,23(1), 97-118. Retrieved October 28, 2018
14. Shihab, M. R., Meilatinova, N., Hidayanto, A. N., & Herkules. (2017). Determinants ofCAATT acceptance: Insights from public accounting firms in Indonesia. ProcediaComputer Science, 124, 522-529. Retrieved October 11, 2018, fromwww.sciencedirect.com
15. Rosli, K., Siew, E.-G., & Yeow, P. H. (2016). Technological, Organisational andEnvironmental Aspects of Audit Technology Acceptance. International Journal ofBusiness and Management, 11(5), 140-145. doi:10.5539/ijbm.v11n5p140
16. Awa, H. O., & Ojiabo, O. U. (2016). A model of adoption determinants of ERP within T-O-E framework. Information Technology & People, 29(4), 901-930. doi:10.1108/ITP-03-2015-0068

Neelam Yadav & Dr. Shurveer S. Bhanawat: Unveil the Scope of Adoption of Computer Assisted...... 23
17. Rosli, K., Yeow, P. H., & Siew, E.-G. (2012). Computer-Assisted Auditing ToolsAcceptance Using I-Toe: A New Paradigm. Pacific Asia Conference on InformationSystems. doi:http://aisel.aisnet.org/pacis2012
18. Ahmi, A., Saidin, S. Z., & Abdullah, A. (2017). Examining CAATTs Implementation byInternal Auditors in the Public Sector. Indian-Pacific Journal of Accounting andFinance (IPJAF), 1(2), 50-56. Retrieved September 28, 2018, fromwww.ipjaf.omjpalpha.com
Website https://www.aicpastore.com/Content/media/PRODUCER_CONTENT/Newsletters/Artic
les_2010/CPA/Jan/CAATS.jspEndnotes
i BYOD, or bring your own device, is a phrase that has become widely adopted to refer to employees whobring their own computing devices – such as smartphones, laptops and tablets – to the workplace for useand connectivity on the secure corporate network.
ii The unified theory of acceptance and use of technology (UTAUT) is a technology acceptancemodel formulated by Venkatesh and others (2003) in "User acceptance of information technology: Toward aunified view". The UTAUT aims to explain user intentions to use an information system and subsequentusage behavior.
Source:https://www.researchgate.net/figure/UTAUT-model-Venkatesh-et-al-2003-In-the-UTAUT-model-performance-expectance-is-driven_fig1_281321623iii Generalized audit software (GAS) refers to software designed to read, process and write data with the
help of functions performing specific audit routines and with self-made macros. It is a tool in applyingComputer Assisted Audit Techniques (CAATs). Functions of generalized audit software include importingcomputerized data; thereafter other functions can be applied: the data can be e.g. browsed, sorted,summarized, stratified, analysed, taken samples from, and made calculations, conversions and otheroperations with. Two of the most popular software packages are Audit Command Language (ACL) andInteractive Data Extraction and Analysis.
iv The technology acceptance model (TAM)is an information system theory that models how users come toaccept and use a technology. The model suggests that when users are presented with a new technology, anumber of factors influence their decision about how and when they will use it. Developed by (Davis, 1989;Davis, Bagozzi, &Warshaw, 1989).
Source:https://en.wikipedia.org/wiki/Technology_acceptance_model

24 Indian Journal of Accounting (IJA) Vol. 51 (1), June, 2019
v Technology-Organization-Environment Framework Model.The process by which a firm adopts and implements technological innovations is influenced by thetechnological context, the organizational context, and the environmental context (DePietro, Wiarda, &Fleischer, 1990).A model was developed by Tornatzky and Fleischer (1990).

Indian Journal of Accounting (IJA) 25ISSN : 0972-1479 (Print) 2395-6127 (Online) Vol. 51 (1), June, 2019, pp. 25-33
ROLE OF XBRL IN PROMOTINGTHE INTEGRATED REPORTING IN INDIAN SCENARIO
Dr. M L Ashok
Abhishek N
ABSTRACT
Today all the business organizations working in the dynamic environment in which thestakeholders are having dynamic information need. So the information so communicated tostakeholders is not only related to the present scenario but it also related to past and futureprospect of the business operation. To achieve this it is impossible with communicating onlyfinancial information in the annual reports but it also necessary to communicate non-financialinformation in a single report to aid stakeholders to act strategically. So around the world,Integrated Reporting (IR) is the trend of the day. So there is a need of having standardizedmode of reporting that can be XBRL. So the present study is intended to analyze theimportance of integrated reporting, role of XBRL in promoting integrated reporting and thechallenges involved in promoting integrated reporting through XBRL. For this study collectedthe data through both primary and secondary sources and collected data is analyzed throughone-sample t-test and concludes that at present integrated reporting is very much important toIndian scenario and XBRL plays a significant role in promoting integrated reporting.
KEYWORDS: XBRL, Financial Information, Integrated Reporting, One-sample t-test._______________
IntroductionAccounting is the language of the business as a language it has to communicate
business and financial information to cater the need of all group of interested parties such asmanagement, investors, employees, customers, regulatory authorities and the public at largerinterest. To communicate business and financial information there is a necessity of astandardized mode which enables the firm to disclose entire accounting information of thebusiness. In the traditional days business and financial information were being communicatedthrough clay, paper, word format, PDF and HTML but these formats are highly suffered froman unique limitation as it is only readable by human but not by computers from this pointtraditional format of business and financial reporting system was not efficiently cater theinformation need of various stakeholders so it created the necessity of having the highlyadvanced efficient and modern format of business and financial reporting which removes thebarriers and shortcomings of traditional reporting. By keeping this in mind in April 1998,
Associate Professor DoS in Commerce, University of Mysore, Mysore, Karnataka, India. UGC-JRF Scholar, DoS in Commerce, University of Mysore, Mysore, Karnataka, India.

26 Indian Journal of Accounting (IJA) Vol. 51 (1), June, 2019
Charles Hoffman1 had developed XML based business and financial reporting language whichis presently well known by Extensible Business Reporting Language (XBRL) to remove theshortcomings of the traditional business and financial reporting mechanism. Today it hasbecome the open international standard for business and financial information reporting whichis developed and managed by the international non-profit organization, XBRL Internationalwhich consists of more than 600 organizational members across the globe2. XBRLInternational provides XBRL Taxonomy which is applicable to country-specific AccountingGAAP and IFRS as well. At present more than 60 countries implemented XBRL for businessand financial reporting by the companies3.
In India, XBRL emerged in 2007 when ICAI (Institute of Chartered Accountant of India)realized the importance of digital financial reporting to Indian scenario and MCA (Ministry ofCorporate Affairs) was imposed reporting of business and financial information through XBRLin the year 2011 for certain class of companies4. Today top 500 BSE listed companies arereporting their business and financial information through XBRL in India. In India, companiesare required to file various compliance reports to respective regulatory authorities in XBRLformats only. It shows the importance of XBRL in Indian scenario because of its efficientbenefits such as easy reporting, interoperability among regulatory authorities, near zero errorin filing, extendable, easy analysis, and re-usability without any re-keying and so on. But still,XBRL filing is not applicable to a certain group of industries such as Banking, Insurance,Power sector, non-banking financial companies, and housing financing companies5.The Working Mechanism of XBRL
XBRL has its own working mechanism with the help of two major documents such as: XBRL Taxonomy: it is a document and which works as the dictionary of financial
elements and defines the relationship among the elements. Taxonomy is developedbased on the regulatory requirement, Accounting GAAP applicable to a particularcountry. This helps the business to report the business and financial information as perthe requirement of regulatory authorities and easy compliance check before thesubmission of the various documents required by the different regulatory authorities.This document is developed by the regulatory authority of the country. In India MCA isthe sole authority to develop the XBRL taxonomy as per Ind-As with the help of ICAI.
XBRL Instance Document: it is a document which is developed by the companies withactual information of their business and financial operations as per the standardtaxonomy defined by the regulatory authority. With the help of instance documentscompany will generate financial statements, reports being submitted to variousregulatory authorities. This document is in the form of XML format and which shouldbe validated with the taxonomy validation tool to generate the business and financialreports of the organization.This working mechanism of XBRL had created plenty of benefits to the regulatory
authorities too. It minimized the lot of administrative work, removed the manual verification ofsubmitted documents, inter-exchangeability of reports among various government authoritiesthrough the internet.Integrated Reporting
Today all the business organizations working in the dynamic environment in which thestakeholders are having dynamic information need. So the information so communicated tostakeholders is not only related to the present scenario but it also related to past and futureprospect of the business operation. To achieve this it is impossible with communicating onlyfinancial information in the annual reports but it also necessary to communicate non-financialinformation in a single report to aid stakeholders to act strategically. So around the world,Integrated Reporting (IR) is the trend of the day6. IR is the mechanism of reporting both

Dr. M L Ashok & Abhishek N: Role of XBRL in Promoting the Integrated Reporting in Indian Scenario 27
financial and non-financial information in the single report of the business. IR is having three-dimensional reporting and analysis namely mandatory and voluntary disclosure, financial andnon-financial disclosure and forward-looking and historical information disclosure, but all thesethree dimensions are not inter-related and which cannot be avoided to reporting in firmdisclosures (Trucco, 2015)7. This clears that IR definitely supports the stakeholders byproviding dynamic information to aid them in timely decision making in their own perspective.By keeping this in mind the regulatory authorities around the world are taking the initiative ofmandating the IR to companies which are operating in their environment. Apart from this someof the countries have allowed companies to voluntarily reporting their business and financialinformation in an integrated manner like India. India’s SEBI a regulator of the stock market inits circular of February 2017 allowed top 500 listed companies to follow IR voluntarily in theirbusiness and financial reporting process8.Evolution of Corporate Reporting Over the Period of Time
Corporate houses are the artificial citizen of the country in which it operates and it isequally responsible towards the environment like a natural citizen. It utilizes the resources fromthe society for the achievement of its goal and at the same time it has to accountable to itsstakeholders by communicating information about its performance and the contributiontowards society in which it operates for the socio-economical sustainable development so it isnecessary to analyze how corporate reporting evolved over the period of time. During the1960s the corporate reporting trend was started by communicating the performance of thebusiness only with the help of financial statements I,e., Income statement, and Positionstatement. Due to the varying information need of stakeholders financial statement centriccorporate reporting advanced during the 1980s by including Management discussions,Governance issues, Environmental reporting along with Financial statements this periodwitnessed the emergence of Integrated Reporting. Due to the dynamic nature of the businessenvironment during 2000 corporate reporting is well advanced by including the concept ofSustainability Reporting (SR) and by 2020 Corporate reporting around the world will shift staticreporting approach to dynamic Integrated Reporting approach9.
Table 1: Stages of Evolution of Corporate Reporting Around the WorldStages of Evolution ofCorporate Reporting
Focus on Information
The 1960s Financial Statements – only financial performance related informationThe 1980s Financial Performance, Management Discussions, Governance,
Environmental Reporting2000 Financial Performance, Management Discussions, Governance,
Sustainability Reporting2020 (expected) Integrated Reporting (Past, Present, Future)
Source: International Integrated Reporting Council9
Role of XBRL in Implementing Integrated ReportingInternational Integrated Reporting Council was mentioned that there is a necessity of
having the technological support for the efficient implementation of Integrated Reportingaround the world10. To achieve these corporate houses can use XBRL as the technologicalsupport for successful implementation of Integrated Reporting. In addition to this XBRLinternational is also stated that it will support in developing the required taxonomy forintegrated reporting implementation around the world. XBRL plays a vital role in successfulimplementation of Integrated Reporting due to the following opportunities and benefits: It helps in easy consumption integrated information with the help of XBRL taxonomies. It allows integrated information readable by both human and machines(i.e., computers)

28 Indian Journal of Accounting (IJA) Vol. 51 (1), June, 2019
XBRL enables reported integrated information to be re-usable again and again withoutre-keying i.e., it avoids routine manual repetitive tasks.
XBRL works with pre-coded integrated information templates that is taxonomy forintegrated reporting which will works with greater accuracy with near zero defect i.e.,99.99966% level.
XBRL also helps in preserving data structure and its context for the long period. This language is also helps in automatic verification of standard integrated reporting
rules with actually reported information i.e., it allows easy compliance check. If the corporate houses situated in a particular environment are following XBRL for IR
then it is very easy for comparison of information across the companies. Further it enables the firm to include additional company specific information with
extendibility feature.So the present paper is intended to analyse the role of XBRL in promoting integrated
reporting in Indian scenario for this purpose paper is organized as literature review, researchgap, statement of the problem, research questions, research objectives, hypotheses,methodology, results and discussions, conclusions, limitations and recommendations forfurther research.Literature Review
Pistoni et al.,(2018)11 conducted a study to assess the quality of integrated reportsthrough a quality scoring model and integrated reporting scoring board by taking intoconsideration of 116 integrated reports. The study concludes that IR quality is low. Companiesare following only IR framework but not disclose the sufficient information.
Makiwane and Padia, (2013)12 analyzed the level of corporate governancedisclosures specifically with respect to the extent to which non-financial information isdisclosed in the annual reports. The study found that the companies are more disclosing non-financial information than financial information in annual reports as a part of integrativeinitiative.
Jensen and Berg, (2012)13 opines that the countries with a high investor protectionenvironment with disperse ownership nature of financial system and high market co-ordinationtends to have integrated reporting.
Ioana and Adriana, (2013)14 Identified three stages in the evolution of the integratedreporting namely emergence of non-financial reporting initiatives, sustainability era andcontemporary integrated reports and concludes that one could consider the role of globalreporting standards to encourage the production of high quality integrated reports.
Ana oluic and Mamic Sacer (2013)15 analyzed the impact of information technologyon accounting process and on accounting information system quality. They collected datethrough structured questionnaire from 400 large and medium size companies and othersecondary sources. Collected data was analyzed through simple statistical tools such asaverages, percentages etc., finally their study concluded that the information technology issignificantly effects on the quality of financial reporting system by ensuring the accuracy,timeliness and reduced cost of production accounting information. They also suggested for theimprovement of some areas such as implementation of suitable training to employees and toconduct continuous auditing of information to ensure the quality of accounting information.
Steve Yang etal., (2016)16 examined the impact of XBRL on financial statementstructural comparability during the post XBRL implementation period in US. For the purpose ofdata, the authors have adopted secondary sources by analyzing 27,971 annual reports from10 industries for the period 2010-2014. Data collected was analyzed through content analysis,graph similarity measure, local outlier factor algorithm and Mann-Whitney U test were applied

Dr. M L Ashok & Abhishek N: Role of XBRL in Promoting the Integrated Reporting in Indian Scenario 29
and they analyzed income statement, balance sheet and cash flow statement structurethrough XBRL SEC filings and found that there is significant improvement in structuralcomparability of financial statements and also witnessed that the XBRL filings benefitsregulators in providing suggestions for continuous development of XBRL in USA.
Ernest and Harmon (2012)17. Have analyzed and predicted the role of auditors whichcould be expanded with the introduction of XBRL financial reporting by their conceptual study.They have found that the steps involved in creating XBRL financial statements createadditional risks in financial statement disclosure. For this reason, they are in the opinion thatauditors will be required to adjust their process and also master XBRL terminology,taxonomies and tools. Also suggests auditors to gain early and in depth knowledge of auditimplications of XBRL which will give a strategic competitive advantage in the marketplace.Research Gap
From the review of earlier studies it is found that the studies were mainly focused onquality of integrated reporting and on impact of XBRL reporting but no studies were individuallyconducted on the role of XBRL on promoting integrated reporting. So the present study isintended to analyse the role of XBRL in promoting integrated reporting in Indian scenario.Statement of the Problem
Integrated reporting is the trend of the day in corporate reporting environment so thereis a necessity of promoting integrated reporting in a unified manner for this purpose XBRL willbecome the greater platform for implementing integrated reporting by the companies in India.So it created the necessity of analysing the role of XBRL in promoting integrated reporting bytaking the perception of various stakeholders of integrated information of the business.Research Questions
Based on the statement of the problem study framed following research questions: Why integrated reporting is important? How XBRL promotes integrated reporting? What are the challenges to be faced in promoting integrated reporting through XBRL?Research Objectives
Based on the research questions the study framed following research objectives: To analyse the importance of integrated reporting. To evaluate the perception of stakeholders on the role of XBRL in promoting
integrated reporting. To examine the challenges involved in promoting integrated reporting through XBRL.Hypotheses
Based on the research objectives following research hypotheses were framed:H0: Integrated reporting is not significantly important to Indian scenario.H0: XBRL is not helps in promoting integrated reporting system.Methodology
The study involved through certain methodological issues such as it is descriptive andempirical in nature, data collected through both primary and secondary sources. Primary datais collected through structured questionnaire both off-line and online are used to get theperception of various stakeholders and secondary data is collected through articles,newspapers, websites, government reports etc., for the purpose study stakeholders includesInvestors, Regulators, Academicians, auditors and financial analysts. The collected data isanalysed with the inferential statistics by using one-sample t-test.

30 Indian Journal of Accounting (IJA) Vol. 51 (1), June, 2019
Sampling MethodFor the purpose of study convenience sampling method is used. 50 questionnaires
were distributed and 44 responses were received and which is indicated in the following table.Table 2: Stakeholders Group for the Purpose of Study
Stakeholders Category Number of Respondents Number of Responses Received
Investors 15 13
Regulators 05 04
Academicians 15 15
Auditors and financial analysts 15 12
Total 50 44Source: Author compilation
Results and DiscussionThe results of perception of stakeholders is analysed as follows:
Table 3: Results One-Sample t-test for the Perception of Stakeholders on theImportance of Integrated Reporting (Test value – 3)
Importance of Integrated Reporting N Mean Std. Deviation t-value Sig.(2-tailed)
IR is focuses on past, present and future prospect ofthe firm 44 4.1136 1.03914 7.109 .000
IR is a vehicle for creation of long-term value forbusiness 44 4.0227 1.17114 5.793 .000
IR is helps in recognizing risks and opportunities in ashort, medium and long-term 44 4.0682 .84627 8.373 .000
IR is more external oriented 44 3.8864 1.35055 4.353 .000
IR is a tool for strategically decisions to be made byvarious stakeholders 44 4.6136 .49254 21.731 .000
IR is multidimensional and covers both financial andnon-financial information equally 44 4.3864 1.03914 8.850 .000
IR is helps in co-ordinating among planning and co-ordinating functions 44 4.3864 .61817 14.876 .000
IR helps in building confidence on the businessperformance 44 4.2273 .93668 8.691 .000
IR improves future performance of the business 44 4.1818 1.06253 7.378 .000
IR helps in providing sustainable information to thestakeholders 44 4.3864 .65471 14.046 .000
Source: SPSS Output
Table 3 shows that the results of one-sample t-test at the 5% significance level for theperception of stakeholders on the importance of integrated reporting in Indian scenario. Themean value of all the variables on importance of integrated reporting are showing abovestandard mean value that is 3. This clears that integrated reporting is vital for the companiesbecause it is multidimensional. Further the p-value of all the variables showing less than 0.05which means null hypothesis (H0) is rejected that is integrated reporting is not significantlyimportant to Indian scenario and alternative hypothesis (H1) is accepted that is integratedreporting is significantly important to Indian scenario.

Dr. M L Ashok & Abhishek N: Role of XBRL in Promoting the Integrated Reporting in Indian Scenario 31
Table 4: Results One-Sample t-test on the Perception of Stakeholders onthe Role of XBRL in Promoting Integrated Reporting
Role of XBRL in Promoting Integrated Reporting N Mean Std.Deviation
t-value Sig.(2-tailed)
XBRL improves the quality of business and financialreporting 44 4.0455 1.25669 5.518 .000
XBRL allows the companies for flexible reporting 44 4.2273 1.13841 7.151 .000XBRL allows to report both financial and non-financialinformation 44 4.4773 .97620 10.038 .000
XBRL enables the companies to automatic verification ofreported integrated information with required information byregulatory authorities
44 3.9773 1.32048 4.909 .000
XBRL taxonomies for IR helps the regulatory authorities toensure uniformity in reporting 44 4.2045 .90424 8.836 .000
XBRL allows easy comparison of Integrated Informationacross the firms 44 4.2727 .97321 8.675 .000
XBRL allows to report both financial and non-financialinformation equally 44 4.0000 1.14119 5.813 .000
XBRL eliminates the clerical errors in integrated reportpreparation 44 4.6818 .47116 23.678 .000
XBRL helps in reducing the cost of preparation andpublication of integrated reports 44 4.0682 1.20845 5.863 .000
XBRL helps in easy analysis of business and financialinformation 44 4.1364 1.30457 5.778 .000
Source: SPSS Output
Table 4 shows that the results of one-sample t-test at the 5% significance level for theperception of stakeholders on the role of XBRL in promoting integrated reporting. The meanvalue of all the variables on the role of XBRL in promoting integrated reporting are showingabove standard mean value that is 3. This clears that XBRL plays vital role in promotingintegrated reporting. Further the p-value of all the variables showing less than 0.05 whichmeans null hypothesis (H0) is rejected that is XBRL is not helps in promoting integratedreporting and alternative hypothesis (H1) is accepted that is XBRL is helps in promotingintegrated reporting.Challenges Involved in Promoting Integrated Reporting through XBRL
By the analysis of secondary information study identified the following challengesinvolved in promoting integrated reporting through XBRL: To promote integrated reporting through XBRL it is very important to get common
agreement among various professional organisations. But it is very difficult to achieveconsensus among these organisations.
To develop taxonomy for IR it is very difficult to harmonise various standards likeIASB, GRI, CDP, and Sustainability Accounting Standards Board because theprinciples of these standards vary from each other.
A big challenge to the software engineers to develop software tools which is capableof XBRL tagging integrated reporting.
It is very difficult to develop tools for analysing data. Preparation of XBRL reporting guidance for integrated reports for prepares is another
big challenge. Creating awareness and conducting educational programs for preparers and users
about integrated report preparation and making them understanding its usefulness is adifficult task.

32 Indian Journal of Accounting (IJA) Vol. 51 (1), June, 2019
FindingsWith reference to the objectives of study, following findings are presented:
With respect to first objective by analysing the perception of the stakeholders studyfound that integrated reporting is significantly important to companies in Indianscenario because it is multidimensional and focuses on past, present and futureprospective of the business performance and aid to the stakeholders in making timelystrategic decisions.
With respect to second objective by analysing the perception of the stakeholdersstudy found that XBRL plays a significant role in promoting integrated reporting by thecompanies in Indian scenario because it is the dynamic mode of reporting andcommunicating both financial and non-financial information of the business as per theneed of various stakeholders along with confirming business rules set by stakeholders,further it eliminates the pitfalls of conventional reporting format of reporting and finallyit helps in harmonizing financial reporting in Indian scenario.
With respect to last objective study identified significant challenges to be faced byregulatory authorities, business people and XBRL software developers in promotingintegrated reporting system in India through XBRL.
ConclusionDue to the dynamic changes in the business environment the stakeholders are also
having dynamic information need for taking strategic decisions in their individual perspectiveon the companies matter so there is an oblivious need of providing integrated information toend-users. Further it is also important to maintain consistency and uniformity in communicationof integrated information. To achieve this XBRL will play a vital role because of its fruitfulnessin various perspectives. Finally study concludes that future of business and financial reportingonly with the help of XBRL and which is one and only the tool for harmonizing integratedreporting by the companies not only at Indian scenario but also in global scenario.Limitations
The present study is also suffers from some limitations that are listed as follows: The study considered only perceptions and not analyzed technical aspects of
integrated reporting through integrated reports. The methodology adopted for study itself is suffers from its own limitations that can be
affecting on the results.Scope for Further Research
Finally study identified certain issue which may become an opportunity for futureresearch is analysing the integrated reports and comparing within the industry or across theborder of the country. Further feasibility analysis can be conducted on the suitability of XBRLfor integrated reporting for Indian scenario.References1. http://www.xbrleducation.com/edu/history.htm2. https://www.xbrl.org/the-standard/what/an-introduction-to-xbrl/3. https://www.xbrl.org/xbrl-around-the-world/4. https://www.datatracks.in/xbrl-blog/journey-xbrl-reporting-india/5. http://www.mca.gov.in/MinistryV2/xbrl.html6. https://www.icas.com/ca-today-news/what-is-integrated-reporting-why-it-matters7. Trucco, S. (2015). Financial accounting: development paths and alignment to
management accounting in the Italian context. Springer.

Dr. M L Ashok & Abhishek N: Role of XBRL in Promoting the Integrated Reporting in Indian Scenario 33
8. https://www.pwc.in/research-insights/2018/integrated-reporting-corporate-perspective-in-india-may-2018.html
9. http://integratedreporting.org/wp-content/uploads/2011/09/IR-Discussion-Paper-2011_spreads.pdf
10. https://sfmagazine.com/wp-content/uploads/sfarchive/2013/06/XBRL-Integrated-Reporting-and-the-Potential-Role-of-XBRL.pdf
11. Pistoni, A., Songini, L., & Bavagnoli, F. (2018). Integrated Reporting Quality: AnEmpirical Analysis. Corporate Social Responsibility and Environmental Management.
12. Makiwane, T. S., & Padia, N. (2013). Evaluation of corporate integrated reporting inSouth Africa post King III release South Africa-an exploratory enquiry. Journal ofEconomic and Financial Sciences, 6(2), 421-438.
13. Jensen, J. C., & Berg, N. (2012). Determinants of traditional sustainability reportingversus integrated reporting. An institutionalist approach. Business Strategy and theEnvironment, 21(5), 299-316.
14. Ioana, D., & Adriana, T. (2013). New corporate reporting trends. Analysis on theevolution of integrated reporting. Annals of the University of Oradea, EconomicScience Series, 22(1), 1221-1228.
15. Mamić Sačer, I., & Oluić, A. (2013). Information Technology and AccountingInformation Systems’ Quality in Croatian Middle and Large Companies. Journal ofInformation and Organizational Sciences, 37(2), 117-126.
16. Yang, S. Y., Liu, F. C., & Zhu, X. (2015). An exploratory study of financial reportingstructures: A graph similarity approach using XBRL.
17. Ernest A. Capozzoli and W. Ken Harmon. (2012). The Impact of XBRL on the AuditProcess. Journal of Business, Industry and Economics Volume 17.

Indian Journal of Accounting (IJA) 34ISSN : 0972-1479 (Print) 2395-6127 (Online) Vol. 51 (1), June, 2019, pp. 34-42
STOCK MARKET VOLATILITY IN MAJOR INDICES OF WORLD:AN ANALYTICAL STUDY OF BSE SENSEX, NASDAQ, HANG SANG, NIKKEI AND DOW JONES
Dr. S.K. Khatik
Mr. Milind Patil
ABSTRACT
Volatility in stock market has turned into a matter of common worry for investors,regulator and stock brokers. Stock market volatility obstructs monetary performance throughconsumer spending. Stock market volatility may likewise influence business investmentspending. Further the extraordinary volatility could upset the smooth working of the financialsystem and lead to regulatory changes. This research paper is expected to throws light on thebehavior of mean and volatility across the BSE Sensex, Nasdaq, Hang Sang, Nikkei and DowJones and identifies the risk present in each of these markets that is being generated. Thepaper used descriptive statistics for the return series include mean, standard deviation,skewness, kurtosis. The return distribution of BSE Sensex is positively skewed while Nasdaq,Hang Sang, Nikkei and Dow Jones returns are negatively skewed, indicating that thedistribution is non-symmetric. Negative values of skewness of Nasdaq, Hang Sang, Nikkei andDow Jones suggest that the probability of generating negative return is higher. The analysisdetects the persistence of volatility in Hang Sang market is less as compared to other marketof the world.
KEYWORDS: Volatility, BSE Sensex, Nasdaq, Hang Sang, Nikkei, Dow Jones._______________
IntroductionVolatility in stock market has turned into a matter of common worry for investors,
regulator and stock brokers. Stock market volatility obstructs monetary performance throughconsumer spending. Stock market volatility may likewise influence business investmentspending. Further the extraordinary volatility could upset the smooth working of the financialsystem and lead to regulatory changes. Understanding the stock-market risk and return isimperative in light of the fact that more risk adverse investor request a higher risk, this makes ahigher cost of capital hindering profitable corporate venture.Review of Literature
According to “Juhi Ahuja” (2012) presents an review of Indian Capital Marketand its structure. In a decade ago or thereabouts, it has been seen that there has been a
Professor and Ex-Head, Department of Commerce, Dean Faculty of Commerce, Chairman, Board ofStudies Applied Economics & Business Management, Barkatullah University, Bhopal, M.P., India.
Research Scholar, Department of Commerce, Barkatullah University, Bhopal, M.P., India.

Dr. S.K. Khatik & Mr. Milind Patil: Stock Market Volatility in Major Indices of World: An Analytical..... 35
change in perspective in Indian capital market. The use of numerous changes andadvancements in Indian capital market has made the Indian capital market practicallyidentical with the universal capital markets. Presently, the market includes a createdadministrative component and an advanced market framework with developing businesssector capitalization, showcase liquidity, and activation of assets. The development ofPrivate Corporate Debt showcase is additionally a decent advancement supplanting thefinancial method of corporate financing. In any case, the market has seen its mostnoticeably bad time with the ongoing worldwide financial emergency that began from theUS sub-prime home loan market and spread over to the whole world as a disease. Thecapital market of India conveyed a languid exhibition.
According to “Arun Jethmalani” (2014) investigated the presence and estimation ofhazard engaged with putting resources into corporate securities of shares and debentures. Herecognized that chance is normally decided, in light of the reasonable difference of profits. It isprogressively hard to look at 80% chances inside a similar class of ventures. He is of theconclusion that the financial specialists acknowledge the hazard estimation made by the FICOscore organizations, yet it was addressed after the Asian emergency. He finished up his articleby remarking that chance isn't quantifiable. In any case, chance is determined based onmemorable instability. Returns are corresponding to the dangers, and speculations ought to befounded on the financial specialists' capacity to hold up under the dangers.
According to “Avijit Banerjee” (2015), Iinvestigate the value of the individualsecurities which will be utilize in portfolio development. Specialized Analysis recognizesthe most proper time to purchase or sell the stock. It expects to stay away from theentanglements of wrong planning in the speculation choices. He additionally expressedthat the advanced portfolio writing suggests 'beta' value Pas the most worthy proportion ofdanger of scrip. The securities having low P ought to be chosen for building a portfolio soas to limit the dangers.Objectives of the Study
The objectives of the study are as follows: To study the volatility of major indices of world. To study the causes of volatility of major indices of worldResearch Design
We collected data on monthly closing price of BSE Sensex, Nasdaq, Hang Sang,Nikkei and Dow Jones from January 2010 to February 2019.The period is the most recentone. The stock markets have become increasingly integrated. We use yahoo financedatabase for analyzing volatility. This research paper uses descriptive statistics tosummarize and portray important characteristic of large sets of data. The two key areasthat have been used in this paper are measures of central tendency and measure ofdispersion. In the territory of investments, measures of central tendency give a sign of aninvestment’s normal return and measure of dispersion demonstrate the riskiness/volatilityof an investment.Data Analysis BSE Sensex
The BSE SENSEX is a record of thirty settled and monetarily solid organizationsrecorded on Bombay Stock Exchange. The 30 component organizations which are probablythe biggest and most effectively exchanged stocks are illustrative of different mechanicaldivisions of the Indian economy.

36 Indian Journal of Accounting (IJA) Vol. 51 (1), June, 2019
Graph 1: BSE Sensex
The graph no.1 show the return pattern of BSE sensex from Jan 2010 to Feb 2019.Inthe year Jan 2010 the BSE Sensex was 16429.55,jumped to 35867.44 registered the CAGR of0.72%.In the month of August 2010 the sensex cross 20069.12,registered the growth rate of11.67% as compared to 17971.28 in the month of July 2010.In the month of December 2010the sensex felt down to 18327.76, registered the negative growth rate of 10.64%.FromDecember 2010 to August 2013 the sensex was moving in the range of 18327.76 to 19379.77.In the month of September 2013 the sensex touched the height of 21164.52.In the month ofFebruary 2016 the sensex touched 25341.86 mark and registered the growth rate of 10.17%.Inthe month of April 2017 the sensex crossed 31145.80.In the month of December 2017 thesensex was 35965.02.In July 2018 the sensex was 38645.07.In the month of August 2018 thesensex fall down to 36227.15 and 34442.05 in the month of September 2018. Nasdaq
The NASDAQ Composite is a stock market index of the basic stocks and comparablesecurities recorded on the NASDAQ stock market. Alongside the Dow Jones Average andS&P 500 it is one of the three most-pursued indices in US stock markets.
Graph 2: Nasdaq Index
The graph no.2 show the return pattern of Nasdaq Index from Jan 2010 to Feb2019.In the year Jan 2010 the Nasdaq index was 2238.26,increased to 7532.53 registeredthe CAGR of 1.11%.In the month of march 2012 the Nasdaq index crossed 3091.57. In the
-15.00%
-10.00%
-5.00%
0.00%
5.00%
10.00%
15.00%
-15.00%
-10.00%
-5.00%
0.00%
5.00%
10.00%
15.00%

Dr. S.K. Khatik & Mr. Milind Patil: Stock Market Volatility in Major Indices of World: An Analytical..... 37
month of March 2013, July 2013, September 2013 the index crossed 3267.52, 3626.37, and3771.48 respectively. In the month of November 2013 the Nasdaq index crossed4059.89.registered the growth rate of 7.65%.In February 2014 the index was 4308.12registered the growth rate of 6.11% as compared to November 2013.In the month of May2015 the index reached to 5070.03,registered the growth rate of 17.68% as compared toFebruary 2014.In the month of April 2017 the Nasdaq was 6047.6,registered the growth rateof 19.28% as compared to may 2015.In the month of January 2018 the index crossed7411.48 registered the growth rate of 7.36% as compared with December 2017.In the monthof August 2018 the index reached the new highest of 8109.54 as compared to 7411.48 in themonth of January 2018.From September 2018 the Nasdaq index was decreasing month tomonth and reached 7532.53 mark. Hang Sang Index
The Hang Sang Index is situated in Hong Kong. It is utilized to record and screen dayby day changes of the biggest organizations of the Hong Kong stock exchange and is theprimary pointer of the general market execution in Hong Kong.
Graph 3: Hang Sang Index
The graph no.3 show the return pattern of Hang Sang Index from Jan 2010 to Feb2019.In the year Jan 2010 the Hang Sang index was 20608.70,increased to 28633.18registered the CAGR of 0.30%.In the month February 2010 the Index was 21239.35 registeredthe growth rate of 3.306% as compared to January 2010.In September 2010 the indexreached up to 23096.32 and hovering in the range of 23096.32 to 23468.2 in the month ofMarch 2011In the month of February 2017 the Index was 24111.59, reached to 25660.65 inthe month of April 2017 registered the growth rate of 17.22%In the month of July 2017 indexwas 27970.30, 28245.54 (September 2017), 29177.35 (October 2017) 32887.27(December2017), 30844.38 (January 2018), 30093.38 (February 2018), 28955.11 (May 2018),27888.55 (July 2018), 24979.69 (September2018).In the month of January 2019 the indexreached 28633.18. Nikkei 225 Index
The Nikkei 225, all the more ordinarily called the Nikkei, the Nikkei list, or the NikkeiStock Average, is a stock exchange in Tokyo Stock Exchange. It has been determined everyday by the Nihon Keizai Shinbun newspaper since 1950.
-20.00%
-15.00%
-10.00%
-5.00%
0.00%
5.00%
10.00%
15.00%

38 Indian Journal of Accounting (IJA) Vol. 51 (1), June, 2019
Graph 4: Nikkei 225 Index
The graph no.4 show the return pattern of Nikkei 225 Index from Jan 2010 to Feb2019.In the year Jan 2010 the Hang Sang index was 10126.03,increased to 21385.16registered the CAGR of 0.68%.In the month of February 2010 the index was11089.94,decreases to 11057.40 in march 2010.From April 2010 to October 2010 the indexwas in the range of 9768.7 to 9937.04.It has been observed that from November 2012 theindex started increasing from 10395.18.In march 2013 it reached 13860.86 registered thegrowth rate of 33.33%.In october 2010 it reached 15661.87.In the month of April 2015 theindex crossed the level of 20563.15 and reached 24120.04 in the month of August 2018.Inbetween The year 2015 to 2018 the index was moving in following level 18890.48 (July 2015),17388.15 (August 2015), 19747.47 (October 2015), 16026.76 (January 2016),17234.98 (April2016),15575.92 (May 2016),19114.37 (November 2016),20356.28 (August 2017).Dow Jones Industrial Average
The Dow Jones Industrial Average is situated in the United States of America andcomprises of thirty stocks.
Graph 5: Dow Jones Industrial Average
The graph no.5 show the return pattern of Dow Jones Industrial Average from Jan2010 to Feb 2019.In the year Jan 2010 the Dow Jones Industrial Average was10325.26,increased to 25916 registered the CAGR of 0.84%.From the level of 10325.26 theindex reached the level of 12226.34 in the month of February 2011.In April 2012 the indexreached 13213.63 and 15115.57 in May 2013.In December 2015 the index was 17425.03level.In the month of February 2017 the index crossed the 20812.24 level and reached thelevel of 26149.22 level in the month of September 2018.From October 2018 to February 2019the index was in the range of 25115.76,25538.46,23327.46, 24999.67and 25916.
-20.00%
-10.00%
0.00%
10.00%
20.00%
-10.00%
-5.00%
0.00%
5.00%
10.00%
15.00%

Dr. S.K. Khatik & Mr. Milind Patil: Stock Market Volatility in Major Indices of World: An Analytical..... 39
Statistical AnalysisTable no 1 show the descriptive statistics of major indices of the world. The above
table summarizes the important characteristics of large data set. The focus of this researchstudy is on the use of descriptive statistics to consolidate a mass of numerical data into usefulinformation.
Table 1: Descriptive Statistics of World Major IndicesParticular Bse Sensex Nasdaq Hang Seng Nikkei Dow Jones
Mean 0.82% 1.25% 0.45% 0.81% 0.93%Standard Error 0.42% 0.41% 0.49% 0.49% 0.33%Median 0.45% 1.61% 0.47% 1.28% 0.95%Mode #N/A #N/A #N/A #N/A #N/AStandard Deviation 4.40% 4.26% 5.09% 5.06% 3.48%Sample Variance 0.19% 0.18% 0.26% 0.26% 0.12%Coefficient of Variance 538.13% 341.30% 1121.76% 625.44% 373.65%Kurtosis -0.017962 0.24383 0.59143584 -0.0278 0.3585092Skewness 6.09% -23.61% -28.05% -40.71% -32.01%Range 22.31% 21.53% 27.31% 23.45% 18.20%Minimum -10.64% -9.48% -14.33% -11.65% -8.66%Maximum 11.67% 12.04% 12.98% 11.80% 9.54%Sum 89.18% 135.98% 49.42% 88.27% 101.50%Count 109 109 109 109 109
Mean Value: The mean value uses all the information available about theobservations. The mean value of different indices of the world indicates the expectedreturn from the investment. The expected return from Nasdaq index is 1.25% followedby Dow Jones (0.93%), BSE Sensex (0.82%), Nikkei (0.81%) and Hang Seng (0.45%).
Median Value: The median is important because the mean value can be affected byextremely large or small values(outliers).On the basis of median the expected returnfrom Nasdaq is (1.61%) followed by Nikkei(1.28%),Dow Jones(0.95%).
Range: The range is a generally straightforward measure of variability, but whenutilized with different estimates it gives incredibly valuable data. The range is thedifference between the largest and the smallest value in the data set. The largestvariability in the data set is observed in the Hang Sang index (27.31%) followed byNikkei (23.45%), BSE Sensex (22.31%), Nasdaq (21.53%) and Dow Jones (18.20%).
Sample Variance: Defined as the average of the squared deviation from the mean.Table no1 indicate that the average variation from the mean return is 0.26%2 in HangSang and Nikkei followed by BSE Sensex (0.19%2), Nasdaq (0.18%2) and Dow Jones(0.12%2).
Standard Deviation: The serious issue with the utilization of variance is the trouble ofinterpretation. This issue is moderated using the standard deviation. The standarddeviation is the square root of the variance. The standard deviation shows theriskiness or volatility of the investment. The study reveals that the highest volatility isobserved in the Hang Sang index (5.09%) followed by Nikkei (5.06%), BSE Sensex(4.40%), Nasdaq (4.26%) and Dow Jones (3.48%).
Coefficient of Variance: An immediate examination between two or more measure ofdispersion might be difficult. To make a meaningful comparison coefficient of variancemust be utilized to measure the risk (variability) per unit of expected return (mean).Thetable no.1 indicate that there is less dispersion(risk) per unit of monthly return for

40 Indian Journal of Accounting (IJA) Vol. 51 (1), June, 2019
Nasdaq(341.30%) followed by Dow Jones(373.65%),BSE Sensex(538.13%),Nikkei(625.44%) and Hang Sang(1121.76%).
Skewness: For a positively skewed distribution in the case of BSE Sensex (6.09%), themode is less than the median (0.45%), which is below the mean (0.82%) .The mean, isinfluenced by great positive exceptions which will in general draw the mean upward orprogressively positive. For a negatively skewed distribution in the case of followingindices i.e.Nasdaq (-23.61%), Hang Sang (-28.05%), Nikkei (-40.71%) and Dow Jones (-32.01%), the mean is below than the median, which is lesser than the mode. The meanis influenced by great negative exceptions which pull the mean downward.
Kurtosis: It is a measure with respect to the kurtosis of a normal distribution, which is3.Excess kurtosis (> than 0) show a distribution is leptokurtic( more peaked, fattails),whereas less kurtosis(< than 0) demonstrate a platykurtic distribution(lesspeaked, thin tails).Excess kurtosis values that surpass 1.0 in absolute value areviewed as substantial. Excess kurtosis in case of BSE Sensex (-3.01), Nasdaq (-2.75),Hang Sang (-2.40), Nikkei (-3.02) and Dow Jones(-2.64).
Hypothesis Testing BSE Sensex
Null Hypothesis (H0)There is no significance volatility in BSE Sensex return during the period of Jan 2010to Feb 2019 i.e. σ = 0.Alternative Hypothesis (H1)There is significance volatility in BSE Sensex return during the period of Jan 2010 toFeb 2019 i.e. σ > 0.
Interpretation of t-testIt is one tailed test and level of significance is 5%, the critical value of t is 1.65.Since
the calculated value of t is 1.95 which is more than the table value, we conclude that there is asignificant volatility in BSE Sensex return during the study period of Jan 2010 to Feb2019.Hence, null hypothesis is not accepted. Nasdaq
Null Hypothesis (H0)There is no significance volatility in Nasdaq return during the period of Jan 2010 toFeb 2019 i.e. σ = 0.Alternative Hypothesis (H1)There is significance volatility in Nasdaq return during the period of Jan 2010 to Feb2019 i.e. σ > 0.
Interpretation of t-testIt is one tailed test and level of significance is 5%, the critical value of t is 1.65.Since
the calculated value of t is 3.07 which are more than the table value, we conclude that there isa significant volatility in Nasdaq return during the study period of Jan 2010 to Feb 2019.Hence,null hypothesis is not accepted. Hang Sang
Null Hypothesis (H0)There is no significance volatility in Hang Sang return during the period of Jan 2010 toFeb 2019 i.e. σ = 0.Alternative Hypothesis (H1)There is significance volatility in Hang Sang return during the period of Jan 2010 toFeb 2019 i.e. σ > 0.

Dr. S.K. Khatik & Mr. Milind Patil: Stock Market Volatility in Major Indices of World: An Analytical..... 41
Interpretation of t-testIt is one tailed test and level of significance is 5%, the critical value of t is 1.65.Since
the calculated value of t is 0.92 which is less than the table value, we conclude that there is nota significant volatility in Hang Sang return during the study period of Jan 2010 to Feb2019.Hence, null hypothesis is accepted. Nikkei 225 index
Null Hypothesis (H0)There is no significance volatility in Nikkei 225 index return during the period of Jan2010 to Feb 2019 i.e. σ = 0.Alternative Hypothesis (H1)There is significance volatility in Nikkei 225 index return during the period of Jan 2010to Feb 2019 i.e. σ > 0.
Interpretation of t-testIt is one tailed test and level of significance is 5%, the critical value of t is 1.65.Since
the calculated value of t is 1.67 which is more than the table value, we conclude that there is asignificant volatility in Nikkei 225 index return during the study period of Jan 2010 to Feb2019.Hence, null hypothesis is not accepted. Dow Jones Industrial Average
Null Hypothesis (H0)There is no significance volatility in Nikkei 225 index return during the period of Jan2010 to Feb 2019 i.e. σ = 0.Alternative Hypothesis (H1)There is significance volatility in Nikkei 225 index return during the period of Jan 2010to Feb 2019 i.e. σ > 0.
Interpretation of t-testIt is one tailed test and level of significance is 5%, the critical value of t is 1.65.Since
the calculated value of t is 1.67 which is more than the table value, we conclude that there is asignificant volatility in Nikkei 225 index return during the study period of Jan 2010 to Feb2019.Hence, null hypothesis is not accepted.Findings
Following are the findings of the study: The mean return of BSE Sensex, hang Sang, Nikkei and Dow Jones are less as
compared to Nasdaq that means investment in Nasdaq index generates more profit toother indices of the world.
The volatility in Hang Sang index was less as compared to other indices of the worldwhich gave assurance to investor that their investment return will not fluctuate moreand they can earn good amount of money.
The Increase volatility in stock market will increase the expected risk premium andthereby affect the company’s cost of capital.
The negative value of skewness of Nasdaq, Hang Sang, Nikkei and Dow Jonessuggests that the probability of generating negative return is higher.
The US is the greatest economy in the world. When the Dow Jones fell, the effect wasseen in the overall major stock market indices of the world.

42 Indian Journal of Accounting (IJA) Vol. 51 (1), June, 2019
References Baillie, R.T., and R.P. DeGeneres, Stock Returns and Volatility, Journal of Financial
and Quantitative Analysis, 25, 203-215, 1990. Beer, Fransisca M., Yu-Tsui Lin and Chi-Shun Chu, Stock Returns and Volatility:
Evidence from the Chinese Markets, Journal of Emerging Markets, 11(3), 40-49, 2006. Chakravarty, S., A. Sarkar, and L. Wu, Information Asymmetry, Market Segmentation,
and the Pricing of Cross-listed Shares: Theory and Evidence from Chinese A and BShares, Federal Reserve Bank of New York, Research Paper, 9820, 1998.
Choudhry, T., Stock Market Volatility and the Crash of 1987: Evidence from SixEmerging Markets,Journal of International Money and Finance, 15, 969-981, 1996.
Chui, C. W., and C.Y. Kwok, Cross-autocorrelation between A Shares and B Shares inthe Chinese Stock Market, Journal of Financial Research, xxi(3), 333-353, 1998.
Darrat, A.F., and M. Zhong, On Testing the Random-walk Hypothesis: A Model-comparison Approach,The Financial Review, 35(3), 105-124, 2000.
De Santis, G., and S. Imrohoroglu, Stock Returns and Volatility in Emerging FinancialMarkets, Journal of International Money and Finance, 16(4), 561-579, 1997.
French, K.R., G.W. Schwert, and R.E. Stambaugh, Expected Stock Returns andVolatility, Journal of Financial Economics, 19, 3-29, 1987.
Fung H. G., W. Lee, and W.K. Leung, Segmentation of the A- and B-share ChineseEquity Markets,Journal of Financial Research, 23, 179-195, 2000.
Girard, Eric and Rita Biswas, Trading Volume and Market Volatility: Developed versusEmerging Stock Markets. Financial Review, 42(3), 429-459, 2007.
Ho, J., The Legal Environment and Business Enterprises in the People's Republic ofChina, Chinese business: Challenges in the 21st century (The Chinese UniversityPress, Hong Kong), 2000.
Jefferson, G.H., and T.G. Rawski, Enterprise Reform in Chinese Industry, Journal ofEconomic Perspectives, 8(2), 47-70, 1994.
Koutmos, G., Asymmetries in the Conditional Mean and the Conditional Variance:Evidence from Nine Stock Markets, Journal of Economics and Business, 50(2), 277-290, 1998.
Lee, G.O.M., L. Wang, L. and K. Mok, The Decline of State Owned Enterprises inChina: Extent and Causes, Department of Public and Social Administration 2, 1 41.Hong Kong: City University of Hong Kong. Retrieved 03, 08-10, 1999.
Leon, A., and J. Mora, Modeling Conditional Heteroskedasticity: Application to StockReturn Index IBEX35, Working paper (Instituto Valenciano de InvestigationesEconomicas, S.A.), 3-40, 1996.
Nelson, D.B., Conditional Hetersocedastocoty in Asset Returns: A New Approach,Econometrica, 59, 347-370, 1991.
Poon, S.H., and S.J. Taylor, Stock Returns and Volatility: An Empirical Study of theU.K. Stock Market,Journal of Banking and Finance, 16, 37-59, 1992.
Taylor, S., Modeling Financial Time Series. John Wiley and Sons, New York, 1986. Zakoian, J.M., Threshold Heteroskedastic Models, Journal of Economic Dynamics
Control, 18, 931-955,1994.

Indian Journal of Accounting (IJA) 43ISSN : 0972-1479 (Print) 2395-6127 (Online) Vol. 51 (1), June, 2019, pp. 43-50
AN ANALYSIS OF FINANCIAL PERFORMANCE OF PETROLEUMCOMPANIES BY USING ALTMAN Z - SCORE ANALYSIS
(WITH SPECIAL REFERENCE TO BHARAT PETROLEUM CORPORATION LTD,INDIAN OIL CORPORATION LTD & HINDUSTAN PETROLEUM CORPORATION LTD.)
C.Ramshesh
Dr. Sreenivas
ABSTRACT
Its need an hour to know the performance of Oil companies namely Indian OilCorporation, Hindustan Petroleum Corporation Limited, Bharat Petroleum because market ishaving highly volatility, through A predictive model created by Edward Altman Z score in the1960’s.This model consists of different financial ratios to ascertain the likelihood of bankruptcy.The present study intends to analyze the financial health of selected oil companies through theapplication of altman z score model. It is found that the financial health of the selectedcompanies under study is Bharat Petroleum Corporation is relatively better than Indian OilCorporation and Hindustan petroleum.
KEYWORDS: Z - Score Analysis, Financial Health, Bankruptcy._______________
IntroductionThe backbone of any organization is its financial soundness. It means how they are
procuring the funds and utilizing the same funds in a effective utilization. Therefore continuousmonitoring is required to take corrective measures to meet the short term and long termrequirements adequately.
Financial statements are the source of information to the investors based on which thefinancial planning and decision making would takes places. The financial statements consist ofprofit & loss account and balance sheet. The Profit & loss Account provides data aboutoperating activities of the business concern and it projects the profit & loss of the business,whereas balance sheet gives the information about the assets & liabilities of the business.
Through this source only we would assess the company’s strengths & weakness.Pivotal decisions would be taken by using the financial ratios measured from financialstatements. A single ratio or few ratios we could not take the financial decisions. It doesn’tserve our purpose.
Research Scholar, Acharya Nagarjuna University, Guntur, Andhra Pradesh, India. Professor, Tellakula Jalayya Polisetty Somasundaram College (T.J.P.S.), Guntur & Research
Supervisor, Acharya Nagarjuna University, Guntur, Andhra Pradesh, India.

44 Indian Journal of Accounting (IJA) Vol. 51 (1), June, 2019
Therefore, Altman Z score consisting of different financial ratios in one equation i.e
Z=1.2x1+1.4x2+3.3x3+0.6x4+0.99x5
X1= Working Capital/Total assetsX2= Retained Earnings/Total assetsX3= Earnings before interest and taxes/Total assetsX4= Market value of share/Total assetsX5= Sales/Total assetsVariable Used in Z Score Analysis
The following variables (accounting ratio) has taken as variables to combine them intosingle index i.e., Altman Z score analysis which measure the efficiency in envisaging thebankruptcy.X1: It measures the relationship between working capital to total assets (WC/TA).This ratio
measures of the net liquid assets of a business concern.X2: It measures the relationship between retained earnings/total assets. It indicates
profitability to the firm size.X3: It is proportion of earnings before interest and taxes total assets (EBIT/TA).It says that
how much firm has earned before interest and taxes out off total assets.X4: It measures the relationship of market value of equity to book value of total liabilities. It
gives the market’s view of the company relative to the total liabilities. It measures howmuch assets of a firm can decline in value before the liabilities exceed the assets andthe concern becomes insolvent.
X5: It shows the relationship of sales to total assets (SA/TA). The assets turnover ratio is astandard financial measure for illustrating the sales generating capacity of the assets.
Standard Z Score ParametersSituation Z score Value Zones Verdict
I Below 1.8 Bankruptcy Zone Failure is certainII 1.8 – 2.99 Healthy zone Uncertain to predictIII Above 2.99 Too Healthy zone Not to fall.
Objectives of the Study This research paper study attempts to assess the financial performance of selected
petroleum companies namely Indian oil corporation, Bharat Petroleum corporationlimited, Hindustan petroleum by using the Altman Z score analysis
To know the impact of individual ratio on Z index (Relative difference)

C.Ramshesh & Dr. Sreenivas: An Analysis of Financial Performance of Petroleum Companies...... 45
Scope of the StudyThe study is completely descriptive and analytical. The Z index for a period of six
years (2010-2011to 2016-17) has been calculated for 3 petroleum companies namely Bharatpetroleum, Indian Oil Corporation, Hindustan petroleum, were included in the study(seeappendix). Data has been gathered for 7 years (2010-11 to 2016-2017) from secondarysources such as annual reports of companies.Literature Review Edward, I, Altman (1968) “Financial ratios,Discriminant Analysis and prediction
corporate Bankruptcy”, Journal of Finance, Volume 9 PP 589-609. Dr.M.Selvam & S.vanitha & M.Babu in their paper predicted the financial health and
viability of India cements Ltd., They concluded that the cement company under thestudy was just on the range of financial collapse.
Chakraborty.P.K.(2006) Working capital management. A case study of Cadila HealthCare Limited.” Towards better working capital management. Murthy G.K. eds,Hyderabad India. The ICFAI University Press.
Pandey I.M. Financial Management Vikas Publication House. Eleventh Edition. Poston, K.W., Harmon, W.K., Gramlich, J.D. (1994), A test of financial ratios as
predictors of turnaround versus failure among financially distressed firms. Journal ofApplied Business Research, 10, pp 41-51.
Altman, E. (1968), Financial ratios, discriminate analysis and the prediction ofcorporate bankruptcy. The Journal of finance, 23(4), pp 598-608.
Table 1: Calculation of X1, X2, X3, X4, X5 & Z Values ofBharat Petroleum Corporation Limited.
Sources: Compiled data from company balance sheet.Figure 1: Z Values Graph of Bharat Petroleum Corporation Ltd.
0123456789
2010-11 2011-12 2012-13 2013-14 2014-15 2015-16 2016-17
MoreHealty
Healty
Bankruptcy
Variables
Years X1 X2 X3 X4 X5 Z values
2010-2011 0.75135 0.12234 0.10649 0.01542 6.83722 8.202412011-2012 0.34223 0.07623 0.14002 0.01233 5.12561 6.061212012-2013 0.32908 0.09152 0.18269 0.00929 5.39111 6.468662013-2014 0.22625 0.10364 0.22557 0.0067 5.98423 7.089372014-2015 0.02451 0.14903 0.26005 0.0137 6.12222 7.165422015-2016 0.02707 0.14506 0.26536 0.01759 4.4353 5.512742016-2017 -0.10095 0.031743 0.145995 1.15884 2.646777 3.720691

46 Indian Journal of Accounting (IJA) Vol. 51 (1), June, 2019
Interpretation X1= working capital÷ Total Assets: It has been observed that the working capital to
total assets of Bharat Petroleum Corporation Limited had drastic changes since 2010-11; 0.751355, for the next subsequent years are 0.34223, 0.32908, 0.22625, 0.02451,0.02707. And the next year is -0.10095 It means that in the year 2010-2011 thecompany has following conservative current policy for the next years it has switch overto aggressive current policy.
X2=Retained Earnings÷ Total Assets: It has been observed that retained earningsto total assets of Bharat Petroleum Corporation Limited is in the year 2010-11;0.122335 for the next 5 years are 0.076231; 0.091519; 0.1036; 0.149029; 0.1450650.031743. It means that from 0.122 falls down to 0.076 in the year 2011-12 relatively ithas increases to 0.091 in the year 2012-13 for the next years consistently it hasincreasing i.e 0.10364; 0.14903; slightly it has falls down last 2 years i.e 0.14506,0.031743 respectively.
There may be more chances are there to borrow the amount from outside if theretained earnings to total assets are decreases.
X3=Earnings Before Interest & Taxes÷Total Assets: It has been found that EBITto total assets of Bharat Petroleum Corporation Limited has been increasing since2010-11; 0.106492 for the next years are 0.14002, 0.18269, 0.22557, 0.26005,0.26536, 0.14599
It is quite apparent that the firm’s profits has been increasing since 2010-11 X4=Market Value Of Equity÷ Book Value of Total Liabilities: It has been found that
the Market Value Of Equity ÷ Total Assets of Bharat Petroleum Corporation Limited isgradually decreasing since 2010-11, 0.01542 and the next year ratios are as follows0.01233, 0.00929, 0.0067, 0.0137, 0.01759.After 2011-12 it has continuously fallsdown again it gets recovery in the year 2014-15 0.0137 2015-16 0.01759 1.15884respectively. The higher the value it is better ratio
X5=Sales ÷Total Assets: It has found that the sales to total assets of BharatPetroleum Corporation Limited gradually it is increasing except in the last year 2015-16.The ratios in the year 2010-11 is 6.83722 and the next years are as follows5.12561; 5.39111; 5.98423; 6.12222; 4.4353, 2.646777 respectively.
Table 2: Calculation of X1, X2, X3, X4, X5 and Z values of Hindustan Petroleum LimitedX1 X2 X3 X4 X5 Z VALUES
2010-2011 0.115008 0.01627 0.05319 0.00887 2.34478 2.662962011-2012 -0.08354 0.00811 0.04723 0.00619 2.64572 2.689952012-2013 -0.066 0.00757 0.04582 0.00513 2.70877 2.767382013-2014 0.0571 0.01443 0.05094 0.00386 2.99296 3.222182014-2015 0.05779 0.02568 0.07209 0.00936 3.21331 3.529992015-2016 0.00993 0.03486 0.09051 0.01485 2.80604 3.146292016-2017 -0.02345 0.025784 0.121795 0.02171 2.720855 3.116557
Sources: Compiled data from company balance sheets.

C.Ramshesh & Dr. Sreenivas: An Analysis of Financial Performance of Petroleum Companies...... 47
Figure 2: Z Values Graph of Hindustan Petroleum Limited
Interpretation X1=Working Capital ÷ Total Assets: It has been found that the working capital to
total assets of Hindustan Petroleum Limited is decreasing since 2010-11, in the year2010-2011 ratio is 0.115008, and the next subsequent years are -0.008113,-0.66,0.057098, 0.057794, 0.009929, 0.02345, The company is implementing aggressivecurrent policy.
X2=Retained Earnings ÷ Total Assets: It has been observed that the retainedearnings to total assets of Hindustan petroleum Limited are drastically decreasingsince 2010-2011 is 0.0163 and the next subsequent years are 0.008,0.007,0.014,0.02,0.03, 0.025784 respectively.
There are more chances are there if the retained earnings to total assets ratios aredecreasing year by year it means that they are borrowing the amount from outside .
X3= Earnings Before Interest & Taxes ÷Total Assets: It has been found that theEBIT/Total assets ratio of Hindustan Petroleum Limited is quite similar with minimumchanges. i.e, in the year 2010-11 is 0.05319, 0.04723, 0.04582, 0.05094, 0.07209,0.09051, 0.121795 i.e., 2016-17 respectively.
X4=Market Value of the Share÷ Book Value of total liabilities: It has beenobserved that the market value of the share/book value of total liabilities has beendecreasing from 2010-11 to 2013-14 again it has increase for the next consecutiveyears the values are 0.00887, 0.00619, 0.00513, 0.00386,0.00936,0.01485,0.02171respectively.
X5=Sales ÷Total assets: It has been observed that the sales to total assets ratiogradually increasing since 2010-11 i.e., 2.34478, 2.64572, 2.70877, 2.99296, 3.21331,2.80604, 2.720855 respectively, it means the effective utilization of assets for theproduction purposes.
Table 3: Calculation of X1, X2, X3, X4, X5 and Z Values of Indian Oil Corporation LimitedX1 X2 X3 X4 X5 Z Values
2010-2011 0.138213 0.027513 0.067754 0.003095 1.744114 2.1564932011-2012 0.005599 0.012137 0.081254 0.001908 1.898776 2.1727822012-2013 0.018594 0.014482 0.053827 0.00221 1.996008 2.1975912013-2014 -0.00294 0.018018 0.052545 0.001359 1.87474 2.05192014-2015 -0.00396 0.015215 0.044403 0.002204 1.990117 2.1346182015-2016 -0.03909 0.02789 0.07712 0.002586 1.547184 1.7798942016-2017 -0.0607 0.024628 0.114832 1.178472 1.718172 2.748655
Sources: Compiled data from company balance sheets.
0
1
2
3
4
5
6
2010-11 2011-12 2012-13 2013-14 2014-15 2015-16 2016-17
Healty
Bankruptcy Zone
More Healthy

48 Indian Journal of Accounting (IJA) Vol. 51 (1), June, 2019
Figure 3: Z Values Graph of Indian Oil Corporation Limited
Interpretations X1=Working Capital ÷Total Assets: It has been observed that the X1 ratio of Indian
Oil Corporation is decreasing. In the year 2010-2011 the ratio of X1 is 0.138213 andthe next subsequent years are 0.005599, 0.018594, 0.018594, -0.00294, -0.00396, -0.03909, -(0.067) respectively. The Company is maintaining aggressive current policy.
X2=Retained Earnings ÷Total Assets: It has been found that the ratio of X2 of IndianOil Corporation. In the year 2010-2011 the ratio is 0.0275 and the next subsequentyears are decreasing 0.01213, 0.014482, and thereby remaining years are increasing0.018018, 0.015215,0.02789,0.024628 respectively.
X3=Earnings Before Interest & Taxes ÷Total Assets: It has been found the EBIT÷Total assets of Indian Oil Corporation is increasing since 2010-2011 i.e., 0.06775,0.08125, 0.0538, 0.0525, 0.0444, 0.077, 0.1148 respectively.
X4=Market Value of Equity ÷Total book value of liabilities: It has observed that theratio of x4 in the year 2010-11 is 0.00309, and the next subsequent years are 0.0019,0.0022, 0.0013, 0.0022, 0.0025, 1.178 respectively.
X5=Sales ÷Total Assets: It has been found that the X5 ratio of Indian Oil Corporationis continuously increasing since i.e, 2010-2011 1.74114 and the next subsequentyears are 1.898776;1.996008;1.87474;1.990117;1.547184 1.71817 respectively itmeans the utilizing the assets very effectively.
Table 4: Impact of Individual Ratios of Bharath Petroleum Corporation Limited onZ Score by Using the Relative Difference
Year 2010-11 2011-2012 2012-2013 2013-2014 2014-2015 2015-2016 2016-2017X1=WC÷TA 0.7514 0.342 0.331 0.23 0.0245 0.0271 -0.10095RD OF X1 -0.657766 -0.671 -0.77375 -0.9755 -0.973 -1.101X2=RE÷TA 0.12234 0.076231 0.091519 0.103636 0.149029 0.145065 0.031743RD OF X2 -0.923769 -0.908481 -0.896364 -0.850971 -0.854935 -0.97383X3=EBIT÷TA 0.1065 0.14002 0.18289 0.225567 0.260047 0.265356 0.145995RD OF X3 -0.85999 -0.817314 0.774433 0.73995 -0.73464 -0.854013X4=MVE÷TA 0.01543 0.01232 0.009289 0.0067 0.01369 0.01759 1.158839RD OF X4 -0.98767 -0.990711 -0.9933 -0.98630 0.982409 0.158839X5=SALES÷TA 6.837218 5.12561 5.391109 5.98423 6.122221 4.43529 3.00225RD OF X5 -0.25147 0.05282 0.11002 0.02312 -0.275544 -0.32309
0
1
2
3
4
5
6
2010-11 2011-12 2012-13 2013-14 2014-15 2015-16 2016-17
Healthy Zone
Bankruptcy

C.Ramshesh & Dr. Sreenivas: An Analysis of Financial Performance of Petroleum Companies...... 49
Table 5: Impact of Individual Ratios of Hindustan Petroleum Corporation Limited onZ Score by Using the Relative Difference
Year 2010-11 2011-12 2012-13 2013-14 2014-15 2015-16 2016-17X1=WC÷TA 0.115008 -0.08354 -0.066 0.057098 0.009929 0.009929 -0.02345RD OF X1 -1.08354 -1.066 -0.942902 -0.942206 0.990071 -1.0234463X2=RE÷TA 0.016269 0.008113 0.007567 0.014433 0.02568 0.03486 0.025784083RD OF X2 -0.991887 -0.99243 -0.985567 -0.97432 -0.96514 -0.9742159X3=EBIT÷TA 0.053189 0.047231 0.045825 0.050941 0.07209 0.090508 0.121794721RD OF X3 -0.952769 -0.95418 -0.949059 -0.92791 -0.909492 -0.87820589X4=MVE÷TA 0.008873 0.006195 0.005134 0.003865 0.009356 0.014848 0.021709841RD OF X4 -0.993805 -0.99486 -0.996135 -0.990644 -0.985152 -0.9782959X5=SALES÷TA 2.343777 2.645721 2.708769 2.992963 3.213309 2.80604 2.720855359RD OF X5 1.645721 1.708769 1.992963 2.213309 1.80604 1.720855359
Table 6: Impact of Individual Ratios of Indian Oil Corporation Limited onZ Score by using the Relative Difference
Year 2010-2011 2011-2012 2012-2013 2013-2014 2014-2015 2015-2016 2016-2017X1=WC÷TA 0.138213 0.005599 0.018594 -0.00294 -0.00396 -0.03909 -0.0607RD OF X1 -0.9944 -0.9814 -1.003 -1.004 -1.04 -1.0607X2=RE÷TA 0.027513 0.012137 0.014482 0.018018 0.015215 0.02789 0.024628RD OF X2 -0.9888 -0.98552 -0.9828 -09859 -0.97211 -0.9753X3=EBIT÷TA 0.067754 0.081254 0.053827 0.052545 0.044403 0.07712 0.114832RD OF X3 -0.9187 -09461 -0.9474 -0.9555 -0.92288 -0.8852X4=MVE÷TA 0.003095 0.001908 0.00221 0.001359 0.002204 0.002586 1.178472RD OF X4 -0.9981 -0.9978 -0.9986 -0.9978 -0.9974 0.1784X5=SALES÷TA 1.744114 1.898776 1.996008 1.87474 1.990117 1.547184 1.718172RD OF X5 0.898776 0.996008 0.87474 0.990117 0.547184 0.718172
The above tables 4, 5, 6, represents about the relative difference concept in thisresearch paper. It has observed of 3 companies relative difference its very nearer to 0. But all5 ratios would give certain impact.Findings
Table 1 Bharat Petroleum Corporation limited is too healthy zone the z values of thiscompany are above 2.99. The company is quite prosperity during the period of study.(2010-2011 to 2016-17). It means that the managerial efficiency of the organization is extremelygood, except in the year of 2016-17 X1 ratio gets negative however the value of Z is above2.99 i.e 3.72
Table 2 It can be interrelated from the above table that the Z values are 2.66,2.68,2.76in the years 2010-11,2012-13 respectively and the next consequently years are3.22,3.52,3.14, 3.11 2013-14,2014-15,2015-16, 2016-17 respectively. But in the year 2011-12the x1 ratios are -0.083,-0.666 due to excess of current liabilities over current assets again inthe year 2016-17 x1ratio is -0.023 but difficult to predict during the period of 2010-11 to 2012-13 for the next consequent years the value of z is above 2.99
Table 3 Indian oil corporation limited shows that z values are relatively less than ruleof thumb practices i.e., 2.99 there may be many factors which would influences on the Zvalues to name a few liquidity risk, operational risk, market risk. Over all, it shows inefficiencyof the managerial positions.Conclusion
This study carried out research for 3 companies namely Indian Oil CorporationLimited, Bharat Petroleum Corporation Limited, Hindustan Petroleum Limited, The basicpurpose of this research paper is in order to examine the relationships between theindependent variables (Working Capital /Total Assets, Retained earnings/Total Assets,EBIT/Total Assets, Market value of equity/Total Liabilities, Sales/Total Assets and the

50 Indian Journal of Accounting (IJA) Vol. 51 (1), June, 2019
dependent variable Z score in determining a company’s Z values. Bharat petroleumCorporation limited is relatively good in z values than the Hindustan Petroleum & Indian OilCorporation Limited, Apart from this relative difference method has been implemented in allthe three companies.References Altman, E. (1968), financial ratios, discriminant analysis and the prediction of corporate
bankruptcy. The Journal of finance, 23(4), pp 598-608. Altman, E. (1993), corporate financial distress and bankruptcy. (3rd ed.). New York:
John Wiley & Sons, Inc. Altman, E., "Financial Ratios, Discriminate Analysis and the Prediction of Corporate
Bankruptcy," Journal of Finance, September 1968. Beaver, W.H (1966), Financial Ratios as predictors of failure. Journal of Accounting
Research, 4, pp 71-111. Chuvakhin, N. Gertmenian, L.(2003), Predicting bankruptcy in the WorldCom age.
Graziadio Business Report, 6(1), available at http://gbr.pepperdine,edu/031/printbankruptcy.html, accessed during May 2012.
Collins, R.A., & Green, R.D. (1982). Statistical methods for bankruptcy prediction.Journal OF Economics and business, 34, pp 349-354.
Corporate Financial Distress and Bankruptcy, 2nd ed., John Wiley & Sons, New York,1993.
Deakin, E. B., "A Discriminant Analysis of Predictors of Business Failure," Journal ofAccounting Research, March 1972.
Eidleman, G. (1995), Z-scores- a guide to failure prediction. The CPA Journal, 12(9),pp 52-53.
Lau, A.H. (1987), A five state financial distress prediction model. Journal of AccountingResearch, 25, pp 127-138.
Poston, K.W., Harmon, W.K., Gramlich, J.D. (1994), A test of financial ratios aspredictors of turnaround versus failure among financially distressed firms. Journal ofApplied Business Research, 10, pp 41-51.

Indian Journal of Accounting (IJA) 51ISSN : 0972-1479 (Print) 2395-6127 (Online) Vol. 51 (1), June, 2019, pp. 51-58
INVESTOR PERCEPTION ON THE USEFULNESS OFINTERIM FINANCIAL REPORTS IN INDIA: AN EMPIRICAL STUDY
Dr. Ramdhan Saini
Dr. Prakash Sharma
ABSTRACT
The main objective of financial reporting is to provide useful information to theinvestors for investment decisions making. Timely and reliable interim financial reporting playsan important role for stakeholders. This paper provides insight into the usefulness of interimfinancial reports and the perceptions of different type of Indian investors on the usefulness ofthese reports of listed Indian companies. The study uses the questionnaire survey method togauge the different type of investor’s perception on the use and usefulness of interim financialreports. The results demonstrate that investors perceive the items disclosed in the interimfinancial reports as important for their investment decision-making. The study found evidencethat investors regard interim financial report as the 2nd most important financial informationsource after the annual reports. The findings show that Indian investors relied on interimreports to predict the forthcoming annual financial results and to evaluate managementperformance; however there is a disagreement with regards to the main purposes of interimfinancial reports among the different classes of investors. The net profit, earnings per shareand turnover are the most important and useful disclosure items in the interim financial reports.The study concludes that the relative usefulness of interim financial reporting would depend onthe different type of Indian investors. Lastly, the findings may be useful to interim reportspreparers to perceive the importance of each disclosure item for the investors as well as toregulators in making regulations on interim financial reporting.
KEYWORDS: Interim Financial Reports, JEL Classification: M40, M41, M49._______________
IntroductionInterim financial reporting has become an important subject of financial reporting in
India since 1988 when the amendments in Clause 41 of the listing agreement introduced therequirement of publishing unaudited half-yearly results with effect from March 1988 andpublication of unaudited quarterly results with effect from June 1998 by companies listed onthe Stock Exchange. The main objectives of interim financial reporting are to provide financialinformation to investors for investment decisions making, to minimize the investment risk forinvestors and to improve accountability and corporate governance among companies. Thereliable and timely interim financial reporting enhances the ability of different stakeholders tounderstand corporate earnings, cash flows, liquidity and financial condition.
Associate Professor, Department of Accountancy and Business Statistics, Faculty of Commerce,Government College, Jaipur, Rajasthan, India.
Associate Professor, Department of Accountancy & Business Statistics, Faculty of Commerce,University of Rajasthan, Jaipur, Rajasthan, India.

52 Indian Journal of Accounting (IJA) Vol. 51 (1), June, 2019
In February 1998, the International Accounting Standards Board (IASB) issued anaccounting standard IAS 34 for the first time on the international arena on Interim FinancialReporting to be effective from 1st January 1999 to provide the principles for recognition andmeasurement in the interim financial statements, to prescribe the minimum content of aninterim financial report to enhance the interim financial disclosure. In India the Council of theInstitute of Chartered Accountants of India has issued an accounting standard (AS 25) onInterim Financial Reporting comes into effect from 1st April 2002.
It is clear that there is general agreement that there is a need to improve the extent ofdisclosure information in interim financial reports. The review of the literature reveals that notmuch ink has been split on to gauge the investor’s perception on use and usefulness of interimfinancial reporting. Most of survey based studies concentrated on annual financial reporting.This study focused on the examining the perceptions of Indian investors on the use andusefulness of interim financial reporting. It differs from most other studies because the views ofvarious types of investors were observed with respect to their perceptions of using interimfinancial reports.
Based on the foregoing discussion, this study attempt to investigate the perceptions ofIndian investors on the purpose and usefulness of interim reports and the usefulness of keyinformation items disclosed in the interim reports. Now-a-days, it is more significant because itwill highlight the important disclosure items that investors find most useful and this investigatescould help various stakeholders such as preparers, users and regulators of interim financialreporting and companies concentrate on information that is of value to investors. As this is oneof the first very few survey based studies that examine the purpose and usefulness of interimfinancial reporting perceived by Indian investors, it should make a significant contribution to thefield of financial accounting in the country and will act as a basis for further studies on interimfinancial reporting.Objectives of the Study
The main objectives of this study are: To gauge the perceptions of the various type of investors on the use and usefulness of
interim financial reports in India. To gauge the perception of the different type of investors on the importance of different
sources of financial information. To measure the importance and utility of key information items disclosed in the interim
financial reports. To provide insights to preparers, users, researchers and regulators of interim report on
interim financial disclosure in India.Hypotheses of the Study
In this study the following hypotheses were developed and are disclosed in their nullforms as follow: Investors perceive the interim financial reports useful and used as a basis for making
investment decisions about a company. Investors perceive the disclosure of financial information in the interim reports as
adequate and useful. There are no statistical significant differences among the different classes of investors
with regards to their perception on usefulness of interim financial reports There are no statistical significant differences among the different type of investors
with regards to their perception on the different sources of financial information.

Dr. Ramdhan Saini & Dr. Prakash Sharma: Investor Perception on the Usefulness of Interim Financial..... 53
There are no statistical significant differences in the perceptions of different types ofinvestors towards the relative importance and utility of items disclosed in interimfinancial reports.
Literature ReviewThe different scholars have conducted user surveys regarding the usefulness of interim
financial reporting in the past. I have used their survey-based studies to review in this part.Cerf (1961) observed that the interim report is one of the main sources of information.
The other main source of information includes the annual financial reports, direct collection ofinformation from management, and broker’s or investor’s studies on industries andcorporations. Similarly, Taylor (1965) also reached the same conclusion when he gave toppriority to the interim report while terming it to be a useful information source for financialanalysts for investment purposes in his questionnaire survey in the United States of America.Newell (1969) conducted a study and found that 81% persons who were involved in financialanalysis found the interim reports useful or very useful. Edwards et al. (1972) conductedinterviews with financial analysts and investment executives and officials of financialinstitutions. The financial analyst and investment executive found that interim reports are veryuseful and required to see the expansion of interim reports such as annual reports. Lee andTweedie (1975, 1981) observed that private shareholders and institutional investors gaveutmost importance to interim reports while making decisions regarding investment.
Lunt (1982) in his study on respondents such as preparers, auditors, users andregulators showed the negative reactions towards quarterly reporting. The respondents were ofopinion that quarterly reports were unreliable and cost too much. Day (1986) on the basis of hisstudy reached to the conclusion that the investors were interested in greater interim disclosuresto help them forecast annual earnings. The Institute of Chartered Accountants in Ireland’sFinancial Reporting Commission (1922) revealed the fact that some users were in favour of thequarterly publication of interim reports while others were interested in the publication of moreformal half-yearly reporting. AICPA (1994) revealed that users were interested in knowing moreinterim segment reporting, and also in an interim statement of cash flow. Hussey and Wolfe(1994) conducted interviews in the UK with individual investors and found that individualinvestors gave little importance to the interim reports. Ku NorIzah and Zuaini (1995) also foundthat financial analysts given third place to interim reports in investment decision making. The firsttwo were the annual financial reports and direct contacts with the corporate management. AL-Bogami (1996) found in his survey that the quarterly financial reports were used by most of theinvestors and helped them in making decisions but the contents of the interim reports were nothelpful enough as users required more disclosure. Bartlett and Chandler (1997) observed in theirsurvey in UK that 70% of the individual investors just read the interim reports but it could not beconcluded whether it was useful or not.
Abdul Rahman (1998) in his survey found that for the financial analysts, interimreports were the third major source of information while the annual reports were the sixth.Barker (1998) found that for financial analysts the interim reports along with the annual reportand direct contacts with companies were regarded as the most important source ofinformation. Fund managers gave priority to their meetings with senior company managementas compared to the interim reports.
Ku nor Izah and Chandler (2004) found the in Malaysia almost all companiespublished their reports near the deadlines. Ismail and Chandler (2005) observed that quarterlyreports were used and useful but not the most sought-after sources of information. MusaMagena et al. (2007) in their survey found that both financial analysts and fund managersregarding the perception on interim reports about profit or loss in connection to disclosed itemsalong with cash flow statement sections were of utmost importance. There were similarities in

54 Indian Journal of Accounting (IJA) Vol. 51 (1), June, 2019
the response of financial analysis and fund managers with regard to the relative importance ofitems in the profit and loss account, balance sheet, cash flow statements and accountingpolicies and notes. However, significant differences were also noticeable between two groupswith respect to information provided by the management. Md. Tofael Hossain Majumder et al.(2012) in their survey found that there was evidence regarding the fact that the interim financialreports are considered more useful than the annual reports. The investors also relied oninterim financial reports to estimate the forthcoming annual results. The most important itemsamong the items of disclosure in the quarterly financial reports were the earnings per shareand current year prospects. The study concluded that the usefulness of quarterly financialreporting would depend on the different type of investors.Methodology of the Study Research Technique
In this study a questionnaire survey method was used to obtain the perception ofdifferent types of investors on interim financial reports. Questions were designed to examineinvestors’ perception on use and usefulness of interim financial reports for investment decisionmaking about a company. Sample Selection
In developing a sample investors were classified into three groups as suggested byEdwards et al. (1972), viz., scanners, trackers, and sophisticates.
Scanners are those investors who have a general interest in a particularcompany, make a cursory review of the interim period activities and warrant areading of annual and interim reports for mental comparisons and evaluation.
Trackers are those investors who would generally maintain a formal record of thefinancial activities and operating results of companies. Tracking is done on aninterim basis and comparison between the forecast and actual results will be made.
Sophisticates normally conduct an in-depth analysis of the operation of the firm.Users in this group will normally conduct a continuous analysis that requiressubstantial familiarity with the industry. Generally, the analysis will be followed bya written report, a recommendation or a decision, later to be used by other users.Thus, sophisticates has a large influence on the decisions made by other users.
This classification is important because it gives an indication of how intensive theanalyses of interim reports are made by the users. Varying levels of analysis are anticipated toaffect their attitudes towards interim financial reporting and will help answer the question ofwhether there are significant differences among the different classes of investors with regardsto their perception on use and usefulness of interim financial reports. Data Collection
The study used primary data collected through questionnaire. The study measureinvestors perception based on a Likert scale of 1=strongly disagree, 2=disagree, 3=undecided,4=agree and 5=strongly agree. The investors were first asked whether they use the interimfinancial reports for making decisions about a company. Investors who use the interim reportswere asked to specify themselves either as scanners, trackers or sophisticates. A list of sixobjectives of interim financial reporting was presented in the questionnaire to examine theperception of Indian investors with regards to the use of interim financial reporting. Investorswere asked to specify the extent, to which they agree with each of the six objectives of interimfinancial reporting. The next question evaluates usefulness of interim financial reports toinvestors. In this regard, this study examines the perceptions of users on the importance andutility of interim financial reporting and the significance of seven other sources of financialinformation in making their decisions. Next, this study provides perceptions of users towards

Dr. Ramdhan Saini & Dr. Prakash Sharma: Investor Perception on the Usefulness of Interim Financial..... 55
the usefulness of each of the 17 key mandatory disclosure items in the interim financial reportsselected based on the Listing Requirements and review of the literature. Users were asked tostate their perceptions with regards to the utility of quarterly reporting using a Likert-scale. Themeans of the responses were calculated for different group of investors for each item. Themean scores act as a basis for comparison between the different group of investors and forranking the usefulness of each information item.
The questionnaire was mailed to 216 different types of investors. In total 102 (47.22%)were returned and of these, 90 were fully completed and usable questionnaires, representing41.67 per cent response rate. This response rate compares well with other similar studies.Analysis and Findings Profile of Investor Respondents
The Distribution of respondents according to different type of investor is given in table 1.Table 1: Distribution of Respondents According to Type of Investor
Type of Investor Frequency PercentScanners 25 27.78Trackers 35 38.89Sophisticated 30 33.33
Total 90 100
Of the 90 usable questionnaires completed by different types of active investors ofinterim financial reports, 25 (representing 27.78%) of them were scanners, 35 (38.89%)trackers and 30 (33.33%) sophisticates.Perception of Investors on the Purpose of Interim Financial Reporting
Table 2 shows the ranking for six purposes of interim financial reports according to thethree types of investors identified in the study. The purposes reflect how interim financialreports are used in making their investment decisions among investors.
Table 2: Uses of Interim Financial Reports According to Type of InvestorsS.
No. Purpose of Interim ReportingScanners
Mean(Rank)
TrackersMean
(Rank)SophisticatedMean (Rank)
OverallMean
(Rank)1 To estimate the forthcoming annual result 3.28 (2) 3.14 (3) 3.56 (2) 3.33 (1)2 To evaluate management performance 3.40 (1) 3.25 (2) 3.12 (4) 3.26 (2)3 To provide the feedback information
concerning financial performance forcomparison with earlier expectations’
3 (4) 3.50 (1) 3.24 (3) 3.25 (3)
4 To predict results for beyond current annualperiod 2.84 (5) 3 (4) 3.60 (1) 3.15 (4)
5 To ascertain turning points in earning trend orliquidity 3.11 (3) 2.95 (5) 3.05 (5) 3.04 (5)
6 To determine the appropriate discount andgrowth rates for use in evaluating securityprices
2.64 (6) 2.85 (6) 3 (6) 2.83 (6)
The results show that investors regard to estimate the forthcoming annual results asthe main purpose of interim financial reports followed by evaluation of managementperformance and provide feedback information concerning financial performance forcomparison with earlier expectations. The results also show that to forecast results for beyondcurrent annual period and to ascertain turning points in earning trend or liquidity are importantpurposes of interim financial report because the average scores are greater than or equal to 3.The least important purpose of interim financial reporting is perceived to be ‘to determine theappropriate discount and growth rates for use in evaluating security prices’.

56 Indian Journal of Accounting (IJA) Vol. 51 (1), June, 2019
The findings show that there is a disagreement among the different types ofinvestors with regards to the main purposes of interim financial reports. Scanners believethat the main objective of interim financial report is to evaluate management performance;According to Trackers the main objective of interim financial reports is to provide thefeedback information concerning financial performance for comparison with earlierexpectations. Sophisticates believe that the main objective of the report is to predict resultsfor beyond current annual period.Sources of Financial Information and their Importance
Table 3 presents the findings on the use of interim financial reports in comparison withother sources of financial information known to be useful to users in making their investmentdecisions.
Table 3: Perception of the Importance of Different Sources ofFinancial Information according to the Type of Investors
S.No. Sources of Information
ScannersMean(Rank)
TrackersMean(Rank)
SophisticatedMean (Rank)
OverallMean(Rank)
1 Annual report of companies 3.36 (2) 3.40 (1) 3.18 (3) 3.313 (1)2 Interim financial reports of
companies 3.39 (1) 3.25 (3) 2.95 (6) 3.197 (2)
3 Prospects of companies 3.30 (3) 3.12(4) 2.90 (7) 3.107 (3)4 Stock broker advice and report 3.25 (4) 2.80 (7) 3.05 (5) 3.033 (4)5 Corporate press release 2.40 (8) 3.28 (2) 3.14 (4) 2.94 (5)6 Visit to companies 2.52 (6) 3.01 (5) 3.28 (1) 2.937 (6)7 Communication with management 2.51 (7) 2.97 (6) 3.25 (2) 2.91 (7)8 Information available on company
webpage other than annual andinterim reports
2.95 (5) 3.12 (4) 2.52 (8) 2.863 (8)
The results revealed that interim financial reporting is useful as a source of financialinformation to the users with the overall mean score of 3.197 and it is the second mostimportant source of financial information. However, interim financial reporting is ranked as thefirst most important source of financial information by scanners, third by trackers and sixth bysophisticates. The mean scores revealed that the perceived usefulness of interim financialreporting would depend on how intensively an investor makes use of the interim reports. Asthe main users of interim financial reports (mean score of 3.39), scanners value interimfinancial reporting more than do the other users and it is useful to state that interim financialreports constitute the least important source of information to the sophisticates.
The findings show that users generally perceive annual reports to be more usefulsource of information than the interim financial reports. This appears to support the contentionthat interim financial reports are less useful than the annual reports because the former ismore susceptible to random fluctuations incorporates seasonal elements and is not audited(Givoly and Ronen 1981). The average scores greater than or equal to 3 reveals thatprospects of companies, stock broker advice and report are important source of information.The least overall important information source is communication with management andinformation available on company webpage other than annual and interim reports.Usefulness of Items of Disclosure in the Interim Financial Reports
Users were asked to rate the usefulness of 17 key items of disclosure in the interimfinancial reports to evaluate the usefulness of each item of disclosure. Table 4 presents theinvestors perception of the utility of items of disclosure of financial information in order to therelevance of each items.

Dr. Ramdhan Saini & Dr. Prakash Sharma: Investor Perception on the Usefulness of Interim Financial..... 57
Table 4: Overall Perception of the Usefulness of Items of Disclosure
S.No. Sources of Information
ScannersMean(Rank)
TrackersMean(Rank)
SophisticatedMean (Rank)
OverallMean(Rank)
1 Net profit 3.95(1) 3.85 (1) 3.56(1) 3.79 (1)2 Turnover 3.71 (2) 3.80 (2) 3.21(7) 3.57 (2)3 Earnings per share 3.35 (5) 3.75 (3) 3.50(2) 3.53 (3)4 Net profit from ordinary activities 3.30 (6) 3.50(4) 3.42(3) 3.41 (4)5 Issuances and repayment of
debt and equity items 3.11 (9) 3.42(6) 3.32(5) 3.28 (5)
6 Interest expenses 3.25 (7) 3.50 (4) 3.05(11) 3.27 (6)7 Amount and nature of
extraordinary items 3.20 (8) 3.25 (7) 3.08 (10) 3.18 (7)
8 Review of performance 3.42 (4) 2.80 (13) 3.10 (9) 3.11 (8)9 Current year prospects 3.50 (3) 2.65 (16) 3 (12) 3.05 (9)10 Segmental information 3.05 (11) 2.90 (11) 3.15 (8) 3.03 (10)11 Review of performance 2.71 (16) 2.95 (10) 3.40 (4) 3.02 (11)12 Breakdown of borrowings 2.95 (13) 3.10 (8) 3(12) 3.017 (12)13 Cash 2.69 (17) 3 (9) 3.25(6) 2.98 (13)14 Amount and breakdown of long
term liabilities 3.10 (10) 2.75 (14) 2.85 (16) 2.90 (14)
15 Amount and breakdown ofcurrent assets 3 (12) 2.85 (12) 2.82 (17) 2.89 (15)
16 Profit before tax, minorityinterest and extraordinary items 2.90 (14) 2.71(15) 2.95 (14) 2.85 (16)
17 Amount and breakdown ofcurrent liabilities 2.85 (15) 2.65 (16) 2.90(15) 2.80 (17)
The table shows that there seems to be little variation between the mean score of oneitem to the next item in the rank. In view of the utility of the disclosure items according to theiroverall mean scores net profit is the most useful item of financial disclosure in the interimfinancial reports followed by turnover, earnings per share, net profit from ordinary activities andissuances and repayment of debt and equity items. The least useful items of interim financialreports is amount of current liabilities followed by, profit before tax, minority interest andextraordinary items, amount of current assets, amount of long term liabilities and cash.
The findings show that there is a consensus among the different type of investors withregards to their perception of the most useful items while there is a disagreement with regardsto the least useful items of interim financial reports. All the three types of investors perceive netprofit as the most useful disclosure item in the interim financial reports. The least importantitems of disclosure to the scanners is cash while the trackers view current year prospects andamount of current liabilities as least useful; the sophisticates consider amount of current assetsto be least consequential item in the interim financial reports.Conclusion
It may be concluded from this study that information items disclosed in interim financialreports are useful and used by investors for their investment decision making process, buttheir usefulness based on their respective needs varies among different types of investors -scanners, trackers, and sophisticates. On the whole, investors regard interim financial reportas the 2nd most important source of financial information. Annual reports appear to be moreuseful than interim financial report despite the fact that the latter is timelier. One explanation isthat interim financial reports are not audited thus perceived to be less reliable and susceptibleto income manipulation. The study reveals that pre-eminently; investors rely on interimfinancial reports to estimate the forthcoming annual results. The study provides evidence that

58 Indian Journal of Accounting (IJA) Vol. 51 (1), June, 2019
net profit is the most important items to investors of all the items of disclosure in the interimfinancial reports. The results also indicate that there is a little consensus among the threegroups of investors with regards to their perception of the relative usefulness of disclosureitems of interim financial reports.
Lastly, the findings of this paper would also help preparers of interim reports tounderstand the importance and usefulness of each item of the financial information to theinvestors and to prepare interim reports according to the needs of the users. The study willopen up avenues for further studies on interim financial reporting not only in India, but also inother countries where still lacks of empirical research in this area of study. This study willenhance the awareness of the various stakeholders towards interim financial reporting.References Brown, L.D. and Rozeff, M.S. (1979). The Predictive Value of Interim Reports for
Improving Forecasts of Future Quarterly Earnings, The Accounting Review, Vol. 54 (3), pp.585-591.
Deloitte (2009). Interim financial reporting: A guide to IAS 34, March. Edwards, J.W., Dominick, G.F. and Hedges, T.V. (1972). Interim Financial Reporting. New
York: National Association of Accountants Research Study May. IASC (1996). Interim financial reporting: An issues paper prepared by the IASC staff,
International Accounting Standards Committee IASC (1998). IAS 34: Interim Financial Reporting, International Accounting Standards
Committee. Ismail, K.N.I.K and Chandler, R. (2005). Perceptions of professional investors in Malaysia on
the usefulness of quarterly financial reports', Journal of Management , Vol.24, pp.105-124 Ku Nor Izah, K.I. & Chandler, R. (2004). The timeliness of quarterly financial reports of
companies in Malaysia, Asian Review of Accounting 12(1): 1-18. Lambert, M.R., Cartwright, D.H., O’Connor, M.H. & Walsh, M. (1991). Interim Financial
Reporting: A Continuous Process. Toronto: The Canadian Institute of CharteredAccountants.
Lunt, M.H.C. (1982). The Role of Interim Accounts and Preliminary Profit Announcements inFinancial Reporting. London: The Institute of Chartered Accountants in England and Wales.
Manabendra Sekhar Bhadra (2004). Interim Financial Reporting: A survey of Indianpractice, The Chartered Accountant, October.
Musa Magena, Russell Kinman, David Citron, (2007). Investment analysts’ perception ofdisclosure in UK interim financial reports, Journal of Applied Accounting Research, Vol. 8Issue: 3, pp.146 - 185
Newell, G.E. (1969). Is Quarterly Financial Data Adequate for Investment Decision-Making? Financial Analysts Journal, November-December, pp. 37-43.
Nickerson, C.A., Pointer, L.G. & Strawser, R.H. (1975). Attitudes of Financial Executivestoward interim financial statements. The CPA Journal 45(3): 21-24.
Nieuwoudt, M.J. (1998). Interim Financial Reporting: Compliance with Local StatutoryRequirements, Local Regulatory Requirements and Local and International AccountingStandards, Meditari: Accountancy Research, University of Pretoria, Vol. 6, pp. 219-240
Taylor, R. G. (1965). A look at published interim reports. Accounting Review, 40(1) 89-96. Tofael Hossain Majumder, Mohammad Morshedur Rahman, Mohammed Mizanur Rahman
(2012). Perceptions of Bangladeshi Investors on the Usefulness of Interim FinancialReports, School of Doctoral Studies (European Union) Journal.

Indian Journal of Accounting (IJA) 59ISSN : 0972-1479 (Print) 2395-6127 (Online) Vol. 51 (1), June, 2019, pp. 59-62
ROBOT HUMAN INTERACTION: ROLE OFARTIFICIAL INTELLIGENCE IN ACCOUNTING AND AUDITING
Dr. Om Prakash Gusai
ABSTRACT
‘Artificial intelligence is growing up fast, as are robots whose facial expressions canelicit empathy and make your mirror neurons quiver.’
– Diane Ackerman.Artificial intelligence is proving to be of great help to human kind in many fields.
Coming to Accounting and Auditing it serves many purposes and increase accuracy andprecisions of the final output. It can complement Human efforts in these fields, helpdisentangle ocean of Data’s and help them focus on more relevant issues like problem solving,planning. It has made such a complex work easy and feasible in lesser time. The aim of thisstudy is to examine the effect of artificial intelligence on the performance of accounting andauditing operations.
KEYWORDS: Artificial Intelligence, Accounting, Auditing, Machine Learning._______________
IntroductionIn Today’s Transforming world, Digitalisation makes the use of technology more
fruitful. The idea of 4th Industrial Revolution is under constant scrutiny and discussions. Itprepares platform where businesses can be fully digitalised, make use of robotics and use ofArtificial intelligence in accounting and auditing. Audit firms have to assimilative Artificiallearning for providing measures of risk aversion and cost savings to their clients. This newevolution can be called as AI facilitated audit. This has changed the style of accounting frompaper work into computerised format. To put forward simply, AI has made processing ofmammoth size data easier and faster. It definitely beats human capacity in this case. Itreduces efforts made in accounting works like review of journal entries, readings of contracts,making legality of financial accounts in a given manner. It also provides a mechanism forcomprehend ledgers; recognise wrong statements and any risk related reports. The‘Association of Charted Certified Accountant’ shows how machine learning techniques havechallenges the progress report of deskilling of accountant operations.Motive of the Study
To study the importance of artificial learning in accounting and auditing areas andmeasure the decree of forthcomings regarding artificial intelligence in accounting.Research Methodology Type of Research: Descriptive/Expressive Research Type of Data Source used: Secondary Data/Data source.
Senior Assistant Professor, Department of Commerce, Motilal Nehru College, University of Delhi, Delhi,India.

60 Indian Journal of Accounting (IJA) Vol. 51 (1), June, 2019
The data has been extracted from various sources like research articles, publications,accounting websites, Articles, essay from Newspapers, Magazines and Journals from thevarious web-sites which deals directly or indirectly with Artificial intelligence. Descriptiveresearch was chosen for developing a better understanding in profundity.Limitation of the Study
The study relies on published data and information. No primary data is being collected.Secondary data may be lacking in accuracy, or they may not be completely current ordependable.Research Questions
The research questions are as follows: How accounting functions and firm’s performances can be measured through AI? How the auditor who lacks in AI accomplishments, skill and detraining the data, adept
in AI methods and techniques.Artificial Intelligence
“Nils J. Nilsson separates AI into its components: Artificial (machine, as opposed tohuman) + intelligence. In order to gauge the intelligence of an entity, Nilsson falls back on theTuring Test. Moreover, he believes that with increased complexity of the machine comesincreased intelligence”.
The word “Artificial Intelligence” was coined by John McCarthy. It is an experimentalpart of computer science where it expels the diverse use of machines. There are differentactivities that computers can perform using AI techniques can be recognition of speech,attainments in auditing, structural planning and judicious tasks.The 4th Industrial Revolution
At the age of 1950s the 1st project regarding AI was performed and made efforts to findthe equality between the capacity and intelligence of robots and humans. From the past 60years the advancements in machine learning comprehend the exclusive use at large but notfully reinstate the actual refinement of Human judgments’. In his book, “The Fourth IndustrialRevolution,” founder and executive chairman of the World Economic Forum, Klaus Schwab,states that “Data is becoming as valuable as oil and metal”. The book references a survey thatfinds that one of the upcoming technological shifts will occur when 30% of corporate audits willbe conducted by AI, which 75% of respondents expect to happen by the year 2025.Major Impacts of AI in Accounting and Auditing Tasks Accounting Tasks which AI Performs
As AI gives a platform for accounting firms to explore and grasp the latest technologydriven aspects. Some of the useful accounting tasks AI performs are listed below:
It helps companies by obtaining, consolidating and merging data from differentand numerous sources. This saves their time and helps them to plan their goalseffectively.
AI helps in searching and accessing digital files easily. Now this increases theprecisions of the auditing done as a firm’s financial transactions can be lookedupon easily.
It can review receipts, expenses and identify if there is any breach of accountingpolicies and procedures.
It helps resolve queries of the consumers and keep track their account balance,pending bills etc.

Dr. Om Prakash Gusai: Robot Human Interaction: Role of Artificial Intelligence in Accounting and...... 61
AI Based AuditingInterrogating the Auditing functions through AI can decreases the mammoth size of
work from both client and company sides. In auditing the analysis of ledger or financial reportsor any manual efforts that can be minimize by AI and auditors are able to provide a bettercontext than before. Auditor can gather the useful data with machine learning for identifyingthe repercussions and praiseworthy aspects related accounting terms and risk solving factors.Role of AI in Accounting Area
To put efforts regarding the betterment of accounting, accountants and stakeholdersshould apply their technical knowledge and must have information about financial and nonfinancial transactions in best quality. AI interprets the role of accountants as to check thefinancial position of a company and helps to make decision in precise way. For example givingdatabase in cost effective manner, producing new techniques for analysis and saves time sothat focus can be shifted from manual accounting tasks to decision making, buildingrelationships and tackle problem.Public Accounting Firms - Investing Large Amounts in Machine Learning
“Jon Raphael”, the chief innovation officer at Deloitte Touche Tohmatsu Limited(Deloitte), states that, with the effective implementation of cognitive technologies, the auditprocess will become ‘‘smarter, more insightful, and more efficient. This is the future of the auditprofession, and the users of financial statements deserve it’’ (Raphael 2015).
Deloitte is collaborating with Kira Systems Inc., also put forward the importance of AIin the field of accounting and under this contract it creates cognitive models for extracting theinformation and would be use for better analysis and helps auditors’ review documents easily.
DeNovo AI techniques are used by price water house coopers for evaluation the futureuse of financial technology for helping analyst and clients. (MIT Technology review 2016).Experts’ Reviews
Li Deng, chief AI officer, Citadel: “There are a few factors that really propelled AI to thiscurrent state-what many people call “the third wave.” The first wave died because people wereprobably too naive. They overestimated the future. And at that time, of course, even into thesecond wave, the computing power wasn’t there, and there wasn’t even the concept of bigdata. So when AI evolved, maybe 20 years ago, into something called machine learning,where data became the key to AI that was a big advancement-people understood theimportance of data”.
Rajat Monga, engineering director, Tensor Flow, Google: “AI is going to be part ofnearly every application we have around us. It’s going to be part and parcel of everything wedo, just like the Internet has changed things”.Impact upon Workforce
In 2015, University of Oxford research shows that AI replaces the role of accountantsas it was found a 95 percent change of losing jobs related to accounting as machines plays asuperior role behind these tasks. This report also found that some jobs are eliminated butothers are created because of progression of technology. As a result, this is not surprising formaking concern regarding automation in auditing as it creates productivity and driving overallcost down. (Pacific Standard 2015).Conclusion
Artificial Intelligence is in a hot spot these days. Countries are taking it seriously and ofcourse for the right reasons. AI paves way for a better and conducive environment in the fieldof accounting and auditing. Development in the field of AI can definitely be a great help tohuman efforts. Adoption of AI should be embraced and efforts to increase its potential can dowonders in such field workload is huge and include ocean of data.

62 Indian Journal of Accounting (IJA) Vol. 51 (1), June, 2019
References Deloitte. 2016. Deloitte Forms Alliance with Kira Systems to Drive the Adoption of
Artificial Intelligence in the Workplace. Available at:https://www2.deloitte.com/us/en/pages/about-deloitte/articles/press-releases/deloitte-forms-alliance-with-kira-systems-to-drive-theadoption-of-artificial-intelligence-in-the-workplace.html
Deloitte. AI and you: Perceptions of Artificial Intelligence from the EMEA financialservices industry. Efma; 2017. (Retrieved on 19/09/2017)
Economist, The. 2016b. Automation and Anxiety: Will Smarter Machines Cause MassUnemployment? Available at: http://www. economist.com/news/special-report/21700758-will-smarter-machines-cause-mass-unemployment-automation-and-anxiety
Elaine R. Overview of AI and its Application Area; 2000. (Retrieved on 20/09/2017)Available: http://members.90n.at/frankstein/ frankeinstein-novelhtm
Green man C. Exploring the impact of artificial intelligence on the accountingprofession. Journal of Research in Business, Economics and Management (JRBEM).2017;8(3):1451-1454.
Griffin O. How artificial intelligence will impact accounting. Economia; 2016. MIT Technology Review. 2016. AI Drives Better Business Decisions. Available at:
https://www.technologyreview.com/s/601732/aidrives-better-business-decisions/ Nilsson, N. J. (1998). Artificial intelligence: a new synthesis. Elsevier. Ibid. 5. Pacific Standard. 2015. The Future of Work: Automation’s Effect on Jobs — This Time
Is Different. Available at: https://psmag.com/thefuture-of-work-automation-s-effect-on-jobs-this-time-is-different-581a5d8810c1#.7aj03dtbg
Ref Raphael, J. 2015. How Artificial Intelligence Can Boost Audit Quality. Available at:http://ww2.cfo.com/auditing/2015/06/artificialintelligence-can-boost-audit-quality/
Yadav A, Gupta V, Sahu H, Shrimal S. Artificial intelligence – new era. InternationalJournal of New Technology and Research. 2017;3(3):30-33
https://aaapubs.org/doi/pdf/10.2308/jeta-10511 https://accountancy.smu.edu.sg/news/2018/apr/11/viewpoint-future-audit-ai https://www.acecloudhosting.com/blog/artificial-intelligence-impact-accounting/ https://www.forbes.com/sites/bernardmarr/2017/07/25/28-best-quotes-about-artificial-
intelligence/#3a11446b4a6f https://www.forbes.com/sites/insights-kpmg/2018/10/19/artificial-intelligence-real-
breakthroughs-the-practice-and-promise-of-ai-in-auditing/ https://www.icaew.com/media/corporate/files/technical/informationtechnology/technolo
gy/artificial-intelligence-report.ashx?la=en https://www.mckinsey.com/business-functions/mckinsey-analytics/our-insights/ask-the-
ai-experts-what-are-the-applications-of-ai https://www.techopedia.com/definition/190/artificial-intelligence-ai.

Indian Journal of Accounting (IJA) 63ISSN : 0972-1479 (Print) 2395-6127 (Online) Vol. 51 (1), June, 2019, pp. 63-72
IMPACT OF STOCK SPLIT ON SHORT-TERM LIQUIDITY OF STOCKSIN EX-SPLIT PERIOD: EVIDENCE FROM INDIAN STOCK MARKET
Dr. Pradipta Banerjee
ABSTRACT
In contrast to theoretical explanation that no direct consequence either from the viewpoint of the splitting firm or its shareholders, stock markets have found to react optimisticallyworldwide on announcement and execution of splits. In order to justify such observed marketreaction various explanations have emerged over time in the literature of finance among whichthe major and widely-accepted explanations are the information signaling and trading range orliquidity hypothesis. The advocates of liquidity hypothesis states that firms splits their stocks torealign their stock prices which have increased substantially to a lower and more favourabletrading range to make the stocks attractive and affordable to small and wealth-constrainedinvestors and hence to enhance liquidity of their stocks. But, as empirical evidence is mixed onliquidity effect of split with documented improvement as well as reduction or no change in post-split liquidity both in the context of stock markets of different countries abroad and in thecontext of Indian stock market, present study has made a modest attempt to examine thevalidity of liquidity hypotheses of stock split in Indian stock market by analysing changes intrading volume and number of trades following ex-split day using daily data for one monthbefore and after the split for a sample of splits occurred during more than seventeen years inIndian stock market. Empirical findings of the study demonstrate that split leads toimprovements in post-split liquidity in the month following split lending support to the most ofthe earlier studies conducted in Indian context and indirectly imply that splits make the stocksmore attractive to small and retail investors in the market.
KEYWORDS: Stock Split, Liquidity Hypothesis, Trading Volume, Split Ex-day._______________
IntroductionTheoretically stock split is not associated with any direct consequence either from the
view point of the splitting firm or from the view point of the shareholders of the splitting firm. Asplit though increases the number of outstanding shares and decreases the par value of eachshare proportionately with the split factor; total share capital and capital structure of the firm,value of share-holdings of shareholders and their proportionate ownership in the firm remainunaltered after the split. Still, it has been observed and documented in a large number ofstudies that stock markets react optimistically worldwide on and surrounding announcementand execution of splits. In order to justify such observed market reaction various explanationshave emerged over time in the literature of finance among which the major and widely-
Associate Professor of Commerce, Sidho Kanho Birsha University, Purulia, West Bengal, India.

64 Indian Journal of Accounting (IJA) Vol. 51 (1), June, 2019
accepted explanations are the information signaling [proposed by Fama, Fisher, Jensen andRoll (1969)] and trading range or liquidity hypothesis [proposed by Copeland (1979)] alongwith others like, change in underlying characteristics of return distribution (i.e., return volatility),change in ownership composition, attention getting device, optimal tick-size, bid-ask spreadand transaction cost, tax-option value of stock, etc.
The signalling hypothesis states that by splitting their stocks, firms try to conveyfavourable private information about stability of past performances and superior futureperformances of the firms. On the other hand, advocates of liquidity hypothesis of stock splitbelieve that firms often undertake splits to realign their stock prices which have increasedsubstantially and significantly to a lower and more favourable trading range that arecomparable with other similar firms in the industry and market averages to make the stocksattractive and affordable to small and wealth-constrained investors, which in turn helps toincrease the number of investors, trading volume and hence liquidity of the stock. Again,signalling and liquidity hypotheses are interrelated. If the firms posses any unfavourableinformation about their firms, they are most likely to not going for split even when the stockprices are too high because they anticipate that the stock prices will return to the normal rangeanyway when the unfavourable information is disseminated in the market. Similarly, if the firmsdo not have any explicit desire to signal and undertake split only to bring down the stock pricesto a lower and better trading range, the rational investors are most likely to interpret the split asthe signalling of favourable information about the firms.
As, in case of our country, stock split has a history of mere two decades where it wasintroduced in the year 1999, the number of existing studies on the split in Indian context is alsonot plenty and most of such studies have examined market reaction associated withannouncement or/and execution of stock splits. Again empirical evidence on liquidity effect ofsplit is mixed with some studies showing improvement in post-split liquidity while some othersshowing reduction or no change in liquidity following split.Moreover, impact of any price-sensitive corporate event may not be identical in different markets and different time period.For all these, in the present study, a modest attempt has been made to examine the validity ofliquidity hypotheses of stock split in Indian stock market by analysing changes in liquidityfollowing ex-split day using daily data for one month before and after the split.Review of Existing Literature on Liquidity Effect of Stock Split
Empirical studies examining liquidity effect of stock split conducted in the context ofvarious stock markets abroad as well as in context of Indian stock market have documentedmixed evidence. The majority of the studies on liquidity effect of stock split undertaken abroadhave observed that liquidity of stocks has improved in post-split period [Ohlson and Penman(1985), Amihud and Mendelson (1986), Dravid (1987), Lakonishok and Lev (1987), Lamoureuxand Poon (1987), Conroy et al. (1990), McNichols and Dravid (1990), Dubofsky (1991),Maloney and Mulherin (1992), Ikenberry et al. (1996), Muscarella and Vetsuypens (1996),Angel (1997), Mukherji et al. (1997), Desai et al. (1998), Schultz (2000), Dennis and Strickland(2003), Reboredo (2003) and many others] while some others have documented adverse orno effect of split on liquidity of stocks [Copeland (1979), Murray (1985), Defeo and Jain (1989),Dravid (1989), Conroy et al. (1990), Gray (1990), Arnold and Lipson (1997), Gray et al. (1999),Lipson (1999), Easley et al. (2001), Goyenko et al. (2005), etc.]. The empirical evidence onliquidity effect of stock split is also mixed for our country with majority of studies documentingimprovement of liquidity in post-split period [Lukose PJ and Rao (2002), Dash and Gouda(2007), Gupta and Gupta (2007), Mishra (2007), Pavabutr and Sirodom (2008),Joshipura(2009), Alex et al. (2011), Ray (2011), Chakraborty(2012), Pooja (2013), Thirunellai (2014),etc.] while some others reporting reduction or no change in liquidity following splits [Choudharyand Chaudhary (2009), Joshipura (2013), Rajesh (2013), etc.].

Dr. Pradipta Banerjee: Impact of Stock Split on Short-Term Liquidity of Stocks in Ex-Split Period:...... 65
Trading range or liquidity hypothesis is also supported by survey-based studies bothfrom India [Mehta et al. (2011)] and abroad [Dolley (1933), Baker and Gallagher (1980), Bakerand Powell (1993), Baker et al. (1995), Schultz (1997), etc.]. The survey evidences onmanagers’ motives behind splits reveal that a vast majority of respondents regard stock split asa useful tool to lower stock prices, broaden the ownership base and improve marketability andliquidity of stocks by making the stocks attractive to small and retail investors.Objectives of the Study
The present study has been undertaken to investigate empirically the impact of stocksplit on short-term liquidity of stock. More specifically, the objectives of the present study are: To examine changes in daily trading volume of sample stocks in the post-split period;
and To examine changes in daily number of trades of sample stocks in the post-split
period.Data Base and Methodology
Initially, all the 1106 splits executed by BSE listed companies during the periodfrom introduction of split in Indian stock market (i.e., 14 th June, 1999) to 31st March, 2017have been identified from ‘Capitaline’ and ‘Prowess’ database packages. Thereafter, thefirms which announced any other price-sensitive corporate events, like, earningsannouncement, dividend announcement, announcement of bonus issue, right issue, buyback of shares, merger, acquisition, etc. within one month before and one month after theex-split date, for which daily data on trading volume and number of trades for one monthbefore and after split were not available and for which ex-split date could not be identifiedhave been excluded from the initially identified firms which reduced the number of split to572 representing 26 broad industries of the economy. A sample of 30 splits (as it isconsidered as a large sample in statistical sense and its sampling distribution of samplemean approximately follows normal distribution [Stutely (2003); Saunders et al., (2011)])has been chosen thereafter from 572 splits by selecting one split from each industry andremaining 4 from the rest using simple random sampling without replacement method ofsampling to make the sample representative of all the industries of the economy. All therequired data for the sample firms like, ex-split date (the date on and from which splitbecomes effective and spitted stock is traded on split-adjusted reduced prices), daily dataon trading volume and number of trades have been collected primarily from ‘Capitaline’and ‘Prowess’ database packages.
Liquidity means the ease of converting any asset into cash at minimal loss. There area number of parameters for measuring liquidity of stocks like, number of shareholders, tradingvolume, number of trades, average volume per trade, bid-ask spread, time required totransact, depth, breadth and resiliency, transaction cost, etc. among which the most importantdeterminant of liquidity of stocks in the secondary market is the number of shareholders.Again, a number of empirical studies [Demsetz (1968), Copeland (1979), Lamoureux andPoon (1987), etc.] have documented that the number of transactions/trades per unit of timeand traded volume (i.e., the number of shares transacted) are positively correlated with thenumber of shareholders. Besides, a large number of empirical studies conducted in the contextof stock markets abroad [Copeland (1979), Lakonishok and Lev (1987), Desai et al. (1998), Liu(2000), Elfakhani and Lung (2003), Elliott and Warr (2003), Jog and Zhu (2004), Leung et al.(2005), etc. to name a few] as well as almost all the studies in India have used trading volumeor/and number of trades or their variants like, average volume per trade, market volume ratio,relative volume, etc. as the measures of liquidity.

66 Indian Journal of Accounting (IJA) Vol. 51 (1), June, 2019
For these reasons, two measures of liquidity namely, trading volume and number oftrades have been considered for the study to analyse liquidity effect of stock split. In order toexamine the short-term liquidity effect of split, the behavior of trading volumes and number oftrades for 30 trading days following the split execution date has been compared with those for30 days preceding the split execution date. For that purpose, trading volume of the first tradingday (day +1) in the post-split period (i.e., on execution day) has been matched with tradingvolume of the last day in the pre-split period (day -1), trading volume of day immediatelyfollowing the day +1 (day +2) has been matched with that of the day immediately precedingthe day -1 (day-2) and trading volumes of all other days in the post-split period until day +30have been matched with those of pre-split period in similar manner. For the measure numberof trades, the similar procedures have been followed. Thus, for the purpose of comparison, 30pairs of observations have been considered for each of the liquidity measures. As the numberof outstanding shares increase proportionately with the split factor (i.e., number of sharesoutstanding after the split/number of shares outstanding before the split) in the post-splitperiod, the post-split trading volumes have been adjusted by dividing the daily trading volumesby the respective split factors to make the pre and post-split trading volume comparable.
Statistical significance of differences between the pre-split and post-split liquiditymeasures have been tested by performing paired-t tests. But, as we have observed from theresults of Kolmogorov-Smirnov tests that distributions of trading volumes as well as number oftrades deviate significantly from normality (results are not reported here), we have also applieda non-parametric Wilcoxon signed-rank test to arrive at conclusive inference on the liquidityeffect associated with stock split. While applying the matched pair tests, change has beendefined as the post-split minus pre-split for each measure and hence a positive change impliesincrease in post-split period and negative change indicates the opposite.Analysis and Discussion
The results of paired-t test for differences between the pre-split and post-split tradingvolumes for each sample firm taking 30 trading days from each period are presented in Table-1 which shows the values of test statistic along with other descriptive statistics of the variablesconcerned. From Table-1 it is observed that out of the total 30 sample firms, differencebetween pre and post-split trading volumes are statistically significant for 25 (83.33%) firms.Among the 25 significant differences, 19 (63.33%) differences are positive implying that tradingvolumes of shares of 63.33% of the spitted firms have increased significantly while those havedecreased for 5 (16.67%) firms in the post split period. No significant difference is observed for6 (20%) firms which indicates that there is no effect of split on trading volume and hence onliquidity for those spitted stocks. Thus, the results document that for majority of the samplefirms liquidity of shares as measured by trading volume of shares has enhanced significantlyafter the splits and it has worsen or remained unchanged only for 16.67% and 20% of thesample firms respectively. But, as the distribution of daily trading volume deviates significantlyfrom the properties of normal distribution, we have verified the significance of observeddifferences by employing non-parametric Wilcoxon signed-rank test, the results of which aresummarised in Table-2. It is evident from Table-2 that the results of non-parametric test are inagreement with the parametric test in all major aspects. Daily trading volume of shares hasincreased significantly in the post-split period for 17 (56.67%) sample firms which are slightly(only 2) less than that found by parametric test. It is also evident that almost all the samplefirms for which significant improvements in trading volumes have been observed, have veryhigh proportion of positive differences in the 30 pairs of comparison. The average tradingvolumes have decreased significantly for 5 (16.67%) firms (also found the same by theprevious test) while remained unchanged for 8 (26.67%) firms (only 2 more than that found inprevious test). Thus, there exist a favourable impact of stock split on trading volume of sharesand hence on liquidity of stock in short-term period of 30 trading days following ex-split date.

Dr. Pradipta Banerjee: Impact of Stock Split on Short-Term Liquidity of Stocks in Ex-Split Period:...... 67
Table 3 presents the results of paired-t test concerning changes in number of trades inthe post-split period compared to pre-split period of 30 trading days for each of the samplefirms from which it is observed that the number of trades has increased significantly in thepost-split period for 19 (63.33%) sample firms rejecting the null hypothesis of equal meannumber of trades in pre and post-split periods at high level of significances (barring a few, allare significant at 1% level). Among the 30 sample firms, number of trades has decreased for 4firms in the post-split month which constituting only 13.33% of the total sample firms. For 7(23.33%) sample firms, however, no significant change in the number of trades in the post-splitmonth has been observed indicating that there is no influence, either favourable or adverse, ofstock split on trading frequency of these spitted stocks in the post-split month. Thus, liketrading volume, the number of trades on the spitted shares has also increased significantly formajority of the sample firms providing additional support for short-term improvement in liquidityof shares in the post-split month. Like daily trading volume, the Kolmogorov-Smirnov testrejects the normality of daily number of trades series and hence we have conducted Wilcoxonsigned-rank test additionally to verify the significance of observed behavior of number of tradesaround the ex-split date, the results of which are presented in Table-4. From Table-4, it is seenthat the non-parametric Wilcoxon signed-rank test, like parametric test, also stronglydocuments significant increase in number of trades after the splits for majority of the spittedfirms. The number of trades has increased significantly for 60% (18) of the sample firms in thepost-split period of 30 days compared to matched 30 days in the pre-split period. The numberof trades has declined after the splits for only 4 firms constituting only 13.33% of total samplefirms while for 8 (26.67%) sample firms no significant change between the pre-split and post-split number of trades has been observed. Thus, regarding changes in number of tradesfollowing splits, the findings demonstrate that splits lead to significant increase in daily numberof trades of the spitted firms after the splits.Conclusion
Empirical findings of the study document that for majority of sample firms stock splitleads to improvements in post-split liquidity in the month following split as measured by mostcommonly used measures of liquidity, namely daily trading volume and daily number oftrades. The findings, thus, lend support to the well-documented liquidity hypothesis of stocksplit in Indian context as well as to the findings of most of the earlier studies conducted in thecontext of stock market of our country The observed increased number of trades for thespitted stocks in the post-split period also indirectly indicates that splits make the stocksmore attractive to small and retail investors who generally trade in a small quantitiescompared to institutional investors.
Table 1: Results of Paired-t Test for Short-Term Changes inTrading Volume following Splits
SampleFirm
Post-splitAverage
Trading Volume
Pre-splitAverage
Trading Volume
Mean ofPaired
Differences
Standard Error ofMean of Paired
Differences
Degreesof
Freedomt-statistic
1 77575.13 117470.80 -39895.70 11820.15 29 -3.375*2 148521.80 71121.33 77400.43 18871.39 29 4.101*3 158475.2 74163.37 84311.83 44688.72 29 1.887***4 387776.60 452470.70 -64694.10 48042.84 29 -1.3475 17295.64 9231 8064.64 3524.08 29 2.288**6 742.51 232.50 510.01 136.37 29 3.740*7 205892.70 277181.20 -71288.50 15503.79 29 -4.598*8 1728.89 109.20 1619.69 831.37 29 1.948***9 3059 2072.40 986.60 575.94 29 1.713***

68 Indian Journal of Accounting (IJA) Vol. 51 (1), June, 2019
10 16556.58 7339.37 9217.227 5374.35 29 1.715***11 4391.17 214.83 4176.33 1974.56 29 2.115**12 1921.28 1645.20 276.08 965.15 29 0.28613 7951.89 2223.93 5727.95 3242.96 29 1.766***14 7127.25 5100.77 2026.48 754.06 29 2.687*15 231083.50 280533.70 -49450.20 35000.90 29 -1.41316 1675.13 192.27 1482.87 656.35 29 2.259**17 4314.89 682.23 3632.65 1684.84 29 2.156**18 78.06 31.70 46.36 17.36 29 2.670**19 355.27 1038.90 -683.63 181.00 29 -3.777*20 3872.81 1970.07 1902.75 1067.20 29 1.783***21 38968.73 9848.20 29120.53 16598.47 29 1.754***22 18008.25 17211.03 797.22 3722.83 29 0.21423 5606.42 12732.50 -7126.08 4776.44 29 -1.49224 304.25 73.170 231.09 134.098 29 1.723***25 1971.12 616.80 1354.32 513.04 29 2.640**26 456.40 592.27 -135.87 111.05 29 -1.22427 22146.66 10216.23 11930.43 3947.35 29 3.022*28 49144.83 289983.60 -240839 72177.80 29 -3.337*29 8681.55 3519.40 5162.15 2747.34 29 1.879***30 6520.33 14249.60 -7729.27 3888.86 29 -1.988***
Note: *, ** and *** imply significance at 1%, 5% and 10% levels respectively.
Table 2: Results of Wilcoxon Signed-rank Test for Short-term Changes inTrading Volume following Splits
SampleFirm
No ofPairs
No. of PositiveDifferences(Post – Pre)
No. of NegativeDifferences(Post - Pre)
No. ofTies
Standardized z-statistic
Acceptance/Rejection of
Null Hypothesis1 30 8 22 0 -2.910* Rejected2 30 25 5 0 3.754* Rejected3 30 24 6 0 3.219* Rejected4 30 12 18 0 -1.286 Accepted5 30 22 8 0 2.437** Rejected6 30 24 6 0 3.322* Rejected7 30 5 25 0 -3.610* Rejected8 30 28 1 1 4.682* Rejected9 30 19 11 0 1.748*** Rejected10 30 22 8 0 3.096* Rejected11 30 22 8 0 3.363* Rejected12 30 14 16 0 0.051 Accepted13 30 23 7 0 3.240* Rejected14 30 21 9 0 2.705* Rejected15 30 9 21 0 -1.491 Accepted16 30 20 9 1 2.173** Rejected17 30 17 13 0 1.224 Accepted18 30 22 7 1 3.082* Rejected19 30 10 20 0 -2.581* Rejected20 30 16 14 0 0.710 Accepted

Dr. Pradipta Banerjee: Impact of Stock Split on Short-Term Liquidity of Stocks in Ex-Split Period:...... 69
21 30 29 1 0 4.762* Rejected22 30 17 13 0 0.792 Accepted23 30 7 23 0 -2.314** Rejected24 30 20 10 0 2.232** Rejected25 30 19 11 0 2.386** Rejected26 30 14 16 0 -0.854 Accepted27 30 20 10 0 2.828* Rejected28 30 3 27 0 -4.042* Rejected29 30 26 4 0 3.075* Rejected30 30 13 17 0 -1.532 Accepted
Notes: *, ** and *** indicate significance at 1%, 5% and 10% levels respectively.
Null Hypothesis of Median Difference between Post and Pre-split trading volumeequals to zero.
Table 3: Results of Paired-t Test for Short-term Changes inNumber of Trades following Splits
SampleFirm
Post-splitAverage
Trading Volume
Pre-splitAverage
Trading Volume
Mean ofPaired
Differences
Standard Error ofMean of Paired
Differences
Degreesof
Freedomt-statistic
1 7630.23 6313.57 1316.67 905.71 29 1.4542 2312.80 865.10 1447.70 230.40 29 6.283*3 1387.33 893.47 493.87 180.38 29 2.738*4 18147.87 11199.70 6948.17 1627.53 29 4.269*5 1564.60 374.37 1190.23 241.95 29 4.919*6 22.27 2.50 19.77 3.92 29 5.049*7 884.73 859.17 25.57 64.46 29 0.3978 11.53 7.57 3.97 2.53 29 1.5679 31.00 18.23 12.77 5.34 29 2.390**
10 131.10 134.47 -3.37 24.06 29 -0.14011 29.47 11.00 18.47 5.92 29 3.118*12 4.03 13.57 -9.53 4.79 29 -1.991***13 90.07 46.93 43.13 23.55 29 1.831***14 142.20 76.40 65.80 16.42 29 4.007*15 14183.87 16405.53 -2221.67 1286.94 29 -1.726***16 6.03 2.93 3.10 1.02 29 3.047*17 43.17 6.87 36.30 8.64 29 4.199*18 7.33 1.77 5.57 2.03 29 2.738*19 21.83 31.73 -9.90 8.97 29 -1.10420 27.97 10.63 17.33 3.68 29 4.715*21 470.27 183.80 286.47 36.40 29 7.869*22 197.67 34.73 162.93 12.35 29 13.191*23 199.63 687.17 -487.53 135.66 29 -3.594*24 20.90 9.37 11.53 5.95 29 1.939***25 15.30 4.20 11.10 3.10 29 3.586*26 26.50 19.17 7.33 4.23 29 1.736***27 1348.33 443.63 904.70 184.39 29 4.907*28 65.33 370.43 -305.10 59.85 29 -5.098*29 3.93 8.53 -4.60 4.08 29 -1.12630 47.63 39.27 8.37 10.30 29 0.812
Note: *, ** and *** mean significance at 1%, 5% and 10% levels respectively.

70 Indian Journal of Accounting (IJA) Vol. 51 (1), June, 2019
Table 4: Results of Wilcoxon Signed-rank test for Short-term Changes inNumber of Trades following Splits
SampleFirm
No ofPairs
No. of PositiveDifferences(Post – Pre)
No. of NegativeDifferences(Post - Pre)
No. ofTies
Standardised z-statistic
Acceptance/Rejection of Null
Hypothesis1 30 16 14 0 1.162 Accepted2 30 29 1 0 4.576* Rejected3 30 22 8 0 3.096* Rejected4 30 23 7 0 3.507* Rejected5 30 28 2 0 4.679* Rejected6 30 25 1 4 4.420* Rejected7 30 14 16 0 -0.247 Accepted8 30 16 13 1 1.590 Accepted9 30 18 11 1 2.066** Rejected
10 30 15 15 0 -0.596 Accepted11 30 22 7 1 3.125* Rejected12 30 8 19 3 -1.925*** Rejected13 30 18 12 0 1.471 Accepted14 30 22 8 0 3.343* Rejected15 30 9 21 0 -2.170** Rejected16 30 20 7 3 2.798* Rejected17 30 26 4 0 4.021* Rejected18 30 22 4 4 3.303* Rejected19 30 13 17 0 -0.288 Accepted20 30 22 5 3 3.929* Rejected21 30 28 2 0 4.700* Rejected22 30 30 0 0 4.782* Rejected23 30 5 25 0 -4.247* Rejected24 30 18 10 2 2.107** Rejected25 30 22 5 3 3.715* Rejected26 30 18 11 1 1.644*** Rejected27 30 26 4 0 4.247* Rejected28 30 2 28 0 -4.474* Rejected29 30 13 12 5 -0.633 Accepted30 30 14 15 1 0.973 Accepted
Notes: *, ** and *** indicate significance at 1%, 5% and 10% levels respectively.
Null Hypothesis of Median Difference between Post and Pre-split number of tradesequals to zero.References Anjel, J. (1997). Tick Size, Share Prices, and Stock Splits. The Journal of Finance,
52(2), 655-681. Anshuman, V. R., & Kalay, A. (2002). Can Splits Create Market Liquidity? Theory and
Evidence. Journal of Financial Markets, 59(1), 83-125. Asquith, P., Healy, P., & Palepu, K. (1989). Earnings and Stock Splits. The Accounting
Review, 64(3), 387-403. Baker, H. K., & Gallagher, P. L. (1980). Management’s View of Stock Splits. Financial
Management, 9(2), 73-77. Baker, H. K., & Powell, G. E. (1993). Further Evidence on Managerial Motives for
Stock Splits. Quarterly Journal of Business and Economics, 32(3), 20-31. Banerjee, P., Nagar, R., & Banerjee, P. S. (2010). The Information Content and Stock
Return Behavior around the Stock Splits: Evidence from India. Paradigm, 14(2).Retrieved from http://www.freepatentsonline.com/article/Paradigm/297309484.html.
Barker, C.A. (1956). Effective Stock Splits. Harvard Business Review, 34, 101-106.

Dr. Pradipta Banerjee: Impact of Stock Split on Short-Term Liquidity of Stocks in Ex-Split Period:...... 71
Bar-Yosef, S., & Brown, L. D. (1977). A Reexamination of Stock Splits Using MovingBetas. The Journal of Finance, 32(4), 1069-1080.
Bhuvaneshwari, D., & Ramya, K. (2014). Impact of Stock Split Announcement onStock Prices. International Journal of Management, 5(3), 36-46.
Brennan, M. J., & Copeland, T. E. (1988). Stock Splits, Stock Prices and TransactionCosts. Journal of Financial Economics, 22(1), 83-101.
Chakraborty, M. (2012). The Equity Market around the Ex-Split Date: Evidence fromIndia. Vikalpa, 37(1), 57-68.
Choudhary, K., & Choudhary, S. (2009). Stock Return Behaviour around Stock Splits:Indian Evidences. Asia-Pacific Journal of Management Research and Innovation, 5(2),91-101.
Conroy, R. M., & Harris, R. S. (1999). Stock Splits and Information: The Role of SharePrice. Financial Management, 28(3), 28-40.
Copeland, T. E. (1979). Liquidity Changes following Stock Splits. The Journal ofFinance, 34(1), 115-141.
Dash, M., & Gouda, A. (2007). A Study on the Liquidity Effects of Stock Splits in IndianStock Markets. Retrieved from http://ssrn.com/abstract=1440139
Dennis, P., & Strickland, D. (2003). The Effects of Stock Splits on Liquidity and ExcessReturns: Evidence from Shareholder Ownership Composition. Journal of FinancialResearch, 26(3), 355-370.
Dolley, J. C. (1933). Common Stock Split-Ups- Motives and Effects. Harvard BusinessReview, 12(1), 70-81.
Easley, D., O’Hara, M., & Saar, G. (2001). How Stock Splits Affect Trading: AMicrostructure Approach. Journal of Financial and Quantitative Analysis, 36(1), 25-51.
Ghatak, A. (2011). Capital Market Reaction around the Stock Splits and Bonus Issues:Evidence from some Indian IT Stocks. Research Journal of Social Science andManagement, 1(5), 191-213.
Grinblatt, M. S., Masulis, R. W., & Titman, S. (1984). The Valuation Effects of StockSplits and Stock Dividends. Journal of Financial Economics, 13(4), 461-490.
Ikenberry, D. L., Rankine, G., & Stice, E. K. (1996). What do Stock Splits ReallySignal?. Journal of Financial and Quantitative Analysis, 31(3), 357-375.
Joshipura, M. (2009). Price & Liquidity Effects of Stock Split: Empirical Evidence fromIndian Stock Market. Indian Journal of Finance, 3(10), 22-31.
Lakonishok, J., & Lev, B. (1987). Stock Splits and Stock Dividends: Why, Who andWhen?. The Journal of Finance, 42(4), 913-932.
Lukose, PJ, & Rao, S.N. (2002). Market Reaction to Stock Splits: An Empirical Study.Journal of Applied Finance, 8(2), 26-40.
McNichols, M., & Dravid, A. (1990). Stock Dividends, Stock Splits and Signaling. TheJournal of Finance, 45(3), 857-879.
Mehta, C., Yadav, S. S., & Jain, P. K. (2011). Managerial Motives for Stock Splits:Survey Based Evidence from India. Journal of Applied Finance, 1, 103-117.
Mishra, A. K. (2007). The Market Reaction to Stock Splits: Evidence from India.International Journal of Theoretical and Applied Finance, 10(2), 251-271.

72 Indian Journal of Accounting (IJA) Vol. 51 (1), June, 2019
Mukherji, S., Kim, Y., & Walker, M. (1997). The Effect of Stock Splits on OwnershipStructure of Firms. Journal of Corporate Finance, 3, 167-188.
Muscarella, C. J., & Vetsuypens, M. R. (1996). Stock splits: Signaling or Liquidity? TheCase of ADR ‘Solo-Splits. Journal of Financial Economics, 42(1), 3-26.
Ohlson, J. A., & Penman, S. H. (1985). Volatility Increases Subsequent to Stock Splits:An Empirical Aberration. Journal of Financial Economics, 14(2), 251-266.
Pilotte, E., & Manuel, T. (1996). The Market’s Response to Recurring Events: TheCase of Stock Splits. Journal of Financial Economics, 41(1), 111-127.
Pooja (2013). Stock Split Announcement and Liquidity Effect: Evidence from India.XIMB Journal,10(1), 135 - 148.
Ray, K. K. (2011). Market Reaction to Bonus Issues and Stock Splits in India: AnEmpirical Study. The IUP Journal of Applied Finance, 17(1), 54-69
Singh, S., & Sapna, K. (2013). Efficiency of Indian Stock Market: Evidences Based onStock Splits. International Journal of Research in Computer Application &Management, 3(7), 12-21.

Indian Journal of Accounting (IJA) 73ISSN : 0972-1479 (Print) 2395-6127 (Online) Vol. 51 (1), June, 2019, pp. 73-79
DOES CORPORATE REPORTING UNDER IFRS IMPACTGLOBAL CAPITAL MOBILIZATION?:
A CASE STUDY OF DR. REDDY’S LABORATORIES LIMITED
MD Suleman
ABSTRACT
In the era of globalisation, the companies are now a days trying to access globalmarkets for mobilising the capital needed for starting and expanding the business. The role ofaccounting becomes important in this situation, which will enable the investors across theglobe to take informed decisions regarding their investment. Since different countries usedifferent accounting standards, the investors would face difficulties in making comparisonsbetween the financial statements prepared by the companies across different countries. In theevent of adoption of IFRS by the companies, it would be imperative to understand the impactof IFRS on the preparation and presentation of various financial reports and its incidence onvarious dimensions of accounting. The Pharmaceutical Industry in India is the worlds third-largest in terms of volume and lot of money is spent in research and development of variousdrugs, vaccines and accounting for such expenditure is to be dealt with in the light of IFRS.This paper explains the expert’s opinion on importance of IFRS in corporate reporting andanalyzes the impact of IFRS adoption on global capital mobilization.
KEYWORDS: Globalisation, Accounting Standards, IFRS, Global Capital Mobilization._______________
IntroductionIn the wake of globalisation, the role of corporate reporting becomes very important in
promoting the growth and development of a country’s business and economy. Thus investorsexpect all relevant information about the company they invest and the companies shall provideall information and enable the investors to measure the performance of companies in a betterway. Since different countries use different accounting standards, the investors would facedifficulties in making comparisons between the financial statements prepared by thecompanies across different countries. In 1973, the International Accounting StandardsCommittee (IASC) was formed in England with a view to issue accounting standards whichshall be followed globally. IFRS have been developed to harmonize the accounting standardsworldwide, whereas at present more than 100 countries in the world have adoptedInternational Financial Reporting Standards. Recent decades have experienced lot of changesin the area of accounting and the companies accessing the global markets for capital needshave started reporting globally and adopted IFRS voluntarily.
Assistant Professor, Department of Commerce, MVS Government Degree & PG College(Autonomous),Mahabubnagar, Telangana State, India.This paper is written on the basis of Ph.D research work done under the supervision of Prof. K.V. Achalapathi, FormerDean, Faculty of Commerce, Osmania University, Hyderabad, Telangana State, India

74 Indian Journal of Accounting (IJA) Vol. 51 (1), June, 2019
In the event of adoption of IFRS by the companies, it would be imperative tounderstand the impact of IFRS on the preparation and presentation of various financial reportsand its incidence on various dimensions of accounting. Adoption of IFRS invariably boostsinvestors’ confidence and attract cross border financial transactions which is the basis foreconomic growth1. The Pharmaceutical Industry in India is the world's third-largest in terms ofvolume. The number of purely Indian pharmaceutical companies is fairly low. Dr. Reddy’sLaboratories founded by Dr. K. Anji Reddy is an Indian multinational company. During the year2001, the company issued American Depository Receipts for the first time and got listed on theNew York Stock Exchange. As the pharmaceutical industry is research oriented one, lot ofmoney is spent in research and development of various drugs, vaccines and accounting forsuch expenditure is to be dealt in the light of IFRS.Review of Literature
The following research thesis and articles were found to be useful for the paper:Antehunegn Yihenew2 in his Ph D research “International Financial accounting
Problems faced by Industries in Implementing IFRS” found that it is real that the globe needssimilar accounting standard and this standard is IFRS, it is also real that this standard needshigh level and qualified expertise to take a smooth move towards IFRS.
Rishi Bhargav Das3 in his research article “International Financial ReportingStandard: A New Dimension in the Area of Financial Reporting in India” revealed that with thegrowth of Indian economy and increasing integration with the global economies, Indiancorporate are raising capital globally and the fair financial reporting with the help of IFRS willenable the corporate to grow.
Srinivasa Rao K and Malyadri4 in their research article “International FinancialReporting Standards: A Frame Work” concluded that IFRS adoption improves the functioningof global capital markets by providing comparable and high-quality information to investors. Inthis connection corporate have to disclose the realities of their business activities andprofessionals in turn to interpret and report as per the standards without any violations.
Ramona Lapteş and Ioana Sofian5 in their research “A new dimension of the entities’financial reporting: Integrated Reporting” summarised that transparency, the openness of acompany, is, in fact, an attempt to a collateral global awareness of the moral obligation of eachone of us to transmit the respect of values and of a better world to future generations.Objectives To examine expert’s opinion on significance of corporate reporting under IFRS To analyze the trends in foreign institutional investors after adoption of IFRS in Dr.
Reddy’s Laboratories LimitedData Collection
The paper is based on both primary and secondary data. The primary data is collectedfrom the stakeholders of pharmaceutical industry viz., Auditors and Investors. The sample sizecomprised of 200 auditors and 200 investors in Hyderabad city of Telangana state. Thesecondary data is collected from the annual reports of Dr. Reddy’s Laboratories Limited for theyears 2008-09 to 2016-17.Expert’s Opinion on Significance of IFRS
In the recent past there is a lot of change in the process of financial reporting by firmsacross the globe. For an investor from the outside country or continent, it is difficult tounderstand the financial statements prepared by an entity which is not situated in hishometown as different companies may follow different accounting standards while preparingthe financial statements. IFRS are supposed to play the role of global accounting languageand the implementation of IFRS necessitate the in-depth study as to how the IFRS are going

MD Suleman: Does Corporate Reporting under IFRS Impact Global Capital Mobilization?: A Case...... 75
to meet the requirement of presenting the true and fair view of the financial statements. Thesignificance of IFRS in corporate reporting process has gained importance due to thequalitative attribute of the financial statements provided by the firms. It is presumed that IFRShelps for better and quality reporting. The statement was verified with the help of responsesfrom the stakeholders of pharmaceutical industry. The following tables provide an analysis ofthe statement on the basis of the profession of the respondents.
Table 1: IFRS and Quality Reporting - Auditor’s OpinionProfession Response No. of Respondents Percent
Auditor
Strongly Disagree 1 0.5Disagree 4 2.0No Opinion 21 10.5Agree 105 52.5Strongly Agree 69 34.5
Total 200 100Source: Primary data
The process of implementation of IFRS has become prominent due to the increasingimportance of qualitative phenomenon of the financial statements. It is evident from table 1that 87 percent of the auditors agree that IFRS helps better and quality reporting.
Table 2: IFRS and Quality Reporting – Investor’s OpinionProfession Response No. of Respondents Percent
Investor
Strongly Disagree 5 2.5Disagree 10 5.0No Opinion 30 15.0Agree 74 37.0Strongly Agree 81 40.5
Total 200 100Source: Primary data
The responses taken from the investors tabulated in table 2 clearly show that 77.5percent of investors agree that IFRS helps better and quality reporting. This shows thatadoption of IFRS will bring quality financial statements. The opinions of the auditors andinvestors were tested by setting up the following hypothesis to know whether there is anysignificant difference in the opinions provided by them on the statement IFRS helps better andQuality Reporting.H0: There is no significant difference in opinions of auditors and investors that IFRS helps
better and quality reporting.H1: There is significant difference in opinions of auditors and investors that IFRS helps
better and quality reporting.Result: P value = 0.788The Null Hypothesis cannot be rejected at 5% level of significance.Hence, it is concluded that there is no significant difference in opinions of Auditors and
Investors that IFRS helps better and Quality Reporting. On the other hand, the quality aspectof financial reports provided by a company is understood from various dimensions. Thefollowing are some of the important qualitative characteristics of financial statements Understandability Relevance Comparability Consistency

76 Indian Journal of Accounting (IJA) Vol. 51 (1), June, 2019
Dr. Reddy’s Laboratories limited prepares the financial statements in a moredescriptive and elaborate manner by providing all the required explanations to thestakeholders so as to make the financial statements easily understandable. Thebalance sheet and statement of profit and loss prepared by the company are easilyunderstood by the stakeholders and are supplemented by notes on various itemsincluded in the financial statements.
The word “Relevance” may be understood as a quality phenomenon which affects thedecision making process of various stakeholders of a company on the basis ofaccounting information provided to them. It contains the materiality or timeliness of theinformation provided. In other words, it may be understood as to what extent variousstakeholders consider or believe the information provided to them is relevant fordecision making. Every stakeholders needs information that is useful to him. To saythat a piece of information is relevant, it must be capable of making a difference in thedecision making by a stakeholder in the form of understanding the present situation ofthe business and predicting the future trend of the business. The annual report of acompany is of great importance to various stakeholders like shareholders, bankers,creditors, Government authorities, tax officials, etc.,For instance, a prospective shareholder should not jump to the conclusion about the
prospects of a company just by seeing one financial year data. He should be able to predictthe future price of the share before investing in the company. Dr. Reddy's Laboratories limitedis providing the annual reports to its stakeholders in a timely manner so that they can use thereports as a basis for their judgements on different decisions about the company. Theinformation relating to various key indicators or performance of the company like revenues,EBITDA, EPS etc., is made available in its reports in a clear manner. In view of this it may beinferred that the financial statements provided by Dr. Reddy's Laboratories limited are relevantfor decision making by its stakeholders. Since, the company has adopted IFRS for preparing the financial statements, it can be
said that the financial statements are comparable over a period of time. The figures inone particular year are easily comparable with the other years. Also, the figures arecomparable with other global companies in view of IFRS adoption
With regard to consistency attribute of the financial statements of Dr. Reddy’sLaboratories limited, it is observed that the company has adopted consistent policy ofpreparing financial statements. For example, the depreciation policy adopted by thecompany for providing depreciation on various items is consistent over a period of time.
IFRS and Global Capital MobilizationIn the era of globalisation, a lot of companies are now a days trying to access global
markets for mobilising the capital needed for starting and expanding the business. Financialreports of a company speak about the methods adopted by it to prepare the financials and theinvestors globally will rely on the reports to take investment decisions overseas. The role ofaccounting becomes important in this situation, which will enable the investors across theglobe to take informed decisions regarding their investment. Thus investors should beprovided all material information regarding the company.
IFRS play an important role in providing the financial statements to the investorsworldwide to understand the financial position of a company. The assumption whether IFRSpromote global capital mobilization was checked with the help of primary data collected fromthe auditors and investors.
The table 3 provides an analysis of the data collected from the respondents on thebasis of profession.

MD Suleman: Does Corporate Reporting under IFRS Impact Global Capital Mobilization?: A Case...... 77
Table 3: IFRS and Global Capital Mobilization – Auditor’s OpinionProfession Response No. of Respondents Percent
Auditor
Strongly Disagree 2 1.0Disagree 15 7.5No Opinion 29 14.5Agree 125 62.5Strongly Agree 29 14.5
Total 200 100.0Source: Primary data
It can be seen from table 3 that 62.5 percent of the auditors agree that IFRS promoteglobal capital mobilization.
Table 4: IFRS and Global Capital Mobilization - Investor’s OpinionProfession Response No. of Respondents Percent
Investor
Strongly Disagree 12 6.0Disagree 3 1.5No Opinion 20 10.0Agree 78 39.0Strongly Agree 87 43.5
Total 200 100.0Source: Primary data
It is evident from table 4 that a large number of Investors strongly agree that IFRSpromote global capital mobilization. The opinions of the auditors and investors were tested bysetting up the following hypothesis to know whether there is any significant difference in theopinions provided by them that IFRS promote global capital mobilization.H0: here is no significant difference in opinions of auditors and investors that
implementation of IFRS promote global capital mobilizationH1: There is significant difference in opinions of auditors and investors that implementation
of IFRS promote global capital mobilizationResult: P value = 0.000The Null Hypothesis was rejected at 5% level of significance.Though the auditors and investors individually agree that IFRS promote global capital
mobilization, but in group comparison they differ in opinions on the statement that IFRSpromote global capital mobilization. Hence, it was concluded that there is significant differencein opinions of Auditors and Investors that Implementation of IFRS promote global capitalmobilization. In order to know the effect of IFRS adoption and global capital mobilization anattempt has been made to study the pattern of foreign holding in the capital structure ofDr. Reddy’s Laboratories Limited. Dr. Reddy’s Laboratories Limited adopted IFRS during theyear 2008-09. The foreign share holding pattern after the adoption of IFRS and globalreporting for the year 2008-09 onwards was analyzed and the following trend was observed.Table 5: Share Holding of Foreign Institutional Investors in Dr. Reddy’s Laboratories Ltd.
Financial Year No. of Shares owned by FIIs2008-2009 3,73,24,4432009-2010 4,60,44,7552010-2011 4,38,34,9092011-2012 4,64,97,4382012-2013 5,03,67,1922013-2014 5,83,53,6212014-2015 6,62,11,4132015-2016 6,60,05,0772016-2017 5,36,94,200
Source: Company annual reports

78 Indian Journal of Accounting (IJA) Vol. 51 (1), June, 2019
Chart 1: Foreign Institutional Investors of Dr. Reddy’s Laboratories Limited
Source: Company annual reports
It is evident from the table 5 and chart 1 that, the shares owned by the foreigninstitutional investors increased continously after adoption of IFRS except the year 2016-17where the company implemented buy back strategy.
Table 6: Total inflow Foreign Institutional Investors in IndiaFinancial Year Inflow of FIIs
2008-2009 -477062009-2010 1,10,2212010-2011 1,40,0332011-2012 43,7382012-2013 1,40,0332013-2014 79,7092014-2015 1,11,3332015-2016 -141722016-2017 55,703
Source: NSDL
Chart 2: Foreign Institutional Investors in India
Source: NSDL
01,00,00,0002,00,00,0003,00,00,0004,00,00,0005,00,00,0006,00,00,0007,00,00,000
Foreign Institutional Investors Dr. Reddy's Laboratories Ltd.
Foreign Institutional InvestorsDr. Reddy's Laboratories Ltd.
-100000
-50000
0
50000
100000
150000
Foreign Institutional Investors in India
Foreign Institutional Investorsin India

MD Suleman: Does Corporate Reporting under IFRS Impact Global Capital Mobilization?: A Case...... 79
Table 6 and chart 2 show the inflow of foreign institutional investors in India for theperiod 2008-09 to 2016-17. It is clear that the total inflow of foreign institutional investors inIndia during the period 2008-09 to 2016-17 has no consistent trend during the period of study.On the other hand, there is negative trend in FIIs in the year 2008-09 due to heavy outflow ofinvestment in the year. This is contrary to the figures of foreign institutional investors in table 5of Dr. Reddy’s laboratories limited which has an upward trend when compared to the baseyear 2008-09.
Hence, it can be concluded that adoption of IFRS and providing the financialstatements globally has boosted the confidence among the foreign institutional investorsresulting in an increase in the share holding pattern across the period of study when comparedto the year 2008-09. Thus, the decision of the company to adopt IFRS has shown a positivedevelopment on the share holding pattern with the increase of investment by foreigninstitutional investors.Conclusion
In India, IND AS are adopted versions of IFRS. The Government of India throughMinistry of Corporate Affairs has made IND AS mandatory for every listed company andunlisted companies with net worth greater than or equal to 250 crores. Based on the datacollected, it can be concluded that corporate reporting under IFRS has reached new heightswhich aims at providing all the relevant information to the stakeholders which is comparableand easily understandable. Adoption of IFRS and reporting globally has brought a positivechange in the investors globally and increased the level of confidence among the investorsresulting in an increase in the share holding pattern by the foreign investors in Dr. Reddy’sLaboratories Limited.References1. Antehunegn Yihenew, International Financial accounting Problems faced by Industries
in Implementing IFRS, Berndt Andersson, Ph.D thesis 20092. Rakesh and Shilpa, Effect of IFRS and Financial Statements: Implications on FDI and
Indian Economy, International Journal of Commerce, Business and Management(IJCBM), ISSN: 2319–2828 Vol. 2, No.5, October 2013
3. Ramona Lapteş and Ioana Sofian, A new dimension of the entities’ financial reporting:Integrated Reporting, Bulletin of the Transilvania University of Braşov Series V:Economic Sciences • Vol. 9 (58) No. 2 – 2016.
4. Rishi Bhargav Das, International Financial Reporting Standard: A New Dimension inthe Area of Financial Reporting in India, International Journal of Marketing, FinancialServices & Management research, Volume 1, issue 10, October 2012
5. Srinivasa Rao K and Malyadri P, International Financial Reporting Standards: A FrameWork, Journal of Accounting & Marketing, Volume 4, Issue 2, 2015.

Indian Journal of Accounting (IJA) 80ISSN : 0972-1479 (Print) 2395-6127 (Online) Vol. 51 (1), June, 2019, pp. 80-84
STATUS OF NOMINATION AND REMUNERATION COMMITTEE INTHE LIGHT OF SEBI’S LODR 2015 REGULATIONS
(A CASE STUDY OF BANKING AND HOUSING FINANCE SECTOR COMPANIESINCLUDED BSE SENSEX COMPANIES)
CMA Dr. Meenu Maheshwari
ABSTRACT
Sound Corporate Governance makes corporation a good corporate citizen who enjoysthe position of respect and goodwill as well as the status of an icon. Now in India, all listedcompanies are regulated by the Companies Act 2013 aim of and SEBI’s LODR 2015. Themain of this study is to exhibit the status of Nomination and Remuneration Committee ofBanking and Housing Finance Sector Companies included in BSE Sensex. This paperincludes HDFC Bank, ICICI Bank, SBI and HDFC for the financial years 2014-15, 2015-16 and2016-17. The study reveals that all companies except SBI have appointed ID chairman as wellas ID members. In 2014-15, 2015-16 chairman of HDFC bank did not attend the AGM. It issuggested that chairman as well as members should attend the meetings to play an active rolein the working of this committee.
KEYWORDS: Corporate Governance, SEBI, LODR, Independent Director, Executive Director._______________
IntroductionCorporate Governance is a practice of doing everything in a better manner to improve
relations between a company and its stakeholders and to ensure that management is workingin the interest of shareholders. Hon’ble Prime Minister Shri Narendra Modiji in his speech atthe launch of Shri Vinay Sahastra Buddhe’s Book ‘Beyond a Billion Ballots’ suggested by ourancient Indian text several instances related to good governance. Hon’ble Prime minister saidthat “when we talk of good governance, let us see what Ram Rajya according to Ramayana isand what kind of governance is described in it”. “Ramayana says, “Ram Raj Baithe Triloka,Harshit Bhaye Gaye Sab Soka; Bayaru Na kar Kaahu San Koi, Ram Pratap VishamtaKhoi…!” Friends, today we say that there should be no discrimination among people. What isthe meaning of this chuapai? It talks about such governance that has no inequality, upsand lows, difference among rich and poor.”
The Corporate Governance framework should recognize the rights of stakeholdersestablished by law. To protect the interests of all stakeholders and give them opportunity toobtain effective redress for violation of their rights, the SEBI as well as Indian governmentregularity bodies have recommended appointing various committees of the Board of Directors.Nomination and Remuneration committee is one of the important mandatory committee ofBoard of Directors. As per SEBI’s LODR-2015, Chapter IV, point 19, Nomination &Remuneration Committee shall be as follows:
Assistant Professor, Department of Commerce and Management, University of Kota, Kota, Rajasthan, India.

CMA Dr. Meenu Maheshwari: Status of Nomination and Remuneration Committee in the Light of..... 81
The board of directors shall constitute the nomination and remuneration committee asfollows: The committee shall comprise of at least three directors All directors of the committee shall be non-executive directors Al least 50 % of the directors shall be independent directors
The chairperson of the nomination and remuneration committee shall be anindependent director: provided that the chairperson of the listed entity; whetherexecutive or non-executive, may be appointed as a member of the nomination andremuneration committee and shall not chair such committee.
The chairperson of the nomination and remuneration committee may be present at theannual general meeting, to answer the shareholders’ queries; however, it shall be upto the chairperson to decide who shall answer the queries.
The role of nomination and remuneration committee shall be as specified as in Part Dof the schedule II.
Review of LiteratureVo and Phan (2013) studied how Corporate Governance is related with the
performance of firms in Vietnam. The nine elements of corporate governance have been takeninto consideration in which aspect of compensation of the board has also been analyzed. Thesample of 77 listed firms which were trading during 2006-11 has been considered for studyand Flexible Generalized Least Square (FGLS) has been used for further analysis. It has beenfound that compensation is positively related with performance of the firm. It hasrecommended that firm should maintain competitive and suitable level of compensation as itleads to better relationship between shareholders and firm’s management, thus resulting inboosting shareholder’s value.
Sugiarto (2017) in his paper identified the requisite ideology for good corporategovernance in terms of various variables which were not incorporated in the Company law,2007. The research was qualitative and descriptive in nature and data were collected throughprimary, secondary and tertiary legal materials. Under the head of accountability principles,aspect of nomination and remuneration committee has been explained in context of its roleand functions. It has been asserted that though Article 121 of Company law, 2007 stated theexistence and meaning of nomination and remuneration committee but has been extremelyunclear about its task, structure and role.
Nachemson-Ekwall and Mayer (2018) pointed in their paper that amongst all thecommittees in the company, nomination committee has been given least importance. The coreobjective of paper was to suggest the instrumentality of nomination committee fororganisations. This has been done by observing the operations of nomination committee in twocountries i.e. Sweden and the UK. They found that though operations of companies in thesecountries are quite similar, however they differ in terms of presence of main shareholders andits influence on directors and concentration of shares. They further opined that many of theissues and conflicts in corporate governance can be addressed by flexible application ofinternal and external nomination committee along with sustaining wealth creation in theinterest of company as well as shareholders.Research Methodology Research Questions/Issues Examined
Whether transparency has been maintained in the composition of the committee? Has the independent director been appointed as chairman of the committee? Whether the compliance of minimum requirement of number of NED has been
maintained?

82 Indian Journal of Accounting (IJA) Vol. 51 (1), June, 2019
Has the information about remuneration of directors of the committee beendisclosed?
How many meetings held by the committee? Has committee’s report been disclosed? Whether chairman attended AGM?
Scope of the study and Collection of DataThis research paper highlights about the formation, composition, meetings and report
of the Nomination and Remuneration Committee for the Banking and Housing Finance SectorCompanies for the year 2014-15, 2015-16 and 2016-17 according to LODR 2015 regulations.HDFC Bank, ICICI Bank, SBI and HDFC have been taken for the study.
Data have been collected mainly from the annual reports published by the respectivecompanies. Besides this Companies Act 2013, SEBI’s LODR 2015 Regulations, books,journals, reports etc. have been studied.Data Analysis
Table 1: Status of Nomination and Remuneration Committee of Banking and HousingFinance Sector Companies for the Financial Year 2014-15
S.No.
Particulars HDFC Bank ICICI Bank SBI HDFC
1. Transparency incomposition of thecommittee
Total Member-4C/M-NED/ID
ID-4
Total Member-3C/M-NED/ID
ID-3
Total Member-4C/M-?
Nominee-2NED-2
Total Member-3C/M-NED/ID
ID-3
2. Compliance of theprovisions of IndependentDirector as chairman of thecommittee
Yes Yes No Yes
3. Compliance of minimumrequirement of No. of Non-Executive Directors in thecommittee. (At least 3members)
Yes Yes No Yes
4. Information aboutRemuneration of Directors
Informationprovided
Informationprovided
Informationprovided
Informationprovided
5. Information about number ofcommittee meetings
Total Meeting-23 Attended -21 Attended -1
Total Meeting-53 Attended -5
Total Meeting-1Not Disclosed
Total Meeting-41 Attended -22 Attended -4
6. Disclosure of committee’sreport
Disclosed Disclosed Disclosed Disclosed
7. Chairman attended AGM Absent Attended Attended Attended
Table 2: Status of Nomination and Remuneration Committee of Banking and HousingFinance Sector Companies for the Financial Year 2015-16
S.No.
Particulars HDFC Bank ICICI Bank SBI HDFC
1. Transparency incomposition of thecommittee
Total Member-4C/M-NED/ID
ID-4
Total Member-3C/M-NED/ID
ID-3
Total Member-4C/M-?
Nominee-2NED-2
Total Member-3C/M-NED/ID
ID-3
2. Compliance of theprovisions ofIndependent Director aschairman of thecommittee
Yes Yes No Yes

CMA Dr. Meenu Maheshwari: Status of Nomination and Remuneration Committee in the Light of..... 83
3. Compliance of minimumrequirement of No. ofNon-Executive Directorsin the committee. (Atleast 3 members)
Yes Yes No Yes
4. Information aboutRemuneration ofDirectors
Informationprovided
Informationprovided
Informationprovided
Informationprovided
5. Information aboutnumber of committeemeetings
Total Meeting-92 Attended -82 Attended -9
Total Meeting-81 Attended -42 Attended-8
Total Meeting-1Not Disclosed
Total Meeting-31 Attended -22 Attended -3
6. Disclosure ofcommittee’s report
Disclosed Disclosed Disclosed Disclosed
7. Chairman attendedAGM
Absent Attended Attended Attended
Table 3: Status of Nomination and Remuneration Committee of Banking and HousingFinance Sector Companies for the Financial Year 2016-17
S.No.
Particulars HDFC Bank ICICI Bank SBI HDFC
1. Transparency incomposition of thecommittee
Total Member-4C/M-NED/ID
ID-4
Total Member-3C/M-NED/ID
ID-3
Total Member-4C/M-NA
Nominee-2NED-2
Total Member-3C/M-NED/ID
ID-3
2. Compliance of theprovisions of IndependentDirector as chairman of thecommittee
Yes Yes No Yes
3. Compliance of minimumrequirement of No. of Non-Executive Directors in thecommittee. (At least 3members)
Yes Yes No Yes
4. Information aboutRemuneration of Directors
Informationprovided
Informationprovided
Informationprovided
Informationprovided
5. Information about numberof committee meetings
Total Meeting-101 Attended -93 Attended -10
Total Meeting-101 Attended -81 Attended -91 Attended -10
Total Meeting-1Not Disclosed
Total Meeting-43 Attended -4
6. Disclosure of committee’sreport
Disclosed Disclosed Disclosed Disclosed
7. Chairman attended AGM Attended Attended Attended Attended
Observations All companies have formed Nomination and Remuneration Committee in all the three
financial years. All companies have appointed more than 3 directors as members in nomination and
remuneration committee. All companies except SBI have appointed ID chairman as well as ID members but SBI
did not give information about chairman and it has appointed 2 nominees and 2 NEDas members.
All companies have complied minimum requirement of number of NED as member. In 2014-15, 2015-16 chairman of HDFC bank not attended AGM.Suggestions SBI should appoint ID as member and should give information about appointment of
chairman.

84 Indian Journal of Accounting (IJA) Vol. 51 (1), June, 2019
The member of this committee should attend all meetings to look the work of thiscommittee and contribute their suggestions in fixing remunerations of directors.
ConclusionCorporate Governance define the way in which a Corporate Enterprise should be
governed. As per SEBI’s LODR 2015, BOD shall constitute the nomination and remunerationcommittee comprise of at least three directors. The chairperson of the committee shall be anIndependent director. This committee has the power to formulate the criteria for determiningqualification, to fix the remuneration of the directors. Further it has right whether to extend orcontinue the term of appointment of IDs on the basis of the report of performance evaluation ofIndependent directors.References Bahl, H. (2017). Chartered Secretary. 47 (10). 64 Goel, B.B., Goel P., Goel, S. (2014). “Corporate Governance”. Regal Publication, New
Delhi. Nachemson-Ekwall, S. & Mayer, C. (2018). Nomination Committees and Corporate
Governance: Lessons from Sweden and the UK, Retrieved fromhttps://papers.ssrn.com/sol3/papers.cfm?abstract_id=3170397.
SEBI (Listing Obligations and Disclosure Requirements) Regulations, 2015, Gazette ofIndia, Extraordinary 2nd September, 2015.
Sugiarto, I. (2017). The Significance of Good Corporate Governance Principles in theCompany Law of 2007, Mimbar: Jurnal Sosial dan Pembangunan, 33(1), 37-45.
Zraiq, M.A.A. & Fadzil, F.H.B. (2018). The Impact of Nomination and RemunerationCommittee on Corporate Financial Performance, Academy of Accounting andFinancial Studies Journal, 22(3), 1-6.
https://www.hdfc.com/investor-relations/annual-report https://www.hdfcbank.com/aboutus/cg/annual_reports.html https://www.icicibank.com/aboutus/annual.page https://www.sbi.co.in/portal/web/corporate-governance/annual-report.

Indian Journal of Accounting (IJA) 85ISSN : 0972-1479 (Print) 2395-6127 (Online) Vol. 51 (1), June, 2019, pp. 85-90
A STUDY ON QUANTUM OF DISCLOSURE ANDITS ASSOCIATION WITH CORPORATE ATTRIBUTES
(WITH SPECIAL REFERENCE TO PHARMACEUTICAL COMPANIES)
Dr. Sarika Jindal
Dr. Satish Maheshwari
ABSTRACT
This study examines the determinants of corporate disclosure level of pharmaceuticalcompanies in India. Specifically, the study investigates the relationship between threecorporate attributes- size, Profitability, age and extent of disclosure in pharmaceuticalcompanies in India. In the research methodology a sample size of 5 pharmaceutical Indiancompanies has been taken through random sampling. For the study we have collectedsecondary data. The corporate attributes (independent variables) which is used in the studyare firm size, profitability, age and corporate disclosure (dependent variable) wasdisaggregated into corporate disclosure. The data were analyzed using both correlation andmultiple regression analysis. Our empirical results show a significant positive associationbetween firm size, profitability, age and disclosure. Finally the whole research was carried outin a systematic way to reach at exact result. The whole research and findings were based onthe objectives.
KEYWORDS: Corporate Attributes, Corporate Disclosure, Pharmaceutical Companies, EPS._______________
IntroductionAmerican Accounting Association (AAA) defines disclosure as, “The movement of
information from the private domain (inside information) in the public domain. Its ultimate aim isto provide information which is potentially for making economic decisions and which, ifprovided, will enhance social welfare” (AAA 1975 as quoted in Glautier, 1985). The idea ofdisclosure is of extraordinary hugeness to the achievement of the goals of money relatedannouncing. Money related detailing is the correspondence of monetary data of anundertaking to the outer world.
In this era an attempt has been done to analysis the relationship between companyattributes and corporate disclosure of pharmaceutical companies. The selected attributes are-size of a company measured in terms of its market capitalization, age of a company (in years)and EPS (Earning per Share). There are many reasons to believe that no comprehensivestudy has been conducted in India to examine the disclosure practices of Indianpharmaceutical companies. The present study is an attempt to analyze the disclosurepractices of the selected Indian pharmaceutical companies for a period of five years.
Principal, Sapient Institute of Management Studies, Indore, MP, India. Head of Department, Government Commerce College, Ratlam, MP, India.

86 Indian Journal of Accounting (IJA) Vol. 51 (1), June, 2019
Review of literatureChander (1992) analyses that company attributes such as size of the company
measured in terms of net tangible assets and age of the company had a positive and significantassociation with the disclosure score in both the sectors in all the five years of study.
Mahajan and Chander (2007) examined the quantum of disclosure and itsassociation with corporate characteristics such as age, size, profitability, and leverage, listingstatus, shareholding pattern, audit firm and residential status of a company. An index of 90items was prepared and un- weighted disclosure scores were used to compute the quantum ofdisclosure in the company annual reports. Results showed that there was a significantassociation between size, profitability, audit firm and disclosure level.
Singh (2009) made a comparative analysis of the corporate disclosure behavior of thelarge and mid cap companies in India for 1999-00 to 2005-06. Results of the study revealedthat corporate disclosure behavior of large companies was better as compared to mid-capcompanies. He also examined the effect of company characteristics on the quantum ofdisclosure and found that impact of all the seven attributes (total assets, sales, market capital,net profit, age, sectors and listing status) on corporate disclosure was higher in largecompanies as compared to mid-cap companies.
McNally, Eng and Hasseldine (1982) focused on: (a) the importance of items to bedisclosed in annual reports, as perceived by the financial editors and the stock exchangemembers; (b) the disclosure practices of manufacturing companies vis-a-vis perceptions ofexternal decision-makers; and (c) examining the possible association between the disclosurepractices and selected company attributes such as size, rate of return, growth and auditors.The study revealed that the level of actual disclosure by companies was lower than what theprofessional external users perceived to be desirable. They concluded that a significantassociation existed between size and both the level of disclosure and the average score foreach company.
Cooke (1992) examined the relationship between the quantum of disclosure and threecorporate attributes - size, listing status and nature of industry- for 35 Japanese companies.This study was a unique one in the sense that the size of the company was measured in termsof a composite variable i.e., a linear combination of eight alternate indicators of size - capitalstock, turnover, number of shareholders, total assets, current assets, fixed assets,shareholders funds and bank borrowings. He concluded that the level of disclosure waspositively and significantly associated with dl the three explanatory variables - size, listingstatus and nature of industry.1
Lal (1985) examined the disclosure level of 180 manufacturing companies in theprivate sector for the years 1965 and 1975. The study was also made to analyze the effect offour company characteristics, viz., size of assets, margin of earnings, and industry nature onthe quality of disclosure. The regression analysis results revealed that there is a positiveassociation between the quantum of disclosure and size of the company (which is measuredby assets), margin of earnings, industry nature and its relationship with a large industrialhouse. However, the 'size of the company' possessed a better association with the level ofdisclosure than the other three variables.2
Objective of the StudyIt is to examine the association between selected corporate attributes and quantum of
disclosure of selected pharmaceutical companies in India.
1 T. E. Cooke. (1992). The impact of size, stock market listing and industry type on disclosure in theannual reports of Japanese corporations. Accuunriag und Business Research, 23(91), 229-237.
2 J. Lal. (1985). Corpclrnre annual report; Theory ar~dpracticeN. ew h l h i ; Sterling Publishers Pvt. Ltd.

Dr. Sarika Jindal & Dr. Satish Maheshwari: A Study on Quantum of Disclosure and its..... 87
Hypothesis of the StudyH0: There is no significant relationship between the quantum of disclosure and selected
company characteristics.H01: There is no significant relationship between the quantum of disclosure and size of a
company.H02: There is no significant relationship between the quantum of disclosure and profitability
of a company.H03: There is no significant relationship between the quantum of disclosure and age of the
company.Research Design Population of the Study: The present study ‘A study on quantum of disclosure and its
association with corporate attributes ' has been undertaken using a sample of 5 Indianpharmaceutical companies.
Sample of the Study: Under Non Probability sampling convenience samplingtechnique was used for the study.
Period of Study: For the research purpose the period of study considered as selectedpharmaceutical companies from year 2013 – 2018.
Data Source: For the research purpose secondary data was used from annual reportsof selected pharmaceutical companies published on company's website, CMIE Database, library IIM-Indore, Central library DAVV Indore were referred.
Statistical Tools: In the research study following statistical tools were used throughSPSS 20.0 student version: Regression Analysis Descriptive Analysis Independent t-test Correlation Analysis Percentage Analysis
Econometric Models Framework and Description of VariablesThe study mainly analyses the impact on disclosure practices adopted by
pharmaceutical industries of size, Profitability and age of the companies. In this study 5 majorpharmaceutical companies have been consider for study.Scope of the Study
The study includes all pharmaceutical companies. The present study was initiated in2013 and there were 5 pharmaceutical companies included in the study. The scope for furtherresearch can includes other pharmaceutical companies as the sector is very large and thereare other sectors also for which the researcher can conduct study. Also as we have includesdata for only 5 years that can also be scope for researchers.Limitations of the Study
The present study suffers from the following limitations: Annual reports of some of the pharmaceutical companies for some years were not
available. The time constraint is also major limitation as the analysis has been done only for the
year 2013-18. Only 5 pharmaceutical companies has been included in the study which may be faulty
representative.

88 Indian Journal of Accounting (IJA) Vol. 51 (1), June, 2019
Relation between Company Attributes and Extent of DisclosureMany researchers like Lal (1985), Chander (1992), Kohli (1998), Mahajan and
Chander (2007), and Singh (2009) have studied the association of company characteristicsand the disclosure levels of companies. They found positive relationship between majority ofthe attributes and quantum of disclosure of companies. The present paper analyzes theassociation between company attributes and disclosure level of pharmaceutical companies.The selected attributes are- size of a company (measured in terms of its market capitalization),age of a company (in years) and EPS (Earning per Share).Company Attributes and Disclosure
To know the association between various corporate attributes and disclosure level,multiple regression models has been developed by taking companies disclosure index scoresas dependent variable and company attributes (size, age of company and EPS) asindependent variables. The significance of this relationship has been tested by ‘t’-test atvarious levels of significance. Size
Size of the company is measured in terms of market capitalization and it is the mostwidely used measure. Many researchers found a positive association with the size of companyand its disclosure level. The results of size and disclosure for selected companies are given inTable 10.1. Correlation results of companies also given in Table 10.1 which shows that there isa positive correlation in size and disclosure score for most of the companies. Regressioncoefficient (R2) is also higher for most of the companies. The highest regression coefficient is0.64 for market capitalization indicating that 64 percent of the variation in mandatory disclosurescore is explained by size of the company. Data reveals that companies having highcorrelation coefficient. Results of ‘t’ value depict that there is positive association between size(market capitalization) and disclosure scores of all 5 companies as P value <.05 in all cases. Age of Company
Age of company is also an important factor explaining the variations in the disclosurescores of different companies. Companies become aware about the benefits of greaterdisclosure as they get mature (Chander, 1992). Age of a company is measured in terms ofnumber of years from the date of its registration with the company's act 1956 for the purposeof the study. Kohli (1998) and Singh (2009) found in their studies that older companiesdisclose more information than new companies. Chander (1992) also observed that there is asignificant relationship between age of accompany and its disclosure score. EPS
Profitability is measured in terms of Earning per Share (EPS). Results indicate positiverelationship between profitability and extent of disclosure. Chander, 1992 found that thecompanies those earn less profit may disclose less information because they may have fearthat more disclosure may affect their profitability adversely (Chander, 1992). Results ofpharmaceutical companies are given in Table 1. The following regression model has beendeveloped to study the nature of association between selected companies attributes andextent of disclosure:Disclosure = f (Size, EPS, Age of company)Y = a+ b1x1+b2x2+b3x3 where,Y = Disclosure score (dependent variable)a= Intercept and b1, b2, b3 = regression coefficients.X1 =SizeX2= EPSX3= Age of Company

Dr. Sarika Jindal & Dr. Satish Maheshwari: A Study on Quantum of Disclosure and its..... 89
Coefficients Standard Error t Stat P-value correlationMarket capitalization 1.066 0.030 35.568 0.018 0.591EPS 0.738 0.031 24.167 0.026 0.061age 0.421 0.021 20.040 0.032 0.772
Table 1: Regression ResultsObservations 5.000Sum of weights 5.000DF 1.000R² 1.000Adjusted R² 0.999
Findings Correlation Results
The association with corporate characteristics and disclosure of pharmaceuticalcompanies is analyze by regression and correlation model. The result shows that r values formarket capitalization, EPS and age are 0.591, 0.061, 0.772 respectively which shows highcorrelation between disclosure and age and size of the companies, although correlationbetween EPS of the companies and disclosure scores is also positive. Regression Analysis Results
Disclosure scores may be vary due to different company attributes. To know therelationship of company attributes and quantum of disclosure, three company attributes i.e.size, age of company and EPS are studied.
Significant and positive association between size and disclosure exists in allcompanies. As the P value 0.018 which is less than 0.05, thus we reject nullhypothesis and accept alternative hypothesis that there is a significanceassociation between size of the companies and disclosure. Large companiesdisclose more information than small.
Tables present the model summary. The R2 value of disclosure, which indicatesthe explanatory power of the independent variables, is exact 1. This means that100% variation in the dependent variable is explained by the independentvariables variation.
Significant positive association between EPS and disclosure exists in allcompanies. As the P value is, 0.026 which is less than 0.05, thus we reject nullhypothesis and accept alternate hypothesis that there is a significance associationbetween EPS of the companies and disclosure.
Significant positive association between age of the company and disclosure existsin all companies. As the P value is 0.032 which is less than 0.05, thus we rejectnull hypothesis of disclosure and accept alternate hypothesis that there is asignificance association between age of the companies and disclosure.
Multiple regression results show that ‘market capitalization’ has the highest impacton disclosure. Overall the impact of all the selected attributes taken together havemore Impact on disclosure in selected pharmaceutical companies.
References Ahmed K. & Nicholls D. (1994), “The impact of nonfinancial company characteristics
on necessary compliance in developing countries: The case of Bangladesh”. TheInternational Journal of Accounting, 29(1), 60-77.
Ahmed K., (1996), “Disclosure policy choice and corporate characteristics: a study ofBangladesh”. Asia Pacific Journal of Accounting 3(8),183-203.

90 Indian Journal of Accounting (IJA) Vol. 51 (1), June, 2019
Alsaeed, K. 2006, “The association between firm-specific characteristics anddisclosure: The case of Saudi Arabia”. Managerial Auditing Journal, 21, 476- 496.
Cooke, T. E. (1992), “The impact of size, stock market listing and industry type ondisclosure in the annual reports of Japanese listed Corporations”, Accounting andBusiness Research, Volume 22, Issue 87, pp.229-237.
Firth, M. (1979), “Impact of size, stock market listing, and auditors on voluntarydisclosure in corporate annual reports”, Accouting and Business Research, Vol.9,pp.273
Francisco Bravo Urquiza, María Cristina Abad Navarro, Marco Trombetta (2010),“Disclosure theories and disclosure measures”, The Accounting Review, Vol. XXXIX,No. 147, pp.393 – 415.
Mahmood, A. (1999), “The impact of market characteristics on the comprehensivenessof disclosure in monetary reports: associate empirical study”, The Journal ofCommercial Researches, 13(1), 47-58.
Meek, G., Roberts, C. B., & Gray, S. J. (1995), “Factors influencing voluntary annualreport disclosures by U.S., U.K. and continental European multinational corporations”.Journal of International Business Studies (Third Quarter), 555-572.
Ngo Thu Giang va Dang Anh Tuan (2013), “Research on factors which influence indisclosing information of listed companies on the stock market”, Journal of Economicand Development , No.194, August,2013, pp. 24 – 30
Owusu-Ansah, S. (1998), “The impact of company attributes to the extentof necessary disclosure and reportage by listed corporations in Zimbabwe”. TheInternational Journal of Accounting, 33, 605-631.
Wallace, R. S. O., Naser, K., & Mora, A. (1994), “The relationship between thecomprehensiveness of necessary disclosure within the company annual reports andfirm characteristics in Spain”. Accounting and Business Research, 25(97), 41 -53.
Zareski, M. (1996), “Spontaneous Harmonization result of Culture and economicprocess on accounting disclosure Practices”. Accounting Horizons, 10(1), 18-37.

Indian Journal of Accounting (IJA) 91ISSN : 0972-1479 (Print) 2395-6127 (Online) Vol. 51 (1), June, 2019, pp. 91-100
AWARENESS AND IMPACT OF GST AMONGSMALL BUSINESS OWNERS: A STUDY OF MANDSAUR CITY IN M.P.
Dr. Mukesh K. Sharma
Suniti Saini
ABSTRACT
GST (Goods and Service tax) is a visionary step intended towards rationalizing thegiant indirect tax system in India. The implementation of GST is reducing tax burden andenhancing the ease of doing business in the country. The impact of GST has two keysegments weight; one is to the business and second is to the customers who are the actualbearer of tax costs. Indian unorganized sector and portion of industry those who are enjoyingthe exemption will also contribute significantly to the growth of countries GDP. The basicpurpose of conducting the study is to know the awareness level of small businessman towardsGST and to assess the actual impact as they are facing. As it is known that impact will be thereeither on manufacturing or selling but to know the extent of impact and level of satisfactionstudy is conducted. The study is survey based in which data was collected from 50 businessman who are residing in Mandsaur city of MP. The tool used for collection of data wasstructured questionnaire. The results obtained after analysis revealed that businessman areaware about GST implementation and opined that it’s a fair tax system but it requires moreclarity, simplification in procedure because they have to depend on CA’s during the onlinesubmission. The paper had tried to attempt the actual impact of GST and suggestivemeasures have also been provided at the end of study.
KEYWORDS: GST, GDP, VAT, State Tax, Central Tax, Purchase Tax, Entry Tax._______________
IntroductionThe only source of income for the Indian government is the collection of the tax, and
the major source of the tax is indirect tax which is also known as GST, which defines “one taxone nation”. Before 1 July 2017 there were many state taxes imposed on the name on indirecttax like luxury tax, VAT tax, state tax, central tax, purchase tax, entry tax, entertainment tax,taxes on lottery, state cesses and surcharges, and the central taxes like central excise duty,service tax, special additional duty of custom etc are implemented. Imagine the tax burden onthe payer and much calculation needed to be done to pay each tax. This created the situationof perplexity among the merchandisers. The introduction of GST has cleared the formation ofindirect tax by introducing online filling of GST. The other main objective of GST was toremove the cascading effect, though many people argue that this objective has not beenachieved yet. The cascading effect means “tax on tax” which coordinately increase the price ofproduct hence lead to the inflation in the economy.
Assistant Professor, Faculty of Business Management & Commerce, Mandsaur University, Mandsaur,Madhya Pradesh, India.
MBA Student, Faculty of Business Management & Commerce, Mandsaur University, Mandsaur,Madhya Pradesh, India.

92 Indian Journal of Accounting (IJA) Vol. 51 (1), June, 2019
The implication of GST included dual taxation system i.e. Central GST (CGST), StateGST (SGST), Integrated GST (IGST). If the location of supplier and buyer are in same statethen the seller has to collect both CGST and SGST from buyer, both central and stategovernment will agree on the appropriate ration of sharing revenue. This has reduce thecascading effect and made the tax structure more simplified. Rates are implied by governmenton the mutual basic but it does not exceed more than 14%. The tax rate slaps introduced are5%, 12%, 18%, 28%, however alcohol/ liquor, electricity, and petroleum products are notincluded in the GST rates. One of the major reason for not including petroleum into GST is thehuge revenue around 28% income earned by government, imposing of GST will stop theirincome. The same reason is with the exception of GST on liquor, above 50% of the revenue insome states are generated by the sale of the alcohol. Electricity is the necessity for living, so itis required to keep cheap and affordable also some of the political parties may promise toprovide the electricity cheaper may dilute the citizens.
Implication of GST was not an easy task, to make 133 crores people understand aboutthe new system especially where people hesitate to accept changes is the biggest challenge.The listing of the goods and service into specific rates and its explanation has countered themajority of problems. In the initial days the price of many goods and services was increasedwhich created the inflation in the economy. Lack of clarity on the abetments introduced in theeconomy has made the minds more diplomatic. Many businesses still lack the proper ITstructure to create GST invoice and extract required reports it also include lack of propertrained resources and re – skilling of the management, which created extra burden across thesectors. It was difficult for the startup companies to face GST as they were not properly setupin the industry and they were needed to understand the new taxation system. At the end wecan say that GST bought the transparency and wider platform for taxation. Its not easy toremove the corruption from the system but it can be reduced to the certain level.Literature Review Kaur (2018)
The purpose of study was point out the awareness among people about GST, and tofind out the expectations of people after the implementation of GST. The study concluded thatstill people are not well aware about GST and due to lack of proper information they are havingnegative perception towards the act. It also shows the lack of goods and services informationof the responded, not able to identify the slabs implemented. Chouhan et.al. (2017)
The study focused on awareness of 148 small business owners in Rajasthan state. Italso revel the problems faced by the small business owner due to lack of adequate knowledgeand reliefs provided in the act. The major problems were that customer refuse to pay GST,which create a problem while submitting the taxation, other problem arises due to the inclusionof technology in the process has created the perception of difficult tax among the responded.The levels of awareness of the responded were low and moderate and majorly not willing tosupport the act. Banik and Das (2017)
The study revealed the challenges to be faced by India Economy after the implicationof GST, it throw light on the comparison of GST with previews Tax system, there were 31taxes including sales tax, state tax etc, which are now turned into CGST, IGST, SGST makingtax structure more complicated. The inclusion of technology in filling the GST has made theneed to add trained employee for this purpose. The change in GST rate made the smallvenders and businessman more confused about the act. The study conclude that GDP will falldown due to the introduction of unplanned tax system thus its needed to more simplification inthe act.

Dr. Mukesh K. Sharma & Suniti Saini: Awareness and Impact of GST among Small Business..... 93
Kumar (2017)The study analyzed the previous Indirect tax system and GST, briefly explained the
complete concept of the GST, its rate and its comparison with the previous tax structure, thepresent GST system has removed many hurdles while filling the taxation. The examplesprovide more clarification on how GST is levied on the goods and how it is reducing the burdenon small venders and businessman. The study concludes that the GST is easier than earliertax system; it will provide more benefit to the manufactures and thus increase the competitionin market. Mishra (2018)
The study provided glimpse of the rates. It throw glance on the impact of GST, onpharmacy, agriculture, textile, mobile and accessories, telecommunication sector, real state,FMCG, automobiles, banking, financing. The research paper concludes that the implication ofsingle tax system will attract more manufactures to get engage in the sector. The individualswill also get benefit as the prices of the products will decrees and consumption will increasewhich will lead to the increase in GDP. Increased GDP will attract the foreign investment whichwill directly or indirectly create the employment opportunity. Kumar and Sarkar (2016)
The study described the history of GST from International to National level. It alsoprovided brief analysis of previous and present taxation system, and its other supplementarytaxes with facts and figures. The facts presented in the study shows that how the GST isbeneficial to customers, industries, exporters, and the Economy. The study conclude that GSTshould be implemented as soon as possible as delay in the implication may delay may providenegative impact in the economy. Bhuyan and Nayak (2017)
The study accommodated the various advantages of implementing GST, saysremoving of cascading effect, increasing the efficiency of logistics, regulating the unorganizedsector etc. The paper on the basis of facts and figures shows the impact of GST on telecom,cement, banking and insurance, airlines, E-commerce, FMCG, technology sectors. The studyconclude that the GST will provide the positive impact on economy and will increase thegrowth of GDP, and will generate the employment, but it will show the negative impact on theservice sector as the rates of GST in the service sector has increased. GST will bringinnovation, accountability, and transparence in the tax structure.Research Gap
From the literatures it is clear that GST is an emerging issue for the research in thesubject of economy. At Macro level many study have been conducted but at micro level andsemi urban area still no research is carried out. Keeping in view, the study attempts to identifythe level of awareness and impact of GST among the small business owners in the Mandsaurcity of Madhya Pradesh.Objectives of Study To identify the awareness of GST among the business owners residing in Mandsaur city. To assess the impact of GST among the business owners residing in Mandsaur city.Research Methodology
The study is descriptive in nature where small business owners were selected asrespondents who are dealing in various businesses in the Mandsaur city. The chapter dividedinto three parts:

94 Indian Journal of Accounting (IJA) Vol. 51 (1), June, 2019
Sources of DataPrimary data were collected primarily through direct administration of the
questionnaire. The study uses secondary data to support and substantiate primary data andalso to form a strong theoretical base. The secondary data were collected from Researchpaper, SSRN, shodhganga, Local bodies, research journals, newspaper, articles, GST portals,working papers etc. Sample Size: 50 Small business owners. Sampling Technique: In Non Probability method of sampling, convenient technique
was applied.Part A
Demographic CharacterizesGender Frequency in Percentage Male 100 % Female 0%Age 18 – 30 12% 30 – 50 54% 50 above 32%Literacy Level Illiterate 0% Up to Sr. Secondary 36% Graduation 52% Post Graduation 12%Occupation Farmer 0% Businessman 96% Job 4% Daily Wages 0% Others 0%Monthly Family Income Less than Rs 5000/- 4% Rs 5000 – 15000 14% Rs 15000 - 30000 34% Rs 30000 and above 48%Religion Hindu 42% Muslim 12% Christian 6% Sikh 16% Jain 20% Any other 4%Type of Area Urban 96% Semi urban 0% Rural 4% Remote area 0%Nature of Family Joint family 36% Nuclear family 64%
Source: Computed (Figures in Percentage)

Dr. Mukesh K. Sharma & Suniti Saini: Awareness and Impact of GST among Small Business..... 95
Demographic CharacteristicsA survey conducted on 50 people to find of the demographic character of responded. It
was found that out of 50 responded 100% of the responded are male. Around 12% ofresponded are of the age of 18-30 years, 54% of the responded are of the age 30 – 50 yearsand 34% of the responded are of 50 years or above. About 34% of the responded are literateup to secondary school, 52%of the responded are graduated and 12% of the responded arepostgraduate, this shows that the education level is good in Mandsaur district. 96% of theresponded are businessman whereas 4% of the responded are engaged in job. 4% of theresponded has monthly family income less than 5000, about 14% of the responded earnincome from 5000-15000 per month, 34% of the responded earn the monthly income from15000-30000, the majority of the responded i.e. 48% earn monthly income equal to or above30000 which clearly show that the income level of the respond are high.Part B
How many responded has GST awareness Frequency in Percentage Yes 100 % No -What was the source of awareness? Friends/ family 22% Media 52% Internet 26% Teacher - Others -Does GST is burden for people? Yes 18 No 82Is GST is a fair tax system? Yes 48% No 16% Don’t -Is available legislation is satisfactory in relation to GST? Yes – satisfactory 30% No – need more clarity 70%GST is easier than early tax system. Yes 88% No 12%What kind of tax GST is? Indirect tax 100% Direct tax -Who is the Head of GST council of India? Frequency in percentage. Mr. Narender Modi 4% Dr. Rajeev Kumar 6% Mr. Arun Jaitely 26% None 64%Does the business is registered under GST? Yes 92% No 8%

96 Indian Journal of Accounting (IJA) Vol. 51 (1), June, 2019
Do the have Knowledge about GST online portal? Yes 100% No -Does the available legislation in relation to propose GST issatisfying? Yes – satisfactory 18% No – Need more clarity 82%Does the respondents current software equipped is capableenough to handle the proposed GST? Yes 92% No 8% Not applicable -Need assistance of lawyer or CA while filling the tax? Required 60% Not required 40%
The tabulation presentation shows that the responded have complete knowledgeabout the existence of GST and its embedment in the bill passed in the parliament, whichindicate that the responded are well aware of the changes in the tax implementing method.The next table shows that the major source of knowledge is from media and then Internetwhich clearly confine that the people are more affected by media and internet which is thefastest and easy source of information to the public. The media influence the most to theresponded .In the third record it is shows that majority of the responded accept that GST is notburden on Income it has reduced the major drawbacks of the previous tax filing system.Whereas some responded have the opinion to add more abetments in the present law toreduce some other effecting factors. The changes in the system of filing tax have given somerelief to the responded. Record four shows that the majority of responded states that theimplementation of GST is a fair tax and is acceptable by the responded, it indicate that theresponded has accepted the change in the system and they welcome, whereas someresponded are not satisfied with the implementation of GST and need more changes in thepresent tax system. Record four shows that the majority of responded i.e. 70% wants to needmore clarification in the present GST legislation, which shows that the GST legislation is acomplicated concept which required more clarification and more relaxed abstracted among theresponded. Whereas 30% of the responded are satisfied with the legislation, doesn’t ask forfurther clarification.
The record six indicates that 88% of the responded accepts that the implication of GSTis much better than the earlier tax system, the filling and maintenance of the taxation is mucheasier, reliable and flexible. It reduces the extra efforts and paper work. Only 12% of theresponded feel that the GST is complicated and is not readily acceptable without muchabetment. Record seven shows that 100% of the responded are clear that the GST is Indirecttax, which indicates that each responded has the perfect knowledge about what the kind ofGST taxation is. There are two types of taxation system in the country, the direct tax andindirect tax, the implication of GST is on the place of Indirect tax which is filed by theorganization. The Record shows that 92% of the responded are registered under GST, whichindicates that there is majority of tax depositor in the Mandasur district and business isconducted within the rules of government. Only 4% of the responded are not registered underGST due to new entry in the market or change/ expansion in the business. The registration ofbusiness is done under the rules and regulation provided by the government. Results indicatedthat 100% of the responded has knowledge about the GST online portal through media,internet, friends also know the embedment, inclusion of new methods to file the GST and to

Dr. Mukesh K. Sharma & Suniti Saini: Awareness and Impact of GST among Small Business..... 97
get the reimbursement from government. GST online portal has reduced the paper work andmade the filing of taxation easy. Government declare the last date via sources, keeping inmind the dates, filing the tax and take the advantage of reimbursement. In short they werecompletely satisfied with the introduction of the new changes in the legislation, whereas 82%of the responded where in doubts regarding the introduction of the legislation and ask for moreclarification and establish necessary abetments for ore relaxation in the slaps and return.Part C
Reduction of corruption in the economy. Frequency in Percentage Highly Agreed 12% Agreed 62% Neutral 18% Less agreed 8% Fully Disagreed - Total 100%GST legislation is satisfactory Highly Agreed - Agreed 42% Neutral 28% Less agreed 26% Fully Disagreed 4% Total 100%Ease in filing of GST online. Highly Agreed 38% Agreed 38% Neutral 16% Less agreed 8% Fully Disagreed - Total 100%Rate implication on the occupation satisfactory Highly agreed 18% Agreed 18% Neutral 14% Less agreed 46% Fully Disagreed 4% Total 100%Benefit of the government schemes. Highly agreed - Agreed 18% Neutral 36% Less agreed 46% Fully Disagreed - Total 100%Applied existence law is fairly applied. Highly agreed 10% Agreed 32% Neutral 10% Less agreed 44% Fully Disagreed 4% Total 100%

98 Indian Journal of Accounting (IJA) Vol. 51 (1), June, 2019
Present system is beneficial then early tax system. Highly agreed 30% Agreed 34% Neutral 16% Less agreed 12% Fully Disagreed 8% Total 100%Necessary amendments should be introduces timely in thelegislation Highly agreed 60% Agreed 32% Neutral 8% Less agreed - Fully Disagreed - Total 100%Government is taking corrective measures for the flexibility in thecurrent taxation system. Highly agreed 8% Agreed 32% Neutral 40% Less agreed 16% Fully Disagreed 4% Total 100%Inflation cost reduced due to GST. Highly agreed 6% Agreed 32% Neutral 12% Less agreed 38% Fully Disagreed 12% Total 100%Present tax system moved the pace of economy growth. Highly agreed 30% Agreed 52% Neutral 10% Less agreed 6% Fully Disagreed 2% Total 100%GST affected the income. Highly agreed 48% Agreed 12% Neutral 24% Less agreed 8% Fully Disagreed - Total 100%Implementation of GST increased the documentary procedure. Highly agreed 10% Agreed 50% Neutral 4% Less agreed 34% Fully Disagreed 2% Total 100%

Dr. Mukesh K. Sharma & Suniti Saini: Awareness and Impact of GST among Small Business..... 99
Implementation of GST reduced the manual work. Highly agreed 44% Agreed 16% Neutral 8% Less agreed 24% Fully Disagreed 8% Total 100%GST made it mandatory to provide the bill to customer. Highly agreed 32% Agreed 28% Neutral 36% Less agreed 4% Fully Disagreed - Total 100%E – WAY bill is beneficial for business. Highly agreed 32% Agreed 28% Neutral 28% Less agreed 8% Fully Disagreed 4% Total 100%
Findings “GST has reduced the corruptions” support the statement by 62% vote. GST procedure required CA consultancy as 60% of the respondents are not train
enough to comply all the requirements. 82% respondents are in favour of GST that it’s not a burden. 42% of the responded are less happy with the implication of rate. Only 18% of the
responded are happy with the implied rate. 82%, responded required more clarity in the legislation. GST was not successful in reduction the inflation in the economy, around 50% of the
majority considers that GST has failed in reducing the inflation. A majority of around 80% of the responded are in the favor of the statement that GDP
has increased the pace of economy growth. Introduction of GST has increased the documentary process whereas it has reduced
the manual work by providing the online registration in the filing process of tax. Morethe 50% of the responded answered that GST has increased in their documentationas for each transaction they need proofreading, whereas introduction of online filling oftax has reduced their manual work as they need to submit the framed form withrequired information.
In the survey it was detected that 60% of responded find the E- way bill beneficial forbusiness, which has reduced the documentation process as state wise documentationhas been eliminated, and the system is user-friendly and it is easy to generate the bill.
Suggestions GST council should work towards simplification of GST procedure. The rates implemented should be modulated. Training session for GST should be conducted at regular basis especially in the semi
urban areas.

100 Indian Journal of Accounting (IJA) Vol. 51 (1), June, 2019
ConclusionIn the era of globalization there was the need for the powerful and systematic tax
structure for competing India at International level. The GST will not only bring thetransparency but also it will promote the ease of doing. Earlier every state used to have ownlevied tax rates which was complicated and increased the price of the goods by cascadingeffect which hindrance the foreign direct investment also. In the study the responded were wellaware of the GST act and the rates implemented on the products but the small businessmanwere not much satisfied with rates criteria. The new ordinance of online filing the tax has savedmuch of the time and reduced paper work which was appreciated by responded. 62% of theresponded agreed that there was reduction in corruption due to introduction of GST ineconomy. Majority of responded felt that GST will for sure increase the pace of the economygrowth of the country but it requires more clarity as suggested by the study. GST councilshould continue with efforts to boost Indian economy.References Banik S. Das A. (2017). GST in India: Impact and challenges. IOSR Journal of
Business and Management (IOSR-JBM) Volume 19, Issue 12, 07-10. Chouhan V. & Shakdwipee P.et.al (2017), Measuring Awareness about
Implementation of GST: A Survey of Small Business Owners of Rajasthan. PacificBusiness Review International, Volume 9 Issue 8,116-125.
Kaur H. (2018). Public Awareness, Knowledge and Understanding of GST in India.International Conference on Management and Information System, 63-67.
Kumar A.& Nayak R. (2017), GST A New Tax Reforms in India- ImplementingTowards Sustainable Development of the Economy, International journal of creativethoughts, Volume 5, issue 4, 2350-2355.
Kumar P. & Sarkar S.(2016), Goods and service tax in India: problems and prospects,Asian journal of management research, Volume 6 Issue 3, 504-513.
Kumar P. (2017) concept of goods and services tax (gst) in India, Airo NationalResearch Journal, Volume XII,
Mishra N. (2018), Impact of GST on Indian Economy. International journal of basic andapplied research, 385-389.

Indian Journal of Accounting (IJA) 101ISSN : 0972-1479 (Print) 2395-6127 (Online) Vol. 51 (1), June, 2019, pp. 101-106
FDI POLICY IN INDIA: EMERGING ISSUES
Dr. Arvind S. Luhar
Dr. Shama Shah
ABSTRACT
The Article features the ongoing changes and alterations in FDI Policy in India. TheDepartment of Industrial Policy and Promotion (DIPP) had made certain changes to theForeign Direct Investment (FDI) Policy of 2017 issued on Press Note 1 dated 23rd January2018. The proposed alterations were to be powerful from the date of the FEMA notice. TheReserve Bank of India (RBI) has now issued the Foreign Exchange Management (Transfer orIssue of Security by a Person Resident Outside India) (Amendment) Regulations, 2018 [FEMA20(R)(1)] dated 26th March, 2018 changing FEMA 20(R) dated 07th November, 2017.1
KEYWORDS: DIPP, FDI, FEMA, Industrial Policy, PROI, NBFCs, CICs, SBRT._______________
IntroductionForeign Direct Investment in India is now accomplishing fast development with vote
based system, request and demography looking forward towards the greater and better future.The Department of Industrial Policy and Promotion (DIPP) as a managing office of ForeignDirect Investment assumes a significant job going about as the center of agreement forworldwide organizations hoping to put resources into India under the initiative of SecretaryRamesh Abhishek. DIPP has set new benchmarks in pulling in FDI in India. In the course ofthe last couple of successive years there have been some extremely wide clearing andprofound effect changes in the business and financial condition in the course of recent years,huge numbers of which have additionally had a solid social effect. While a few changes couldbe viewed as political, there are numerous progressions that have happened fundamentally inlight of the fact that the administration of the day bit the projectile. These were long late andjust couldn't be kicked any further not far off – to put it briefly, "the opportunity had arrived".
According to Department of Industrial Policy and Promotion (DIPP), the total FDIinterests in India in the midst of 2017-18 stayed at US$ 44.86 billion, demonstrating thatorganization's push to upgrade effortlessness of cooperating and loosening up in FDIbenchmarks is yielding results. Data for 2017-18 shows that the organizations division pulledin the most raised FDI esteem inflow of US$ 6.71 billion, trailed by media transmission – US$6.21 billion and PC programming and hardware – US$ 6.15 billion. Most starting late, the totalFDI esteem inflows for the extended length of March 2018 reached US$ 3.31 billion. In themidst of 2017-18, India got the most extraordinary FDI esteem inflows from Mauritius (US$15.94 billion), trailed by Singapore (US$ 12.18 billion), Netherlands (US$ 2.80 billion), USA(US$ 2.10 billion), and Japan (US$ 1.61 billion).2
Associate Professor in Accountancy, I.Y. College, Mumbai, Maharashtra, India.Chairman, Board of Studies Accountancy, University of MumbaiChairman, Indian Accounting Association, Thane ChapterMember, First Court, Central University of South Bihar.
Visiting Faculty in Finance, PTVA Institute of Management, Mumbai, Maharashtra, India.

102 Indian Journal of Accounting (IJA) Vol. 51 (1), June, 2019
DIPP Secretary Ramesh Abhishek has said on Economic Times at dated eighth June,2018, that Foreign Direct Investment in India expanded to USD 61.96 billion. In 2017-18 FDIinflows remained at USD 60 billion in the past financial. He additionally said amid the fouryears of the Modi government, remote inflows hopped to USD 222.75 billion from USD 152billion in the past four-year time frame. Nonetheless, as per an UNCTAD report, outside directspeculation (FDI) to India diminished to USD 40 billion in 2017.3
Recent Changes and Emerging Issues in FDI Policy of IndiaIt is fundamental to include that even while in the meantime the Standard Operating
Procedures (SOP) for FDI supports is set up, there is a little information in the overall publicspace about the productive supports dealt with through the SOP, beside sporadic openarticulations by the Department for Industrial Policy and Promotion (DIPP) and the Departmentfor Economic Affairs (DEA). Nothing is known, for example, if any supports have happened inthe Telecom, Media, Pharmaceuticals, Private Security Services or the residuary budgetaryorganizations region. In that limit it is difficult to pass judgment on whether the structure hascontinued ahead to improve things or not. FDI estimations as far back as nine months of themoney related year exhibit an incredibly controlled improvement in FDI, which could be a directresult of various full scale/overall elements and not by any means associated with FDI Policyitself or its progressions.4
In detail the key changes according to FEMA 20(R)(1) have been outlined as beneath: Outside Interest in Contributing Organizations, NBFCs and Core Investment
Companies (CICs) FDI in (I) contributing organizations not enrolled as non-banking money related
organizations (NBFCs) with the RBI and (ii) Core speculation organizations(CICs), both occupied with the movement of putting resources into the capital ofother Indian substances ought to require earlier Government endorsement.
FDI in contributing organizations enrolled as NBFCs with the RBI will be under the100% programmed course.
Joint Audit of Investee CompaniesWhere a Person Resident outside India (PROI) who has made remote endeavor,
shows a particular evaluator/survey firm with an overall framework, by then the audit of theIndian investee association will be endeavored by at any rate two examiners not forming bitof a comparable framework. The evaluator of an Indian investee association appointed by aremote budgetary authority, just like a bit of an all-inclusive social event, would need to workcommonly nearby another inspector who isn't a bit of a comparable framework. FDI in Air Transport Services
Existing Regulations Amended RegulationsAutomatic route upto 49%(100% forNRIs and OCBs)
100% FDI allowed as follows: Automatic route up to 49% Government route beyond 49%100% FDI under automatic route for NRIs and OCBs
Beyond 49% under the Government course, the informed guidelines have changed theguidelines to permit FDI past 49% under Government course. FDI in Air India Limitedpermitted under endorsement course, subject to the accompanying conditions:
FDI not to surpass 49%, either legitimately or in a roundabout way; Substantial proprietorship and powerful control will keep on being vested in Indian
Nationals.

Dr. Arvind S. Luhar & Dr. Shama Shah: FDI Policy in India: Emerging Issues 103
FDI in Construction DevelopmentTownships, Housing, Built-up Infrastructure and Real Estate Broking:Another provision embedded, which states that land broking administrations don't add
up to land business and 100% outside venture is allowed under the programmed course. FDI in Single Brand Retail Trading (SBRT)
Existing Regulations Amended Regulations100% FDI allowed as follows: Automatic Route upto 49% Government route beyond 49%
100% FDI under Automatic Route
Key Changes in Conditions Related to Single Brand Retail Trading (SBRT) are asfollows:
For the underlying five years, steady sourcing by abroad organizations, includingtheir gathering organizations for the particular brand will check towards theobligatory 30% neighborhood sourcing responsibility.
The prerequisite of permit understanding between brand proprietor and speculatorhas been evacuated.
A Committee to be shaped under the Chairmanship of Secretary, DIPP, withagents from NITI Aayog concerned Administrative Ministry and free specializedexpert(s) to analyze the case of candidates of the items being in the idea of"condition of-workmanship" and "front line" innovation, where nearby sourcing isbeyond the realm of imagination and give suggestions for such unwinding.
The following paragraphs have been deleted: An Indian producer is allowed to sell its very own marked items in any way, i.e.,
discount, retail, including through web based business stages; The Indian maker would be the investee organization, which is the proprietor of
the Indian brand and which makes in India, as far as esteem, at any rate 70% ofits items in house, and sources, at most 30% from Indian makers.
FDI in PharmaceuticalsThe meaning of restorative gadgets revised in the guidelines and its reference to
Drugs and Cosmetics Act expelled. FDI in Power Exchanges
Outside Institutional Investor/Foreign Portfolio Investor allowed contributing evenunder the essential course (past just allowed under optional course) inside the general top of49% in power trades enlisted under the Central Electricity Regulatory Commission (PowerMarket) Regulations, 2010. Others
Issue of capital instruments under the accompanying circumstances presentlyallowed under the programmed course, gave the segment is under theprogrammed course: − Swap of capital instruments (allowed under the currentguideline); − Import of capital products/hardware/gear (barring second-handapparatus); or − against pre-usable/pre-joining costs (counting installments oflease and so on.).
Government endorsement to be gotten given the area is under the Governmentcourse.
The Press Note accommodated certain FDI proposition from nations of worry to beinspected by Competent Authorities, i.e., DIPP/Nodal AdministrativeMinistries/Departments. Be that as it may, a relating change has not been told inFEMA 20(R)(1).

104 Indian Journal of Accounting (IJA) Vol. 51 (1), June, 2019
Foreign Direct Investment (FDI) in India is depended upon to turn out to be basicallyfollowing the use of progressing Government of India (GOI) exercises, including the Goodsand Services Tax (GST) related changes, authorizing and execution of the Insolvency andBankruptcy Code (IBC), demonetization, and other straightforwardness of cooperatingchanges took off starting late by the central government. These progressions have helpedIndia's image as a favored objective for outside endeavor, with various parts being totally opento remote examiners for making hypotheses without any imprisonments. These progressionsrealized India, for the plain first time, figuring in the best 100 in the World Bank's'Effortlessness of Doing Business' overall rankings, on the back of kept up business changesby the Narendra Modi-drove government. The World Bank's report furthermore sees India asone of the fundamental 10 improvers in a year back's examination, having completed changesin eight out of 10 'Cooperating's pointers. On the "division to edges metric," India's score has inlike manner seen a colossal skip, which reflects upgrades in India's business organization inthe latest year itself. The best in class outside direct hypothesis system (FDI course of action)2018 presents another such opportunity to moreover bolster monetary pro certainty.5
This highlights some of the key changes that may be considered to the existing FDI policy: Real Estate Business: Starting at now, the FDI procedure portrays a 'land business'
as "overseeing in land and unfazed property with the end goal of obtaining advantageor winning pay ". Regardless, the articulation "overseeing in land and resolute propertywith the end goal of getting advantage or obtaining pay therefore" has not beendescribed in the FDI procedure. It is as needs be unclear with reference to whether asporadic trade of offer of fearless property by an outside had and controlledassociation whose crucial dissents under the update of connection does not deal inland and courageous property, would be proportionate to a land business. The term'overseeing' may be extended just to activity that is in the traditional course ofbusiness for an association i.e., permitted by the basic articles stipulation of the updateof relationship of such an association. Along these lines, it is suggested that theDepartment of Industrial Policy and Promotion (DIPP) adjusts the FDI system to clearup that an adventitious idea of passionate property by an 'outside asserted' and'remote controlled' Indian association, busy with a development under the customizedcourse whose rule objects does not oversee land and consistent property, would notbe proportionate to be busy with the 'Land business'.
‘E-commerce Entity’: Presently, it isn't clear whether an association combined under theCompanies Act 1956 or the Companies Act 2013, asserted and constrained by a manoccupant in India, having tied down outside endeavor of under 50 percent (which wouldnot qualify as a web business substance under the FDI Policy) can shoulder on the stockbased model of electronic business. The DIPP may address the FDI way to deal with lightup in the matter of whether an association that is guaranteed and constrained by a manoccupant in India and completing a stock based model of electronic business is permittedto have remote hypothesis of less than 50 percent of its capital.
Sale of Intangible Goods and Services: DIPP may correct the FDI Policy to clear upthat the FDI Policy just limits offer of bundled product and endeavors throughelectronic business practices and not an unadulterated idea of organizations as a staysingular meander. A sensible significance of 'advantage' should be given in the FDIway to deal with decide whether a course of action of tricky product online would beconsidered as 'game plan of organizations' or 'Closeout of Intangible items'.
Insurance Sector Reforms: In perspective on the current FDI Policy, FDI in aconstrained risk organization (LLP) that is locked in or proposed to take part in areaswhere 100 percent FDI isn't allowed, for example, the protection segment business,may not be reasonable under the current FDI Policy as FDI in a LLP is permitted just

Dr. Arvind S. Luhar & Dr. Shama Shah: FDI Policy in India: Emerging Issues 105
in those divisions where 100 percent FDI is permitted under the programmed course.As of late, the Insurance Regulatory and Development Authority (IRDA) told theInsurance Regulatory and Development Authority (Investment by Private Equity Fundsin Indian Insurance Companies) Guidelines 2017 wherein private value finances thatpropose to contribute as "advertisers" in the Guidelines are disallowed from puttinglegitimately in an Indian insurance agency and the venture needs to directed by meansof a unique reason vehicle (SPV). The Guidelines necessitates that the SPV be eitheran organization enlisted under the Companies Act, 2013 or a LLP enrolled under theLimited Liability Partnership Act, 2008.In perspective on the rules, "outside Investment in protection part through use of LLPs
ought to be explicitly allowed subject to the rules discharged by IRDA" Secondly, the FDIapproach viably applies the equivalent 49 percent programmed course top for FDI in aninsurance agency and middle people, for example, a protection merchant, regardless ofinsurance agencies and protection specialists undertaking various exercises, and insuranceagencies being liable to more prominent examination. Protection agents represent theircustomers and not for insurance agencies and have a guardian obligation towards theircustomers. Likewise, comparative FDI treatment of an insurance agency getting and contributingopen assets and a protection intermediary is neither justified nor required. DIPP ought toconsider changing the FDI approach to accommodate 100 percent FDI for protection dealers.Government Initiatives In January 2018, Government of India enabled outside carriers to put resources into
Air India up to 49 percent with government endorsement. The speculation can'tsurpass 49 percent straightforwardly or by implication.
No government endorsement will be required for FDI up to a degree of 100 percent inReal Estate Broking Services.
In September 2017, the Government of India requested that the states center aroundfortifying single window freedom framework for optimizing endorsement forms, so as toexpand Japanese interests in India.
The Ministry of Commerce and Industry, Government of India has facilitated theendorsement component for remote direct venture (FDI) recommendations by gettingrid of the endorsement of Department of Revenue and ordering freedom of allproposition requiring endorsement inside 10 weeks after the receipt of utilization.
The Government of India is in chats without breaking a sweat remote direct venture(FDI) in barrier under the programmed course to 51 percent from the current 49percent, so as to give a lift to the Make in India activity and to create work.
In January 2018, Government of India permitted 100 percent FDI in single brand retailthrough programmed course.
Recent Investment and DevelopmentsIndia emerged as the top recipient of Greenfield FDI Inflows from the Commonwealth,
as per a trade review released by The Commonwealth in 2018.Some of the recent significant FDI announcements are as follows:
In June 2018, Idea's intrigue for 100 percent FDI was affirmed by Department ofTelecommunication (DoT) trailed by its Indian merger with Vodafone making VodafoneIdea the biggest telecom administrator in India.
In May 2018, Walmart gained a 77 percent stake in Flipkart for a thought of US$ 16billion.
106 Indian Journal of Accounting (IJA) Vol. 51 (1), June, 2019
In February 2018, Ikea declared its arrangements to contribute up to Rs 4,000 crore(US$ 612 million) in the territory of Maharashtra to set up multi-group stores andexperience focuses.
In November 2017, 39 MoUs were marked for speculation of Rs 4,000-5,000 crore(US$ 612-765 million) in the province of North-East area of India.
In December 2017, the Department of Industrial Policy and Promotion (DIPP)endorsed FDI proposition of Damro Furniture and Super Infotech Solutions in retailsegment, while Department of Economic Affairs, Ministry of Finance affirmed two FDIrecommendations worth Rs 532 crore (US$ 81.4 million).
The Department of Economic Affairs, Government of India, shut three outside directspeculation (FDI) recommendations prompting an all-out remote venture worth Rs24.56 crore (US$ 3.80 million) in October 2017.
Kathmandu based combination, CG Group is hoping to contribute Rs 1,000 crore (US$155.97 million) in India by 2020 in its sustenance and drink business, expressed Mr.Varun Choudhary, Executive Director, CG Corp Global.
International Finance Corporation (IFC), the speculation arm of the World Bank Group,is intending to contribute about US$ 6 billion through 2022 of every few supportableand sustainable power source programs in India.
ConclusionsThe ammendment including changes identified with advancement of different
segments, viz. SBRT, Air Transport Services proposed vide the Press Note are presentlycompelling. The hotly anticipated relaxations, particularly in SBRT, are a positive change andcould upgrade outside inflows into India. To reason that, the FDI strategy 2018 presents agreat chance to ride on the ongoing flood of changes started by the Modi government. It istrusted that FDI strategy 2018 will be financial specialist neighborly and energize remoteinterests in India. The Prime Minister Narendra Modi has repeated numerous a period thatIndia is prepared for business and open to speculations and his plan of "change, perform,change has just observed India draw in uncommon dimensions of FDI. With nationalobjectives set a lot higher and further changes in the pipeline to make India a significantlyprogressively alluring goal for FDI, the street ahead appears to be relentless for resurgentIndia.6
References1. Press Note Issuance 1 dated 23rd January, 2018(notified under the Foreign Exchange
Management Act (FEMA) on March 26, 2018).2. FDI in India rises to $61.96 billion in 2017-18: Government PTI | Economic Times
dated 8th June, 2018.3. Economictimes.com dated 8thJune, 2018.4. Tax Insights from India Tax & Regulatory Services dated 4th April, 2018.5. Press Notes 5 dated 24th June, 2016; Press Note 6 dated 25th October, 2016; Press
Note 1 dated 20th February, 2017.6. Secretary Ramesh Abhishek, Department of Industrial Policy and Promotion, Invest in
India, e-Journal Pg. No. 23.

Indian Journal of Accounting (IJA) 107ISSN : 0972-1479 (Print) 2395-6127 (Online) Vol. 51 (1), June, 2019, pp. 107-112
A STUDY ON IMPACT OF MERGER OF CMC ONFINANCIAL PERFORMANCE OF TCS
Ms. Dhartiben P. Rami
Dr. Kamini ShahProf (Dr) Sandip Bhatt
ABSTRACT
With the changing environment, many different tactics have been adopted bycorporate sector to remain effective and to surge ahead in the global corporate world. By theway of mergers and acquisitions, companies can achieve significant growth in their operations,minimize their expenses to a considerable extent and also competition is reduced becausemerger eliminates competitors from the industry. In this research paper, researchers haveexamined the impact of merger TCS and CMC. CMC was a subsidiary company of TCS. Forbetter harmony of their business operation, TCS decided to merge its Business with CMC.Toanalysis the impact of the merger of TCS and CMC, ratio analysis and paired t-test method isused. Reason to examine this merger is to know whether it is beneficial enough for TCS or not.The study reveals that the TCS has choose befitted partner to merger with as financialperformance of TCS was improved post-merger in terms of profitability, liquidity and per shareperformances except for Earning retention as it was declined post-merger.
KEYWORDS: Financial Performance, Merger, Paired t-test, TCS, CMC._______________
IntroductionCorporate world always tries to enhance their business by either internally expanding
their operations, establishing new units or externally by merger and acquisition, joint venturesand takeover for corporate restructuring. Merger is most viewed option in India to strengthencompany’s position among its competitors and to increased long term profitability. Merger islooked as an immediate mode for external growth in the globalisation. Merger and acquisitionare the corporate approach that involves purchasing, selling or combining different companieswith an aim to obtain rapid growth. But decision on merger and acquisition is not that easy totake, it involves some fact such as current status of business, present market scenario, threatsto the business and future opportunities. In India, amalgamation of business operation has twopopular classifications. Amalgamation in nature of merger Amalgamation in nature of purchase
In this research paper, researchers have examined merger between TCS and CMC.To understate it, first one must have information about concept of merger and its classification.
Research Scholar, Department of Business Studies, Sardar Patel University, Vallabh Vidhyanagar,Gujarat, India.
Research Guide, Associate Professor & Corresponding Author, P. G. Department of Business Studies,Sardar Patel University, Vallabh Vidhyanagar, Gujarat, India.
Head, Department of Business Studies, Sardar Patel University, Vallabh Vidhyanagar, Gujarat, India.

108 Indian Journal of Accounting (IJA) Vol. 51 (1), June, 2019
Concept of MergerMerger is identified as a corporate strategy to combine different companies into single
entity of a company in order to combine their business operations. In simple way, merger canbe defined as a mean unification of two market players into one single entity. Following is theclassification of merger. Horizontal Merger involves combination of two firms having same industry, product or
service and market. Vertical Merger involves two firms operating at different level within same industry’s
supply chain to combine their operation. Conglomerate Merger involves firms which have different business operation from
each other. Congeneric Merger involves firm having same industry but have different products or
services. Market Extension involves firms having same industry, same product but in different
marketThere are more classifications of merger from legal prospective such as short form
merger, statutory merger, subsidiary merger, merger of equals etc.Payment of Merger and Acquisition Via purchase of assets of company Via exchange of shares for assets of company Via purchasing common shares of company Via exchanging shares of purchasing company to shares of selling companyWhy Companies Goes for Merger and Acquisition To get benefits of financial synergy such as low cost of capital To target companies which are under valued To get economies of scale To improve the performance of company To get accelerate growth of market To diversify product and market for high growth To get tax benefits To redesign strategies and technological change To diversify risk To enhance reputation To reduce competition To get access to new brands of marketReason Why a Merger Fails If a merger is poor strategic fit as if it has wide difference between objectives and
strategic of company, a merger fails. If planning and design of integration is improper or faulty, it can lead to failure of
merger. If due diligence is inadequate, it leads to failure of merger because it is the crux of the
entire strategy. If company has too much optimistic approach for project, it can leads to bad
decision making which ultimately causes failure of merger.

Ms. Dhartiben P. Rami, Dr. Kamini Shah & Prof (Dr) Sandip Bhatt: A Study on Impact of Merger of..... 109
Company InformationInformation TCS CMC
Types PublicNSE: TCSBSE: 532540
PublicNSE: CMCBSE: 517326
Industry IT services IT servicesFoundation 1968 1974Head quarters Mumbai New DelhiKey People Rajesh Gopinathan (CEO) R. Ramanan (Last CEO & M.D.)Product IT service, Consultancy and Business
solutionIT service, Consultancy and Businesssolution
Website www.tcs.com www.cmcltd.com
Motives behind TCS – CMC MergerTCS has mention motives behind merger with its subsidiary company CMC limited in
its press released. For a rationalised structure For greater financial strength and flexibility For enhanced research For more focused operational effortsReason behind TCS – CMC Merger To achieve economies of scale To standardized and simplified business process To improved productivityFinancial and Non-financial Terms of TCS – CMC Merger
At the time of merging with TCS, CMC had 11,000 employees and its consolidatedrevenue for third quarter (30th September, 2014) was Rs, 616.69 crore with net profit of Rs 76crore. The consolidated revenue of TCS, for the quarter ended September 30, 2014, was Rs.23,816.48 Crore, with profit after tax of Rs. 5,244.28 Crore based on Indian GAAP.
Purchase consideration was paid in shares for which shareholders of CMC received79 equity shares of rs.1 each of TCS for 100 equity shares of rs.10 each of CMC.Review of Literature
Badreldin, A. and Kalhoefer, c. (2009) in their research paper titled “the effect ofmergers and acquisition on bank performance of Egypt” examined performance of Egyptianbanks with which have undergone mergers and acquisition by calculating return on equityusing the basic ROE scheme. In which is concluded that not all of Egyptian banks showssignificant improvement in pre and post mergers and acquisition. This shows that mergers donot have clear effect on profitability of banks in Egypt.
Mahesh, R. and Prasad, D. (2012) conducted a case study on “Post Merger andAcquisition Financial Performance Analysis: A Case Study of Selected Indian AirlineCompanies” to know whether the Indian airline companies have achieved financialperformance efficiency forpost-merger& acquisition time period with the help of profitability,leverage, liquidity, and capital market standards and ratios. Paired t-test has been performedto determine the significance differences. This study shows that there is no improvement post-merger financial performance of selected airline companies.
Deo, M. and Shah, A. (2012) in their event study “testing Hubris Hypothesis ofMergers and Acquisition: Evidence from India” examined short-term market response tomerger announcements in the Indian banking and information technology industry. Findings

110 Indian Journal of Accounting (IJA) Vol. 51 (1), June, 2019
show that the shareholders of the bidding firms have incurred loss on merger announcementsdid not hold well in the Indian perspective. Also bidding firms did not fall in deficit from themerger deals which conclude mergers and acquisitions cannot be seen as a risky investmentfor their shareholders.Research Gap
Many researchers have conducted studies on mergers in banking and pharmaceuticalbut there are lack of studies for IT sector. Also fewer case studies are available to understandimpact of merger on financial performance after the year 2010.Research Objective To evaluate the impact of merger on financial performance on TCS during the
study period. To understand whether this merger is beneficial to TCS or not.HypothesisH0: There is no significant difference between pre-merger and post-merger financial
performance of TCS.H1: There is a significant difference between pre-merger and post-merger financial
performance of TCS.Research Methodology
For the purpose of this study, secondary data has been used. Main source of thisresearch are from annual reports of TCS and CMC. Also some of the ratios are collected frommoneycontrol.com. Ratios are compared with pre and post-merger analysis. For statisticalanalysis researchers have used mean, standard deviation and tested with the help of paired t-test trough MS Excel. For this research, researchers have excluded the year of the merger ofTCS – CMC. The study period for this study is 2 years before and 2 years after the merger ofTCS-CMC. The researchers have tried to provide brief idea about the impact of CMC mergeron TCS.Significance of the Research
The study which we have done is significant and efficient as it has given us aknowledge and experience about the merger of TCS and CMC and what was its impact on thefinancial performance on TCS.Data analysis and Interpretation
Table 1: Profile of Financial Ratio of TCS & CMC for Pre-merger & Post-merger
RatiosPre Merger Post Merger
2013-14 2012-13 2013-14 2012-13 2016-17 2015-16TCS CMC TCS CMC TOTAL TOTAL TCS TCS
Gross Profit Margin 31.32 20.56 27.88 17.52 51.88 45.4 27.52 29.57Net profit Margin 28.56 27.19 26.4 17.63 55.75 44.03 25.51 26.64R.O.C.E. 40.74 29.1 38.35 22.69 69.84 61.04 29.91 38.16R.O.A 32.07 22.05 29.72 16.57 54.12 46.29 26.35 29.46Current Ratio 2.84 2.39 2.43 2.05 5.23 4.48 6.41 3.01Quick Ratio 2.84 2.37 2.43 2.01 5.21 4.44 6.41 3.01Earning Retention 66.08 78.94 66.33 73.28 145.02 139.61 61.27 62.55EPS 94.15 106.8 65.22 65.47 200.95 130.69 120.04 116.13Net Profit per Share 94.32 106.8 65.33 65.47 201.12 130.8 120.07 116.13Dividend per Share 32 22.5 22 17.5 54.5 39.5 47 43.5
Source: www.moneycontrol.com

Ms. Dhartiben P. Rami, Dr. Kamini Shah & Prof (Dr) Sandip Bhatt: A Study on Impact of Merger of..... 111
Table 2: Mean and Standard Deviation of Pre-merger andPost-merger Ratios of Combined
RatiosPre Merger Post Merger
t-testMean S.D Mean S.D.
Gross Profit Margin 24.32 6.37838 28.545 1.44957 0.13314163Net Profit Margin 24.945 4.957637 26.075 0.79903 0.16775834Return on Capital Employed 32.72 8.361072 34.035 5.83363 0.16874636Return on Assets 25.1025 7.117787 27.905 2.1991 0.15313394Current Ratio 2.4275 0.323561 4.71 2.40416 0.9306083Quick Ratio 2.4125 0.340037 4.71 2.40416 0.94446731Earning Retention 71.1575 6.168686 61.91 0.9051 0.02646932Earnings per Share 82.91 20.92972 118.085 2.76479 0.38665148Net profit per Share 82.98 20.92933 118.1 2.786 0.38600636Dividend per Share 23.5 6.096447 45.25 2.47487 0.81191652
Source: www.moneycontrol.com
InterpretationTable 1 shows various financial ratios of TCS and CMC limited. Also to calculate mean
we have combined ratios of TCS and CMC for the year 2012-13 and 2013-14. In profitabilityindicators, Ratios of Gross profit margin, Net profit margin, Return on capital employed andReturn on asset shows significant improvement post-merger of mean value 24.32 vs 28.545,24.945 vs 26.075 ,32.72 vs 34.035 and 25.1025 vs 27.905 respectively. This indicates positiveimprovement during post-merger time period which shows that merger has positive effect onprofitability. For this H0 (null hypothesis) is rejected showing that merger has significantdifference on profitability performance. In liquidity indicators, Ratios Current ratio and Quickratio shows significant improvement post-merger of mean value 2.4275 vs 4.71 and 2.4125 vs4.71 respectively which shows positive but earning retention shows negative impact post-merger as 71.1575 vs 61.91. Except for earning retention H0 is rejected as both ratios showspositive effect. Per share ratios also shows positive impact of merger as they are also higher incompared to pre-merger. Post-merger Earnings per share, Net Profit per share and Dividendper share are quite higher of 82.91 vs 118.085, 82.98 vs 118.1 and 23.5 vs 45.25 respectivelywhich is a sign of positive impact of merger on market position of TCS. For per share ratios H0is also rejected as it also shows positive improvement.Major Findings It has been found that ratios which show profitability have post-merger positive
improvement in compared to pre-merger financial position of both companies. Liquidity ratios except Earnings retention also show positive impact on post-merger
liquidity position of TCS in compared to pre-merger position of both companies. Same situation is in per share ratios as they are also positively improved in compared
to pre-merger financial position of TCS and CMC.Conclusion
Overall study shows that TCS has taken right decision of the financial position ofcompany by merging with its subsidiary company CMC limited as it has help to gain strongerposition in IT and software sector. Merger of TCS and CMC has Positive impact on financialperformance of TCS which clearly shows that TCS have gained beneficial except retainingearnings post-merger but it is possible to get positive results in later years as this study isbased on only two years. Therefore, it is concluded that TCS has positive effect on financialperformance after merging with CMC.

112 Indian Journal of Accounting (IJA) Vol. 51 (1), June, 2019
References Badreldin, A., & Kalhoefer, C. (2009, October). The Effect of Mergers and Acquisitions
on Bank Performance in Egypt. Working paper. Egypt: The Germen University inCairo. Retrieved february 17, 2018, from https://www.researchgate.net/publication/46437835_The_Effect_of_Mergers_and_Acquisitions_on_Bank_Performance_in_Egypt
CMC Ltd. (n.d.). Retrieved february 8, 2018, from cmcltd: http://cmcltd.com/ Deo, M., & Shah, A. (2012, september 30). SSRN. Retrieved february 15, 2018, from
https://ssrn.com/: https://papers.ssrn.com/sol3/papers.cfm?abstract_id=2156134 Edupristine. (2015, June 16). Retrieved february 20, 2018, from Edupristine:
https://www.edupristine.com/blog/mergers-acquisitions gupta, K. (2015, March). Mergers and Acquisitions in the Indian Banking Sector: A
Study of Selected Banks. International Journal of advanced Research in Managementand Social Sciences, 4(3), 94-107. Retrieved August 28, 2017, fromhttp://www.garph.co.uk/IJARMSS/Mar2015/10.pdf
INVESTOPEDIA. (n.d.). Retrieved february 11, 2018, from investopedia academy:https://www.investopedia.com/terms/m/merger.asp
Mahesh, R., & Daddkar, P. (2012). Post Merger and Acquisition FinancialPerformance Analysis : A Case Study of Select Indian Airline Companies. InternatonalJournal of Engineering and Management Science, 3(3), 362-369. Retrieved february18, 2018, from http://scienceandnature.org/IJEMS-Vol3(3)-July2012/ IJEMS_V3(3)15.pdf
Maheta, J., & Kakani, R. (2006). Motives for Mergers and Acquisitions in the IndianBanking Sector- A Note on Opportunities and Imperatives. SPJCM Workng paper, 6-13. India. Retrieved february 11, 2018, from http://ssrn.com/abstract=1008717
Ministry of corporate Affairs. (n.d.). Retrieved february 12, 2018, from Ministry ofcorporate Affairs: http://www.mca.gov.in/ mca/html/mcav2_en/home/ dataandreports/reports/otherreports/report+of+the+expert+committee+on+company+law/mergers+and+acquisitions/mergers+and+acquisitions.html
Moneycontrol. (n.d.). Retrieved february 10, 2018, from moneycontrol:http://www.moneycontrol.com/financials/tataconsultancyservices/ratiosVI/TCS
Moneycontrol. (n.d.). Retrieved february 10, 2018, from moneycontrol:http://www.moneycontrol.com/financials/cmc/ratiosVI/CMC
Monika. (2014). Mergers and Acquisitions in Indian Banking Sector- A ComparativeStudy on Pre-post Merger. International Journal Of Economic and ManagementStrategy, 4(1), 1-14. Retrieved Februay 6, 2018, from http://www.gbspublisher.com
Press trust of India. (2014, Octomber 17). Retrieved February 20, 2018, from FinancialExpress:http://www.financialexpress.com/archive/cmc-to-merge-with-tata-consultancy-services/1299001/.
Tata Consultancy Services Limited. (n.d.). Retrieved february 8, 2018, from tcs:http://www.mca.gov.in/mca/html/mcav2_en/home/dataandreports/reports/otherreports/report+of+the+expert+committee+on+company+law/mergers+and+acquisitions/mergers+and+acquisitions.html

Indian Journal of Accounting (IJA) 113ISSN : 0972-1479 (Print) 2395-6127 (Online) Vol. 51 (1), June, 2019, pp. 113-121
FINANCIAL LEVERAGE, EARNINGS AND DIVIDEND:AN EMPIRICAL ANALYSIS OF SELECTED STEEL COMPANIES IN INDIA
Dr. Butalal Ajmera
ABSTRACT
An attempt has been made to analysis the relationship between financial leverage andearnings and dividend policy of the selected five steel companies of India. For this studysecondary data have been used and taken from annual reports of respective companies andACE-EQUITY database. Study period was of Ten years data from 2004-05 to 2017-18. It isseen from the calculation of correlation matrix that DPS has significant and positive relationwith ROCE, DPR and Ke DPS has negative and insignificant relation with cost of debt. Theresult of regression that independent variable DPS, EPS, DPR, Kd and ke have positive andinsignificant effect on DPS, whereas DPS has been negatively affected by degree of financialleverage. Combine effect of independent variables has been 0.932 on DPS which means thatthe effect is 93.20% on dependent variable.
KEYWORDS: DPS, EPS, DPR, Kd and ke, Financial Leverage, Dividend, Earnings._______________
IntroductionFinancial Leverage, Earning and Dividend: Capital structure consists of Debt and
equity. Equity capital is the owner capital and debt capital is borrowed capital with fixed rate ofinterest or dividend. When we use the debt capital with fixed rate of charges in capital structureis known as financial leverage. In short presence of debt capital bearing fixed charges incapital structure is known as financial leverage. Borrowed capital is the cheaper source ofcapital because tax benefits. The cost of debt is also lower than the cost equity because of taxbenefits. Hence usage the borrowed capital in capital structure lowers the total cost of capitaland increases the value of the firm. The Now if a company follows this practice its net returnwill be attributable to the low base of equity shareholders (lower base being due to theincrease in financial leverage). As result of lower base of equity in capital structure the earningfor shareholders increase. This is possible only when the business environment is favourableand positive. If the business environment is negative then this turns to be a dangerous thingfor company. If the company is not able to earn more than the cost of capital then it becomesadverse for the firm. But if the business environment is positive and return is more than cost ofcapital EPS increases with increase of financial leverage. It means that the residual return overfixed charges and preference dividend go to the preference shareholders. However, during the
Associate Professor, Department of Commerce, Department of Business Administration, M.K.Bhavnagar University, Gujarat, India.

114 Indian Journal of Accounting (IJA) Vol. 51 (1), June, 2019
period of adversity when the company is not in a position to earn greater than the cost ofequity and EPS, instead of increase, will actually decrease, with the increase in the financialleverage. Higher earnings would result in higher earnings per share and dividend, on thecontrary if financial leverage decrease, it decreases earning per share and dividend per share.Profile of Steel Industry
Steel is one amongst the foremost vital merchandise of the trendy world and is ofstrategic importance for any industrial nation. From construction, industrial machinery toshopper merchandise, steel finds a good form of applications. Therefore industry plays a veryimportant role in development of nation and is taken into account because the backbone ofeconomy. The amount of per capita consumption of steel is a very important determinant ofthe socio-economic development of the country. India is that the second quickest growingnation among prime 10 steel manufacturing countries within the world. Steel contributes toalmost a pair of % of India's gross domestic product (GDP) and employs over six hundredthousand folks. The Indian industry is split into primary and secondary sectors, occupation tocompletely different market segments. The first sector contains many massive integrated steelsuppliers manufacturing billets, slabs and hot rolled coils. The secondary sector involves tinyunits centered on the assembly of added merchandise like cold rolled coils, galvanized coils,angles, columns, beams and alternative re-rollers, and sponge iron units. India is that thefourth largest producer of steel within the world accounting for production of eighty one milliontons of steel throughout FY14 and additionally holds the third position in consumption of steel.Among sector wise consumption, construction is prime overwhelming sector accounting foraround sixty three of total steel consumption within the country.Review of Literature
The researcher has presented review of literature which are very significant andrelevance to the study:
Dinabandhu Bag (2012) did work on “Market leverage of real estate firms in India:Empirical Study” This research paper explains the effect of firm specific attributes and externalmarket or macroeconomic factors on market leverage. The sample size of 40 propertycompanies list in India. The study covers times period of 8 years from 2005 to 2012. The studyconcludes that previous leverage, operational efficiency, growth option, change in workingcapital and cost of funds have positive and significant effect on current market leverage. Thepaper also concluded that the transparency in property markets and accuracy in financialdisclosure could support property firms’ access capital and main their leverage.
Manoj Anand (2002) wrote research paper on “Corporate Finance Practices in India:A Survey. This paper explains the study of 81 CFO of India to know about heir corporatefiancé practices Vis-À-Vis capital budgeting decisions, Cost of capital, capital structuredecision and dividend policy decision. Researcher has analyzed the responses by thecharacteristics of firm like firm size, profitability, leverage, P/E ratio, CFO’s education and thesector. The study reveals that corporate fiancé practice differs with size of the firm.
Mr. Manjunatha.K (2013) worked on “Impact of Debt –Equity and Dividend payoutRatio on the value of the firm.” Researcher has selected sample of 29 firms list on BSE andNSE which covers time period of 2000-01 to 2004-05. The study is based on secondary data.The study found that there is no significant effect of dividend Payout and debt-equity ratio onShare price. It is also concluded that debt-equity and share prices do not have correlationship.Only companies out of 29 companies have the relationship between dividend payout andreturn on equity.
Anupam De, (2011), “Application of the Factor Analysis on the Financial Ratios andValidation of the Results by the Cluster Analysis: An Empirical Study on the Indian CementIndustry. Secondary data of 38 companies were selected which covers the study period of 10

Dr. Butalal Ajmera: Financial Leverage, Earnings and Dividend: An Empirical Analysis of Selected...... 115
years from 1999-2000 to 2008-2009. He used factorial analysis to classify the selectedvariables. Some variables with low correlation were excluded in factorial analysis. Factorialanalysis identified 8 categories of variables. These factors account for about 89% of the totalvariance, which can be considered as excellent.
Dr. Aurangzeb and Tasfoura Dilawer (2012) worked on “Earning Management andDividend Policy: Evidence from Pakistani Textile Industry” The researcher has taken data oftextiles industry from Karachi Stock Exchange (KSE) which covers the period of 1966 to 2008.The researcher used dividend payout ratio as dependent and earning management asindependent variable. They used three variables as control variables such as Return on equity,Size of the firm and self finance ratio. The study found negative relationship between dividendpayout ratio and earning management and all control variables.
Asif et al (2011) has studied the relation between dividend policy and financialleverage. The data of 403 Pakistani listed companies have been obtained which covers theperiod of 2002 to 2008. The study has considered dividend per share as dependent and otherthree variables such as debt ratio, change in earning and dividend yield as independentvariable. The study concluded that DPS has significant effect on leverage and Dividend yieldaccording to random effect model. And all variables have positive coefficient except debt ratioaccording to fixed effect model.
Mahira Rafique (2012) studied Factors Affecting Dividend Payout: Evidence fromListed Non-Financial Firms of Karachi Stock Exchange. The researcher has collected data ofnon-financial firms from listed in the KSE100 Index which covers the time period of six yearsfrom 2005 to 2010. The researcher has used regression model to the effect of independentvariables such as, Firm Size, Growth, Profitability and Corporate Tax & Financial Leverage onDPR. The result of the regression is that Corporate Tax and Firm’s Size had significantrelationship with Dividend Payout and Earnings, Growth, Profitability and Financial leveragehave been insignificant to the DPR.
La Ode Sumail et al (2013) worked on Relationship between Insider Ownershipand Sales Growth with Dividend Policy and Leverage (Study on Manufacturing Companyin Indonesia Stock Exchange) The study was based on secondary data collected from theIndonesia Stock Exchange which covers the period of 5 years from 2007-201. 22companies were selected for study. The study concluded that insider ownership hassignificant effect on leverage, (growth in sales has insignificant impact on leverage (3)dividend policy has been significantly impacted by insider ownership and it has alsostrengthening the agency theory.
Muhammad Usaman Javed (2002) did research on Impact of financial leverage ondivided policy: Case of Karachi stock exchange 30 index. The study period covers from 2005to 2010.Increase in financial leverage have negative effect on dividend per share. Thishappened due to heavy amount of debt.
Asia (2011) has written a paper on “Examine the relationship between the financialleverage on the dividend policy of the Karachi stock exchange -100 index. The paperexplained that dependent variable (Dividend per share) and independent variable (dividendyield, debt ratio, and the change in the earning). The result of the research showed that debtratio of the company is not significant with dividend policy, whereas; dividend yields havepositive effect on the DPS.
Chandrakumar Mangalam (2010) examined the impact of financial leverage on theprofitability of the Indian firms. The researcher has studied the effect of operating leverage, financialleverage and combines leverage on EPS. The study found significant relationship between Degreeof operating leverage, Degree of Financial leverage and combined leverage. The study concludedthat there is a positive relationship between degree of financial leverage and EPS.

116 Indian Journal of Accounting (IJA) Vol. 51 (1), June, 2019
S. Franklin John and K. Muthusamy (2010), worked on “Leverage, Growth andProfitability as Determinants of Dividend Payout Ratio-Evidence from Indian Paper Industry”The research paper is based on Linter dividend model. The researchers have carried out theirresearch in paper industry. They identified some variables who determined dividend policysuch as Growth in sales, Earnings per share, Price earnings ratio, Market value to book value,Cash flow, Leverage, Liquidity and Return on assets. These variables are assumed to beindependent variables while dividend payout has been assumed as dependent variable. Thestudy concluded that leverage is largely associated with dividend policy.
Fakhra Malik et al (2013) made a study on “Factors Influencing Corporate DividendPayout Decisions of Financial and Non-Financial Firms” secondary of Karachi stock Exchange-100 index were used which covered the period of 2007 to 2009. Researchers have used paneldata of 100 financial and non-financial firms of Karachi Stock exchange. The study concludedthat timing of declaration dividend is important for reputed firms. The study also concluded thatpayment of dividend is determined by the profitability, liquidity, earning per share and size ofthe firm positively. Whereas firm with growth in sales has negative effect on payment ofdividend and Financial leverage has also negative impact on payment of dividend.
Wasfi Al Troudi and Maysa'a Milhem (2013) did researcher on Cash dividends,retained earnings and stock prices: Evidence from Jordan. Industrial firms of Amman stockexchange have been selected for the study which covers the period of 2005 to 2010. Thestudy was made to examine the relationship between cash dividends, retained earnings andthe stock prices. The research resulted that there was positive and significant relationshipbetween cash dividends, retained earnings, earning per share and stock price. However stockprice is positively related with insignificant association with financial leverage. Power andMacDonald (1995) examined the effect of dividends and retained earnings on the prices ofshares. They have found there is a relationship amongst the prices of shares; dividend andretained earnings.Objectives
In order to justify above title following objectives were laid down. To study the raising pattern of finance and financial leverage practice of five selected
steel companies. To examine the impact of financial leverage on EPS of five selected companies. To assess the inter relationship between degree of financial leverage (DFL), earnings
per share (EPS) and dividend per share (DPS) To examine the effect of EPS, DPR, Kd, Ke and ROCE on DPSResearch Methodology Collection of Data: The data of selected five steel companies have been collected
from the annual reports of the company and money control. The names of companiesare Bhushan Steel Industry Ltd., Essar Steel Industry Ltd., Jindal Stainless Ltd.,Steel Authority of India Ltd., and Tata Steel Ltd. The data collected from thissource have been structured and compiled appropriately and as per the need of study.
Period of Study: The present study covers a period of eight years from 2004-05 to2017-18.
Techniques of Analysis: The study has been made by converting the collected datain to relative measures such as ratios, percentage rather than absolute one. Foranalyzing the degree of association between DFL, EPS and DPS and financialmeasures, statistical technique of Pearson’s correlation analysis has been used tojudge whether the calculated correlation coefficient are significant or not.

Dr. Butalal Ajmera: Financial Leverage, Earnings and Dividend: An Empirical Analysis of Selected...... 117
Empirical AnalysisTable 1: Computation of DFL, EPS, DPS, DIP Ratio, Cost of Debt
Cost of Equity and Rate of Return on Investment
Year DLF EPS DPS DPR InterestRate
AverageTax Rate Kd Ke ROCE
%2004-05 1.29 30.23 4.24 11.61 8.25 16.92 6.85 3.90 20.502005-06 1.35 26.37 3.82 12.17 6.59 8.61 6.02 2.92 13.062006-07 1.33 38.18 4.62 10.63 5.88 18.85 4.77 3.17 13.102007-08 1.4 40.22 4.84 12.13 6.81 25.76 5.06 2.93 10.522008-09 1.58 29.94 4.22 8.58 5.76 27.91 4.15 1.63 4.682009-10 3.77 58.45 2.76 7.13 4.47 38.32 2.76 1.37 6.242010-11 0.65 29.38 2.98 7.61 4.22 23.68 3.22 0.50 4.902011-12 0.27 23.03 2.9 8.35 6.09 26.81 4.46 0.49 3.502012-13 1.02 9.64 2.1 10.93 6.45 10.39 5.78 0.40 -0.682013-14 4.05 0.91 2.5 13.52 7.87 25.19 5.89 0.53 1.322014-15 2.36 5.59 2.00 10.31 8.05 -0.96 8.13 0.17 6.152015-16 -0.02 13.71 1.60 2.27 9.45 187.13 -8.24 0.16 -1.112016-17 1.59 10.58 2.00 2.99 38.57 -17.40 45.28 0.21 4.562017-18 -4.01 8.09 2.00 3.13 51.77 9.83 46.68 0.17 4.938
Notes and Explanations DFL = Degree of Financial Leverage = EBIT / EBT EPS = EAT / No. of Equity Shares. DPS = Dividend / No. of Equity Shares. DPR Ratio = DPS / EPS x 100 Rate of Interest = (Interest / Long-term debt) X 100 Interest on debt capital is an allowable expenditure for income tax purpose and it
qualifies for deduction in computing taxable income. So it reduces effective cost ofdebt in the following way: Cost of debt (%) = Rate of Interest (1 - tax rate).
Tax rate varied over the years with the changes in Tax Legislations. Tax rate being notavailable has been computed by approximating it to be equivalent of tax provisions. SoTax rate has been calculated by using formula (provision for tax/ Earning beforetax)*100 which give approximate figure of tax rate.
The return expected by the equity shareholders may be referred to as cost of equity.There are various models for its computation. But in real term a firm has to incur costin respect of equity shares in the form of dividend payment. So the most suitableformula is : Cost of equity (%) = (Dividend / Equity or Net worth) x 100
Rate of return on investment = (EAT / Total Capital Employed) x 100Table 1 indicated the selected variable of DFL, EPS, DPR, Rate of interest, Average
tax, Cost of Debt, Cost of Equity and ROCE. Financial leverage is used to magnify the returnof shareholders. DLF is very good upto 2009-10 then after it got highly fluctuated. DLF isnegative in the year of 2015-16 because EBIT was negative. It is also negative during the lastyear of the study period. Overall DLF shows very fluctuating trend. DLF was the best duringthe year of 2013-14 (4.05), 2009-10(3.77) and 2014-15(2.36).However for selected steelcompanies’ position is not so much good. There is general propositions that higher is the DFL;greater is the ESP. DFL has very positive impact on EPS and DPS because both have beenfavourably. The DFL is less than one from 2010-11 to 2011-012 which is not good for thefirms. It is also seen that higher degree of financial leverage (3.77) in year of 2009-10 hasgenerated higher EPS (58.45) in the same year. However exception has also been seen thathigher degree of financial leverage (4.05) in the year of 2013-14 lowered the EPS (0.91) whichis abnormal for the steel industry. Dividend per share also depends on two things (1) Earningavailable to shareholders and (2) liquidity condition.

118 Indian Journal of Accounting (IJA) Vol. 51 (1), June, 2019
It is assumed that higher degree of financial leverage leads to higher amount of earningavailable and higher amount of dividend per share. It is also a fact that equity shareholders arebeing paid out of residual earning after paying to all parties. EPS shows downward trend duringthe study period. The EPS was the highest (58.45) and lowest (0.91) during the study period.EPS has been seen very well when DLF was more than one (1:00) indicating positive impact onEPS. EPS has gone down when DLF went to less than one. In some year it is seen negative.Steel industry is not very good in distributing dividend. It is seen from the above table that DPSremained Rs. 2;00 or closure to 2:00.Companies like Tata steel Bhushan ltd., Essar steel andsteel authority of India ltd. have not declared dividend. Another significant aspect of financialleverage is cost of debt and Return on Investment. The difference between cost of debt and ROIis called residual income. It means that lower the cost of debt, higher will be the earning availableto shareholders. Cost of debt is showing highly fluctuated trend during the study period. The costof capital was the highest during the last years of study period (45.28%) and 46.68%) whichmeans that steel companies have used more amount of debt. It is said that ROCE depends onthe cost of capital. Higher the ROCE, lower the cost of capital. But in the selected steelcompanies it did not happen. There are some years where lower cost of capital (-8.24) did notgenerate higher amount of ROCE (-1.11).
During last two years the cost of debt is very higher and ROI is very lower establishinginverse relationship. The impact of financial leverage is based on effective average rate of tax.Is also hypothesized the higher the tax rate, lower is the cost of capital. Dividend payout ratioshows highly fluctuated trend during the study period. Dividend payout ratio is very low duringthe year of 2016-17 (2.99) and 2017-18(3.13). Lower percentage of dividend payout ratioindicates that the steel industry is retaining the earning and paying very less to shareholders.Most of selected companies have very bad dividend payout ratio and dividend per share ratio.However as per Gordon approach dividend payout ratio higher is desirable when ROCE islower. In the years of 2011-12, 2012-13 and 2013-14 dividend policy is very good because itwould have positive impact on stock price. However steel industry has the cost of equity lowerthan cost of debt which means that firm has depended mostly on long term debt. Here equitycapital has become cheaper sources of capital.Correlation Analysis of Financial Leverage, Earning and Dividend
Researcher has also calculated correlation to examine the relationship between DFLand EPS, DFL and DPS and EPS and DPS. The correlation has been presented in thefollowing table 2.
Table 2: Relationships between DFL, EPS & DPS andOther Measures ROCE, DPR, Kd and Ke
DLF EPS DPS ROCE % DPR Kd KeDLF Pearson Correlation 1
Sig. (2-tailed)EPS Pearson Correlation 0.254 1
Sig. (2-tailed) 0.381DPS Pearson Correlation 0.180 0.645* 1
Sig. (2-tailed) 0.537 0.013ROCE % Pearson Correlation 0.062 0.480 0.737** 1
Sig. (2-tailed) 0.833 0.082 0.003DPR Pearson Correlation 0.537* 0.139 0.579* 0.426 1
Sig. (2-tailed) 0.048 0.635 0.030 0.129Kd Pearson Correlation -0.475 -0.359 -0.303 -0.016 -0.466 1
Sig. (2-tailed) 0.086 0.208 0.292 0.957 0.093Ke Pearson Correlation 0.184 .0606* 0.895** 0.895** 0.557* -0.274 1
Sig. (2-tailed) 0.529 0.022 0.000 0.000 0.038 0.343*. Correlation is significant at the 0.05 level (2-tailed).**. Correlation is significant at the 0.01 level (2-tailed).
Source: computed with the data obtained from table 2

Dr. Butalal Ajmera: Financial Leverage, Earnings and Dividend: An Empirical Analysis of Selected...... 119
Table 2 showed the co-efficient of correlation matrix between degrees of financialleverage, earning per share, dividend per share, rate of return on capital employed dividendpayout ratio, cost of debt capital and cost of equity. Table -2 indicates that there is a positivecorrelation between degree of financial leverage and Earning per share (0.254), dividend pershare (0.180), return on capital employed (0.062), dividend payout ratio (0.537) significant at5% level. There is negative correlation between Degree of financial leverage and cost of debtand the relation is insignificant. There is a positive and significant correlation between dividendper share and earnings per share (0.654). There is also a positive and significant correlationbetween dividend per share and degree of financial leverage and dividend per share. Cost ofequity has significant and positive correlation with earning per share, dividend per share(significant at 10%) return on capital employed (significant at 10%). Cost of equity is positiveand significantly correlated with dividend per share.
Regression model: researcher has indentified some of the important variable whichaffects the dividend per share. The variables are dividend per share, dividend payout ratio,cost of debt, cost of equity, return on capital employed, and degree of financial leverage. Themodel is given below:
DPS= ß0 + ß1(DFL) + ß2(EPS) + ß3(ROCE) + ß4(DPR) + ß5(KD)) + ß6(Ke)
Table 3: Model SummaryModel R R Square Adjusted R Square Std. Error of the Estimate
1 0.932a 0.869 0.756 0.543a. Predictors: (Constant), ROCE %, KD, DLF, EPS, DPR, Ke
Table 3 indicates Regression model summary. This model explains that adjusted R2 is0.756 and R2 is 0.869. R square is adjusted to reflect the model's goodness of fit of thepopulation. The net effect of this adjustment is to reduce the R square from 0.869 to 0.756Standard error of model is 0.932. This is the standard deviation of actual value of Y (DPS)about the regression value of the estimated Y (DPS).
Table 4: ANOVAa
Model Sum of Squares df Mean Square F Sig.1 Regression 13.702 6 2.284 7.720 .008b
Residual 2.071 7 .296Total 15.772 13
a. Dependent Variable: DPSb. Predictors: (Constant), ROCE %, Kd, DLF, EPS, DPR, Ke
Table 4 showed ANAOVA which indicates measures whether or not the equationrepresents a set of regression coefficient that, in total are statistically insignificance at 5% levelof significance.
Table 5: Coefficients
Model Unstandardized Coefficients StandardizedCoefficients t Sig.
B Std. Error Beta1 DPS 1.193 .683 1.746 .124
DLF -.090 .107 -.154 -.838 .430EPS .021 .014 .300 1.417 .199DPR .095 .071 .318 1.350 .219Kd .008 .014 .117 .604 .565Ke .728 .352 .886 2.066 .078ROCE % -.060 .067 -.324 -.893 .402
a. Dependent Variable: DPS

120 Indian Journal of Accounting (IJA) Vol. 51 (1), June, 2019
Table 5 is about the coefficient. In this table, the column headed “B” shows unstandardized regression coefficient for the equation. The above table shows multipleregressions reflected by coefficient. The effect of ROCE and DLF found negative andinsignificant. Whereas the effect of EPS, DPR, cost of debt and cost of equity found positiveand insignificant. Thus it is believed that dividend per share has not been significantly affectedby degree of financial leverage, earning per share, dividend payout ratio, cost of debt, cost ofequity and return on capital employed.Conclusion
Researcher has taken all the variable of degree of financial leverage, earning pershare, dividend per share, return on capital employed, dividend payout ratio, cost of debt, andcost of equity capital from annual reports and moneycontro.com. The data been tabulatedappropriately for the purpose of analysis. The analysis of each tables, which contains thevariables of degree of financial leverage, earning per share, dividend per share, return oncapital employed, dividend payout ratio, cost of debt, and cost of equity capital has been madeby using different techniques like accounting ratio and statistical tools like ‘multiple regression,t test, correlation, co-efficient of correlation, mean, standard deviation and variance. Theresearcher has calculated various variables for leverage, earning and dividend such as degreeof financial leverage for leverage, Earning per share for earning and dividend per share &Dividend pay our ratio for dividend. The relation has also been established between DFL andEPS, DFL and DPS and EPS and DPS. It is seen from the calculation of correlation matrix thatDPS has significant and positive relation with ROCE, DPR and Ke DPS has negative andinsignificant relation with cost of debt. The result of regression that independent variable DPS,EPS, DPR, Kd and ke have positive and insignificant effect on DPS, whereas DPS has beennegatively affected by degree of financial leverage. Combine effect of independent variableshas been 0.932 on DPS which means that the effect is 93.20% on dependent variable.References Aasia, W. (2011). Impact of Financial Leverage on Dividend Policy: Empirical evidence
From Karachi Stock Exchange-listed Companies. African Journal of BusinessManagement `, 1312-1324.
Al-Kuwari, D. (2009). Determination of Dividend Policy in Emerging Stock Exchanges:The Case of GCC Countries. Global Economy & finance Journal, 38-63.
Anupam De, (2011), “Application of the Factor Analysis on the Financial Ratios andValidation of the Results by the Cluster Analysis: An Empirical Study on the IndianCement Industry. Journal of Business Studies Quarterly 2011, Vol. 2, No. 3, pp. 13-31.
Asif. A., Rasool. L, W., & Kama. Y. (2011). Impact of financial leverage on dividendpolicy: Empirical evidence from Karachi Stock Exchange-listed, “African Journal ofBusiness Management”, Vol. 5(4), 1312-1324.
Brandon Julio and Ikenbury L David, (2004). Reappearing Dividends, Journal ofApplied Corporate Finance, Volume 16 Fall pp.89-100.
Chandrakumarmangalam, S. (2010). Leverage an analysis and its impact on theprofitability with reference to selected companies in India. European Journal ofEconomics, Finance and Administrative Sciences.
Dinabandhu Bag, “Market leverage of real estate firms in India: Empirical Study” IOSRJournal of Economics and Finance, PP 84-94.
Dr. Aurangzeb and Tasfoura Dilawer (2012), “Earning Management and DividendPolicy: Evidence from Pakistani Textile Industry”, International Journal of AcademicResearch in Business and Social Sciences, October 2012, Vol. 2, No. 10, pp.362-372.

Dr. Butalal Ajmera: Financial Leverage, Earnings and Dividend: An Empirical Analysis of Selected...... 121
Fakhra Malik (2013), “Factors Influencing Corporate Dividend Payout Decisions ofFinancial and Non-Financial Firms”, Research Journal of Finance and Accounting,Vol.4, No.1, 2013.
Gitma,J.L., Principle of managerial Finance, Harper & Row, New York ,p.84. H.G. Guthmann and H.E. Doughall, Corporate Financial policy, (New York: Prentice
Hall, 1955). P.387. James E Walter, (1963). Dividend Policy: It’s Influence on the value of the Enterprise,
Journal of Finance, May pp.280-291. Khan,M.Y and .Jain,P.K., Financial Management, text & Problems, Tata McGraw-Hill
Publishing Co ltd., New Delhi,1992. Kothari C.R.: Research Methodology- Methods and techniques ,Wishwa Prakashan, in
New Delhi, 1997. La Ode Sumail1, Moeljadi, Atim Djazuli, and Solimun (2013), “Relationship between
Insider Ownership and Sales Growth with Dividend Policy and Leverage (Study onManufacturing Company in Indonesia Stock Exchange)”, International Journal ofBusiness and Management Invention, Volume 2, Issue 5, May. 2013 PP.40-49.
Maheshwari S.N.: Management accounting and financial controls, Sultan Chand &Sonns, Delhi, 1994.
Mahira Rafique (2012), “Factors Affecting Dividend Payout: Evidence from Listed Non-Financial Firms of Karachi Stock Exchange” Business Management Dynamics, Vol.1,No.11, May 2012, pp.76-92.
Manoj Anand (2002), “Corporate Finance Practices in India: A Survey”, Vikalpa, Vol.27, No. 4, October-December 2002.
Mr.Manjunatha.K (2013), “Impact of Debt–Equity and Dividend payout Ratio on thevalue of the firm.” Global Journal of Commerce & Management Perspective, Vol. 2(2)2013:18-27.
Muhammad Usaman Javed (2002), “Impact of financial leverage on divided policy:Case of Karachi stock exchange 30 index.” Journal of Contemporary Issues inBusiness Research, Vol. 1, No. 1, 28-32.
Pandey I.M.: Financial Management, Vikas publishing house, New Delhi, 1991. Power, D. and Macdonald. (1995), Stock prices, dividends and retention: Long-run
relationships and short-run dynamics, Journal of Empirical Finance, Vol. 2, Issue 2, pp.135-151.
Prasanna Chandra, (1995). Shareholder Wealth Maximization, The ICFAI Journal ofApplied Finance, Vol. 1, January pp.115-122.
S. Franklin John and K. Muthusamy (2010), “Leverage, Growth and Profitability asDeterminants of Dividend Payout Ratio-Evidence from Indian Paper Industry”, AsianJournal of Business Management Studies 1 (1): 26-30, 2010.
WasfiAlTroudi and Maysa'aMilhem (2013), “Cash dividends, retained earnings andstock prices: Evidence from Jordan”, Interdisciplinary Journal of Contemporaryresearch in Business, Vol.4, No.12.

Indian Journal of Accounting (IJA) 122ISSN : 0972-1479 (Print) 2395-6127 (Online) Vol. 51 (1), June, 2019, pp. 122-124
CONCEPTUAL FRAMEWORK OF CLOUD ACCOUNTING
Ravikant Jaiswal
Prof. K.S Jaiswal
ABSTRACT
Fast advancement of information technologies in recent years completely changedorganizational processes and systems design. This is also from one of them, developed since2006, i.e called cloud computing. This permitted a party virtualization of the system oforganization, including some mechanism of the accounting information system. Thus itemerged and was operational zed at the organizational stage, cloud accounting [software].The concept of cloud accounting originated in 2006 in foreign i.e New Zealand with Zero. Zeroalways consists from cloud-based accounting solution system; it was not evaluated or sold atraditional desktop computer version of its software of accounting. At present it is moredemanded in India because of having Globalization, cloud accounting is the need of everyorganization because it is more flexible and its data can be traced or seen from anywhere, andall organization don’t want to invest lots of money for establish proper set up and resources sothey would like to work with cloud accounting without extending the hard disk storage or theversion of their system the study of this topic will help to all the business man and students forunderstanding the benefit of cloud accounting.
KEYWORDS: Cloud Accounting, Accounting Information System, SAAS._______________
IntroductionIt is the modern aspect of accounting or we can say that accounting on the air, Cloud
accounting is a accounting software that is based on remote servers. Cloud accountingprovides accounting efficiency to every business enterprise in a new generation similar tothe SAAS (Software as a Service) tools of business model. Live Data is sent into "the cloud,"where it does processing and after that data are returned to the user. All types of softwareapplication activities are performed off-site, not on the desktop of user. In the cloud computing,users access the software applications remotely without any wire connectivity throughthe Internet or other network via a cloud application service provider. Using cloud computingaccounting software frees the big business from installation & maintains various software oneach desktop computers. It also allows or permitted to staff in remote or several branch officesto see and access the same original data and on the same version of the same software.
Most application providers usually charge based on usage, compared to sitelicense fees associated with habitual or conventional accounting software deployments.Accounting data backup and disaster recovery is generally a procedural step of your cloudcomputing accounting software.
Research Scholar, Mahatma Gandhi Kashi Vidhyapeeth,Varanasi, U.P., India. Research Supervisor, Mahatma Gandhi Kashi Vidhyapeeth, Varanasi, U.P., India.

Ravikant Jaiswal & Prof. K.S Jaiswal: Conceptual Framework of Cloud Accounting 123
So why this thing is Called the Cloud?If we think about the use of internet banking, every time we access or search this data,
we’re using the cloud. The cloud area is one of the common platforms to make data andsoftware accessible by using internet anytime, anywhere, from any computer device. Yourhard drive is not longer then central hub. What is the basic difference between traditionalaccounting and cloud accounting software?
There are a numerous key distinctions between cloud accounting and traditional siteaccounting. For one, cloud accounting is much better for flexibility point of view. Data ofbusiness accounting can be searched or accessed from anywhere in all over the world on anydevice with an Internet connection, instead on some select on-premises computers. Secondly,it is not similar like traditional accounting software, software of cloud accounting updatesfinancial information within a short moment automatically and supply the financial reportingdata in real-time as per our need. it means balances of business account are always correct& accurate and less errors take place during manual data entry process. Cloud accountingsoftware is also easy to handle multiple-currency and multi-company transactions morecompetently.
On the world of premises, every time the firm growth rate is increasing, they bumpinto big software license and service costs which are always occur very high and newlicenses fees for managing database system and other supportive relevant software. Thefirm always has to make heavy capital for purchasing new hardware, like servers. But byusing cloud solutions, businesses do not get fixed with permanent, high cost equipment andlicenses when your business deals are over and, similar like, there are no big spikes in costswhen it elaborate a little.
Also, cloud accounting requires far less costly maintenance than its conventionalmatching part. The cloud provider provide complete backups and updates featuresautomatically and no requirement to downloaded or installed on a company desktop.Data Security with Cloud Accounting
Cloud accounting solution system provides high security (and we can say it moresecure than our expectation) method of saving and storing important financial data thantraditional software of accounting. For example a company Desktop or laptop with vitalfinancial information may be damaged or stolen, which could lead to destroy any information.Cloud accounting solution, however, leaves no tracking of important financial data on thedesktop of company, and use to that data in the cloud and this data are encrypted and totallyprotected with password.
Transferring data is also a easy task in cloud accounting, more than one people simplyrequire access rights to the same desktop with their unique confidential passwords. Traditionalmethods often require spark drives to move data, which could be damaged or stolen. Last ofall, cloud providers generally have backup servers in two or more locations. if one servernetwork go downhill, still you can access to your important data. If the important Informationrelated to finance are kept on-premises then it may be destroyed or damaged by fire or naturaldisaster, and may never be restored or recover.Will Cloud Accounting save My Money?
Those Companies who use the system of cloud accounting need only less initialserver infrastructure to save or store data, and Technical person have no need to maintain itor update the cloud accounting system quickly. Less additional expenses and no need topurchase new software it means huge savings for businesses. For the on-premises world itis the literal opposite. All time a firm grows, they bump into big software license and service

124 Indian Journal of Accounting (IJA) Vol. 51 (1), June, 2019
costs as well as new licenses and other fees for database management system and otherrelevant software.Literature Review
In India lots of work has been done only on cloud computing but In terms of practicalresearch it involves identifying appropriate articles relevant with this topic, written by foreignauthors Mr Romanian in 2011-2016, and interpretation to emphasize perspective for executionof cloud based accounting in the Romanian organizations.Conclusion
After understanding the overall concept finally we find that every businessman mayuse which is based on cloud accounting software from any device or system with properinternet connectivity. Here the means of Online accounting refers small business ownersmostly be connected to their data and their accountants. The software can combine with aentire eco-system of add-ons. It’s measurable, less costly and easy to use. In the cloud, thereis no requirement to install various software's and run other applications over a computer.Instead, you reimburse for the old software by charges monthly subscription.References Abdel-Rahim, H. Y. and D. E. Stevens. 2018. Information system precision and
honesty in managerial reporting: A re-examination of informationasymmetry. Accounting, Organizations and Society (64): 31-43.
De George, R. T. 2002. The Ethics of Information Technology and Business(Fundamentals of Business Ethics). Blackwell Publishing.
Hart, L. 2016. Sponsored report: What to know before you commit to thecloud. Journal of Accountancy (July): 57-63.
Maiga, A. S. and F. A. Jacobs. 2011. Selection bias and endogeneity issues on therelationship between information technology and firm performance. Advances inManagement Accounting (19): 109-131.
Schroeder, H. 2015. Art and science in information: Systems implementation: A casestudy. Cost Management (July/August): 19-25.
Van den Abbeele, A. 2016. Discussion of Integrated information systems, allianceformation, and the risk of information exchange between partners. Journal ofManagement Accounting Research 28(3): 19-23.

Indian Journal of Accounting (IJA) 125ISSN : 0972-1479 (Print) 2395-6127 (Online) Vol. 51 (1), June, 2019, pp. 125-127
BOOK REVIEWDr. Siddhartha Sankar Saha & Dr. Mitrendu Narayan RoyEmerald Publishing Ltd., UK, 2017, Rs. 4935 (Hardback)ISBN: 978-1-78714-227-5
QUALITY CONTROL PROCEDURES FORSTATUTORY FINANCIAL AUDIT: AN EMPIRICAL STUDY
Dr. Bikram Singh
IntroductionA series of corporate scandals across the globe have shaken the foundation of
investor trust in the transparency, honesty and accountability of corporations in the recentpast. Inadequacies in quality control procedures for statutory financial audit actually paved theway for publication of falsified financial reports year after year. These financial irregularitieseventually get the attention of the regulatory authorities and oversight agencies resulting inexposure of massive accounting fraud that calls for the company’s demise. It has a farreaching impact not only on the stakeholders of that company but also to the financial marketsand economy as a whole. The book titled “Quality Control Procedures for Statutory FinancialAudit: An Empirical Study” is a significant endeavour conducting an exhaustive study in orderto address the quality control procedures for statutory audit of financial statements in thebackdrop of recent corporate accounting scandals and their irrevocable impact on thestakeholders.
It is known that financial decision of a large part of the society depends upon auditors’opinion. In order to meet the requirement of stakeholders, professional institutes and otherregulatory bodies governing statutory audit operations in several countries across the globehave come up with several professional and ethical standards for maintaining quality ofstatutory audit of financial statement. Compliance with applicable professional and ethicalstandards and issuing report which is appropriate in particular circumstances is the basic pre–requisite of audit quality. Accounting firms formulate quality control policies and implementthem for all of their professional engagements. Appropriate compliance with quality controlpolicies by all the members of an accounting firm ensures quality of their engagement. Auditand assurance being one of the important professional engagements of a firm also comesunder it purview. Other professional standards and applicable regulations also take pioneeringrole in controlling quality of statutory audit of financial statements. In this backdrop, the bookhas been designed primarily to address the following research issues: (a) adequacy ofregulatory framework governing quality control procedures for statutory financial audit; (b)opinion of practising chartered accountants (CAs) on quality control procedures for statutory
Assistant Professor, Department of Commerce, University of Calcutta, Kolkata, West Bengal, India.

126 Indian Journal of Accounting (IJA) Vol. 51 (1), June, 2019
financial audit; (c) difference in their opinion from students pursuing chartered accountancycourse; (d) impact of professional practice on the opinion of a person dealing with qualitycontrol procedures; (e) issues governing quality control procedures for statutory financial audit;(e) relationship between quality control procedures and overall audit quality. With a view toaddressing those issues, the book comparatively analysed quality control framework in theUSA, the UK and India and have taken into account the opinions of practising charteredaccountants and students pursuing professional courses in Kolkata (India). Such analysis hasbeen done to explore the impact of quality control policies and select audit procedures onquality control for statutory financial audit.
The current research in the book has used a wide range of materials from regulatorypronouncements, guidelines, rules, standards and acts to relevant books and research papersin this field. Moreover, perceptions of CAs and students pursuing chartered accountancycourse have also been gathered in close-ended structured questionnaire constituting animportant material for the study. Quality control procedures in the USA, the UK and India havebeen captured through a comparative analysis table. A few statistical tests, such as Chi-square test, Mann-Whitney test, Pearson’s correlation coefficient and t-test have been used toanalyse the primary data collected from respondents of the study.
The book has depicted that quality audit of financial statements performed by thestatutory financial auditors ensures reliability and authenticity of financial statements insafeguarding stakeholders’ interest. Hence, quality control procedure for statutory financialaudit has been considered with utmost importance by regulatory authorities in developedand developing countries across the globe. The book has shown many facets of auditquality. A comprehensive framework for maintaining quality of financial statements has beenproposed by the International Federation of Accountants (IFAC). Professional institutes ofdifferent countries including India under the IFAC have designed their quality controlframework in that line. Quality control policies and procedures of an accounting firm are themost important aspect of the quality control framework. Quality control policies for an auditengagement are devised in accordance with quality control policies of the accounting firm.There are standards promulgated by the professional institutes that help the firm orengagement team in that respect.
The authors of the book have also observed that the regulatory frameworks governingquality control procedures of statutory financial audit in the USA, the UK and India are almostsimilar. However, as compared to the international standards set by the International Auditingand Assurance Standards Board (IAASB), the regulatory framework of the countries underconsideration suffers from certain lacuna with respect to quality control procedures.
The authors have taken a good endeavour to analyse the opinions of CAs andstudents pursuing chartered accountancy course and the study shows that a number of issues,like scientific designing of quality control policies, education and training for the members ofthe firm, long association with audit client, engagement quality control review (EQCR),sufficiency and enforceability of auditing standards, limitations in time and scope of auditing,dependence of internal control mechanism of the company, participation of all members inaudit planning, documentation of professional skepticism of statutory auditors, reportingcompliance with applicable standards, management’s control in appointment procedure,continuous learning programmes, cut throat competition in the accounting profession, havesignificant impact on quality control procedure for statutory financial audit. However, there isheterogeneity in the opinions of CAs and students with respect to quite a few issues governingquality control procedures. This divergence is caused probably due to differences in their levelof knowledge and experience in the accounting profession.

BOOK REVIEW: Dr. Bikram Singh: Quality Control Procedures for Statutory Financial Audit: An..... 127
The book finally has recommended a few measures in improving the quality controlprocedures for statutory financial audit especially in the Indian audit environment. While Indianregulators and professional institutes have taken some phenomenal steps in this regard, somegaps and inconsistencies still remain which are appropriately addressed in the book.
The authors of the book, Professor (Dr.) Siddhartha Sankar Saha, Professor ofCommerce, University of Calcutta (India) and Dr. Mitrendu Narayan Roy, Assistant Professorof Commerce, Goenka College of Commerce and Business Administration (India) are prolificresearchers in this field and they have published considerable number of research papers inthe related areas in journals of national and international repute. Prof. Saha has more than 20years of teaching experience in both UG and PG level. Moreover, Professor Saha has alreadycontributed a few books on corporate accounting scandals and ethical responsibility ofstatutory auditors published by international publisher groups.
The book has primarily been written for the professionals in the field of accounting andauditing as it deals with their problems in controlling quality of statutory financial audit. In India,premier professional accounting bodies, like the Institute of Chartered Accountants of India(ICAI), the Institute of Cost Accountants of India (ICAI), the Institute of Company Secretaries ofIndia (ICSI), and Govt. of India may also be benefitted about the outcome of the book for policyrecommendation and modification of existing laws governing quality control policies andprocedures. The book may also be beneficial to students pursuing the post graduation incommerce and business administration or students pursuing professional courses or theresearchers in finance and control. It will give them an insight into the current state of qualitycontrol for statutory financial control and show them the path of further researches.

Indian Journal of Accounting (IJA) 1 ISSN : 0972-1479 (Print) 2395-6127 (Online) Vol. XLVIII (2), December, 2016, pp. 1-6
INDIAN ACCOUNTING ASSOCIATION (IAA) EXECUTIVE COMMITTEE
JAIPUR, JANUARY- 2019
PRESIDENT VICE PRESIDENT (Sr) VICE-PRESIDENT (Jr)
Prof. M Muniraju
Department of Commerce
Bangalore University
Bengaluru-560001 (Karnataka)
Prof. G. Soral Department of Accountancy & Statistics
Mohanlal Sukhadia University,
Udaipur – 313 001(Rajasthan)
Prof. M. L. Vadera School of Business & Commerce
Manipal University,
Jaipur – 303 007
GENERAL SECRETARY TREASURER CHIEF EDITOR
Prof. Gabriel Simon Thattil Department of Commerce
School of Business Management and
Legal Studies, University of Kerala
Thiruvananthapuram-695581 (Kerala)
Prof. Sanjay Bhayani Department of Business Management
Saurashtra University
Rajkot – 360 005 (Gujarat)
Prof. (Dr.) S.S. Modi Former Head
Department of Accountancy & Business
Statistics, Faculty of Commerce,
University of Rajasthan
Jaipur - 302004 (Rajasthan)
JOINT SECRETARY JOINT TREASURER
Dr. Prakash Sharma Department of Accountancy & Business
Statistics, University of Rajasthan, Jaipur
– 302004 (Raj.)
Prof. Arindam Gupta Dept. of Commerce with Farm
Management , Vidyasagar University
Midnapore – 721102 (WB)
Member (Ex-Officio) Member (Ex-Officio)- Editor Member (Ex-Officio) - Editor
Prof. B. Banerjee
President
IAA Research Foundation,
Kolkatta (WB)
Dr. M.C. Sharma
Former Professor, Head & Dean
University of Rajasthan
Jaipur - 302004 (Rajasthan)
Dr. Daksha Pratapsinh Chauhan Professor and Head
Department of Commerce and Bus.
Administration, Saurashtra University
Rajkot – 360 005 (Gujarat)
Bengaluru Elected Members
Central Zone West Zone East Zone
Dr. Vijay Dubey Dr. Anil M. Raut Dr. Parimal Kumar Sen
Prof. Awadhesh Kumar Tiwari Prof. Daksha Pratapsingh Chauhan Dr. Anil Kumar Swain
North Zone South Zone
Dr. JL Gupta Dr. S Resia Beegam
Dr. T Rajesh
Udaipur Elected Members
Central Zone West Zone East Zone
Dr. Gautam Prasad, Sagar Dr. Ravi Kant Modi, Jaipur Dr. Ananda Mohan Pal, Kolkata
Dr. Pushpinder Mishra, Lucknow Dr. Sailesh M Ransaria, Rajkot
North Zone South Zone
Dr. Kamal Kant, Chandigarh Dr. Ram Chandra Gowda, Bengaluru
Dr. M Sulochana, Hyderabad
Jaipur Elected Members
Central Zone West Zone East Zone
Kaustubh Jain Varsha Sukhdev, Akola Kajabaran Jana
Shailendra Singh Vashishtadhar J. Dwivedi Pradip Kumar Samanta
Rabindra Kumar Swain,Bhubaneswar
North Zone South Zone
Aamir Khan, NCR Gangadathan Nair D.
Abdul Aziz Ansari, NCR V. Ushakiran
Anil Kumar, Delhi
Surender Singh, Delhi
Jaipur Co-opted
Central Zone West Zone South Zone
Dr. Narendra Pratap Sing, Lucknow Dr. Om Prakash Gusai, Jaipur Dr. V. Appa Rao, Hyderabad
Dr. Pramod Saxena, Agra Dr. Laxman Ram Paliwal, Jodhpur Dr. R. Sarvamangla, Karnataka
Dr. Ajay Shukla, Lucknow Dr. Anthony R. Rodrigues, Goa Dr. Aneesh A.S., Kerala
North Zone East Zone 42nd
Conference Secretary
Dr. Rajnikant Verma, Delhi Dr. Satyajot Dhar, Kolkatta Prof. Jas Raj Bohra
J. N. Vyas University, Jodhpur Dr. Shiran Khan, NCR Dr. ManasNaskar, South Bengal
Dr. Prabodh Kumar Hota, Bhubaneswar
Special Invitee
Dr. Vijay Patel, Rajkot (Audit) Dr. Shoorveer Bhanavat (NATSE)

INDIAN ACCOUNTING ASSOCIATION PAST SECRETARIES
Prof. HS Kulshreshtha (Late)
(1969-1978) Prof. Mukund Lal (Late)
(1978-1993) Dr. S.K. Singh
(1993-1994)
Prof. D Prabhakara Rao
(1994-2013) Prof. G Soral
(2014-2016)
BRANCH SECRETARIES
AGRA
Prof. Pramod Kumar
(M) 09412261810
AHMEDABAD
Prof. Ketan Upadhyay
(M) 9426531851
AJMER
Prof. Shiv Prasad
(M) 9414007858
AKOLA
Dr. AM Raut (M) 09403872151
AMARKANTAK
Dr. SS Bhadoria
(M) 09425737109
AVADH
Dr. Krishna Kumar
(M) 09415471235
ALAPPUZHA
Mr. Vineeth Chandra K S (M) 09846526622
BAREILLY
Dr. AK Saxena
(M) 09411470074
BHOPAL
Dr. Sharda Gangwar (M) 09893384038
BHUVANESHWAR
Prof. R. K. Bal
(M) 09437077178
CHANDIGARH
Dr. Tejinder Pal Singh
(M) 9872708901
DELHI
Dr. Anil Kumar
(M) 09810857745
DIBRUGARH
Dr. Ashit Saha
(M) 9435002727 - 7086073209
GOA
Anson Leopold Albuquerque
(M) 9158283580
GORAKHAPUR
Prof. (Dr.) AK Tiwari
M-09415339988
GUWAHATI
Prof. Sujit Sikidar (M) 09864138864
GWALIOR
Dr. R. C. Gupta (M) 09425339306
HYDERABAD
CA K Ch. AVSN Murthy (M) 09848050475
JABALPUR
Dr. NC Tripathi
(M) 09425383514
JAIPUR
Prof. (Dr.) S.S. Modi
(M) 09829321067
JAMMU & KASHMIR
Prof. Syed Javed Kamili (M) 09419095039
JODHPUR
Dr. J. R. Bohra
(M) 09414129076
JORHAT
Porag Sarmah (M) 9435052624
KARNATAKA
Dr. BA Karunakara Reddy
(M) 09945421819
KERALA
Dr. Gabril Simon Thattil
(M) 09496275305
KOLKATA
Prof. Ananda Mohan Pal
(M) 09674383258
KOTA
Dr. Meenu Maheshwari
(M) 09461073979
LUCKNOW
Prof. Arvind Kumar (M) 09415028817
MEGHALAYA
Dr. KC Kabra
(M) 09436309498 / 09436336235
MIRZAPUR
Dr. Vikash Kumar
(M) 09721907369, 8318003917
MUMBAI
Dr. P. G. Gopalakrishnan
(M) 09967211744
NCR Dr. J.L. Gupta
Mob. 9868124224
NORTH MAHARASHTRA
Dr. AM Agrawal (M) 9422771777
PATIALA
Dr. GS Batra
(M) 09855028013
PATNA
Dharen Kumar Pandey
(M) 09576628882 / 08900652564
PONDICHERRY
Dr. R Azhagaiah
(M) 09952474095
PUNE
Dr. G.Y. Shitole
M) 9322247148
RATLAM
Dr. Abhay Pathak
(M) 09827301320
SAGAR
Prof. JK Jain
(M) 09425436471
SALEM
Dr. T.P.J. Bharathi
(M) 9443499682
SANGANER
Dr. M. L. Vadera (M) 09314240541
SAURASHTRA
Dr. Sanjay Bhayani (M) 09687355199
SHIMLA
Dr. Ashish Nag (M) 9805025126 9418188362
SOUTH BENGAL
Dr. Manas Naskar (M) 9836660670
SOUTH GUJARAT
Dr.(Mrs) Heena S. Oza
(M) 9737114382
THANE
Dr. Nishikant Jha (M) 090048 83439
TIRUPATI
Dr. Suresh Babu
(M) 09393607035
UDAIPUR
Dr. Shurveer S. Bhanawat (M) 09414156021
VARANASI
Dr. Akhil Mishra
(M) 0 94507 07599
VISHAKHAPATNAM
Prof. V. Krishna Mohan
(M) 07780531136

INDIAN ACCOUNTING ASSOCIATION
PAST PRESIDENTS
S. No. Name and Affiliation Place
1. Shri Raghunath Rai (Late), Chartered Accountant Varanasi
2. Dr. SN Sen (Late), University of Calcutta Kolkata
3. Prof. SK Raj Bhandari (Late), BHU Varanasi
4. Dr. GD Roy (Late), University of Calcutta Kolkata
5. Prof. MC Bhandari (Late), Chartered Accountant Kolkata
6. Prof. KS Mathur (Late), University of Rajasthan Jaipur
7. Dr. R Rajagopalan (Late), Former Addl. Secretary, Govt. of India New Delhi
8. Prof. LS Porwal (Late), University of Delhi Delhi
9. Prof. HC Mehrotra (Late), Agra University Agra
10. Shri SM Dugar, Ex-Member, Company Law Board, Govt. of India New Delhi
11. Prof. SP Gupta (Late), Rohilkhand University Bareilly
12. Prof. Sukumar Bhattacharya (Late), Chartered Accountant Kolkata
13. Prof. Dool Singh (Late), Kurukshetra University Kurukshetra
14. Prof. MC Khandelwal, Formerly of University of Rajasthan Jaipur
15. Prof. B Banerjee, Formerly of University of Calcutta Kolkata
16. Prof. Chote Lal, Formerly of BHU Varanasi
17. Prof. NM Khandelwal, Formerly of MDS University Ajmer
18. Prof. UL Gupta (Late), Formerly of JNV University Jodhpur
19. Prof. KR Sharma, Formerly of MLS University Udaipur
20. Prof. Bhagwathi Prasad (Late), Formerly of Karnataka University Dharwar
21. Prof. Nageswar Rao, VC, Indira Gandhi National Open University Delhi
22. Prof. B Ramesh, Goa University Goa
23. Prof. K Eresi, Bangalore University Bangalore

24. Prof. Sugan C Jain (Late), Formerly of University of Rajasthan Jaipur
25. Dr. NM Singhvi, Formerly of MDS University Ajmer
26. Prof. B Mohan, Sri Venkateswara University Tirupati
27. Prof. BS Rajpurohit, Formerly VC of JNV University Jodhpur
28. Prof. MB Shukla, MG Kashi Vidyapeeth Varanasi
29. Prof. Ranjan K Bal, Utkal University Bhubaneswar
30. Prof. KV Achalapathy, Osmania University Hyderabad
31. Prof. Shirin Rathore, Formerly of University of Delhi Delhi
32. Prof. GL Dave, Formerly of JNV University Jodhpur
33. Prof. HS Oza, Formerly of School of Commerce, Gujarat University Ahmedabad
34. Prof. Umesh Holani, Jiwaji University Gwalior
35. Prof. K Sasi Kumar, University of Kerala Thiruvananthapuram
36. Prof. SS Modi, Formerly of University of Rajasthan Jaipur
37. Prof. Pratapsinh Chauhan, Former VC, Saurashtra University Rajkot
38. Prof. D Prabhakar Rao, Formerly of Andhra University Visakhapatnam
39. Prof. Arvind Kumar, University of Lucknow Lucknow
PAST CHIEF EDITORS OF IJA
1. Prof. B Banerjee, Formerly of University of Calcutta Kolkata
2. Prof. KR Sharma, Formerly of MLS University Udaipur
3. Prof. JD Agarwal, Indian Institute of Finance Noida
4. Prof. Nageswar Rao, VC, Indira Gandhi National Open University Delhi
5. Prof. HS Oza, Formerly of School of Commerce, Gujarat University Ahmedabad
6. Prof. Umesh Holani, Jiwaji University Gwalior