Differential analysis of RNA-Seq data at the gene level using the ...

RNA-Seq Differential Gene Expression analysis
(Galaxy Server) GBIO0002
Archana BhardwajUniversity of Liege
11/21/2017 1AB-ULg

Typical RNA-Seq Experiment
11/21/2017 2AB-ULg

11/21/2017 3AB-ULg

11/21/2017 4AB-ULg

What Can You Actually Do With RNA-Seq?
RNA-seq is a powerful and versatile tool publishedwidely over the last few years.
RNA-seq used to investigate complex diseases andfind new genes for functional analysis.
RNA-seq used in one of the study to look at theconservation of RNA Polymerase III binding inmammals.
RNA-seq and microarray-based capture used toidentify and characterize rare transcripts, which arenormally undetectable.
11/21/2017 5AB-ULg

The term 'paired ends' refers to the two ends of thesame DNA molecule. So you can sequence one end,then turn it around and sequence the other end. Thetwo sequences you get are 'paired end reads'.
Paired-end RNA sequencing (RNA-Seq) enablesdiscovery applications such as detecting gene fusions incancer and characterizing novel splice isoforms.
Paired end sequence
11/21/2017 6AB-ULg

Protocol for RNA Seq Data Analysis
RNA Seq analysis is multi step procedure. Different tools are required at each step.
11/21/2017 7AB-ULg
We will use one of the galaxy server to perform RNASeqData analysis

11/21/2017 AB-ULg 8
Galaxy Community

11/21/2017 AB-ULg 9
Galaxies across the World

11/21/2017 AB-ULg 10
The Galaxy Project's public server (usegalaxy.org) canmeet many needs
General Purpose / Genomics Galaxy Servers
Domain Specific Galaxy Servers
Tool Publishing Galaxy Servers
GALAXY Server : Why to Use

11/21/2017 AB-ULg 11
Genomics Galaxy Server

11/21/2017 AB-ULg 12
Domain specific Galaxy Server

11/21/2017 AB-ULg 13
Australia: Genomics Virtual Lab (GVL)
Canada: GenAP
Norway: NeLS
Poland: PL-Grid
United Kingdom: CLIMB
Cancer: Cancer Computer
Galaxy Services : Example Geography Based Domain Based
Galaxy Main Tool Shed

Let Us Use Public GALAXY Server
Go to https://usegalaxy.org/ and create login
11/21/2017 14AB-ULg

GALAXY Server : Upload Data (I)
Click on Get Data and select Upload File from yourcomputer. Download samples files from course website.
11/21/2017 15AB-ULg

New Window will appear. Now, Click option “Choose localfile”
11/21/2017 16AB-ULg
GALAXY Server : Upload Data (II)

Now, Click option “Start”. It will upload file to server.
Now wait for 10-20 seconds.
11/21/2017 17AB-ULg
GALAXY Server : Upload Data (III)

Files will be uploaded successfully and appearswith green colour .
11/21/2017 18AB-ULg

Galaxy consist of collection of Multiple Tools . Today's session, We will use
NGS: QC and manipulationNGS Mapping NGS:RNA analysis SAMtools
11/21/2017 19AB-ULg

1.Pre-processing
2.Quality Filtration
3.Mapping or assembly
4.Expression analysis
Protocol for RNA Seq Data Analysis
11/21/2017 20AB-ULg
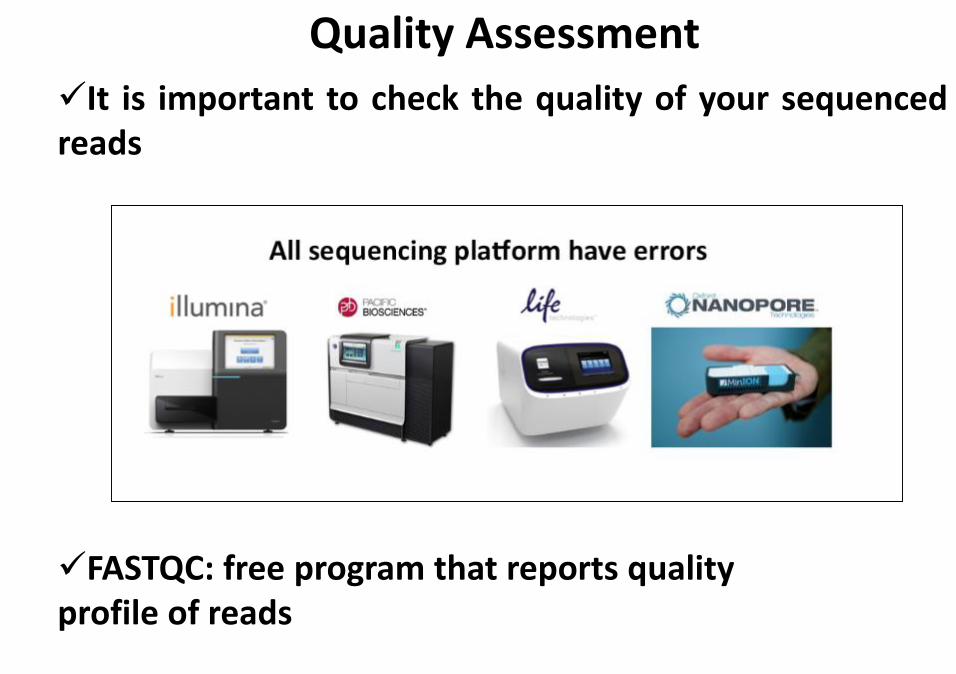
Quality Assessment
It is important to check the quality of your sequencedreads
FASTQC: free program that reports quality profile of reads
11/21/2017 21AB-ULg

Modern high throughput sequencers can generatehundreds of millions of sequences in a single run.
Before analysing this sequence to draw biologicalconclusions you should always perform some simplequality control checks to ensure that
(I) the raw data looks good and
(II) there are no problems or biases in your data
which may affect how you can usefully use it.
Quality Assessment
11/21/2017 22AB-ULg
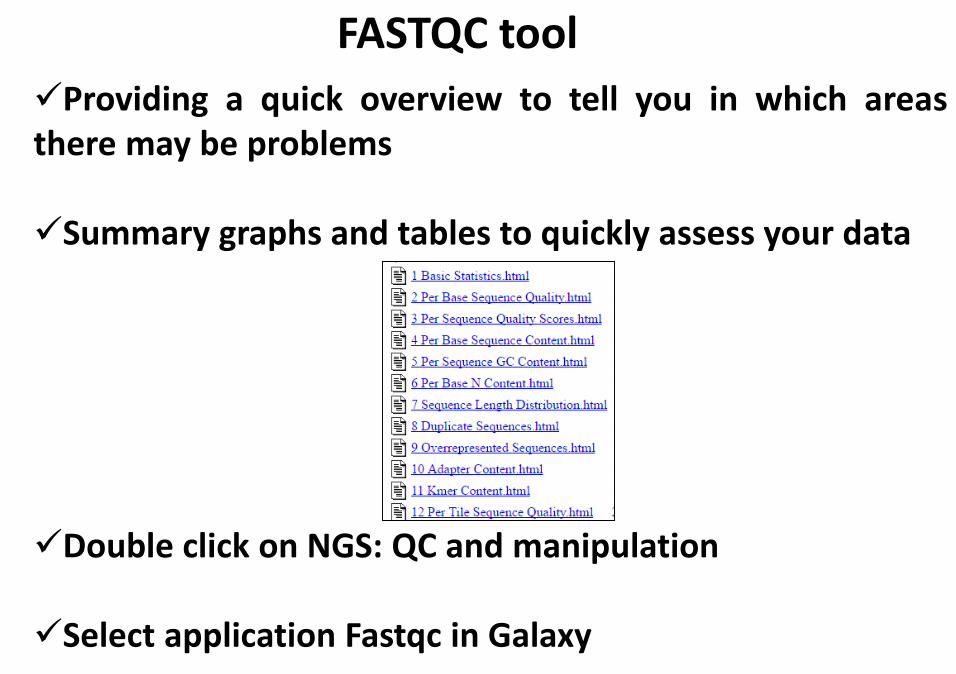
Providing a quick overview to tell you in which areasthere may be problems
Summary graphs and tables to quickly assess your data
Double click on NGS: QC and manipulation
Select application Fastqc in Galaxy
FASTQC tool
11/21/2017 23AB-ULg

Select Multiple Dataset to run multiple filesand press “Execute”
11/21/2017 24AB-ULg

You will get two types of output files :
(I) Raw data – It consist of text description
(II) Web page – It consist of detail graphicalrepresentation of your fastq data.
Click on “eye” symbol to view output files.
11/21/2017 25AB-ULg

The left hand side of the main interactive display or thetop of the HTML report shows a summary of themodules as normal (green tick), slightly abnormal(orange triangle) or very unusual (red cross).
11/21/2017 26AB-ULg

11/21/2017 27AB-ULg
Basic Sample Statistics

We must consider threshold of Quality : Q30 or above .This graph indicate we need to perform filtration on ourdata.
Good data
Bad data
11/21/2017 28AB-ULg
This view shows an overview of the range of quality valuesacross all bases at each position in the FastQ file.
Per Base Sequence Quality

By looking at figure, we can say that thereis problem in bases in position 140-150. Itcan be fixed during quality filtration step.
11/21/2017 29AB-ULg

High duplication could affect the mapping efficiencyand bias your interpretation.
11/21/2017 30AB-ULg
Duplicate Sequences
A low level of duplication may indicate a very highlevel of coverage of the target sequenceA high level of duplication is more likely to indicatesome kind of enrichment bias (eg PCR overamplification).

11/21/2017 AB-ULg 31
Per Base N Content
If a sequencer is unable to make a base call withsufficient confidence then it will normally substitute anN rather than a conventional base] call.
This module plots out the percentage of base calls ateach position for which an N was called.

Adapter : Trimming
Universal adapter
DNA Fragment of Interest
Index Adapter
6 Base index region
Sequence Start here
11/21/2017 32AB-ULg

To get the adapter sequence information, onecan contact person who performed the sequencingand can get full detail of “Adapter sequences”.
11/21/2017 33AB-ULg
Adapter ContentIf we know the adapter sequence, we can trim itusing Trimmomatic tool.

1.Pre-processing
2.Quality Filtration
3.Mapping or assembly
4.Expression analysis
Protocol for RNA Seq Data Analysis
11/21/2017 34AB-ULg

Quality Filtration
Trimmomatic :
Type of data
Quality threshold : 20 or 30
R1 and R2 files
11/21/2017 35AB-ULg
Adapter trimming: yes
Goals : To improve the quality of Data

Trimmomatic will produce four output files.
For next analysis, we will consider only R1 paired andR2 paired data While unpaired reads will be discarded.Rerun the Fastqc on paired end R1 and R2 paired endfiles and check statistical output.
11/21/2017 36AB-ULg
Quality Filtration

11/21/2017 AB-ULg 37
Let us Do Comparison of dataset
Before and After Quality filtration

Before Quality filtration : Bad Data
After Quality filtration: Good Data
11/21/2017 38AB-ULg

Before Quality filtration : Adapter contamination
Before Quality filtration : No Adapter contamination
11/21/2017 39AB-ULg

Questions ?
40AB-ULg11/21/2017

1.Pre-processing
2.Quality Filtration
3.Mapping or assembly
4.Expression analysis
Protocol for RNA Seq Data Analysis
11/21/2017 41AB-ULg

If reference genome is available
If reference genome is not available
How to decide : Mapping or assembly?
11/21/2017 42AB-ULg

11/21/2017 AB-ULg 43
Bowtie is an ultrafast and memory-efficient toolfor aligning sequencing reads to long referencesequences.
It is particularly good at aligning reads of about 50up to 100s or 1,000s of characters to relatively long(e.g. mammalian) genomes.
Bowtie supports gapped, local, and paired-endalignment modes.
Mapping tool: Bowtie

11/21/2017 AB-ULg 44
Bowtie : End to End Alignment

11/21/2017 AB-ULg 45
Bowtie : Local Alignment
Mapping quality: higher = more unique

Output fromtrimmomatic
Speciesname :Human
Reference Mapping : Bowtie
11/21/2017 46AB-ULg

It will produce the multiple output files. BAM fileconsist of complete mapping information which storesthe same data in a compressed, indexed, binary form.
The SAM Format is a text format for storing sequencedata in a series of tab delimited ASCII columns.
11/21/2017 47AB-ULg

Mapping Statistics
Multi mapped
Uniquely mapped
Multi mapped - Reads mapped more than one timeover the reference genome
Uniquely mapped – Reads mapped one time overthe reference genome
11/21/2017 48AB-ULg

Both SAM & BAM files contain an optionalheader section followed by the alignmentsection.
The header section may contain informationabout the entire file.
The alignment section contains the informationfor each sequence about where/how it aligns tothe reference genome.
Which Information is in SAM & BAM
11/21/2017 49AB-ULg

Let us convert BAM to SAM Select BAM to SAM tool under samtools
11/21/2017 50AB-ULg

SAM File : Mapping information
11/21/2017 51AB-ULg

Header Chromosome number
Position on chromosome
Query ID
11/21/2017 52AB-ULg

11/21/2017 AB-ULg 53
Millions of reads mapped to genome.
Is it possible to analyse it manually ?
Answer is NO
To estimate expression , we needed another tool.
In 2010, Trapnell et al. published cufflinks and made the transcript abundance an easy task.
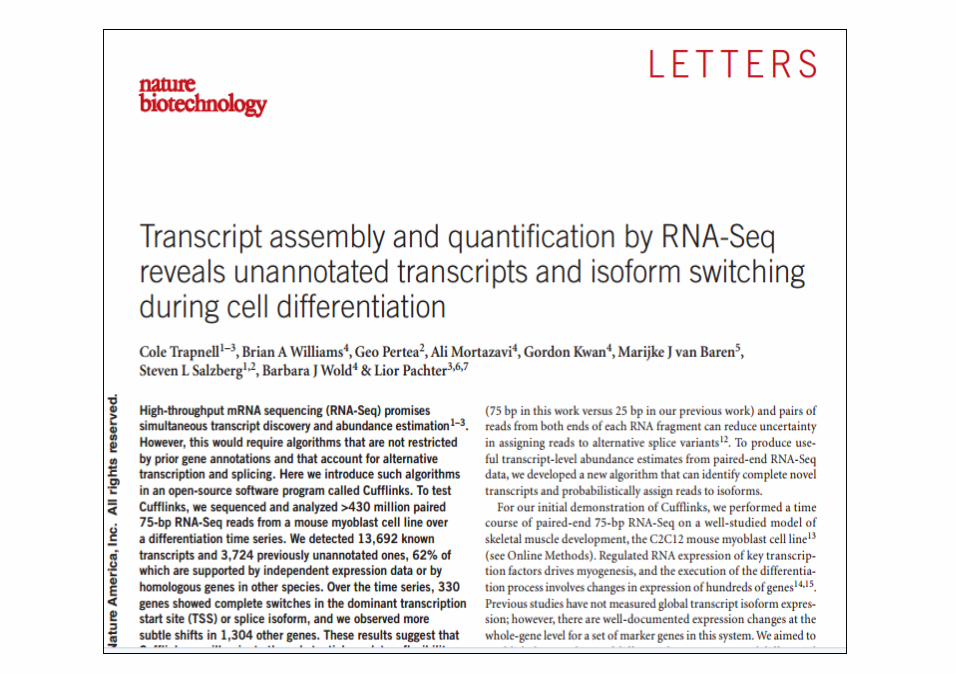
11/21/2017 AB-ULg 54

11/21/2017 AB-ULg 55
Cufflink : Assembly and Abundance Estimation

1.Pre-processing
2.Quality Filtration
3.Mapping or assembly
4.Expression analysis
Protocol for RNA Seq Data Analysis
11/21/2017 56AB-ULg

11/21/2017 AB-ULg 57
Let us run CUFFLINKS to estimate the expression of geneson genomes
Created sam file

11/21/2017 58AB-ULg
You will get 5 output files.

11/21/2017 AB-ULg 59
Counts per million : Reads counts scaled by the number of fragments you sequenced (N) times one million.
Transcripts per million (TPM) is a measurement of the proportion of transcripts in your pool of RNA.
Different Method of Abundance Estimation

11/21/2017 AB-ULg 60
FPKM is a unit of expression. FPKM is simply a unit of expression
If you have FPKM, you can easily compute TPM:

Transcript Expressions
Chromosomal position on genome Length of transcript
Expression in term of FPKM 11/21/2017 61AB-ULg
.

11/21/2017 AB-ULg 62
What if We have two different samples ??
Differential Expression
Differential Isofom Abundance
SNPs , Indels
RNA editing

11/21/2017 AB-ULg 63
Sample 2: Start Analysis
Upload Sample2 in galaxy server
Run Fastqc (Is there any issue in Quality plot ?)
Run Trimmomatic to fix if you find any issue
Run bowtie2 (Can you see mapping statistics ? If yes, how many reads mapped)
Run cufflink (what is minimum and maximum transcript expression?)

11/21/2017 AB-ULg 64
Cuffdiff is a highly accurate tool for performing samplecomparisons, and can tell you which genes are up- ordown-regulated between two or more conditions.
Go to NGS RNA Analysis in galaxy web server.
Select cuffdiff tool.
Select assembled transcript as input (output fromcufflinks tool).
Differentially expression in two different conditions

11/21/2017 AB-ULg 65
Cufflinks output as input in cuffdiff
Sample 1 in condition 1
Sample 2 in condition 2
Mapping information
Mapping information

11/21/2017 AB-ULg 66
isoforms.fpkm_tracking Transcript FPKMs
genes.fpkm_tracking Gene FPKMs. Tracks the summed FPKM of transcripts sharing each gene_id
cds.fpkm_tracking Coding sequence FPKMs. Tracks the summed FPKM of transcripts sharing each p_id, independent of tss_id
tss_groups.fpkm_tracking Primary transcript FPKMs. Tracks the summed FPKM of transcripts sharing each tss_id
Cuffdiff Output : FPKM tracking files
11/21/2017 AB-ULg 67
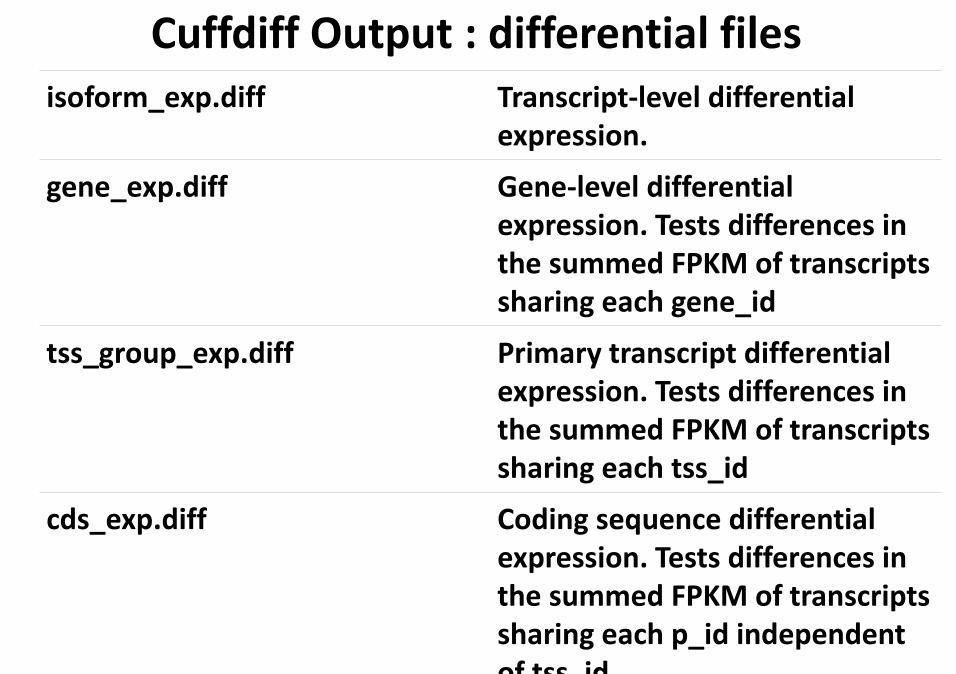
isoform_exp.diff Transcript-level differential expression.
gene_exp.diff Gene-level differential expression. Tests differences in the summed FPKM of transcripts sharing each gene_id
tss_group_exp.diff Primary transcript differential expression. Tests differences in the summed FPKM of transcripts sharing each tss_id
cds_exp.diff Coding sequence differential expression. Tests differences in the summed FPKM of transcripts sharing each p_id independent of tss_id
Cuffdiff Output : differential files

11/21/2017 AB-ULg 68
Cuffdiff Output :

11/21/2017 AB-ULg 69
Cuffdiff Output :
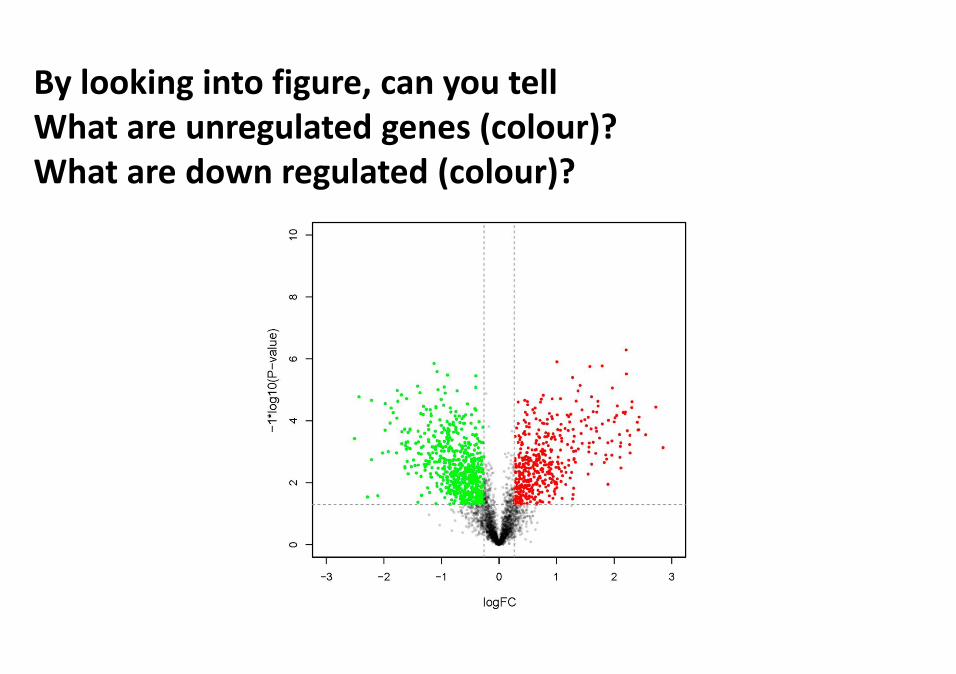
Count genes showing log2 => 2 , known as unregulatedgenes (increase in expression of a gene in Condition A ascompared to B).Count genes showing log2 < 2 , known as downregulated genes (Decrease in expression of a gene inCondition A as compared to B).
11/21/2017 AB-ULg 70
By looking into figure, can you tellWhat are unregulated genes (colour)? What are down regulated (colour)?

Questions ?
71AB-ULg11/21/2017