RNA Lab (Isolation, quantification and qPCR analysis) MCB7300.
26
RNA Lab (Isolation, quantification and qPCR analysis) MCB7300
-
Upload
franklin-bond -
Category
Documents
-
view
230 -
download
3
Transcript of RNA Lab (Isolation, quantification and qPCR analysis) MCB7300.
RNA Lab(Isolation, quantification and qPCR
analysis)
MCB7300
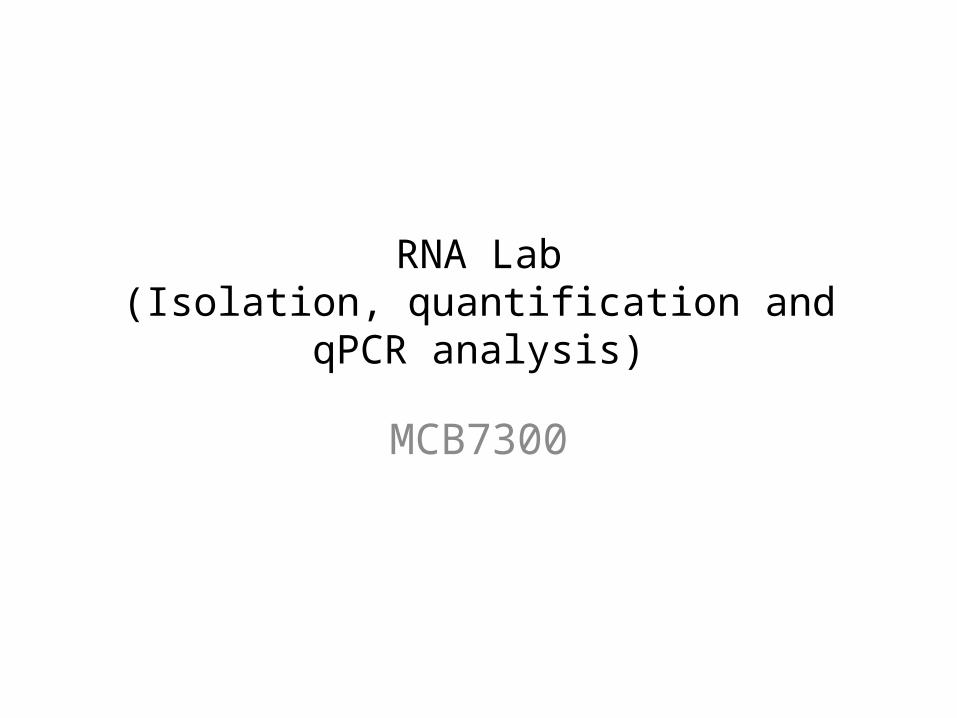
Work Flow
Day 1. RNA isolation from Arabidopsis leaves
Day 1. RNA quantification in Nanodrop and Bioanalyzer analysis
Day 1. Reverse transcription to cDNA
Day 2. Setting up for qPCR
Day 2. Data analysis

Method of evaluation
• You will have an in class quiz worth 50 points on Wednesday (Feb. 18th) and a lab report worth 50 points which must be turned in by next Wednesday (i.e., Feb. 25).
• Please submit a hard copy of your lab report.
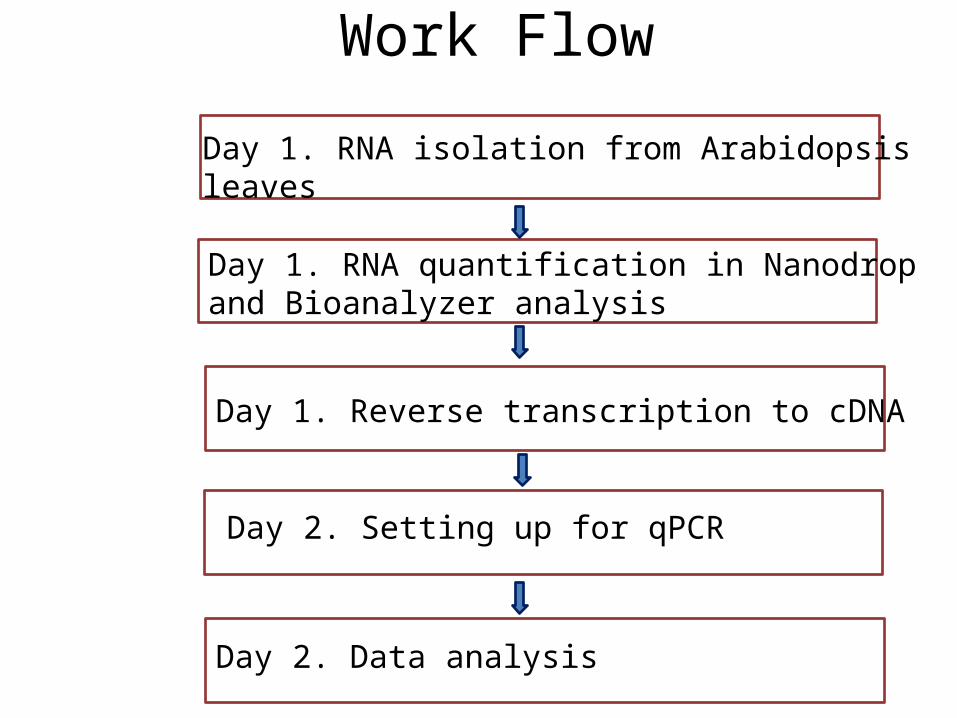
1. What is the maximum amount of starting material? 100 mg
2. Is the yield of total RNA the same for the same amount of starting material for different plant species?
No, the yield varies for different plant species. 3. Which lysis buffer can be used for plant materials?
Buffer RLT (Guanidine Isothiocyanate) is used for all tissues except endosperm and tissues containing endosperms (e.g., seeds).
1. Buffer RLC (Guanidine Hydrochloride) is used for seeds with endosperm 4. Is total RNA isolated with RNeasy kit free of genomic DNA? No, most (but not all) of DNA is eliminated. Therefore, if total RNA will be used for downstream application such as Reverse-transcription-PCR (RT-PCR), then DNase-treatment must be carried out for the total RNA. 5. What is the role of QIAshredder homogenizer? It simultaneously removes insoluble material and reduces the viscosity of the lysates by disrupting gelatinous material.
RNA Isolation of leaves of Arabidopsis
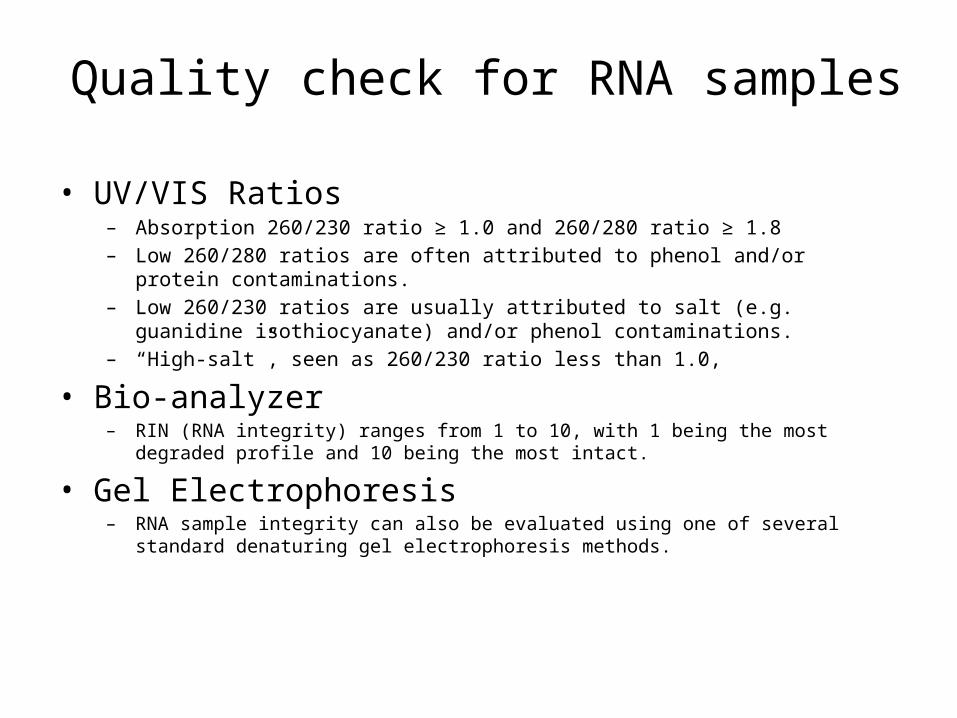
Quality check for RNA samples
• UV/VIS Ratios– Absorption 260/230 ratio ≥ 1.0 and 260/280 ratio ≥ 1.8– Low 260/280 ratios are often attributed to phenol and/or protein
contaminations.– Low 260/230 ratios are usually attributed to salt (e.g. guanidine
isothiocyanate) and/or phenol contaminations.– “High-salt”, seen as 260/230 ratio less than 1.0,
• Bio-analyzer– RIN (RNA integrity) ranges from 1 to 10, with 1 being the most degraded profile
and 10 being the most intact.
• Gel Electrophoresis– RNA sample integrity can also be evaluated using one of several standard
denaturing gel electrophoresis methods.
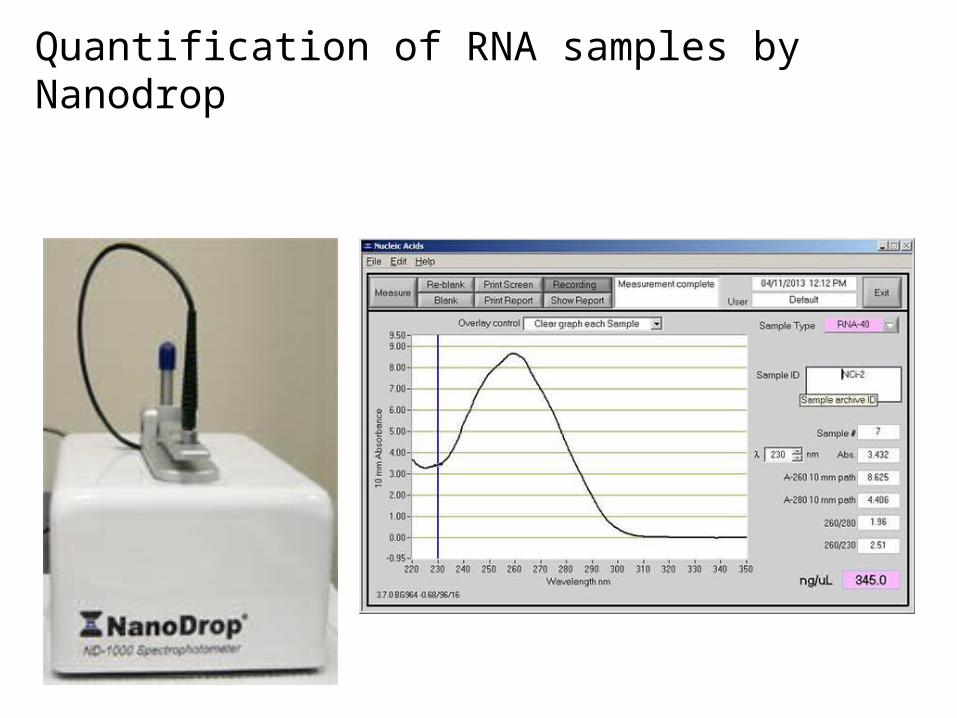
Quantification of RNA samples by Nanodrop
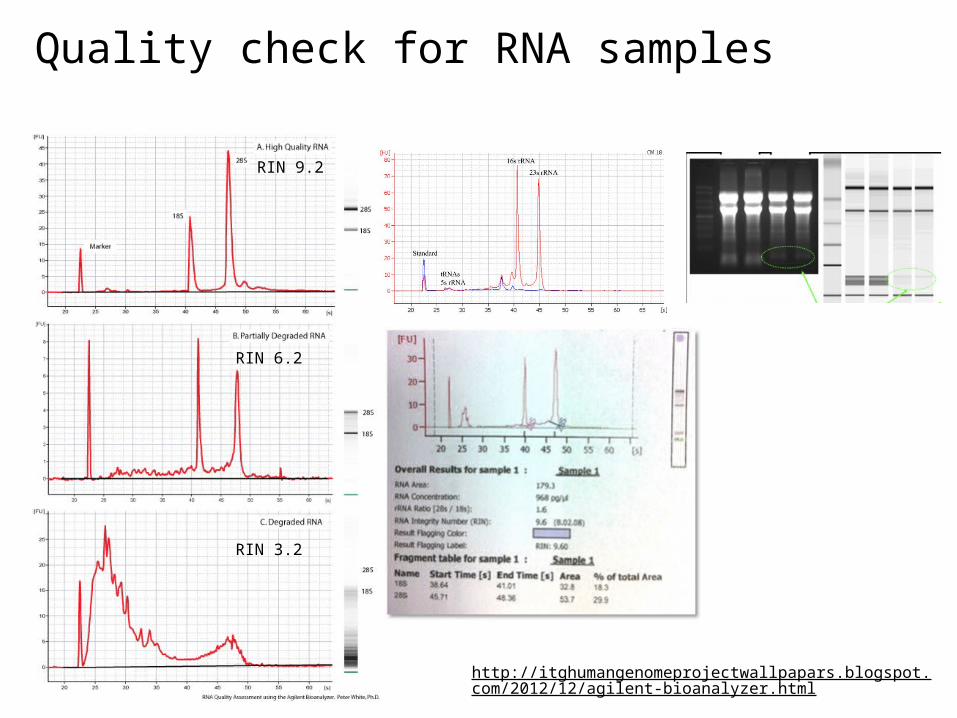
Quality check for RNA samples
RIN 9.2
RIN 6.2
RIN 3.2
http://itghumangenomeprojectwallpapars.blogspot.com/2012/12/agilent-bioanalyzer.html
Real-Time qPCR• Real‐time qPCR is the most sensitive and reliable
method for detection and quantification of nucleic acids (DNA, cDNA, & RNA) levels.
• It is based on detection and quantification of fluorescence.
• Emitted from a reporter molecule at real time.• This detection occurs during the accumulation of
the PCR product with each cycle of amplification, thus allows monitoring the PCR reaction during early & exponential phase where the first significant increase in the amount of PCR product correlates to the initial amount of target template.
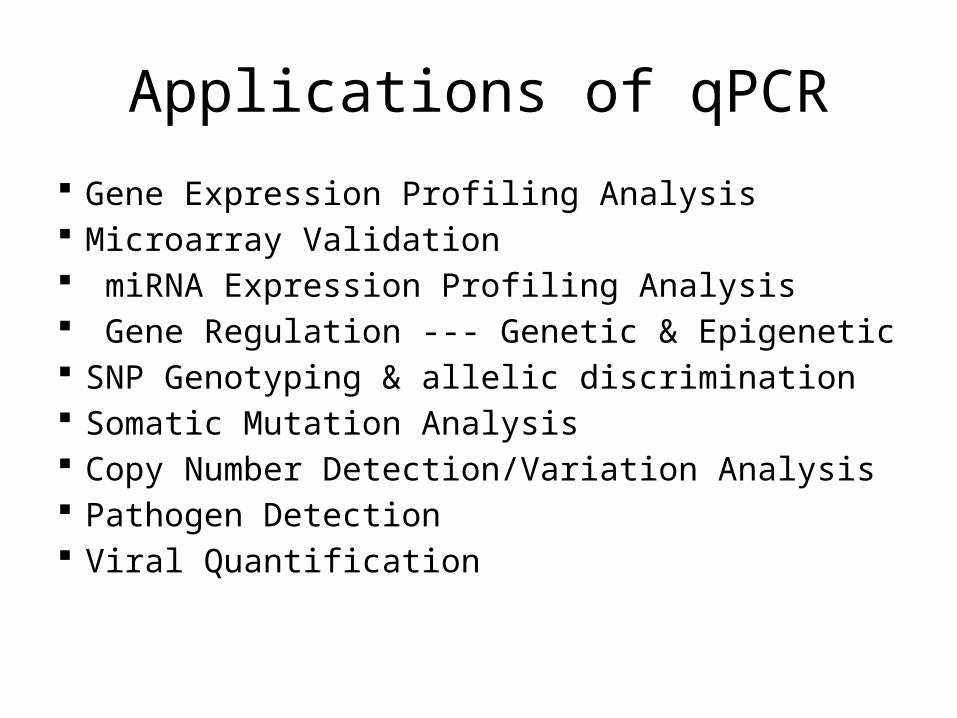
Applications of qPCR
Gene Expression Profiling Analysis Microarray Validation miRNA Expression Profiling Analysis Gene Regulation ‐‐‐ Genetic & Epigenetic SNP Genotyping & allelic discrimination Somatic Mutation Analysis Copy Number Detection/Variation Analysis Pathogen Detection Viral Quantification
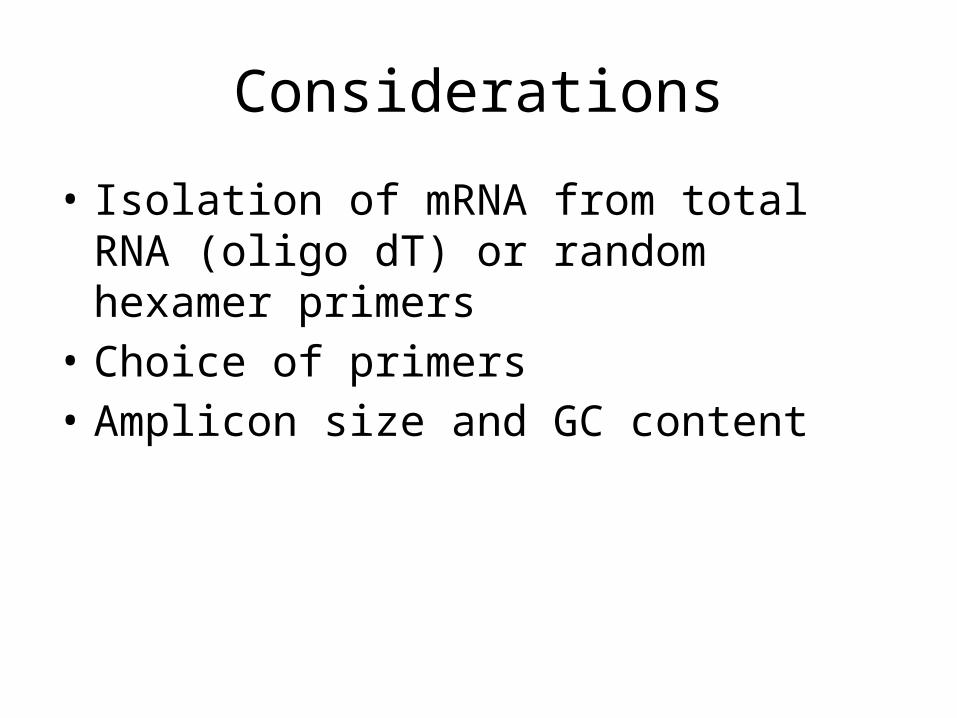
Considerations
• Isolation of mRNA from total RNA (oligo dT) or random hexamer primers
• Choice of primers• Amplicon size and GC content
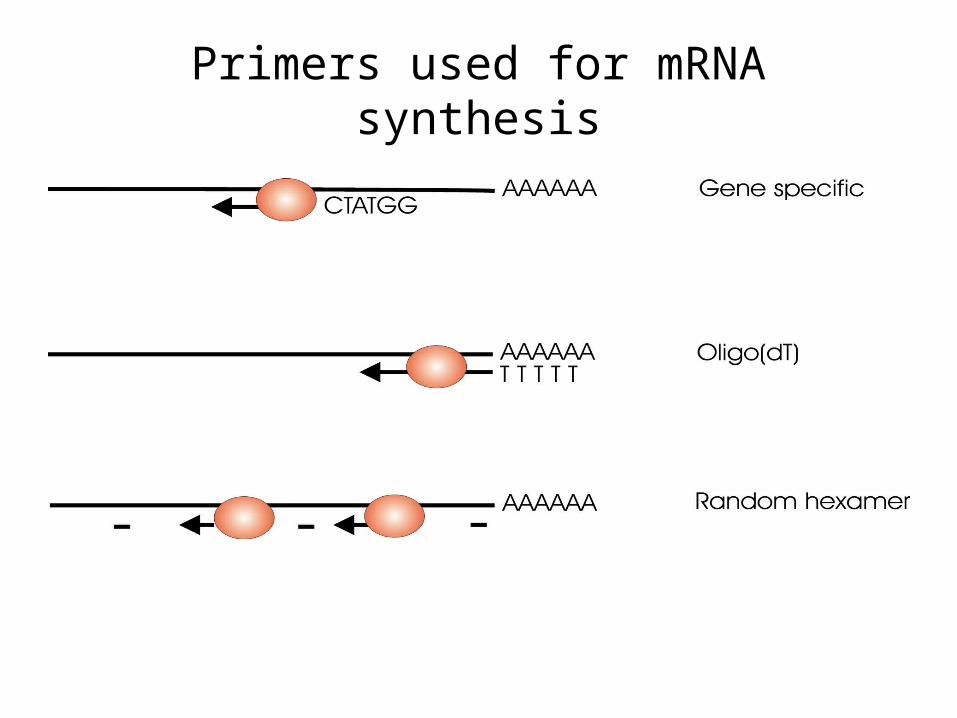
Primers used for mRNA synthesis

SYBR-based Quantitative PCR
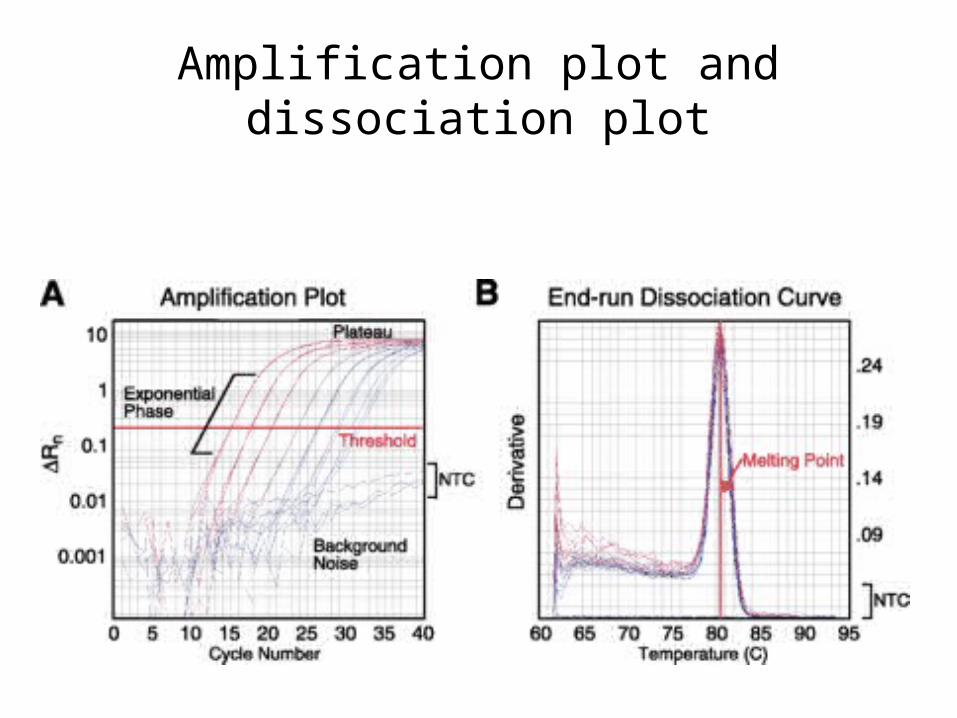
Amplification plot and dissociation plot
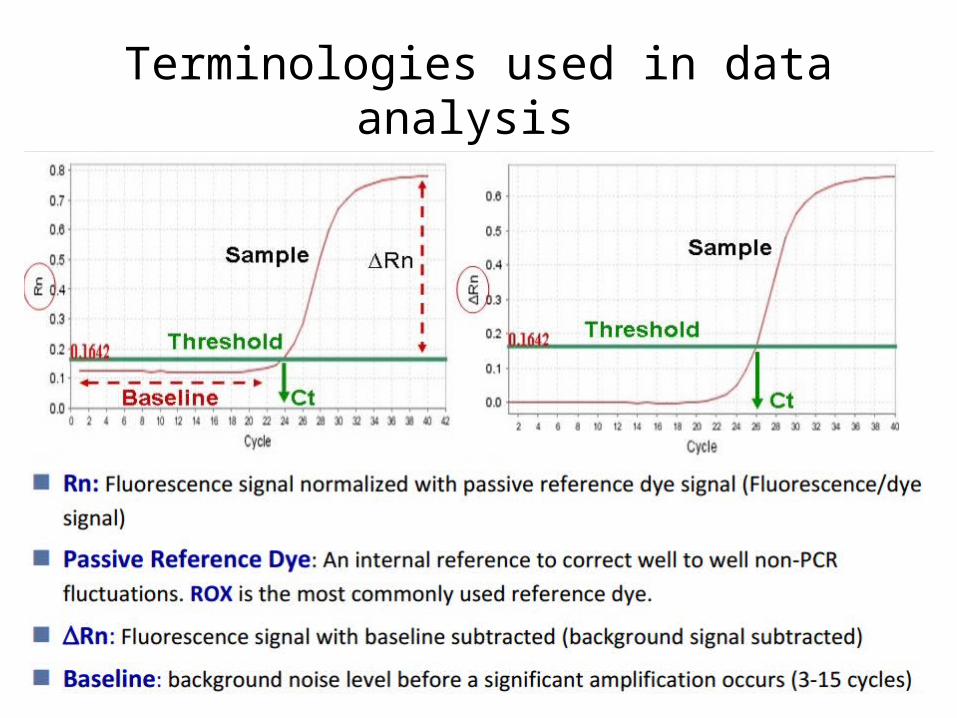
Terminologies used in data analysis

Melting curve analysis
Real time qPCR analysis
• CT values = cycle number at which detectable signal is
achieved
• Lower CT= Larger amount of starting material in the sample
• Higher CT= Lower amount of starting material (template) in the
sample
• Two basic methods of qPCR analysis
– Absolute quantification
– Relative quantification
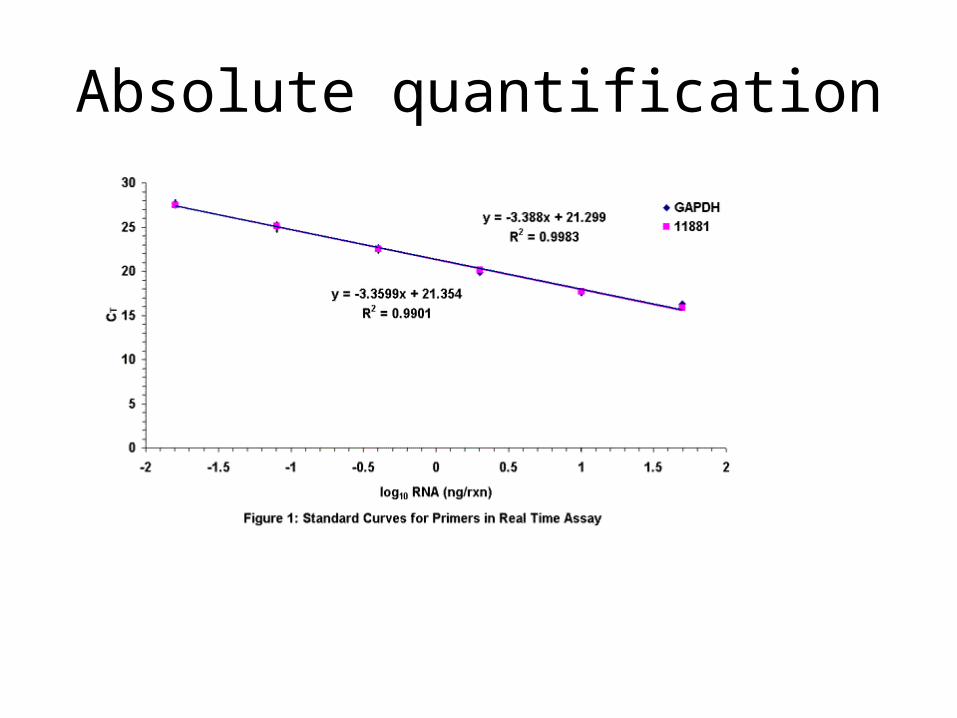
Absolute quantification

Linear regression in quantification
Applications
• Viral load determination
• Gene copy number determination
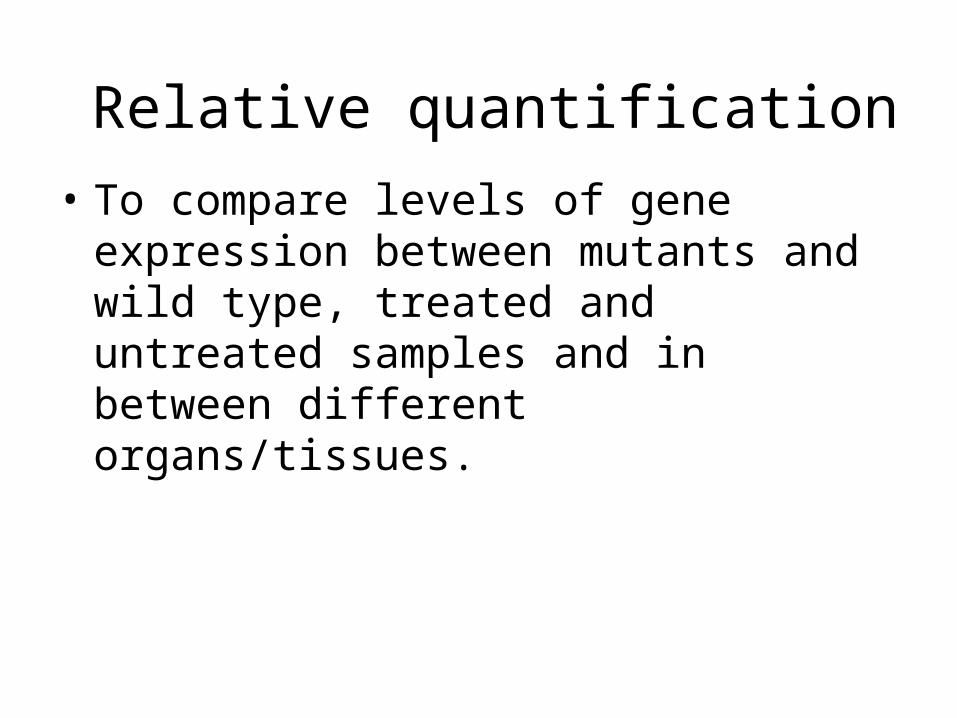
• To compare levels of gene expression between mutants and wild type, treated and untreated samples and in between different organs/tissues.
Relative quantification
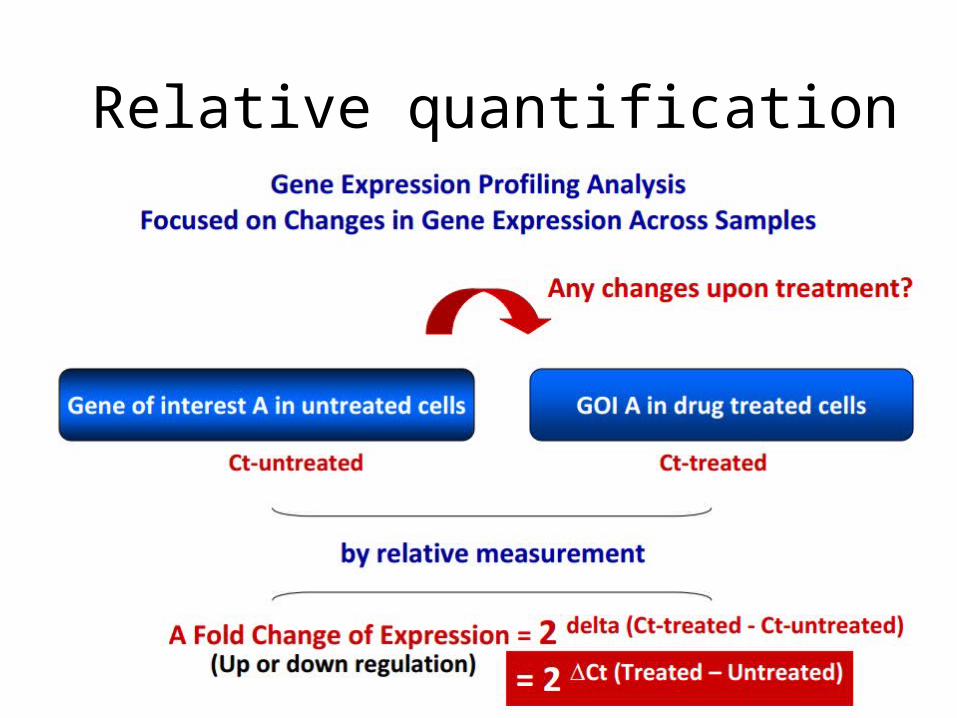
Relative quantification
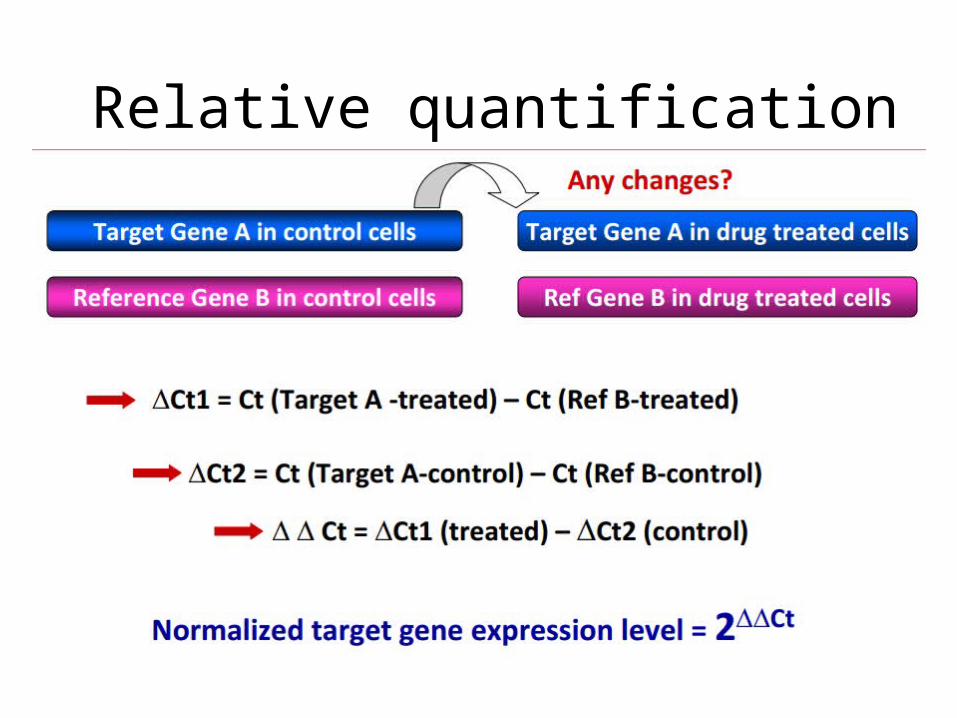
Relative quantification

Relative quantification
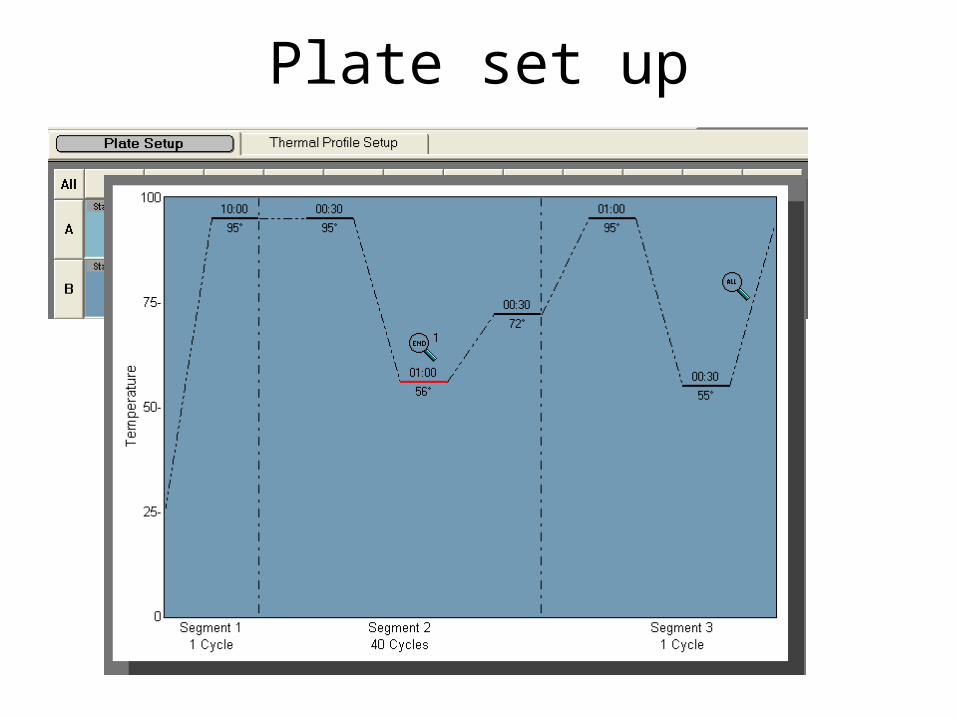
Plate set up
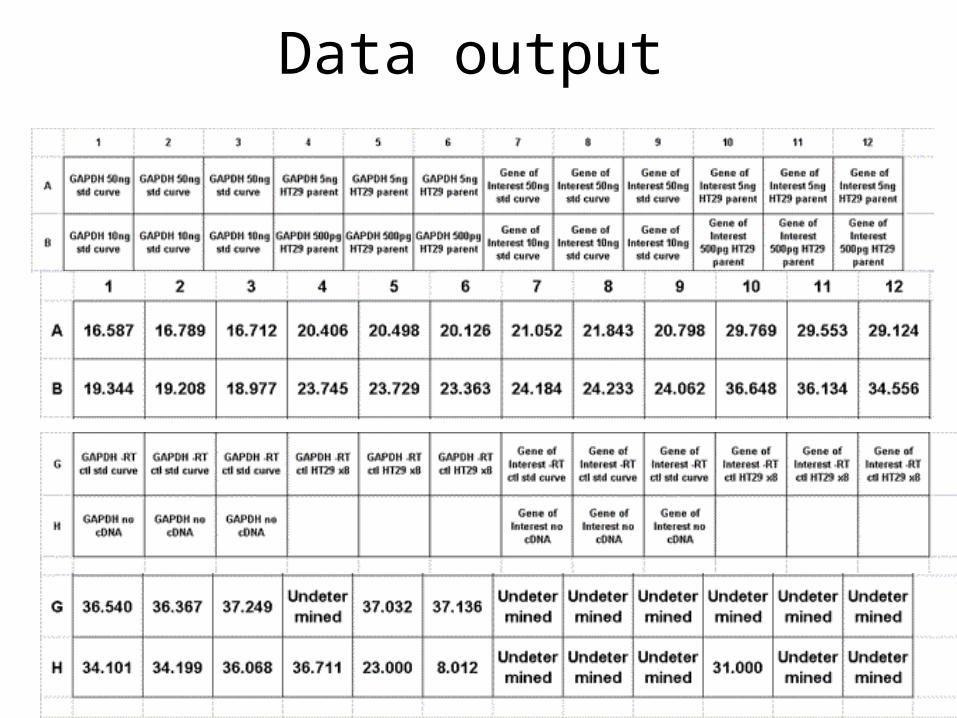
Data output
References
• http://sabiosciences.com/manuals/IntrotoqPCR.pdf
• http://relative.gene-quantification.info/
• http://www.genomics.agilent.com/• http://www.protocol-online.org/• http://www.qiagen.com/us/products/• https://www.promega.com/products/