RIZAL COMMERCIAL BANKING CORPORATION AND …s3.amazonaws.com/zanran_storage/ COMMERCIAL BANKING...
206
SEC Number 17514 PSE Code _____ _ File Number ________ _____________________________________________ RIZAL COMMERCIAL BANKING CORPORATION AND SUBSIDIARIES _____________________________________ (Company’s Full Name) Yuchengco Tower, RCBC Plaza 6819 Ayala Ave. corner Sen G.J. Puyat Ave., Makati City _________________________________________ (Company’s Address) 894-9000 ______________________________________________ (Telephone Number) December 31, 2009 _______________________________________________ (Fiscal Quarter Ending) SEC FORM 17-A ________________________________________________ Form Type _________________________________________________ Amendment Designation (if applicable) _________________________________________________ Period Ended Date __________________________________________________ (Secondary License Type and File Number)
-
Upload
nguyencong -
Category
Documents
-
view
248 -
download
7
Transcript of RIZAL COMMERCIAL BANKING CORPORATION AND …s3.amazonaws.com/zanran_storage/ COMMERCIAL BANKING...

SEC Number 17514 PSE Code _____ _ File Number ________
_____________________________________________
RIZAL COMMERCIAL BANKING CORPORATION AND SUBSIDIARIES
_____________________________________
(Company’s Full Name)
Yuchengco Tower, RCBC Plaza 6819 Ayala Ave. corner Sen G.J. Puyat Ave., Makati City
_________________________________________
(Company’s Address)
894-9000 ______________________________________________
(Telephone Number)
December 31, 2009 _______________________________________________
(Fiscal Quarter Ending)
SEC FORM 17-A ________________________________________________
Form Type _________________________________________________
Amendment Designation (if applicable)
_________________________________________________ Period Ended Date
__________________________________________________
(Secondary License Type and File Number)

SECURITIES AND EXCHANGE COMMISSION SEC FORM 17-A
ANNUAL REPORT PURSUANT TO SECTION 17 OF THE SECURITIES REGULATION CODE AND
SECTION 141 OF CORPORATION CODE OF THE PHILIPPINES
1. For the fiscal year ended December 31, 2009 2. Commission identification number 17514 3. BIR Tax Identification No. 000-599-760-000 4. Exact name of registrant as specified in its charter: RIZAL COMMERCIAL BANKING
CORP.
5. Philippines
Province, Country or other jurisdiction of incorporation or organization
6. (SEC Use Only) Industry Classification Code
7. RCBC Plaza Yuchengco Tower 6819 Ayala Ave. cor. Sen. Puyat Avenue, Makati City
1200
Address of principal office Postal Code
8. 632/ 894-9000 Registrant’s telephone number, including area code
9. Not applicable_____________________ Former name, former address & former fiscal year, if changed since last report
10.Securities registered pursuant to Sections 4 and 8 of the RSA
Number of Shares of Common Stock Title of Each Class Outstanding and Amount of Debt Outstanding Common Stock, P10 par value 898,129,515 (as of 12/31/09)
11.Are any or all of these securities listed on the Philippine Stock Exchange
Yes (x) No ( )
12.Check whether the registrant:
(a) has filed all reports required to be filed by Section 17 of the SRC thereunder or Section 11 of the RSA and RSA Rule 11(a)-1 thereunder and Sections 26 and 141 of the Corporation Code of the Philippines during the preceding 12 months (or for such shorter period that the registrant was required to file such reports) : (Note : Sec. 26 of the CCP deals with reporting of election of directors or officers to the SEC; Sec. 141 with the submission of financial statements to the SEC.) Yes (x) No ( )
(b) has been subject to such filing requirements for the past 90 days Yes (x) No ( ) 13.Aggregate market value of the voting stock held by non-affiliates:
P7,591,570,303.75 (as of March 31, 2010, P18.25 per share)

TABLE OF CONTENTS
Page No. PART I - BUSINESS AND GENERAL INFORMATION Item 1. Business 1 Item 2. Properties 14 Item 3. Legal Proceedings 26 Item 4. Submission of Matters to a Vote of Security Holders 27 PART II - OPERATIONAL AND FINANCIAL INFORMATION Item 5. Market for Registrant’s Common Equity and Related Stockholder Matters 27 Item 6. Management’s Discussion and Analysis or Plan of Operation 30 Item 7. Financial Statements 55 Item 8. Information on Independent Accountant and Other Related Matters 55 PART III - CONTROL AND COMPENSATION INFORMATION Item 9. Directors and Executive Officers of the Registrant 55 Item 10. Executive Compensation 64 Item 11. Security Ownership of Certain Beneficial Owners and Management 66 Item 12. Certain Relationships and Related Transactions 67 PART IV – CORPORATE GOVERNANCE Item 13. Performance Evaluation System 69 PART V - EXHIBITS AND SCHEDULES Item 14. a. Exhibits 69 b. Reports on SEC Form 17-C (Current Report) 69 SIGNATURES 71 INDEX TO FINANCIAL STATEMENTS AND SUPPLEMENTARY SCHEDULES 72 INDEX TO EXHIBITS 201

PART I - BUSINESS AND GENERAL INFORMATION Item 1. Business Rizal Commercial Banking Corporation (RCBC) is a universal bank in the Philippines that provides a wide range of banking and other financial products and services, including commercial and retail banking, credit cards, asset management and treasury and investment banking products and services. It has total resources of P288.52 billion and total networth of P30.54 billion, including minority interest, as of end-December 2009. The Bank ranked fourth (4th) in terms of capital among private local banks (excluding government banks). In terms of business centers, the Bank, excluding government-owned and foreign banks, also ranked fourth (4th) with a nationwide network of 338 business centers, inclusive of 3 extension offices, supplemented by 471 ATMs, as of December 31, 2009. The Bank offers commercial, corporate and consumer banking products and services throughout the Philippines, as well as treasury, cash management and remittance products and services. RCBC also enters into forward currency contracts as an accommodation to its clients and as a means of managing its foreign exchange exposures. The Bank and its subsidiaries are engaged in all aspects of traditional banking, investment banking, retail financing (credit cards, auto loans and mortgage/housing loans), leasing, foreign exchange and stock brokering. The Bank, incorporated under the name Rizal Development Bank, began operations as a private development bank in the province of Rizal in 1960. It was acquired in 1962 by members of the Yuchengco Group of Companies (YGC), a financial services conglomerate with a strong market presence in insurance and other risk management services. In 1963, the Bank received approval from the Bangko Sentral ng Pilipinas to operate as a commercial bank and began operations under its present name, Rizal Commercial Banking Corporation (RCBC). In 1973, it formed alliances with two foreign banks, Continental Illinois National Bank and Trust Co. of Chicago USA (ConIll) and UFJ Holdings Inc. (UFJ), then known as the Sanwa Bank Ltd. of Japan. The relationship with ConIll ended in 1985 after it sold its shareholding to UFJ. RCBC acquired its universal banking license in 1989, marking another milestone in its history, and has been listed on the Philippine Stock Exchange Inc. (PSE) since 1996. RCBC’s common shares are 48.10% owned by Pan Malayan Management and Investment Corporation (PMMIC), a company incorporated and domiciled in the Philippines. PMMIC is the holding company of the flagship institutions of the YGC and other investments. The registered address of RCBC is Yuchengco Tower, RCBC Plaza, 6819 Ayala Avenue, Makati City. Additionally through its universal banking license, the Bank is allowed to perform a number of expanded commercial and investment functions and to invest in the equity of a variety of allied and non-allied financial and non-financial undertakings. The Bank’s subsidiaries and investments in allied undertakings are as follows: RCBC Capital Corporation (RCBC Capital), a 99.964% owned subsidiary, was established in 1974 as the Bank’s investment banking subsidiary. It offers a complete range of investment banking and financial consultancy services which include (i) the underwriting of equity, quasi-equity and debt securities on a firm or best efforts basis for private placement or public distribution; (ii) the syndication of foreign currency or peso loans; and (iii) financial advisory services. RCBC Capital registered a consolidated net income of P176.33 million in 2009.

2
Bankard, Inc. (Bankard), a 91.69% owned subsidiary (together with RCBC Capital's 25.11%) was acquired from Equitable PCI Bank in 2000 by RCBC Capital. Until December 2006, the Bank conducted its credit card operations through Bankard. It continues to provide services to the credit card business of the Bank. Bankard registered a net income of P103.25 million in 2009. RCBC Securities, Inc. (“RCBC Securities”), a wholly owned subsidiary of RCBC Capital, is engaged in the electronic and traditional trading of listed securities and in providing corporate and market research. In 2009, its net income was P16.24 million.
RCBC Savings Bank(RSB), a wholly-owned subsidiary of the Bank, was established in 1996 as the Bank’s consumer banking arm. RSB provides deposit products, real estate loans, auto loans and personal loans. In 2009, RSB’s net income was P831.57 million. Currently, RSB has 117 business centers nationwide. Merchants Savings and Loan Association, Inc. (Merchants Bank), a 96.38% owned subsidiary acquired on May 15, 2008. Under the BSP approval, RCBC would upgrade 20 of the 21 thrift bank licenses of Merchants Bank into universal bank business centers and transfer Merchants Bank's Head Office (HO) and HO branch from Makati City to Koronadal City, South Cotabato. In 2009, Merchants Bank had a net loss of P5.48 million. Merchants Bank is a thrift bank established in 1977. It had 21 operating branches, 7 branches were located in Metropolitan Manila while the rest were dispersed over Luzon (7), Visayas (4), and Mindanao (3). As of December 31, 2009, all the approved twenty (20) branches of Merchants Bank were converted into RCBC business centers.
RCBC International Finance Limited (RCBC IFL), a 99.99% owned subsidiary of the Bank, was established in 1979 and is the Bank’s overseas branch in Hong Kong. It is primarily engaged in the remittance business. In 2009, RCBC IFL registered a consolidated net income of P3.88 million.
RCBC Investment Ltd. (RCBC IL), wholly owned subsidiary of RCBC IFL, is a Hong Kong company established in 1990. RCBC IL primarily engages in the remittance business. In 2009, it registered a net loss of P1.06 million.
RCBC North America, Inc. (formerly RCBC California International, Inc), a wholly owned subsidiary of the Bank, was established in 1991 as a foreign exchange remittance office in California to meet the needs of Filipinos in the United States for a faster and more reliable means of sending funds to their beneficiaries in the Philippines. The corporation’s new name was adopted on September 28, 2007. In 2009, RCBC North America, Inc. had a net loss of P68.55 million. RCBC Forex Brokers Corporation (RCBC Forex), a wholly owned subsidiary of the Bank, was incorporated in 1998. RCBC Forex is primarily engaged in dealing and brokering currencies in foreign exchange contracts with local and international clients. RCBC Forex’s 2009 net income was P60.59 million.
RCBC TeleMoney Europe S.p.a. (RCBC TeleMoney), a wholly owned subsidiary of the Bank, was established in 1995 in Rome, Italy to engage in the remittance business. RCBC TeleMoney’s 2009 unaudited net loss was P570.49 thousand.

3
RCBC Land Inc. (RCBC Land), a joint venture of the Bank and Pan Malayan Management & Investment Corporation was established in 1997. The Bank currently has a 49.0% stake in RCBC Land, which is engaged in housing ventures, homebuilding and development, land banking, subdivision development and joint ventures with home developers. RCBC Land is not a consolidated subsidiary of the Bank. In 2009, it had a net loss of P6.36 million. RCBC Realty Corporation (RCBC Realty), is a joint venture between RCBC Land and the Government (of Singapore) Investment Corporation. It was originally a 60% owned subsidiary of RCBC Land. In December 2007, RCBC Land transferred 25% of its equity ownership to RCBC through a deed of assignment in partial settlement of the former’s outstanding loan. RCBC Realty is engaged in managing and developing real estate infrastructure projects. It is the owner of the RCBC Plaza where the Bank’s corporate headquarters is located. The RCBC Plaza, a twin tower office and condominium complex at the corner of Ayala Avenue and Senator Gil J. Puyat Avenue in Makati City, also contains a theater, museum, chapel and retail area. Its 2009 net income was P459.24 million. Pres. Jose P. Laurel Rural Bank, Inc. (JPL), 99% was acquired by the Bank in February 2009. JP Laurel Bank is primarily engaged in microfinancing and development of small businesses. Its 2009 net loss was P112.18 million. Niyog Property Holdings, Inc. (NPHI), was incorporated on September 13, 2005 to purchase, subscribe for or otherwise dispose of real and personal property of every kind and description but not as an investment company. On May 25, 2009, RCBC approved the reclassification of its investment in NPHI from Investment Property account to Investments in Subsidiaries and Associates account in accordance with BSP Circular No. 520. This resulted in the consolidation of NPHI’s assets, liabilities and net income in RCBC’s financial statements as of and for year ended December 31, 2009. Its 2009 net loss was P1.111 million. Additionally, as a universal bank, RCBC has equity investments in various industries which are vital to the country’s economic growth and which also serve the purpose of diversifying the Bank’s sources of income. Among these are Honda Cars Philippines, Inc.; Isuzu Philippines Corporation; Subic Power Corporation; Luisita Industrial Park Corporation; and Pilipinas Shell Petroleum Corporation. Products and Services. Through the years, RCBC has been able to develop a wide range of financial products and services covering deposit taking, international banking services, lending, project financing to merchant banking. In 2009, the following products and services were launched:
MyWallet variants e.g. WOW, MRT Dollar Dragon Savings Chinese Yuan Savings
Several products and services are planned for launching to the public in 2010. These new products and services are meant to offer more value-added features and further improve product delivery and service as well as enhance the Bank’s competitive advantage
The updated list of the Bank’s products and services is presented below:

4
A. DEPOSITS
Peso Deposits Checking Accounts Regular Checking SuperValue Checking eWoman Checking Rizal Enterprise Checking
Savings Accounts Regular Savings
Dragon Savings Super Earner eWoman Savings SSS Pensioner Payroll Savings Account Student Savings ATM
Cash Card RCBC My Wallet
Savings Accounts with Automatic Transfer (SWAT) Time Deposits
Regular Time Deposit Special Time Deposit Premium Time Deposit
Foreign Currency Deposits
Savings Accounts US Dollar Japanese Yen Euro Dollar British Pounds Canadian Dollar
Chinese Yuan Australian Dollar Swiss Franc Singapore Dollar Time Deposits US Dollar Japanese Yen Euro Dollar British Pounds Canadian Dollar Australian Dollar Swiss Franc
B. ELECTRONIC BANKING CHANNELS
Automated Teller Machines Bills Payment Machines Enterprise Banking RCBC Access One Personal RCBC Access One Corporate RCBC Phone Banking

5
RCBC Mobile Banking myRCBC Mobile Banking via BancNet BancNet Online BancNet POS System
C. REMITTANCE SERVICES
RCBC TeleMoney Products Tele-Remit Tele-Credit
Tele-Door2Door Tele-Cash Card Tele-Pay Tele-OFW (Overseas Free Way) Electronic Remittance Channel
TeleDirect Internet Banking
D. LOANS
Commercial Loans (Peso and/or Foreign Currency) Fleet and Floor Stock Financing Short-term Credit Facilities Term Loans Trade Finance Consumer Loans Auto Insurance Loan Car Loans Credit Card Gold Cheque Housing Loans Salary Loans Special Lending Facilities DBP Wholesale Lending Facilities
Land Bank Wholesale Lending Facilities SSS Wholesale Lending Facilities
BSP Rediscounting Facility Guaranty Facilities
Small Business Guarantee and Finance Corporation (SBGFC) Philippine Export-Import Credit Agency (PhilEXIM) Home Guaranty Corporation (HGC)
E. PAYMENT AND SETTLEMENT SERVICES Check Clearing Domestic Letters of Credit Fund Transfers Collection Services Cash Card Demand Drafts (Peso and Dollar) Gift Checks Manager’s Checks Payroll Services

6
Telegraphic Transfers Traveler's Checks International Trade Settlements Import/Export Letters of Credit Documents Against Payment/Acceptance Open Account Arrangements Overseas Workers Remittances Securities Settlement F. TREASURY AND GLOBAL MARKETS Foreign Exchange
Foreign Exchange Spot Foreign Exchange Forwards Foreign Exchange Swaps Structured Foreign Exchange Products
Fixed Income Peso Denominated Government Securities and other Debt Instruments
Treasury Bills Fixed Rate Treasury Notes (FXTNS) Retail Treasury Bonds (RTB) Local Government Units Bonds (LGUs) Long Term Commercial Papers (LTCPs)
US$ Denominated Sovereign Bonds Republic of the Philippines (RoP) Bonds
Corporate Bonds and other Debt Instruments Advisory Servicess G. TRUST SERVICES Trusteeship
Retirement Fund Management Corporate and Institutional Trust Pre-Need Trust Fund Management Employee Savings Plan Living Trust Estate Planning Mortgage/Collateral Trust Bond Trusteeship
Agency Safekeeping
Escrow Investment Management Loan and Paying Agency
Bond Registry and Paying Agency Facility Agency Receiving Agency
Sinking Fund Management Stock Transfer and Dividend Paying Agency Crest Fund

7
Unit Investment Trust Funds Rizal Peso Money Market Fund Rizal Dollar Money Market Fund Rizal Peso Bond Rizal Dollar Bond Fund Rizal Equity Fund Rizal Balanced Fund
H. CORPORATE CASH MANAGEMENT
Collection and Receivables Services Agent Collection Bills Collection Check Manager Auto Debit Arrangement
Payment Management Services Employee Payments Service eCheck Payment Solution RCBC Payment Gateway
Third Party Services Collection and Receivables Services BancNet On-Line BancNet Direct Bills Payment BancNet Point of Sale System
Payment Management Services BancNet EDI-SSSNet I. INVESTMENT BANKING Underwriting of Debt and Equity Securities for distribution via Public Offering or Private Placement:
Common and Preferred Stock Convertible Preferred Stock and Bonds
Long- and Short-Term Commercial Papers and Corporate Notes Corporate and Local Government Bonds
Arranging/Packaging of: Syndicated Loans (Peso and Dollar) Joint Ventures Project Finance Financial Advisory and Consultancy Mergers and Acquisitions J. ANCILLARY SERVICES Day & Night Depository Services Deposit Pick-up and Delivery Foreign Currency Conversions Foreign Trade Information Research (Economic and Investment) Wealth Management Safety Deposit Box

8
Contribution to Income. The relative contribution of principal products or services to gross revenues is as follows: (amounts in millions)
Product/Service 2009 % 2008 % 2007 %
Loans and receivables 12,109 53.45 10,885 53.74 9,584 48.62 Investment Securities 3,960 17.48 3,992 19.71 4,918 24.95 Trading and Securities Gains(Losses)-net
2,253
9.94
(512)
(2.53)
1,329
6.74
Trust Services 181 0.80 206 1.02 185 0.94 Other Treasury &/ or Ancillary Services (inclusive of service fees from credit card operations)
4,154
18.33
5,685
28.07
3,695
18.75
The three (3) foreign subsidiaries, i.e., RCBC International Finance Limited (Hong Kong), RCBC North America, Inc. (USA) and RCBC Telemoney Europe (Italy) accounted for 0.86%, 1.04%, and 1.00% of gross revenues for the years 2009, 2008 and 2007, respectively. Competition. The Bank faces competition from both domestic and foreign banks, in part, as a result of the liberalization of the banking industry by the Government. Since 1994, a number of foreign banks have been granted licenses to operate in the Philippines. Such foreign banks have generally focused their operations on the larger corporations and selected consumer finance products, such as credit cards. These foreign banks have not only increased competition in the corporate market, but have as a result caused more domestic banks to focus on the commercial middle-market, placing pressure on margins in both markets. Mergers, acquisitions, and closures reduced the number of players in the industry from a high of 50 upon the liberalization of rules on the entry of foreign banks to thirty eight (38) universal and commercial banks in 2009. Competition in corporate banking is intense especially with the larger banks. Pricing of loans and yield of deposit and investment products are factors limiting the expansion in this area. As such, focus has been diverted to SMEs and micro-financing for the expansion of the Bank’s client-base and loan portfolio.The Bank has also continued its emphasis on product and service improvement through investment in technology and systems. Customers. The Bank has identified the following as the key market segments that it services: consumer, top corporate and the middle market. The Bank offers a wide range of services to these markets: consumer, commercial and corporate loans, and asset and cash management services. The Bank provides such services through its branch network and ATMs across the country and through other electronic delivery channels. To better serve the needs of identified market segments, the Bank undertook a functional realignment focused on building a sales and service-oriented distribution network. These identified market segments are as follows: a) Corporate/Institutional Market. RCBC has been a banker to top Filipino corporations since the early 1980s. It has also established many of its relationships with Japanese clients through its more than 30 year strategic partnership with Japanese Bank UFJ (now the Bank of Tokyo-Mitsubishi UFJ Limited). The Bank continues to be a formidable player in this sector, even with the UFJ’s sale of its share in RCBC given its strong

9
strategic presence in the country’s export processing zones, a major source of fee-based business. The Bank has also cultivated lasting relationships with American and European multinational companies which until now have remained valued clients of the Bank. b) SMEs/Commercial Middle Market. This market plays a major strategic role in the Bank’s goal to diversify portfolios and improve loan yields. The Bank’s SME operations were recently consolidated with the Corporate Banking Group so that its lending activities can be synchronized with the overall lending thrust and objectives of the Bank. c) Consumer/Retail Market. Through its business centers, the Bank offers a wide range of products and of services. To attract and retain customers, deposit products have been streamlined and the Bank has been aggressively offering more services electronically to wide population of the unbanked segments. This is likewise done through the introduction of new and innovative products and services As the thrift banking arm of the Bank, RCBC Savings Bank identified and implemented various initiatives to maintain its position as one of the top thrift banks of the country. Foremost among these were the maximization of the full potentials of the consumer lending centers (CLCs); improvement of turn-around time; strengthening of relationships with clients, dealers and developers; strategic establishment and relocation of branches and ATMs; greater synergy within the YGC; new product launch; product competitiveness and promotion; and continuous manpower training and development. Since 2007, the credit card operations of the Bank were conducted at the parent company level following the acquisition of substantially all of the assets of Bankard in December 2006. Bankard and RCBC entered into a service agreement wherein RCBC outsourced the servicing of its credit card business to Bankard. These services include card acquisition and marketing services and collection services. d) Overseas Filipino Workers. The steady number of Filipinos working and/or living abroad is now a big market. The Bank provides remittance services to the wide network of OFWs and their beneficiaries in the Philippines who receive the remittances. TeleMoney, the Bank’s core remittance business, had expanded to more than 25 countries through its subsidiaries as well as numerous centers, tie-ups and agents. e) High Net Worth Individuals Market. This is a new and fast growing market of the Bank solely catering to the financial investment needs of the affluent sector of society. High net worth individuals prefer to have dedicated relationship managers who take care of their portfolios, provide advise on their investments, maintain high level of service, and ensure privacy and confidentiality at all times. The Bank formally set up the Wealth Management Group in mid 2006 and it presently has established offices in Binondo, Makati, Ortigas and Cebu. Transactions and/or Dependence on Related Parties. The information required is contained in item 12 on page 67. Principal Terms and Expiration Dates of All Patents, Trademarks, Copyrights, Licenses, Franchises, Concessions, and Royalty Agreements Held. The Bank has not registered any of its intellectual property rights with the Intellectual Property Office (IPO) of the Department of Trade

10
and Industry of the Philippines. The Bank has not been the subject of any disputes relating to its intellectual property rights. On December 15, 2009, the Securities and Exchange Commission approved the amendment of Article Fourth of the Amended Articles of Incorporation of RCBC thereby extending the corporate term of the Bank for another fifty (50) years from 23 September 2010. In addition to the universal banking license mentioned on page 1, the Bank has all the regulatory licenses and permits necessary to operate and render the various services and products offered to the public. These include, among others, trust license, expanded FCDU license, local business permits, etc.
Effect of Existing or Probable Governmental Regulations on the Business. The normal operations of the Bank is not adversely affected by any existing governmental regulation nor is it expected that any probable governmental regulation would have an adverse effect on the operations of the Bank. Amount Spent on Research and Development Activities. Research and development activities are not necessary since the nature of its business is banking. Employees. The Bank (excluding subsidiaries) has 1,394 non-officers and 1,679 officers or a total manpower of 3,073 as of December 31, 2009. The increase in the number of employees was a result of the expansion in the Bank’s branch network. Although not all non-managerial employees are members of the RCBC Employees Association, all are covered by the Collective Bargaining Agreement (CBA). In November 2009, the Bank and the independent union agreed on the economic provisions of the existing Collective Bargaining Agreement, which will expire on September 30, 2011. For the past three years, there has been no strike nor was there any threat of a strike as a result of a dispute.
The supplemental benefits that the Bank has for its associates include hospitalization, medical and dental benefits, group insurance and bereavement assistance. Associates are also entitled to vacation and sick leaves. The Bank continues to invest in its employees through various training programs strategically focused on selling skills, customer service and product knowledge. Risk Management. The Bank is exposed to risks that are inherent to its lending and trading businesses and the environment in which it operates. The Bank’s goal in risk management is to ensure that it understands, measures and monitors the various risks that arise from its business activities, and that it adheres strictly to the policies and procedures which are established to address these risks. The Bank employs a committee system as a fundamental part of its process of managing risk. Each committee consists of the Chief Executive Officer/President, and other senior executives. The key committees are as follows:

11
• the Executive Committee (Excom), which approves exposure management standards, reviews concentrations of credit risk, sets documentation and credit support standards and reviews and approves large counterparty credit limits and consideration of credit-related transactions;
• the Risk Management Committee (Riskcom), which ensures wide portfolio diversification and establishes risk policies;
• the Senior Management Committee (SMC), which oversees all operational and other matters that affect the Bank’s day to day activities and reviews new products and businesses and ensures that policies and procedures are established and in place prior to engaging in new business; and
• Assets and Liabilities Committee (ALCO), which appraises market trends, economic, and political developments and provides strategic direction in the management of interest rate risk, liquidity risk, and trading and investment portfolio decisions.
The Bank has established a Corporate Risk Management Services (“CRISMS”) headed by a chief risk officer, to identify, measure and assist in controlling and monitoring the risks inherent in its activities. CRISMS is independent of all business segments and reports directly to the Risk Management Committee. Major Risks Involved. a) Liquidity Risk – risk that there are insufficient funds available to adequately meet all maturing
liabilities, including demand deposits and off-balance sheet commitments, due to: (a) inability to liquidate assets or obtain adequate funding and (b) the inability to easily unwind or offset specific exposures without significantly lowering market prices because of inadequate market depth or market disruptions.
The Bank’s liquidity policy is to manage its operations to ensure that funds available are more than adequate to meet credit demands of its customers and to enable deposits to be repaid on demand or upon maturity. The main sources of the Bank’s funding are capital, core deposits from retail and commercial clients and wholesale deposits. The Bank also maintains a portfolio of readily marketable securities to further strengthen its liquidity position. The Bank’s liquidity policies and procedures are set out in its Funding and Liquidity Plan. At least once annually, the Bank’s Treasurer presents a business plan containing a request for liquidity limits to ALCO for final approval and ratification by the Board of Directors. The funding plan effectively serves as a projected funding requirement based on assumptions from the forecasted balance sheet.
To ensure that the Bank has sufficient liquidity at all times, the Bank’s Treasury formulates a contingency plan using extreme scenarios of adverse liquidity and evaluates the Bank’s ability to withstand these prolonged scenarios. The contingency plan focuses on the Bank’s strategy for coordinating managerial action during a crisis and includes procedures for making up cash flow shortfalls in adverse situations. The plan details the amounts of funds available and the scenarios under which it could use them.
b) Interest Rate Risk – The Bank follows a policy on managing its assets and liabilities so as to
ensure that exposure to fluctuations in interest rates is kept within acceptable limits. The Bank’s risk measurement system addresses different risk factors of different categories of instruments within each currency where the Bank holds interest rate sensitive positions.

12
ALCO meets at least weekly to set rates for various asset and liability and trading products. In pricing interest rates, foreign exchange and fee-based products, ALCO considers funding costs, market conditions, transaction volumes, and competitor’s rates, among others. The interest rate sensitive instruments of the Bank’s trading and investment portfolio are covered by a system of loss limit and Management Action Trigger (“MAT”) controls which quantify management’s tolerance for losses on year to date and month to date cumulative loss. In addition, value at risk (“VaR”) is computed per product group to determine potential loss.
The Bank employs “gap analysis” to measure the interest rate sensitivity of its assets and liabilities. The asset/liability gap analysis measures, for any given period, any mismatch between the amounts of interest-earning assets and interest-bearing liabilities which would mature, or would be subject to re-pricing, during that period.
c) Credit Risk – risk that the borrower, issuer or counterparty in a transaction may default and
cause a potential loss to the Bank. The Bank is exposed to credit risk as trading counterparty to dealers and customers, as direct lender and as a holder of securities. Categories of credit risk include contingent credit risk (risk that potential counterparty or customer obligations become actual and will not be repaid on time), country risk (risk that actions of sovereign governments or other uncontrollable events will adversely affect the ability of counterparties or customers to fulfill obligations to the Bank), event risk (risk that the Bank will incur risk in unusual situations which are not captured in the daily risk management tools), underwriting risk (risk that an issue will lose value after launching but before trading in the secondary markets), and custody risk (risk that arises when the Bank has assets in the form of securities entrusted to a third party as a custodian).
The Bank’s overall goal of credit risk management is to maximize its risk-adjusted rate of return by maintaining credit risk exposure within approved parameters. The Bank’s credit policies are established by the Executive Committee and/or the Board of Directors and are set out in the Bank’s Credit Policy Manual.
d) Market Risk – risk resulting from adverse movements in the level of or volatility of market
rates or prices or commodity/equity prices which will affect the Bank’s financial condition. The primary determinant of market risk is the volatility of the relevant market for a business line. The market risks of the Bank are: (a) foreign exchange rates, (b) interest rates, (c) equity prices and (d) commodity prices.
To manage market risks inherent in the Bank’s portfolio, three related measures of risk values are estimated or established:
• the sensitivity of the position or portfolio to a movement in the market risk factor to which it is exposed;
• the volatility of the position (the maximum expected movement in the market risk factor for a given time horizon at a specified level of confidence); and
• the value-at-risk (the likely impact on earnings for a given time horizon due to expected movements in the market factors).

13
e) Foreign Currency Risk – The BSP has numerous regulations related to foreign currency management. The Bank complies with all of these, including limits on foreign currency exposures, liquidity reserves and types of currencies allowed for trading.
The Bank’s risk measurement system incorporates risk factors for each different foreign currency. Foreign exchange positions are generally classified as trading positions and are marked-to-market at least daily. Foreign exchange forwards are classified at inception as either “trading” (outright open positions without an offsetting foreign exchange contract) or "hedging” (positions with an offsetting foreign exchange contract, generally part of a foreign exchange swap transaction). The accounting methodology assigned for both classifications is net present value mark-to-market although booking for hedging is through equity being a cashflow hedge.
f) Operations Risk – risk arising from the potential that inadequate information systems,
operations or transactional problems (related to service or product delivery), breaches in internal controls, fraud or unforeseen catastrophes will result in unexpected loss. Operations risk includes the risk of loss arising from various types of human or technical error, settlement or payments failures, business interruption, administrative and legal risk issues and systems not performing adequately.
The Bank maintains operations manuals that are periodically updated. The Bank has also developed a Business Contingency Plan which is tested at least annually and updated for any major changes in systems procedures. A complaints log, which is reviewed by management, exists for each business area for logging, monitoring and follow-up on customer complaints.
To ensure that critical transactions are properly handled, the work of one person is verified by another. Items of value are under dual custody. The Bank places emphasis on the security of its computer system and has a comprehensive IT security policy. The Bank designates a security administrator independent of the front office who is responsible for maintaining strict control over user access privileges to the Bank’s information systems. The Bank’s Information Technology Group has a Disaster Recovery Plan to ensure business continuity, recovery of critical data and uninterrupted processing of transactions in the event of a disaster.
g) Regulatory Risk – refers to the potential for the Bank to suffer financial loss due to changes in
the laws or monetary, tax or other governmental regulations of the country. The Bank’s Compliance Program, the implementation of which is overseen and coordinated by the Compliance Office, is the primary control process for regulatory risk issues. The Compliance Office is responsible for communicating and disseminating new rules and regulations to all units, analyzing and addressing compliance issues, performing periodic compliance testing on business centers and Head Office units and reporting compliance findings to the Audit Committee and the Board of Directors. On a case by case basis, when the Audit Committee is not immediately available, the Compliance Officer may initially report urgent matters to the President/Chief Operating Officer or the Chief Executive Officer, and thereafter to the Audit Committee.
Item 2. Properties

14
RCBC’s headquarters is located on an island site at the corner of Ayala Avenue and Sen. Gil Puyat Avenue Ext. called the RCBC Plaza Building. The RCBC Plaza Building is one of the largest sites in the Makati Central Business District. The Bank and some of its subsidiaries lease and occupy about twelve (12) floors of the Yuchengco Tower of the twin tower complex. The Bank’s lease, covering an area of 18,540.15 square meters, would expire on December 31, 2010 and is subject to renewal upon agreement of the parties. Annual rent of Bank’s principal offices, exclusive of VAT, amounts to P156.1 million. The Group's rental expense based on the lease contracts amounted to P541, 825 in 2009. The lease periods are from 1 to 25 years. Most of the lease contracts contain renewal options, which give the Parent Company and its subsidiaries the right to extend the lease on terms mutually agreed upon by both parties. The Bank owns and/or leases its branch sites as listed below and on the following pages:
LOCATION/BC NAME
BUSINESS ADDRESS
AREA (in
sqm) A. RCBC OWNED PREMISES
METRO MANILA AREA Alabang (RCBC) Alabang-Zapote Road 1,955.00 Alabang (Toyota) Alabang-Zapote Road 7,056.00 Baclaran Taft Avenue Extension, Baclaran, Parañaque 219.00 BF Homes GF 101 Matrix Center, Presidents Ave., BF
Commercial Center (Condo Unit) 299.00
Binondo Tytana Plaza, Oriente, Binondo, Manila 210.14 Binondo Q. Paredes St., Binondo, Manila 2,149.66 Caloocan 259 Rizal Avenue, Caloocan City 1,300.00 Carlos Palanca BSA Suites, C. Palanca St., Legaspi Village,
Makati City 142.80
Commonwealth Commonwealth Avenue, Old Balara, Quezon City 470.00 Connecticut No. 51 Connecticut St., East Greenhills, San Juan,
MM 1,003.00
Divisoria New Divisoria Condominium Center, Sta. Elena,
Divisoria, Manila 449.6
Greenbelt BSA Tower, Legaspi St., Legaspi Village, Makati
City 173.8
Legaspi Village Cristina Condominium, Legaspi cor. Herrera, Legaspi Village, Makati City
120.00
Legaspi Village Unit1 G/F ACCRA Bldg., Gamboa cor. Salcedo Sts., Legaspi Village, Makati City
522.00
Metallim Compound No. 95 T. Arguelles (formerly Brixton St.), Brgy. Imelda, Quezon City
2,421.70
Ortigas Center Malayan Tower, ADB Avenue, Ortigas Center, Pasig City
244.95
Quezon Avenue Quezon Avenue, Quezon City 1,427.70 Rockwell Phinma Plaza, Rockwell Center, Makati City 259.92 Salcedo Village Y Tower II Building, Alfaro cor. Gallardo, Sts.,
Salcedo Village, Makati City 230.09
Tektite E1904A, 19th floor, East Tower, PSE Ctr., 286.00

15
Exchange Road, Pasig City Tektite East Tower, PSE Ctr., Exchange Road, Pasig City 25.00 Timog Timog Avenue, Quezon City 690.00 LUZON AREA Angeles Sto. Rosario cor. Teresa Streets, Angeles City 600.00 Baguio Session road, Baguio City 474.54 Balibago McArthur Highway, Balibago, Angeles City 324.00 Batac Marcos Highway, Batac, Ilocos Norte 378.08 Cabanatuan National hi-way cor. Paco Roman St., Cabanatuan
City 700.00
Calamba National Hi-way, Calamba, Laguna 815.00 Carmelray II (FCIE-Cavite) New Cavite Industrial City, Gen. Trias, Cavite 22,534.00 Carmen National Highway, Carmen, West Rosales,
Pangasinan 720.00
Dasmarinas (PANDORA) FCIE Compound, National Hi-way, Brgy. Langkaan, Dasmarinas, Cavite
265.00
Gateway Gateway Business Park, Gen. Trias, Cavite 787.0 La Union Quezon cor. P. Burgos, San Fernando, La Union 442.00 Lima Lot11, Blk15, Lima Business Ctr, Lima Square 1,524.00 Palawan Rizal St., Puerto Princesa, Palawan 1,731.00 Sta. Cruz A. Bonifacio cor. Regidor, Sta. Cruz, Laguna 238.00 Sta. Cruz P. Burgos, Sta. Cruz, Laguna 131.00 VISAYAS AREA Ayala-Cebu Cebu Businesss Park, Cebu City 1,814.00 Bacolod-Libertad Libertad Street, Bacolod City 2,547.00 Bacolod-main Rizal Cor. Locsin Streets, Bacolod City 440.0. Bacolod-Shopping Hilado St., Shopping District, Bacolod City 967.00 Bayawan National Hi-way, Bayawan, Negros Oriental 500.00 Cadiz Abelarde cor. Mabini Sts., Cadiz City 741.00 Fuente Osmena GPL Tower, Fuente Osmena, Rotonda, Cebu City 845.29 Iloilo J. M. Basa cor. Arsenal, Iloilo City 2,647.00 Kabangkalan Poblacion, Kabangkalan, Negros Occidental 1,000.00 Mandaue A. Cortez Avenue, Mandaue City 1,664.00 Roxas City Banquerojan, Roxas City 624.00 Sara Don Victorino Salcedo St, Sara, Iloilo 450.00 Silay Rizal cor. Burgos Streets, Silay City 799.70 Tagbilaran J. P Garcia Avenue, Tagbilaran City 633.00 Talisay National Hi-way, Tabunok, Talisay, Cebu 176.00 MINDANAO AREA Dadiangas Pioneer Avenue, General Santos City 460.00 Davao-Recto C. M. Recto/Palma Gil, Davao City 1,085.00 Digos Rizal Avenue, Digos, Davao del Sur 300.00 Ipil National hi-way, Ipil, Zamboanga del Sur 1,000.00 Isulan National hi-way, Kalawag III, Isulan, Sultan
Kudarat 375.00
Lapasan C. M. Recto, Lapasan, Cagayan de Oro City 456.00 Ozamis Don Anselmo Bernad cor. A. Mabini St., Ozamis
City 202.00

16
Pagadian Rizal Avenue, Pagadian City 301.00 Polomolok Dhalia Street, Polomolok, South Cotabato 511.00 Surallah National Hi-way, Surallah, South Cotabato 496.00 Tagum Pioneer Avenue, Tagum, Davao del Norte 1,200.00
LOCATION/BC NAME
BUSINESS ADDRESS
AREA (in
sqm) B. RCBC OWNED PREMISES OCCUPIED BY RCBC SAVINGS BANK BUSINESS CENTERS METRO MANILA AREA Balintawak A. Bonifacio near cor. C-3 Road, Balintawak,
Quezon City 350.00
Commonwealth Commonwealth Avenue, Old Balara, Quezon City 470.00 EDSA – Pasay 527 EDSA, Pasay City 270.00 Greenhills Unit 104, Grace Building, Ortigas Ave., Greenhills,
San Juan, MM 108.69
J. P. Rizal J. P. Rizal Street, Makati City 198.75 Kapitolyo Shaw Boulevard, Kapitolyo, Pasig City 311.00 Katipunan Torres Building, Katipunan, Loyola Heights, Q. C. 200.83 Pacific Place Pacific Place Bldg., Pearl Drive, Ortigas Center,
Pasig City 1,652.29
Salcedo Le'Metropole Building, Sen. Gil Puyat, Avenue cor.
Tordesillas, Makati City 192.04
Sangandaan Sangandaan, A. Mabini cor. Plaridel, Caloocan City 323.00 Taft-Remedios Taft Avenue, Manila 295.10 LUZON AREA Angono Quezon Avenue, Angono, Rizal 1,074.00 Apalit National Road, San Vicente, Apalit, Pampanga 1,250.00 Bacoor Aguinaldo Hi-way, Bacoor, Cavite 466.22 Cabanatuan National hi-way cor. Paco Roman St., Cabanatuan
City 700.00
Hacienda Luisita McArthur Hi-way, Bo. San Miguel, Tarlac 229.00 Lipa Morada Avenue, Lipa City 242.00 San Mateo Gen. Luna St., Gitnang Bayan, San Mateo, Rizal 307.00 Taytay National Road, San Vicente, Apalit, Pampanga 211.00 VISAYAS AREA Escario N. Escario St., Cebu City 437.00 Jaro Commission Civil, Jaro, Iloilo City 532.00 P. del Rosario P. del Rosario st., Bo. Sambag, Cebu City 298.00 MINDANAO AREA Cotabato City Quezon Avenue cor. Magallanes St., Cotabato City 300.00 Gen. Santos Pioneer Avenue, Gen. Santos City 443.00 Velez Velez Street, Cagayan de Oro City 382.00
17
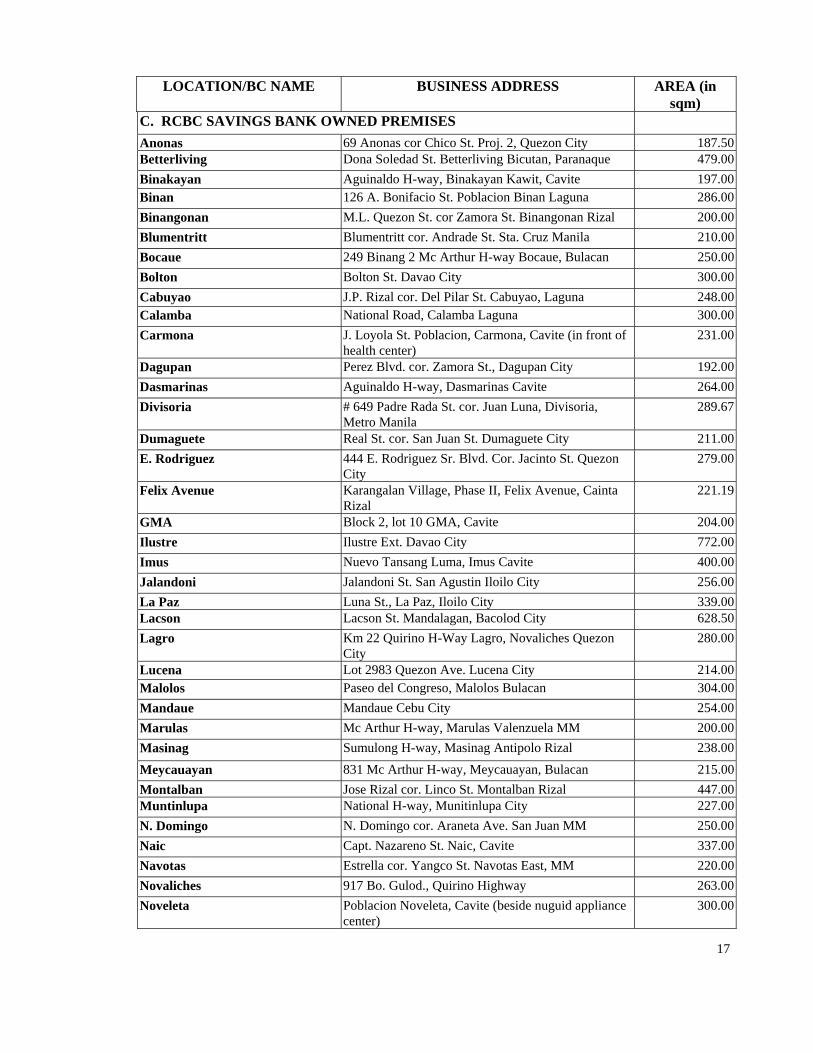
LOCATION/BC NAME BUSINESS ADDRESS AREA (in sqm)
C. RCBC SAVINGS BANK OWNED PREMISES Anonas 69 Anonas cor Chico St. Proj. 2, Quezon City 187.50 Betterliving Dona Soledad St. Betterliving Bicutan, Paranaque 479.00 Binakayan Aguinaldo H-way, Binakayan Kawit, Cavite 197.00 Binan 126 A. Bonifacio St. Poblacion Binan Laguna 286.00 Binangonan M.L. Quezon St. cor Zamora St. Binangonan Rizal 200.00 Blumentritt Blumentritt cor. Andrade St. Sta. Cruz Manila 210.00 Bocaue 249 Binang 2 Mc Arthur H-way Bocaue, Bulacan 250.00 Bolton Bolton St. Davao City 300.00 Cabuyao J.P. Rizal cor. Del Pilar St. Cabuyao, Laguna 248.00 Calamba National Road, Calamba Laguna 300.00 Carmona J. Loyola St. Poblacion, Carmona, Cavite (in front of
health center) 231.00
Dagupan Perez Blvd. cor. Zamora St., Dagupan City 192.00 Dasmarinas Aguinaldo H-way, Dasmarinas Cavite 264.00 Divisoria # 649 Padre Rada St. cor. Juan Luna, Divisoria,
Metro Manila 289.67
Dumaguete Real St. cor. San Juan St. Dumaguete City 211.00 E. Rodriguez 444 E. Rodriguez Sr. Blvd. Cor. Jacinto St. Quezon
City 279.00
Felix Avenue Karangalan Village, Phase II, Felix Avenue, Cainta Rizal
221.19
GMA Block 2, lot 10 GMA, Cavite 204.00 Ilustre Ilustre Ext. Davao City 772.00 Imus Nuevo Tansang Luma, Imus Cavite 400.00 Jalandoni Jalandoni St. San Agustin Iloilo City 256.00 La Paz Luna St., La Paz, Iloilo City 339.00 Lacson Lacson St. Mandalagan, Bacolod City 628.50 Lagro Km 22 Quirino H-Way Lagro, Novaliches Quezon
City 280.00
Lucena Lot 2983 Quezon Ave. Lucena City 214.00 Malolos Paseo del Congreso, Malolos Bulacan 304.00 Mandaue Mandaue Cebu City 254.00 Marulas Mc Arthur H-way, Marulas Valenzuela MM 200.00 Masinag Sumulong H-way, Masinag Antipolo Rizal 238.00
Meycauayan 831 Mc Arthur H-way, Meycauayan, Bulacan 215.00 Montalban Jose Rizal cor. Linco St. Montalban Rizal 447.00 Muntinlupa National H-way, Munitinlupa City 227.00 N. Domingo N. Domingo cor. Araneta Ave. San Juan MM 250.00 Naic Capt. Nazareno St. Naic, Cavite 337.00 Navotas Estrella cor. Yangco St. Navotas East, MM 220.00 Novaliches 917 Bo. Gulod., Quirino Highway 263.00 Noveleta Poblacion Noveleta, Cavite (beside nuguid appliance
center) 300.00

18
Ortigas Ext. Ortigas Avenue, Ext. Pasig City 241.00 P. Tuazon P. Tuazon cor. 12th Ave. Cubao Quezon City 355.00 Pateros M. Almeda St. Bo. San Roque, Pateros MM 300.00 Plaridel Cagayan Valley Road, Banga 1, Plaridel Bulacan 670.00 San Joaquin Concepcion St. San Joaquin, Pasig City 159.00
San Roque J.P. Rizal St. San Roque Marikina City 400.00 Sta. Mesa 4463 Old Sta. Mesa Manila 214.00 Sta. Rosa J. Rizal Blvd. Cor. Perlas Village, Brgy. Tagapo Sta.
Rosa, Laguna 480.00
Tacloban Zamora St., cor Sto. Nino, Tacloban City 317.00 Tagbilaran Pres. Carlos p. Garcia Ave., Poblacion, Tagbilaran
City 300.00
Tanza Sta. Cruz Tanza, Cavite 140.00 Tarlac Mc. Arthur H-way Bo. Matatalaib, Tarlac, Tarlac 554.00 T. Morato 169 Tomas Morato cor. Sct. Castor, Quezon City 175.00 Urdaneta Majoha Bldg. Nancayasan, Urdaneta, Pangasinan 59.00 Visayas Ave. 6 Visayas Ave. Tandang Sora, Quezon City 300.00 Ormoc City Ormoc City 223.00 Lagro Brgy. Pasong Putik, Quezon City 720.00 Camarin Susano Road, Camarin, Novaliches, Quezon City 559.00 Antipolo Taytay Palmera Hills 300, ortigas Ext., Dolores, Antipolo
City 650.00
BC NAME
BUSINESS ADDRESS
CONTRACT PERIOD
START EXPIRY D. RCBC LEASED PREMISES METRO MANILA AREA Alabang West Service Road
Cor Montillano St. and South Superhighway, Alabang Muntinlupa City
May 2008 Apr 2015
Ayala Unit 601, 6th Floor Tower I Ayala Triangle Ayala, Makati City
Jul 1, 2003 Jun 30, 2008 1/
A. Mabini 1353 Tesoro Bldg. A. Mabini St. Ermita Manila Oct 1, 2004 Oct 1, 2009 1/ Araneta Center Spaces 19-21 Upper Ground Floor Farmers Plaza
Cubao Oct 1, 2008 Mar 31, 2009
1/ Arranque 1001 Orient Star Bldg. cor. Masangkay and Soler
Sts., Sta. Cruz, Manila May 15, 2007 May 14, 2017
Banawe Unit 1-K, CTK Building 385 Banawe cor. N. Roxas St., Quezon City
Feb 15, 2005 Feb 15, 2010
Better Living #14 Doña Soledad Ave., Better living Subd., Brgy. Don Bosco Parañaque City
Sep 15, 2008 Sep 14, 2013
Boni 617 Boni Ave. Mandaluyong City May 1, 1999 Ap 30, 2009 1/
Buendia #219 Sen. Gil Puyat Ave., Makati City Jan 1, 2009 Dec 31, 2009 Cainta Multicon Bldg., F.P. Felix Ave., Cainta, Rizal Nov 16, 2007 Nov 15, 2017 Concepcion, Marikina # 17 Bayan-Bayanan Ave., Concepcion 1 Marikina
City Aug 1, 2007 Jul 31, 2012
Makati Rada (formerly Chino Roces)
Unit GL3 One Legaspi Park 121 Rada St. Legaspi Village, Makati City
Mar 23, 2007 Mar 22, 2012

19
Commonwealth Verde Oro Bldg., 535 Commonwealth Ave.,Diliman Quezon City
Jan 1, 2001 Dec 30, 2011
Cubao Rustan’s Superstore Complex Gen. Romulo St.,Araneta Center, Cubao, Quezon City
Jun 1, 2005 Dec 1, 2009 1/
Dela Rosa G/F Sterling Center Ormaza Coner Dela Rosa St. Legaspi Village Makati City
May 1, 2009 Apr 30, 2014
Del Monte 180 Del Monte Avenue, Quezon City May 1, 2007 Apr 30, 2017 Diliman Kalayaan Ave., corner Matalino St., Diliman,
Quezon City Nov 15, 2006 Nov 15, 2011
D. Tuazon 19 cor. D. Tuazon and Quezon Avenue, Quezon City
Apr 16, 2005 Apr 15, 2015
Edsa Taft G-Floor Giselle Park Plaza Edsa cor. Taft Ave. Pasay City
Sep 1, 2005 Aug 31, 2012
Elcano G/F Elcano Plaza, Elcano St., Binondo, Manila Jun 1, 1992 May 31, 2012
Ermita 550 UN Ave., Ermita Manila Jan 1, 2004 Dec 31, 2008 1/
Fairview UG 01-A MAB, Dahlia St. Cor, Regalado Ave., North Fairview Quezon City
May 1, 2000 May 1, 2010
Frontera Verde
G/F Transcom Bldg., Frontera Verde Compd. Bgy. Ugong, Pasig City
Sep 1, 2008 Aug 15, 2013
Gilmore 100 Granada St. Brgy. Valencia, Quezon City Jan 1, 2001 Dec 31, 2011 La Fuerza Unit 10 & 11 G/F La Fuerza Plaza 1, 2241 Chino
Roces Ave., Makati City Sep 15, 2009 Sep 14, 2014
Las Pinas G/F Veraville Bldg., Alabang-Zapote Road, Las Pinas City
May 16, 2003 May 15, 2013
Libis 191 E. Rodriguez Jr. Ave. Libis Quezon City Jun 1, 2000 May 31, 2010 Loyola Heights 42 MQI Bldg. Rosa Alberto St. Cor. Esteban Abada
St. Loyola Heights Quezon City Feb 1, 2002 Jan 31, 2012
Makati Avenue G/F Makati Finance Building 7823 Makati Avenue Makati City
Oct 31, 2006 Month to month
Makati Avenue Executive Building Center, Sen Gil Puyat Ave., Makati City
Nov 02, 2008 Nov 02, 2013
Malabon J.P. Rizal Ext. cor Pascual St. Brgy. San Agustin, Malabon City
Apr 1, 1992 Mar 31, 2009
Mandaluyong Level 1, EDSA Central Mall, Sto. Cristo St., Mandaluyong City
Sep 1, 2004 Aug 31, 2012
Marikina Gil Fernando (formerly Angel Tuazon) St. Cor. Sta Ana Ext., San Roque Marikina
Jan 1, 1995 Dec 31, 2009
Masangkay Empire Plaza 1473 G Masangkay St. Sta. Cruz Manila
Jun 16, 2003 Jun 16, 2013
Morayta 828 Nicanor Reyes St., Sampaloc, Manila City Aug 1, 2007 Jul 31, 2012 Multinational 3963 JJM Bldg 2, Ninoy Aquino, Sto. Niño, Pque
City May 1, 2009 May 1, 2014
NAIA 3 NAIA TERMINAL 3, PASAY CITY Oct 27, 2009 New Manila 84 Hemady cor. E. Rodriguez Ave. New Manila,
Quezon City Jan 1, 2006 Month to
month
Novaliches 882 Quirino Highway, Novaliches, Quezon City Jul 1, 2004 Jul 30, 2009 1/
Otis Isuzu Manila 1502 Paz M. Guazon St. Paco Manila May, 2008 Apr, 2016 Pasay 1905 Taft Ave., Pasay City Oct 1, 2004 Sep 30, 2009
1/ Pasig #92 Dr. Sixto Ave. Cor. Raymundo St. Pasig City Aug 1, 1989 Jul 31, 2009
1/

20
Pasong Tamo 2283 Pasong Tamo Ext. cor. Lumbang St., Makati City
Mar 16, 2001 Mar 15, 2011
Quirino 411 Anflocor Bldg. Quirino Ave. Tambo Paranaque City
Oct 16, 2006 Oct 15, 2011
Raon, Sales 655-657 Gonzalo Puyat St., Quiapo, Manila Apr 01, 2008 Mar 13, 2013
Roosevelt 302 Roosevelt Avenue, SFDM, Quezon City Jun 1, 2004 May 31, 2009 1/
San Lorenzo 1018 L & R Bldg. Pasay Road, Makati City. Aug 16, 2004 Aug 15, 2009 1/
Shangri-la Extn 5th Level, Shangri-la Plaza Mall, EDSA cor Shaw Blvd. Mandaluyong City
Dec 1, 2005 Nov 30, 2010
South Harbor Corner 23rd and Delgado Sts., Port Area Manila Jan 1, 1996 Dec 31, 2010
Sta. Lucia East Brickroad area Sta. Lucia East Grand Mall Marcos Highway cor Felix Avenue Cainta Rizl
Sep 27, 2008 Sep 30, 2013
Sta. Mesa # 1 B. G. Araneta Ave, Quezon City July 1, 1993 Jun 30, 2013 Sucat Sucat Interchange Arcade Dr. A. Santos Ave. cor
West Service Road Sucat, Pnque Jan, 2000
May, 2013
Taytay Manila East Road, Taytay, Rizal Jan 1, 1992 Dec 31, 2012 T. Alonzo 1461-1463 Soler St., Sta. Cruz, Manila Nov 1, 2003 Oct 31, 2013 T. Mapua Park Tower Condominium
626 T. Mapua St., Sta. Cruz, Manila Oct 16, 2007 Oct 15, 2012
Tordesillas 117 Tordesillasst., Salcedo Village, Makati City Sep 1, 2008 Aug 31, 2013 Trinoma Space P015B Level 1, Trinoma EDSA cor. North
Avenue, Quezon City Mar 1, 2007 Apr 30, 2009
1/ Tutuban G/F Center Mall I, Tutuban Center corner C.M.
Recto Ave., Tondo, Manila Apr 16, 1993 Apr 15, 2013
Unimart Greenhills Shopping Center, Ortigas Ave., Greenhills San Juan Metro Manila
Jan 1, 2007 Dec 31, 2010
Valenzuela 231 Mac Arthur Highway, Karuhatan, Valenzuela City
Sep 01, 2008 Aug 31, 2023
Wack Wack Unit K Facilities Center Bldg., 548 Shaw Blvd, Mandaluyong City
Feb 1, 2005 Jan 31, 2010
LUZON AREA Angeles-Sto. Cristo 243 Sto. Entierro St., Brgy. Sto. Cristo, Angeles
City, Pampanga Feb 18, 2007 Feb 17, 2017
Bacoor Maraudi Bldg., Aguinaldo Highway, Niog Bacoor Cavite
May 01, 2007 May 01, 2017
Balagtas McArthur Highway, Balagtas, Bulacan Nov 16, 2007 Nov 15, 2017 Balanga Don M. Banzon Avenue cor. Cuaderno St., Balanga
City, Bataan Oct 1, 2007 Sep 30, 2017
Baliuag J. P. Rizal cor. Tagle St., Baliuag, Bulacan Aug 16, 2007 Aug 15, 2017 Bataan Bataan Export Processing Zone, Mariveles, Bataan Mar 26, 2007 Mar 26, 2009
1/
Batangas Rizal Avenue cor. P. Gomez, Batangas City Apr 2007 Apr 2012 Cabanatuan Burgos Avenue, Cabanatuan, Nueva Ecija Oct 1, 2001 Sep 30, 2011 Carmelray 1 Adm. Bldg., Carmelray Industrial Park, Canlubang,
Calamba, Laguna Nov 1, 2004 Oct 31, 2009
1/ Carmelray 2 Adm. Bldg., Carmelray Industrial Park 2, Bgy. Tulo,
Calamba, Laguna Aug 1, 2001 Jul 31, 2011
Carmona People’s Technology Complex, SEZ, Governor’s Drive, Carmona, Cavite
July16, 2002 Jul 15, 2027

21
Cauayan Roxas St., Cauayan, Isabela Mar 1, 2007 Feb 29, 2012 Cavite City P. Burgos Avenue, Caridad, Cavite City Dec 1, 2006 Nov 30, 2016
Clark CM Recto Highway, Clark Special Economic Zone, Angeles, Pampanga
Oct 14, 1996 Oct 14, 2020
Clark II Bertaphil III Clark Center, Jose Abad Santos Avenue, Clark Freeport Zone
Nov 15, 2008 Nov 14, 2018
CPIP-Batino Citigold Bldg., Calamba Premiere Industrial Park, Batino, Calamba, Laguna
Jun 1, 2005 May 31, 2015
Dagupan AB Fernandez Avenue, Dagupan, Pangasinan Jul 1, 1999 Jun 30, 2019 Gapan Tinio St., San Vicente, Gapan, Nueva Ecija Dece 1, 2007 Nov 30, 2012 GMA Citi Appliance Bldg., Governor’s Drive, GMA,
Cavite Aug 1, 1999 Jul 31, 2009 1/
Guimba Salvador Afan St., Guimba, Nueva Ecija Oct 1, 2007 Sept 30, 2012 Hacienda Luisita Plaza Luisita, San Miguel, Tarlac, Taclac May 1, 1996 Apr 30, 2006
1/
Ilagan RCK Building, National Highway, Calamagui 2nd, Ilagan, Isabela
Dec 1, 2007 Nov 30, 2017
Imus Esguerra Bldg., Palico IV, Imus, Cavite Oct 1, 2007 Sep 30, 2017
Lguna Technopark Administration Building II Laguna Technopark, Binan, Laguna
Mar 16, 2008 Mar 15, 2013
Laoag Jackie’s Commercial Building II, J. Rizal St., Laoag, Ilocos Norte
Feb 1, 2007 Jan 31, 2012
Legaspi City M. Dy Building, Rizal St., Legaspi City Dec 1, 2001 Nov 30, 2011 LIIP (Binan) Adm. Bldg., Laguna Int’l. Ind’l. Park, Biñan,
Laguna Oct 1, 2004 Sep 30, 2009
1/ Lipa C M Recto Ave. cor. E. Mayo St., Lipa City Jan 1, 1992 Decr 31, 2007
1/
Lucena Quezon Ave. cor. Tagarao St., Lucena City May 31, 1987 May 31, 2007 1/
Lucena-Evangelista Quezon Ave., cor. Evangelista st., Lucena City Dec 1, 2008 Dec 1, 2018 Marinduque EDG Building, Bgy. Lapu-lapu, Sta. Cruz,
Marinduque Dec 1, 2001 Nov 30, 2016
Meycauayan Sunrise Bldg., McArthur Highway,Saluysoy, Meycauayan, Bulacan
Oct 15, 2008 Oct 15, 2018
Naga Crown Hotel Building, Peñafrancia, Naga City Jun 1, 1997 May 31, 2007 1/
Olongapo 1055 Rizal Ave., Extn West Tapinac Olongapo City Sep 01, 2008 Aug 31, 2018
Rosario Cavite Export Processing Zone Authority, Rosario, Cavite
Jan 8, 2007 Jan 7, 2017
San Fernando McArthur Highway, Dolores, San Fernando, Pampanga
Jul 1, 2006 Jun 30, 2011
San Fernando (Robinson’s)
Robinson’s Mall, San Fernando, Pampanga Apr 1, 2007 Mar 31, 2009 1/
San Fernando- Sindalan
McArthur Highway, Sindalan, City of San Fernando, Pampanga
Nov 09, 2007 Nov 09, 2017
San Jose Nueva Ecija Mokara Bldg., Abar 1st, Maharlika H-way, San Jose City, Nueva Ecija
Sep 01, 2008 Aug 31, 2018
San Pablo Ultimart Shopping Plaza, M. Paulino St., San Pablo City
Jun 1, 2006 May 31, 2016
San Pedro National Highway, San Pedro, Laguna Apr 1, 2002 Mar 31, 2012 Santiago #26 Maharlika Highway, Victory Norte, Santiago,
Isabela Jan 01, 2004 Dec 31, 2008

22
Science Park Pulo Road, Bgy. Diezmo, Cabuyao, Laguna Jan 01, 2009 Dec 31, 2009 Solano National Highway, Solano, Nueva Ecija Jun 1, 2007 May 31, 2012 Sta. Maria #39 J.P. Rizal St., Pob., Sta. Maria Bulacan Jan 01, 2008 Dec 31, 2017 Sta. Rosa Paseo de Sta. Rosa, Bgy. Don Jose, Sta. Rosa,
Laguna July 1, 2007 Oct 31, 2009
1/ Sta. Rosa Balibago Carvajal Building, Old National Highway, Balibago,
Sta. Rosa, Laguna May 1, 2007 Apr 30, 2017
Subic Royal Subic Duty Free Complex, Rizal cor. Argonaut Highway, Subic Bay Free Port Zone, Olongapo, Zambales
Feb 1, 1999 Jan 31, 2009 1/
Tarlac F. Tanedo St., Tarlac, Tarlac Oct 1, 2001 Sep 30, 2011 Tayug Bonifacio St., Tayug, Pangasinan Apr 1, 1997 Mar 31, 2017 Tuguegarao Bonifacio cor. Gomez St., Tuguegarao, Cagayan Mar 8, 2000 Mar 9, 2015
Urdaneta McArthur Highway, Urdaneta, Pangasinan Jun 15, 2003 Jun 15, 2013 VISAYAS AREA Antique Carretas St., San Jose Antique Apr 30, 2008 Apr 30, 2009
1/ Banilad Banilad Road, Cebu City Jan 17, 2005 Jan 18, 2010 Boracay Station 1, Brgy Balabag Boracay, Malay, Aklan Dec 1, 2009 Dec 1, 2019 Calbayog cor. Magsaysay Ave & Gomez Sts., Calbayog City,
Northern Samar May 1, 2007 Apr 30, 2012
Catarman J.P. Rizal St., Catarman N. Samar Jun 30, 2000 Jun 30, 2009 1/
Catbalogan del Rosario St., Catbalogan , Western Samar Nov 1, 1992 Oct 31, 2012 Cebu Paseo Arcenas Don Ramon Arcenas St., R. Duterte St., Banawa,
Cebu City Feb 27, 2009 Feb 27, 2014
Consolacion ADM Building, Cansaga, Consolacion, Cebu May 5, 2003 May 4, 2018 Dumaguete Dr. V. Locsin St., Dumaguete City Dec 31, 1992 Dec 31, 2012 Guadalupe 151 M Velez St., Guadalupe, Cebu City Feb 28, 2007 Feb 28, 2012 Hinigaran Rizal St. (National Road), Hinigaran, Negros
Occidental May 5, 2005 Apr 30, 2020
Iloilo-Ledesma Cor. Ledesma & Quezon St., Iloilo City Apr 01, 2008 May 31, 2018 Iloilo-Mabini Go Pun Building, Mabini cor. Delgado Sts., Iloilo
City Apr 1, 2009 Mar 31, 2019
Jaro Cor. Seminario & E. Lopez STS. Jaro. Iloilo City Dec 1, 2008 Nov 30, 2014 Jetty Port Fx Booth Brgy. Caticlan Malay, Aklan Nov 05, 2008 Nov 04, 2013 Kalibo Roxas Ave., Kalibo Aklan Apr1, 2008 Feb 28, 2018 Libertad AU Gomez Bldg., Libertad Ext., Bacolod City May 1, 2006 April 30, 2011Lacson G/F Lourdes C Centre II Bldg., 14th -Lacson Sts.,
Bacolod City Nov 1, 2006 Nov 30, 2011
Mactan Mepz Bldg., Mepz 1, Lapu-Lapu City, Cebu Jan 9, 2007 Jan 9, 2017 MEPZ (Mactan 2) Pueblo Verde Mactan Export Processing Zone II
Basak, Lapu-Lapu City Oct 13, 2001
Oct 12, 2016
Manalili Tan Sucheng Bldg., V. Gullas St., Cebu City Feb 1, 1996 Jan 31, 2011 North Reclamation CIFC Tower, Humabon St., cor Juan Luna Ave.,
North Reclamation Area, Cebu City Aug 1, 2006 July 31, 2011
Ormoc GF MFT Bldg., Real cor Carlos Tans Sts., Ormoc City
May 16, 2007
May 15, 2017
San Carlos Locsin St., San Carlos City, Negros Occ. Aug 1, 2007 Jul 31, 2011 Shopping Hilado Street, Bacolod City Jun 1, 2006 May 31, 2016 Sto Niño Belmont Home Depot Bldg., Cor. P. Burgos & Nov 01, 2008 Nov 01, 2013

23
Legaspi St., San Roque, Cebu City Tabo-an Cor. Lakandula & C Padilla Sts., Cebu City Jan 31, 2008 Jan 31, 2018 Toledo Toledo Commercial Village, Brgy. Poblacion,
Toledo City Jan 1, 2007 Dec 31, 2011
MINDANAO AREA Butuan cor E Luna & Lopez Jaena Sts., Butuan City Jun 28, 2004 Jun 28, 2012 Bajada JP Laurel Ave., corner Villa Abrille st., Davao City Aug 16, 2009 Aug 16, 2019 Cagayan de Oro cor A. Velez & JR Borja Sts., Cagayan de Oro City Dec 1, 2007 Nov 2012 Cogon cor Yacapin & Osmena St., Cagayan de Oro City Sep 1, 2008 Aug 31, 2018
Cotabato Don Rufino Alonzo St. Cotabato City 1/ 1/
Damosa Gateway Corner Mamay Road and JP Laurel Avenue, Lanang, Davao City
August 1, 2007 July 31, 2012
Davao-NCCC Mall NCCC Mall Davao Crossing Mc Arthur Highway and Maa Road Matina Davao City
Aug 20, 2007 Aug 20, 2012
Dipolog cor General Luna & Lacaya Sts., Dipolog City Oct 1, 1996 Sep 30, 2011 Dole Ext. Office Dole Phil Compound, Cannary Site, Polomolok
South Cotabato Jan 1, 2009 Dec 31, 2009
Gensan Stall Nos. 7 & 8 Safii Mall, J. Catolico Sr. Ave., Lagao, General Santos City
Jun 1, 2004 May 31, 2009 1/
Iligan Quezon Ave. cor. B. Labao St., Poblacion, Iligan City, Lanao del Norte
Feb 1, 2007 Jan 30, 2014
Ilustre Corner San Pedro & Ilustre Sts. Davao City May 1, 2002 Apr 30, 2012 Kidapawan Quezon Blvd., Kidapawan City Jul 15, 2008 Jul 15, 2018
Limketkai Gateway Tower 1, Limketkai Center, Cagayan de Oro City
Jul 1, 2009 Jun 30, 2019
Marbel Gen San Drive cor Roxas St., Koranadal City, South Cotabato
Nov 20, 2008 Nov 20, 2020
Panabo Gaisano Grand Mall, Quzon Street Panabo City Dec 23, 2008 Dec 13, 2013 Sta. Ana Cor. Monteverde & Sales Sts., Davao City Jun 6, 2005 Jun 7, 2010 Surigao Cor. San Nicolas & Burgos Sts., Surigao City Feb 1, 2008 Jan 31, 2018 Surigao Cor. San Nicolas & Burgos Sts., Surigao City Feb 1, 2008 Jan 31, 2018 Tacurong Hilario Bldg., cor Bonifacio St., National Highway,
Tacurong City Nov 15, 1996 Nov 15, 2006
1/
Tandag Pimentel Bldg., Donasco St., Tandag, Surigao del Sur
Jul 1, 2006 Jun 30, 2016
Valencia Sayre National Highway cor Lavinia Ave, Valencia Bukidnon
Sep 1, 2007 Aug 31, 2012
Victoria Plaza J.P. Laurel St. Bajada Davao City Jul 12, 2003 Jul 12, 2013 Zamboanga FSIN SVK Bldg., T Claudio St., Zamboanga City Mar 2, 2002 Mar 1, 2012 Zamboanga Veterans YPC Bldg., Veterans Ave., Zamboanga City Nov 1, 2007 Nov 1, 2012

24
BC NAME
BUSINESS ADDRESS
CONTRACT PERIOD
START EXPIRYE. RCBC SAVINGS BANK LEASED PREMISES METRO MANILA Ayala-Alabang G/F Sycamore Centre, Alabang-Zapote Road,
Alabang, Muntinlupa City Mar 16, 2007 Mar 15, 2013
Ayala Ave. Jaka Bldg., 6780 Ayala Ave., Makati City Jul 01, 2007 Jun 30, 2012 Baclaran Quirino Ave. cor. Aragon St., Baclaran, Parañaque
City Oct 02, 1998 Oct 01, 2015
Barangka 84 A. Bonifacio Ave., Riverbank Center, Marikina City
Jun 1,2009 May 31,2012
Binondo/Mendiola 8 Poinsettia Road,Quezon City Sep 01,2009 Aug 31,2019 C. M. Recto 1809 C.M. Recto Ave., Manila Jun 1, 2003 May 31, 2013 Divisoria Mall Unit 1717 A Divisoria Mall, Sto. Cristo cor.
Commercio St., Binondo Jun 30, 1997 Jun 30, 2015
Ermita 1123-25 A. Mabini St., Ermita Manila Jan 1, 2005 Dec 31, 2015 Fort Bonifacio 32nd St. cor. Bonifacio Blvd., Global City, Taguig
City Dec 16,2009 Dec 15,2014
Kalentong Arañez Bldg., Kalentong St., Sta. Ana, Manila May 1, 2002 Apr 30, 2012 La Huerta Brgy. La Huerta, Quirino Ave., Parañaque City Aug 17, 2007 Aug 16, 2012 Las Piñas Manuela Bldg. I, Alabang-Zapote Road, Las Piñas
City Apr 16,2008 Apr 15,2013
Las Piñas (add'l area) Manuela Bldg. I, Alabang-Zapote Road, Las Piñas City
Apr 16,2008 Apr 15,2013
Manuela-Edsa 444 Edsa cor. Shaw Blvd., Mandaluyong City Aug. 1, 2008 Jul 31,2013 Metropolis-Alabang Metropolis Star, Alabang, Muntinlupa City Jun 1, 2004 Feb 1, 2014 Ortigas Extension Ortigas Extension corner Riverside Ave., Brgy. Sta.
Lucia, 1608 Pasig City Sep 1, 2008 Aug 31, 2018
Pacific Place (201) Unit 201 Pacific Place Bldg., Pearl Drive, Ortigas Center, Pasig City
July 1,2009 Jun 30, 2012
Pacific Place (202) Unit 202 Pacific Place Bldg., Pearl Drive, Ortigas Center, Pasig City
Sep 1, 2004 Aug 30, 2006 1/
Pasay 2350 Taft Ave. cor. Libertad, Pasay City Mar 1,2008 Feb 28,2013 Pasig Town Proper Dr. Sixto Antonio Ave., Capasigan, Pasig City Sep 26, 1997 Sep 26, 2012 Pasong Tamo G/F Matrinco Bldg., 2178 Pasong Tamo, Makati
City Feb 15, 1998 Feb 14, 2013
Sucat Dr. A. Santos Ave., San Dionisio, Sucat, Parañaque City
Sep 1, 2007 Aug 30, 2012
Tandang Sora Warehouse
26 Cleofas St., San Miguel Subd., Tandang Sora, Quezon City
Jan 1, 2008 Dec 31, 2012
Tektite (1801 A & B, 1806 B)
18/F Tektite Bldg., West Tower, Exchange Road, Ortigas Center, Pasig City
Apr 16, 2005 Apr 15, 2010
Tektite (1802 A, B & C)
18/F Tektite Bldg., West Tower, Exchange Road, Ortigas Center, Pasig City
May 1, 2008 Apr 30, 2013
Tektite (1803 B ) 18/F Tektite Bldg., West Tower, Exchange Road, Ortigas Center, Pasig City
Feb 1, 2008 Jan 31, 2018
Tektite (Fiber Optic) PSEC, Ortigas Center, Pasig City Jun 1, 2008 May 31, 2013 Timog Picture City Center, 88 Timog Ave., Quezon City Feb 16, 2007 Feb 15, 2016

25
LUZON AREA Alaminos Quintos Bldg., Poblacion, Alaminos City,
Pangasinan Sep 1, 2007 Aug 31, 2012
Ampid, San Mateo 122 General A. Luna St., Ampid I. San Mateo, Rizal Aug 1, 2008 Jul 31, 2013 Angeles 810 Henson St., Angeles City Dec 14, 2007 Dec 13, 2012 Baguio G/f Juniper Bldg., A. Bonifacio St., Baguio City Jan 01, 2010 Dec 31, 2013 Batangas Diego Silang St., Barangay #15, Batangas City Oct 24, 2007 Oct 23, 2017 Candon Brgy. San Jose, National Highway, Candon, Ilocos
Sur Sep 1, 2002 Sep 1, 2012
Gen. Trias 59 Gov. Luis Ferrer Ave., Brgy. Malabon, Gen. Trias Cavite
Jun 1, 1993 Jun 1, 2013
Lemery Ilustre Ave., Lemery Batangas Nov 1, 2006 Oct 31, 2016 Lingayen G/F Columban Plaza, Poblacion, Lingayen
Pangasinan Sep 1, 2008 Aug 31, 2013
Meycauayan (Sto. Niño-ATM off site)
El Camino Real St., Las Villas de Sto. Niño, Brgy. Camalig, Meycauayan, Bul.
Oct 1, 2006 Sep 30, 2011
Molino RFC Molino Mall, Molino Road, Molino II, Bacoor Cavite
Jul 1, 2003 Jun 30, 2013
Morong Brgy. San Juan, Morong, Rizal Jun 1, 1992 Jun 1, 2017 San Fernando G/F Queensland Bldg., McArthur Hiway, Dolores,
San Fernando Pamp. Oct 1, 2007 Sep 30, 2013
San Jose, Batangas Dr. Concepcion A. Aguila Memorial College, Poblacion, San Jose, Batangas
Sep 1, 2008 Sep 1, 2013
San Pedro Brgy. Landayan, San Pedro, Laguna Apr 14, 2005 Apr 13, 2015 Tanauan 45 A. mabini Ave., Brgy.2, Tanauan City, Batangas Dec 1, 2003 Nov 30, 2013 Tanay J. P. Rizal St., Plaza Aldea, Tanay, Rizal Aug 1, 2007 Jul 3, 2012 Trece Martirez Brgy. San Agustin, Trece Martirez, Cavite City Aug 1, 2008 Aug 1, 2013 Urdaneta McArthur Highway, Brgy. San Vicente, Urdaneta,
Pangasinan Nov 9, 2005 Nov 9, 2010
Vigan Plaza Maestro, Vigan City, Ilocos Sur Jun 2, 2009 Jun 1, 2012 VISAYAS AREA Basak G/F Basak Commecial (King3), Basak Mandaue,
Cebu City Jan 1, 2007 Dec 31, 2011
Luzuriaga Golden Heritage Building No.1,San Juan, Luzuriaga Sts., Bacolod City
May 15,2009 May 14,2014
Maasin Tunga-Tunga, Maasin, Southern Leyte Feb 1,2009 Jan 31,2014 Naga Gen. Luna St., Naga City Apr 21, 2007 Nov 21,
20071/ Talamban Midel Bldg., Highway of Talamban, Cebu City Oct 1, 2006 Oct 1, 2011

26
1/ In process of renewal and/or subject of re-negotiation All the facilities and properties of the Bank are in good condition. Likewise, there are no liens and encumbrances on said properties of the Bank. Further, the Bank as of yearend 2009, is still open to acquisitions of smaller banks (in the case of commercial banks) and relatively larger ones (in the case of thrift banks). Item 3. Legal Proceedings In the normal course of operations of the Bank, there are various outstanding commitments and contingent liabilities such as guarantees, commitments to extend credit, tax assessments, etc., which are not reflected in the accompanying financial statements. Management does not anticipate losses from these transactions that will adversely affect operations. In the opinion of management, the suits and claims that remain unsettled, if decided adversely, will not involve sums that would have a material effect on Bank’s financial position or operating results. In June 2003, RCBC Capital, a wholly-owned subsidiary of the Bank, filed an arbitration claim with the International Chamber of Commerce (ICC) against Equitable PCI Bank (“Equitable”) relating to RCBC Capital’s acquisition of Bankard shares from Equitable in May 2000 for a purchase price of approximately P1.8 billion. The claim was based on alleged deficiencies in Bankard’s accounting practices and non-disclosure of material facts in relation to the acquisition. RCBC Capital sought a rescission of the sale or damages of approximately P1.0 billion, including interest and expenses. The arbitration hearings were held before the ICC Arbitral Tribunal (Tribunal). In September 2007, the Tribunal upheld the claim of RCBC Capital and stated that RCBC Capital is entitled to damages for the breach. On October 26 and 27, 2009, the final arbitral hearings were conducted, with experts presenting evidence to determine quantum of damages. The Bank's written submissions relating to the damages it is claiming were filed in December, 2009. In May 2006, RCBC Capital filed a civil case against SGV for damages of over P560.0 million. This civil suit alleges that SGV’s audit reports in respect of Bankard for the fiscal years commencing in 1997 and ending in 1999, on which RCBC Capital relied when it purchased Bankard in May 2000 for approximately P1.8 billion, were not prepared in accordance with Philippine accounting principles that were applicable at the time. The civil case remains pending with the Regional Trial Court of Makati City. Except for the above-mentioned lawsuit involving the Bank’s majority owned subsidiary, RCBC Capital Corporation and SGV & Company, the Bank is not aware of any suits and claims against its
MINDANAO AREA Carmen Waling-Waling St. cor. Ferrabel St., Cagayan de
Oro City Oct 1, 2008 Sep 30, 2009
1/ Carmen (Warehouse) Zone 5, Acacia St., Carmen, Cagayan de Oro Aug. 1, 2008 July 31, 2009
1/ Gen. Santos (ATM off site)
J. Catolico Sr. Ave., Gen. Santos City Sep 15, 2007 Sep 14, 2009 1/
J.P. Laurel G/F Ana Socorro Bldg., J.P. Laurel Avenue, Davao City
June 1,2009 May 31,2014
Monteverde Veterans Federation of the Phils. Bldg., Tomas Monteverde Ave., Davao City
Aug 1, 2007 Jul 31, 2012

27
subsidiaries, which if decided adversely would have a material effect on its financial position or operating results.
Item 4. Submission of Matters to a Vote of Security Holders In its special meeting held last 01 September 2009, the Bank received a total of 725,923,568 votes in favor of the proposal for the re-issuance of 41,993,389 RCBC Treasury Shares in exchange for shares of stock in MICO Equities, Inc. The said votes represent 77.368% of the outstanding 870,421,715 common shares and 67,851,213 preferred shares entitled to vote as of record date 30 June 2009.
PART II - OPERATIONAL AND FINANCIAL INFORMATION
Item 5. Market for Issuer’s Common Equity and Related Stockholder Matters
The common shares of the Bank are listed in the Philippine Stock Exchange. As of December 29, 2009 the market price of RCBC’s common shares closed at P17.25 per share. The trading prices of said shares for the different quarters of the years 2009 and 2008 are as follows:
Q1 Latest
Practicable Trading Date
Q2 Latest
Practicable Trading Date
Q3 Latest
Practicable Trading Date
Q4 Latest
Practicable Trading Date
2009 High Low
11.50/03.27.09 8.80/03.12.09
17.00/05.11.09 10.00/04.01.09
18.25/09.24.09 13.50/07.03.09
19.25/11.18.09 16.50/11.03.09
2008 High Low
23.75/01.02.08 16.50/03.18.08
19.25/05.26.08 14.75/06.30.08
18.00/09.08.08 13.75/07.01.08
16.00/10.02.08 9.30/10.29.08
There were 91 preferred shareholders and 919 common shareholders of record as of December 31, 2009. Likewise, preferred shares and common shares outstanding as of December 31, 2009 were 2,621,506 and 898,129,515 respectively. The top 20 common stockholders as of December 31, 2009:
Name
No. of Shares % to Total
PAN MALAYAN MANAGEMENT & INVESTMENT CORPORATION
431,970,241 48.10%
PCD NOMINEE CORPORATION 308,373,181 34.34%
PCD NOMINEE CORP.(NF) 72,614,670 8.09%
GREAT PACIFIC LIFE ASSURANCE CORPORATION
17,150,132 1.91%
MALAYAN INSURANCE CO., INC. 15,565,439 1.73%

28
FLOIRENDO, ANTONIO O. 15,149,692 1.69%
BANKERS ASSURANCE CORPORATION (formerly MALAYAN ZURICH INSURANCE CO., INC.)
8,833,173 0.98%
F. YAP SECURITIES, INC. 4,050,000 0.45%
FIRST NATIONWIDE ASSURANCE CORP. 3,714,413 0.41%
A.T. YUCHENGCO, INC. 3,243,871 0.36%
DHS INVESTMENTS, INC. 2,233,679 0.25%
HYDEE MANAGEMENT & RESOURCE CORP. 1,650,719 0.18%
REYNA, LEONARDO T. SIGUION 1,515,938 0.17%
SPINNAKER GLOBAL EMERGING MARKETS FUND LTD.
1,274,802 0.14%
SPINNAKER GLOBAL STRATEGIC FUND LTD. 867,951 0.10%
BACOLOD TWINSTAR CORPORATION 800,000 0.09%
WILSON, ISABEL CARO 590,709 0.07%
ROSARIO, RODOLFO P. DEL 574,724 0.06%
SPINNAKER GLOBAL OPPORTUNITY FUND LTD. 569,592 0.06%
GAW JR., MACARIO 422,000 0.05%
The top 20 preferred stockholders as of December 31, 2009:
Name
No. of Shares % to Total
FLOIRENDO, ANTONIO O.
2,148,892 81.97%
ROSARIO, RODOLFO P. DEL
81,521 3.11%
HSBC MANILA OBO
66,624 2.54%
GO, HOMER
46,355 1.77%
CAMPOS LANUZA & CO. INC.
44,179 1.69%
CONCEPCION, CARMENCITA
31,842 1.21%
INTRA-INVEST SEC. INC.
28,011 1.07%

29
G. D. TAN & CO. INC.
26,753 1.02%
OPTIMUM SECURITIES CORP.
16,666 0.64%
CHAN, FREDERICK
16,158 0.62%
BDO SECURITIES CORP.
9,304 0.35%
ERESE, HENRY
8,790 0.34%
NGO, LORETA
8,600 0.33%
NEW WORLD SEC CO. INC.
8,166 0.31%
MANDARIN SECURITIES CORPORATION
7,583 0.29%
TAN, LUCIANO H.
7,309 0.28%
ABACUS SECURITIES CORP.
6,021 0.23%
HWANG, HANS YAP
5,558 0.21%
ANG, TONY ANG &/OR ROSEMARIE
5,372 0.20%
SIA, JOHNSON CHUA
5,000 0.19%
The details of the 2009 and 2008 cash dividend declarations and distributions are as follows: (Amounts in millions)
Date Dividend Stockholders of Date Approved Date Declared Per Share Total Amount Record as of BOD BSP Paid/Payable
October 30, 2007 P 0.1829 P 15,054 December 21, 2007 October 30, 2007 January 4, 2008 January 10, 2008 January 28, 2008 P 0.174 P 14,945 March 21, 2008 January 28, 2008 April 4, 2008 April 17, 2008 July 30, 2007 * P 207,572 * July 30, 2007 April 4, 2008 April 25, 2008 March 31, 2008 P 0.1177 P 10,671 June 21, 2008 March 31, 2008 June 19, 2008 July 3, 2008 March 31, 2008 P 0.4800 P 462,165 June 29, 2008 March 31, 2008 June 19, 2008 June 30, 2008 March 31, 2008 P 0.4800 P 41,248 June 29, 2008 March 31, 2008 June 19, 2008 June 30, 2008 June 30, 2008 P 0.1227 P 10,445 September 21, 2008 June 30, 2008 September 3, 2008 September 30, 2008 July 30, 2007 * P 241,893 * July 30, 2007 September 3, 2008 October 24, 2008 September 29, 2008 P 0.1331 P 11,317 December 21, 2008 September 29, 2008 February 10, 2009 February 23, 2009 September 29, 2008 P 0.1331 P 11,317 December 21, 2008 September 29, 2008 February 10, 2009 February 23, 2009 September 29, 2008 * P 239,123 * September 29, 2008 April 16, 2009 April 24, 2009 September 29, 2008 * P 232,038 December 21, 2008 September 29, 2008 September 1, 2009 October 27, 2009 January 26, 2009 P 0.0881 P 5,978 December 21, 2008 January 26, 2009 April 16, 2009 May 8, 2009 March 30, 2009 P 0.0824 P 5,589 February 28, 2009 March 30, 2009 June 10, 2009 July 3, 2009 March 30, 2009 P 0.3060 P 20,762 March 11, 2009 March 30, 2009 June 10, 2009 July 13, 2009 March 30, 2009 P 0.3060 P 266,349 March 11, 2009 March 30, 2009 June 10, 2009 July 13, 2009 June 29, 2009 P 0.0667 P 4,524 May 31, 2009 June 29, 2009 September 1, 2009 September 10, 2009 September 28, 2009 P 0.0579 P 3,931 December 21, 2009 September 28, 2009 December 7, 2009 January 5, 2010 September 28, 2009 * P 235,272 * September 28, 2009 Pending Pending * Cash dividends on Hybrid perpetual securities

30
Dividends are declared and paid out of the surplus profits of the Bank as often and at such times as the Board of Directors may determine after making provisions for the necessary reserves in accordance with law and the regulations of the Bangko Sentral ng Pilipinas. Item 6. Management’s Discussion and Analysis or Plan of Operation.
2007. The impetus for economic growth was sustained in 2007 due to strong economic fundamentals, the generally peaceful May elections, the continued appreciation of the peso and strong corporate results. These positive developments, however, were negated by soaring oil prices, widening global credit crunch resulting from the sub-prime mortgage crisis in the US, huge equities sell-offs globally and the slowing US economy. Foreign portfolio investments posted a net inflow in 2007, 35% higher than the US$2.6 billion figure reported for 2006. Although inflation accelerated to its highest level in December to 3.9%, the full year average of 2.8% is way below the official target of 4.0-5.0 percent. It also reflected a sharp slowdown from the previous year’s 6.2% full year average. The strong peso against the US dollar helped reduce average domestic prices as it provided stability to import costs, e.g., crude oil and petroleum products. However, the rising price of oil remains a challenge as it poses upside risks to inflation. The sustained inflows of remittances from overseas Filipinos and foreign investments resulted in the continued appreciation of the peso, record-high gross international reserves, cheaper importation costs and lower servicing of foreign currency denominated debts. For the third straight year, the average foreign exchange rate appreciated, improving by 10.08% from P51.29 in 2006 to P46.12 to the US dollar in 2007. At yearend, the peso-dollar exchange rate stood at P41.28, 15.84% stronger than the previous year’s P49.05 to the US dollar. The peso was among the best performing currencies in Asia in 2007. The weakening of the US dollar against major global currencies further contributed to the pesos strength. The benchmark 91-day Treasury bill as of end-2007 posted an average rate of 3.40%, lower than the 5.19% the previous year, partly supported by lower inflation, improvement in the country’s fiscal position and the large surplus in the balance of payments. Relatively low borrowing costs due to the prevailing low interest rates encouraged greater economic activity in terms of new investments and expansion projects. Consequently, higher demand for commercial loans was sustained during the year. On the other hand, the average US dollar Singapore Offered Rate (SIBOR) gained 14 basis points year on year from 5.02% at end 2006 to 5.16%. Performance Indicators

31
RIZAL COMMERCIAL BANKING CORPORATION and SUBSIDIARIES In Php Consolidated Parent Audited
2006 2007 2006 2007 Return on Average Assets (ROA) 1.01% 1.42% 0.89% 1.04% Return on Average Equity (ROE) 12.64% 12.43% 9.14% 7.26% BIS Capital Adequacy Ratio (CAR) 20.31% 18.70% 20.47% 18.21%
Non-Performing Loans (NPL) Ratio 5.62% 5.27% 6.46% 6.12% Non-Performing Assets (NPA) Ratio
8.23%
6.85%
6.63%
5.20%
Earnings per Share (EPS) Basic 2.82 * 2.93 2.06 * 1.53 Diluted 2.81 * 2.84 2.06 * 1.48 * After retroactive effect of 15% stock dividends
Wholly-Owned/Majority Owned Subsidiaries
RCBC SAVINGS BANK In Php Audited Audited
2006 2007 Return on Average Assets (ROA) 1.23% 1.74% Return on Average Equity (ROE) 12.76% 16.35% BIS Capital Adequacy Ratio (CAR) 12.16% 15.36% Non-Performing Loans (NPL) Ratio 3.74% 3.49% Non-Performing Assets (NPA) Ratio 15.63% 12.11% Earnings per Share (EPS) 20.89 33.09
RCBC CAPITAL CORPORATION and Subsidiaries In Php Audited
2006 2007 Return on Average Assets (ROA) -2.27% 12.76% Return on Average Equity (ROE) -7.70% 14.87% BIS Capital Adequacy Ratio (CAR) 83.67% 28.27% Non-Performing Loans (NPL) Ratio - - Non-Performing Assets (NPA) Ratio - - Earnings per Share (EPS) (2.45) 7.82
RCBC FOREX BROKERS CORPORATION In Php Audited
2006 2007 Return on Average Assets (ROA) 17.46% 15.71% Return on Average Equity (ROE) 22.11% 26.02% Capital to Total Assets 77.90% 80.37% Non-Performing Loans (NPL) Ratio - - Non-Performing Assets (NPA) Ratio - - Earnings per Share (EPS) 86.00 110.47
RCBC INTERNATIONAL FINANCE LIMITED In Php Audited

32
2006 2007 Return on Average Assets (ROA) 7.22% 1.31% Return on Average Equity (ROE) 7.72% 1.42% Capital to Total Assets 90.33% 92.93% Non-Performing Loans (NPL) Ratio - - Non-Performing Assets (NPA) Ratio - - Earnings per Share (EPS) 5.91 1.00
RCBC CALIFORNIA INTERNATIONAL, INC. and Subsidiary In Php Audited
2006 2007 Return on Average Assets (ROA) 10.21% 5.04% Return on Average Equity (ROE) 27.42% 13.67% Capital to Total Assets 42.84% 30.56% Non-Performing Loans (NPL) Ratio - - Non-Performing Assets (NPA) Ratio - - Earnings per Share (EPS) 21.96 11.02
Notes to the Computations: 1. Consolidated and Parent company ROA and ROE ratios were taken from the corresponding audited financial statements. ROA ratio of the
subsidiaries was determined based on the average of the quarterly ending balances of total assets, audited and/or unaudited. ROE ratio of the subsidiaries was likewise computed based on the average of the quarterly ending balances of total equity, audited and/or unaudited.
2. CAR covers combined credit, market and operational risks. Where the BIS CAR was not computed, the simple Capital to Total Assets ratio formula
was used.
3. NPL ratio is determined by using the following formula: (Total NPLs net of NPLs fully covered by allowance for losses) / (Total loan portfolio net of NPLs fully covered by allowance for losses).
4. NPA ratio is determined by using the following formula: (Net NPLs + Net ROPA) / Total Assets.
5. For some subsidiaries, the NPL/NPA ratios were not computed since these ratios were not applicable. The Bank showed its strength and resilience as an emerging force and major player in the banking industry as it successfully prevailed over the challenges of the past year. The Bank’s improved performance was largely attributed to the structural and operating strategies undertaken over the past two years, the P5.6 billion new capital raised in February 2007, the aggressive low cost deposit campaign, prudent loan growth and treasury trading strategy. Coupled with an intensified marketing campaign to improve the services offered, these strategies resulted in a healthy growth in revenues.
RCBC TELEMONEY EUROPE S.P.A In Php Audited
2006 2007 Return on Average Assets (ROA) 8.19% 2.67% Return on Average Equity (ROE) 21.88% 13.65% Capital to Total Assets 35.31% 30.14% Non-Performing Loans (NPL) Ratio - - Non-Performing Assets (NPA) Ratio - - Earnings per Share (EPS) 17.43 8.15

33
In 2007 and thereafter, the Bank’s strategy would be repositioning for sustainable growth. Its goal would be to attract additional clients with the introduction of new products and services, expansion of the Bank’s presence and network and brand building. Additionally, the Bank intends to tap the country’s middle class, overseas Filipino workers (OFWs) and the small and medium enterprises (SMEs). The middle class constitutes the biggest segment of the country’s income brackets while the SMEs represent about 98% of the businesses in the country. Additionally, the Bank would invest in technology and people as it plans to open more ATMs in the next three years and hire young, dedicated and competent people. RCBC continues to be in the market for well-managed mid-sized commercial banks and thrift banks which may enable the Bank to increase its resource base, expand its branch network and reach in a cost-efficient manner. The Bank likewise plans to boost its global presence with the opening of several overseas branches within the next three years as well as put up new remittance centers in Canada, the US, the Middle East and the United Kingdom. To capture and serve the banking needs of migrant Filipinos, RCBC offers deposit accounts, investments, trust, bancassurance, business and property solutions to overseas Filipno workers through its remittance contact points that have an expansive branch network and tie-ups. To further improve its market share in the remittance market, other initiatives like tie-ups with shipping and manning agencies for the payroll and remittance needs of their seamen are being intensified. Tie-ups with real estate developers who use banks to receive remittance payments from overseas Filipino buyers are also being pushed. Moreover, the development of a web-based channel for OFWs is in the pipeline. To show that the Bank is committed to reaching out to its clients by giving them more access to the wide array of products and services, the Bank recently opened business centers in various locations throughout the country. The Bank intends to adopt a two-ATM per branch strategy in 2008 to reduce over-the-counter transactions and allow bank personnel to deal with loans and deposits and other transactions that require human intervention including marketing. This is part of the bank’s plan to put up more ATMs in the next three years after rationalizing the deployment of its ATMs and finalizing a definitive five-year plan for it. ATMs play a crucial part in the Bank’s plan to expand its client base. It should be a strong channel which can be used to offer the various products and services of the Bank. Consolidated total resources at the end of 2007 stood at P239.098 billion, 6.88% or P15.388 billion higher than the previous year’s P223.710 billion. The P15.388 billion expansion in total assets was mainly due to the increase in cash and other cash items, deposits maintained with the Bangko Sentral, trading and investment securities, loans and other receivables and investments in associates of 17.38%, 27.73%, 9.64%, 7.58% and 103.60%, respectively. This was offset, however, by the drop in deposits with other banks, investment properties and deferred tax assets of 38.00%, 22.27% and 10.17%, respectively. Accounting for 7.37% of total assets, deposits with the Bangko Sentral went up by P3.823 billion due to higher balances of the bank’s Reserve Deposit Account (RDA) for reserve requirement purposes. Although total investment securities grew by 9.64% only and represented 27.01% of total resources, available for sale securities (AFS) increased by 14.24% or by P6.809 billion. The impressive growth in deposit liabilities allowed the Bank to invest in high yielding AFS particularly ROPs, FXTNs, CLNs and CDOs.

34
However, the growth in AFS was offset by 10.19% decline in fair value through profit and loss (FVTPL) securities. The decrease was due to the drop in foreign currency denominated bonds and securities partly arising from the peso appreciation. Loans and other receivables, at 49.02% of total assets, went up by P8.262 billion. The remarkable loan growth was primarily due to the prevailing relatively low interest environment that attracted more borrowers. Additionally, borrowers were generally optimistic and encouraged by the country’s improved economy and low inflation that pushed them to pursue expansion projects and carry out new investments. The substantial growth in investment in associates of P2.123 billion was largely due to the acquisition of 25% direct equity in RCBC Realty Corporation (RCBC Realty). RCBC Land Inc. (RCBC Land) partially settled its obligation to the Bank through dacion en pago of its holdings in RCBC Realty on December 26, 2007. The Monetary Board, in its Resolution No. 1097 dated September 27, 2007, approved the proposed dacion en pago of the RCBC Realty shares owned by RCBC Land to RCBC. Due to the Bank’s shift to higher yielding investments, deposits with other banks contracted by 38.00% from P7.654 billion to P4.745 billion. Interest earning assets, thus, expanded by P13.940 billion from P167.839 billion at yearend 2006. Investment properties decreased from P9.985 billion to P7.761 billion, or by 22.27%, as the Bank aggressively pursued the disposition and/or sale of acquired real estate properties through negotiated sales and auctions. Deferred tax assets also went down by 10.17% mainly due to RCBC Savings Bank’s (RSB) deferred tax assets reversal by P179.5 million. Of total investment securities, AFS securities and FVTPL securities accounted for 22.85% and 4.17%, respectively, of total assets. Other resources-net at P12.002 billion comprised 5.02% of total resources. Sources of funds came mainly from interest-bearing liabilities that grew by 6.54% to P199.558 billion. Other liabilities declined by P2.497 billion, or by 19.19%. Capital funds expanded by 24.06% to P29.020 billion. Deposit liabilities at P175.929 billion grew by 11.67% from P157.550 billion. Peso and foreign currency denominated deposits expanded, in spite of the continued appreciation of the peso and low interest rates, and were used to fund the growth in total loans. The building of a strong sales culture across the Bank and the deposit campaign launched to target not only niche clients but also potential clients with average incomes and those working and living overseas contributed to the substantial growth in deposits. Accordingly, demand, savings and time deposits went up by 8.98%, 15.17% and 9.70%, respectively. The 27.30% drop in bills payable from P17.634 billion to P12.820 billion was due to maturing obligations. Similarly, bonds payable declined by 15.52% from P6.689 billion on account of the impact of revaluation arising from a strong peso. The peso-dollar exchange rate closed at P41.28 at yearend 2007, 15.84% stronger than the previous year’s P49.05. The substantial decrease in due to other banks of P2.620 billion or 77.16% was mainly attributable to the lower credit balances, which are temporary in nature, of working funds maintained with local

35
and foreign correspondent banks. These accounts are awaiting incoming funds which are already in transit. Although interest rates were lower this year as earlier mentioned, accruals of interest, taxes and other expenses expanded to P3.088 billion or by 8.90% due to the remarkable growth in deposit liabilities and revenues year on year. Total liabilities accounted for 87.86% of total resources. At 73.58% of total assets, total deposit liabilities continued to be the Bank’s main source of funding, particularly savings and time deposits which comprised 27.93% and 41.15%, respectively, of total resources. Bills payable representing 5.36% of total resources is another important source of funding for liquidity purposes. The successful follow-on offering of P5.6 billion worth of additional shares in March 2007 increased Bank’s capital funds, inclusive of minority interest and representing 12.14% of total resources, to P29.020 billion or 24.06% higher than P23.392 billion in 2006. On account of conversions to common stock, preferred stock was 18.53% lower this year from P1.055 billion. The P3.299 billion or 52.12% increment in common stock was primarily due to the additional public offering of approximately 210 million shares (including the green shoe offering), the 15% stock dividend equivalent to about 109 million shares and the conversion to common shares or preferred shares. The P3.453 billion improvement, from P2.119 billion to P5.572 billion, of capital paid in excess of par resulted from the issuance of common shares and conversion of preferred shares at a premium. Revaluation reserves on AFS securities and accumulated translation adjustment both declined by 64.34% and 55.77%, respectively, on account of securities sold during the year that resulted to realized trading gains and the continued appreciation of the peso. The Bank’s consolidated net income of P3.208 billion for the year 2007 primarily accounted for the 19.22% growth in surplus account. This was, however, offset by the 15% stock dividends, cash dividend payments to common and preferred shareholders in the total amount of P527 million and P77 million, respectively, and dividends/interest payment on hybrid tier 1 securities of P452 million. Share of minority interest was 10.25% higher from negative P283 million to negative P312 million on account of the higher percentage ownership of minority shareholders in subsidiaries that are not wholly owned. On October 30, 2007, the Bank’s Board of Directors approved the acquisition of Merchants Savings and Loan Association, Inc. (Merchants Bank) from Finman Capital Corporation and the heirs of the late Luis O. Manapat for P520 million. Closing of the transaction is subject to the successful negotiation of the relevant agreements as well as Bangko Sentral approval of the terms and conditions of the relevant agreements. Merchants Bank is a thrift bank established in 1977. It has 21 operating branches, 7 branches are located in Metropolitan Manila while the rest are dispersed over Luzon (7), Visayas (4), and Mindanao (3). The proposed acquisition is part of the Bank’s strategy to increase its branch network. The Bangko Sentral’s Monetary Board, in its Resolution No. 89 dated Jan 24, 2008, approved the Bank’s planned offering of tier 2 notes of up to P7 billion. The notes would qualify as Lower Tier

36
2 capital and would have a call option after the fifth year, giving the Bank the right but not the obligation to redeem the notes on that year. The new capital will replace RCBC’s maturing Tier 2 capital worth P5 billion issued in 2003. The capital notes were successfully issued on February 22, 2008. The Bank currently services its clients through its 301 business centers and 300 ATMs nationwide. The Bank recently launched a battery of new products meant to enhance its current retail market products and services: (a) E-woman, a checking account exclusively designed for women that provides special perks and privileges; (b) Rizal Enterprise Checking Account, an interest bearing checking account with a free accounts payable software that automates the process of printing checks and reconciling payables; (c) RCBC Retail Internet banking platform that provides clients access to their RCBC accounts 24/7; and (d) RCBC Bankard Diamond credit card. With these innovative financial products and services that are sensitive to the needs and wants of its clients, the Bank expects that its efforts would eventually pay-off in terms of increased profitability and higher market share. To date, the Bank has already begun to reap the benefits of the structural, operational and capital improvements initiated in the past two years with the successful offering of P5.6 billion public offering in March 2007. During the year, there were no known trends, demands, commitments, events or uncertainties that would have a material impact on the Bank’s liquidity. The Bank does not anticipate having within the next twelve (12) months any cash flow or liquidity problems. It is not in default or breach of any note, loan, lease or other indebtedness or financing arrangement. Further, there are no trade payables that have not been paid within the stated terms. To the knowledge and/or information of the Bank, there are no events that will trigger a direct or contingent financial obligation that is material to the company, including any default or acceleration of an obligation. There were no material off-balance sheet transactions, arrangements, obligations (including contingent obligations) and other relationships of the company with unconsolidated entities or other persons created during the reporting period. The year 2007 was another good year for the Bank. It recorded its highest net income in history of P3.208 billion, 56.27% above last year’s P2.053 billion. The remarkable growth in net revenues was largely due to the 21.50% improvement in net interest income from P7.258 billion last year. Representing 44.39% of gross revenues, net interest income was higher year on year on account of higher average interest earning assets and the hike in low-cost funds, particularly traditional deposits, and lower interest rates. Interest rates were considerably lower year on year as the benchmark 91-day Treasury bills averaged 3.40% this period from 5.19%, declining 179 basis points year on year. Additionally, the continued appreciation of the peso contributed to the reduction in interest expenses year on year. Consequently, total interest expense dropped 19.31% as interest on deposits and borrowings went down by 16.59% and 23.81%, respectively. Though interest income from loans and receivables and investment securities were slightly lower year on year due to the continued softening of interest rates, interest income from deposits rose 102.59% year on year as the Bank participated in the Special Deposit Account window of the Bangko Sentral in 2007. These placements were subject to tiered interest rates compared with interbank call loans. As a result total interest income remained stable at P15.330 billion from P15.328 billion. Accounting for 77.16% of gross revenues, total interest income of P15.330 billion comprised mainly of interest income from loans and receivables and investment securities that accounted for 48.24% and 24.75%, respectively, of total income. At 32.77% of gross income, total interest

37
expense of P6.511 billion consisted of interest on deposit liabilities and bills payable and other borrowings, representing 21.10% and 11.67% of gross revenues, respectively. Net income of P3.208 billion accounted for 16.14% of gross income. As the quality of Bank’s assets continued to improve, provisioning for impairment losses at P942 million was 46.12% lower year on year. Other income of P4.538 billion accounted for 22.84% of gross income, mainly consisting of trading and securities gain-net, service fees and commissions and other income, 6.69%, 7.62% and 5.83% of total revenues, respectively. The 44.10% drop in trading and securities gain-net, 25.02% decline in trust fees and 16.17% decrease in commissions and other income, offset by the 40.40% and 52.08% growth in service fees and equity in net earnings of associates, respectively, accounted for the lower other income year on year. Other income went down by 14.62% from P5.315 billion. Operating expenses of P8.325 billion comprised 41.90% of gross revenues and was relatively flat as the Bank aggressively improved its credit card operations and focused on the expansion of its retail banking network. Manpower costs, occupancy and equipment related expenses and taxes and licenses accounted for 12.00%, 7.10% and 5.38%, respectively, of total income. The 9.15% increase in manpower costs from P2.184 billion was basically due to the impact of the new CBA agreement that became effective in the last quarter of 2006. The higher cost of training and other employee benefits further contributed to the increase. On the other hand, taxes and licenses went down by 21.94% from P1.369 billion largely due better tax management and the availment of discounts on local taxes and fees. Additionally, there was a one-time payment for abatement of taxes paid to the Bureau of Internal Revenue (BIR) in December 2006. The Bank availed of the One-time Administrative Abatement Program of the BIR under Revenue Regulations No. 15-2006, which provides for the abatement of all penalties, including surcharges and interest on delinquent accounts or assessments, including those subject to ongoing disputes. Similarly, foreign exchange loss-net decreased by 39.77% year on year from P261 million. Miscellaneous operating expenses, representing 15.04% of gross revenues, went up by 9.46% on account of the continuous enhancements and/or improvements to Bank’s communications and information technology infrastructure in support of its goals. Likewise, consultancy and professional fees incurred and the fees paid to the Philippine Deposit Insurance Corporation (PDIC) and the Bangko Sentral ng Pilipinas (BSP) went up as a result of the increase in deposit liabilities and total assets. Overall, operating costs during the year were effectively managed and controlled. At P846 million, provision for tax expense increased by 34.90%, or by P219 million, as a major portion of Bank’s revenues were subjected to final taxes withheld at source. The deferred tax assets reversal of RSB for P179.5 million likewise contributed to the increase in taxes. Minority interest in net income went up to P36 million from negative P163 million due to the continued improvement in the profitability of Bank’s not wholly owned subsidiaries. Total budget for consolidated capital expenditures for the year 2008 amounts to P1.619 billion. Primary capital expenditures would include the continuous upgrade and developments to its IT infrastructure, including software, as well as investments in the expansion of its branch network. In 2007, there were no known trends, events or uncertainties that have had or that are reasonably expected to have a material favorable or unfavorable impact on net revenues from continuing operations.

38
Similarly, there were no significant elements of income or loss that did not arise from the Bank’s continuing operations. Lastly, there were no seasonal aspects that have a material effect on the financial condition or results of operation of the Bank.
2008. Philippine GDP in 2008 grew 4.6%, the lowest in 6 years (since 2002) and down from the 31-year high of 7.2% in 2007. Similarly, Philippine GNP growth slowed down to 6.1% vs. 8.1% in the previous year. The US economy, the world’s largest and among the biggest export markets of the Philippines, was already in recession since December 2007. Developed countries (US, Europe, Japan) were expected to contract simultaneously for the first time since World War II. Inflation averaged 9.3% in 2008, sharply up vs. the 2-decade low of 2.8% in 2007, after the sharp increase in the prices of oil, rice, and other global commodities in the early part of 2008. However, inflation started to taper off from the 17-year high of 12.5% posted in Aug. 2008, after prices of major global commodities collapsed in the latter part of 2008, as weaker global economic conditions translated to lower demand. By December 2008, inflation already receded to a 9-month low of 8%. The 91-Day Treasury Bill Rate ended 2008 at 6.12%, nearly double the 3.67% posted a year earlier, fundamentally consistent with higher inflation. However, it is important to note that the BSP already reduced the key Philippine interest rates towards the end of the year, in line with the global trend, as inflationary pressures eased with the collapse in the prices of oil and other major global commodities. Consequently, key Philippine interest rates in the secondary market, as measured by the PDST yields, mostly fell to near 1-year lows towards end-2008. The Peso Exchange Rate depreciated in 2008 by 6.24 Pesos or 15% to close at 47.52 vs. 41.28 in the previous year, similar to the depreciation in most of the other Southeast Asian currencies. Philippine Gross International Reserves (GIR) reached a record high of US$37.6 billion or equivalent to 6 months worth of imports (double compared to the 1990s), thereby increasing the country’s foreign exchange buffer stock and cushion against speculative attacks on the local currency. OFW Remittances for 2008 increased by 13.7% to US$16.4 billion, slightly better than the 13.2% growth posted in 2007, as OFW deployment increased by 28% to 1.4 million, significantly higher compared to the 1% growth in 2007. However, for the month of December 2008, it is important to note that OFW Remittances already slowed to a 2-year low of +1% and OFW Deployment already declined by 6%. The global economic recession already weighed on international trade. Exports declined by an average of 3% to US$49 billion in 2008, compared to a growth of 6% in 2007. It is very important to note that exports for the month of December 2008 dramatically fell by 40%, the most in at least 28 years. Imports posted a slight growth of 2% in 2008 to US$56.6 billion vs. the 8% growth in the previous year. However, for the month of December 2008, imports sharply declined by 34%, the most in at least 28 years. Trade Balance for 2008 was wider at -US$7.6 billion compared to –US$5 billion in the previous year.

39
Performance Indicators RIZAL COMMERCIAL BANKING CORPORATION and SUBSIDIARIES
In Php Consolidated Parent Audited 2007 2008 2007 2008
Return on Average Assets (ROA)
1.42% 0.87% 1.04% 0.56%
Return on Average Equity (ROE)
12.43% 7.40% 7.26% 3.50%
BIS Capital Adequacy Ratio (CAR)
18.70% 17.30%
18.21% 16.28%
Non-Performing Loans (NPL) Ratio
5.27% 2.42% 6.12% 2.54%
Non-Performing Assets (NPA) Ratio
6.85%
4.83%
5.20%
3.32%
Earnings per Share (EPS)* Basic 2.93 1.72 1.53 0.70 Diluted 2.84 1.66 1.48 0.67
* After giving retroactive effect to the 15% stock dividend s issued in 2007.
Wholly-Owned/Majority Owned Subsidiaries RCBC SAVINGS BANK In Php Audited Audited 2007 2008 Return on Average Assets (ROA) 1.76% 1.78% Return on Average Equity (ROE) 15.32% 13.69% BIS Capital Adequacy Ratio (CAR) 15.36% 14.85% Non-Performing Loans (NPL) Ratio 3.49% 3.63% Non-Performing Assets (NPA) Ratio 12.11% 3.30% Earnings per Share (EPS) 33.09 25.15
MERCHANTS BANK In Php Audited Audited 2007 2008 Return on Average Assets (ROA) ( 6.73%) (23.36%) Return on Average Equity (ROE) (11.72%) (32.33%) BIS Capital Adequacy Ratio (CAR) 105.11% 99.12% Non-Performing Loans (NPL) Ratio 0.31% 2.37% Non-Performing Assets (NPA) Ratio 0.12% 0.38% Loss per Share (13.44) (27.42)

40
RCBC CAPITAL CORPORATION and Subsidiary In Php Audited Audited
2007 2008 Return on Average Assets (ROA) 11.03% 16.81% Return on Average Equity (ROE) 13.82% 20.69% BIS Capital Adequacy Ratio (CAR) 49.07% 47.80% Non-Performing Loans (NPL) Ratio - - Non-Performing Assets (NPA) Ratio - - Earnings per Share (EPS) 7.82 4.02
RCBC FOREX BROKERS CORPORATION
In Php Audited Audited 2007 2008
Return on Average Assets (ROA) 15.71% 14.05% Return on Average Equity (ROE) 26.02% 26.68% Capital to Total Assets 80.37% 43.61% Non-Performing Loans (NPL) Ratio - - Non-Performing Assets (NPA) Ratio - - Earnings per Share (EPS) 110.47 118.99
RCBC INTERNATIONAL FINANCE, LTD. and Subsidiary In Php Audited Audited
2007 2008 Return on Average Assets (ROA) 1.31% (2.77%) Return on Average Equity (ROE) 1.42% (2.98%) Capital to Total Assets 92.93% 92.22% Non-Performing Loans (NPL) Ratio - - Non-Performing Assets (NPA) Ratio - - Earnings (Loss) per Share 1.00 (2.05)
RCBCNORTH AMERICA, INC.
In Php Audited Audited 2007 2008
Return on Average Assets (ROA) 5.04% (14.74%) Return on Average Equity (ROE) 13.67% (56.86%) Capital to Total Assets 30.56% 16.15% Non-Performing Loans (NPL) Ratio - -

41
Non-Performing Assets (NPA) Ratio - - Earnings (Loss) per Share 484.69 (1.56)
RCBC TELEMONEY EUROPE S.P.A In Php Audited Audited
2007 2008 Return on Average Assets (ROA) 2.67% 6.82% Return on Average Equity (ROE) 13.65% 44.06% Capital to Total Assets 30.14% 11.95% Non-Performing Loans (NPL) Ratio - - Non-Performing Assets (NPA) Ratio - - Earnings per Share (EPS) 48.91 228.03
BANKARD, INC. In Php Audited Audited 2007 2008 Return on Average Assets (ROA) 9.57% 31.50% Return on Average Equity (ROE) 12.50% 45.52% Capital to Total Assets 81.99% 72.47% Non-Performing Loans (NPL) Ratio - - Non-Performing Assets (NPA) Ratio - - Earnings per Share (EPS) 0.29 0.18
Notes to the Computations:
1. Parent Company, RSB and MB ROA and ROE ratios were taken from the corresponding audited financial statements. ROA ratio of the other subsidiaries was determined based on the average of the quarterly ending balances of total assets, audited and/or unaudited. ROE ratio of the other subsidiaries was likewise computed based on the average of the quarterly ending balances of total equity, audited and/or unaudited.
2. CAR covers combined credit, market and operational risks. Where the BIS CAR was not computed, the simple Capital to Total Assets ratio
formula was used.
3. NPL ratio is determined by using the following formula: (Total NPLs net of NPLs fully covered by allowance for losses) / (Total loan portfolio net of NPLs fully covered by allowance for losses).
4. NPA ratio is determined by using the following formula: (Net NPLs + Net ROPA) / Total Assets.
5. For some subsidiaries, the NPL/NPA ratios were not computed since these ratios were not applicable.
2008 was a challenging year for the local banking industry. Almost all the big banks are expected to post lower income for the whole of last year due to their Lehman exposures. However, RCBC showed real toughness. In the midst of a very tough environment, RCBC posted a growth in total resources of 12.20%. Although the Bank’s consolidated net income has declined by 32.86% from P3.208 billion in 2007 to P2.154 billion in 2008, the Bank’s interest income from loans grew by 13.58% on the expansion of its loan portfolio in the various market segments. Likewise, fees and commissions and other income increased by 8.51% and 73.07%, respectively, with the ongoing strategy to not only increase the number of customers but also the volume in remittances, trust and other fee-based services. RCBC’s final figures reflect the ongoing developments in the global economy. But as the Bank continues to strive with the challenges in the present economy, its goal to attract additional one million clients a year with the introduction of new products and services, expansion of the Bank’s

42
presence and network and brand building, still remain. On the other hand, as a strong and major player in the remittance business with a wide presence overseas through remittance subsidiaries and tie-ups, the Bank will keep on tapping the country’s middle class, overseas Filipino workers (OFWs) and the small and medium enterprises (SMEs). Additionally, the Bank would continue to invest in technology and people as it plans to open more business centers per year and ATMs in the next three to five years and hire young, dedicated and competent people. RCBC continues to be in the market for well-managed mid-sized commercial banks and thrift banks which may enable the Bank to increase its resource base and expand its branch network and reach in a cost-efficient manner. Consolidated total resources grew by 12.20% to P268.270 billion at the end of 2008 for a P29.172 billion increase from the P239.098 billion in 2007. The P29.172 billion expansion in total assets was mainly due to the increase in cash and other cash items – 15.87%, loans and other receivables-net – 40.28% and bank premises, furniture, fixtures and equipment - 15.01%. This was offset, however, by the drop in deposits maintained with the Bangko Sentral – 6.93%, trading and investment securities – 27.52%, investment properties – 4.82% and deferred tax assets - 15.44%. Accounting for 6.11% of total assets, deposits with the Bangko Sentral went down by P1.220 billion mainly due to the decrease in reserve requirement by 200 hundred basis points from 21% in 2007 to 19% in 2008. Total investment securities, which represents 17.45% of total resources, has declined by 27.52% comprising of Financial assets at fair value through profit or loss (FVTPL) – 65.49%, Held-to-maturity investments (HTM) – 7.71% and Available for sale securities (AFS) – 8.46% of total resources. The huge drop in FVTPL and AFS of 65.49% (P6.522 billion) and 58.44% (P31.925 billion), respectively, was mainly due to losses from marking these assets to market and reclassifications to HTM account with carrying value of P20.674 billion representing 7.71% of total resources. In October 2008, the International Accounting Standards Board (IASB) issued amendments to IAS 39: Financial Instruments: Recognition and Measurement and International Financial Reporting Standards (IFRS) 7: Financial Instruments: Disclosures allowing the reclassifications of investments out of FVTPL category except derivatives and financial instruments designated at fair value through profit or loss (DFVTPL). Additionally, instruments which would have met the definition of loans and receivables can be reclassified out of FVTPL or AFS if the entity had the intent and the ability to hold the financial asset for the foreseeable future or until maturity. Reclassifications out of FVTPL category should be done only in rare circumstances. The amendments are applicable in a partially retrospective manner up to July 1, 2008 provided that the reclassification was made on or before November 15, 2008. These amendments were adopted by the Financial Reporting Standards Council (FRSC), the local counterpart of IASB. Likewise, the Bangko Sentral ng Pilipinas (BSP) has issued Circular No. 628 outlining the prudential reporting guidelines for banks. On February 2, 2009, the SEC approved the adoption of BSP Circular 628 as being compliant with generally accepted accounting principles for banks. The Bank’s reclassifications made in 2008 were in accordance with the provisions of IAS/PAS 39 and IFRS/PFRS 7, as amended and BSP Circular 628. A more comprehensive discussion and disclosures with regard to reclassification of financial instruments are presented on the attached Notes to Financial Statements, more particularly Notes 2, 8, 9, 10 and 11. Representing 61.28% of total resources as of year-end, total net loans and other receivables increased by 40.28% or P47.208 billion from the P117.195 billion in 2007 to P164.403 billion last

43
year. The said increase was driven by higher loan volumes to corporate and small and medium enterprises (SMEs) and retail loans granted by RSB, RCBC’s thrift bank subsidiary. The significant rise in the balance of this account is also on account of the P12.178 increase in interbank loan receivable and P6.622 billion worth of financial assets previously classified as AFS to Unquoted debts classified as loans (UDSCL), part of loans and receivables account, as discussed in the preceding paragraph. Bank premises, furniture, fixtures and equipment registered a 15.01% increase or P 525.953 million from P3.504 billion to P4.030 billion arising from the Bank’s aggressive branch expansion as part of its long-term plan to increase its resource base and expand its branch network. In 2008, the Parent Bank opened twenty (20) new business centers, deployed fifty eight (58) new ATMs, and piloted foreign exchange booths and E-biz centers. The Bank has also completed its "computer refresh" program during the year wherein new personal computers were acquired to replace older less efficient units. Investment properties decreased from P7.761 billion to P7.388 billion, or by 4.82%, as the Bank aggressively pursued the disposition and/or sale of acquired real estate properties through negotiated sales and auctions. Reduction in the carrying value of Deferred tax assets by 15.44% or P254.059 million was due to write-offs of receivables made by subsidiaries resulting to the corresponding reversal of related deferred tax assets. Sources of funds came mainly from interest bearing liabilities that grew by 15.57% or P31.066 billion to P230.624 billion. Outstanding acceptances payable increased by 35.87% or P84.19 million while accrued taxes, interest and other taxes and other liabilities declined by P300.054 million or 9.72% and P294.397 million or by 4.09%, respectively. Capital funds declined by 4.77% from P29.020 billion to P27.637 billion. Deposit liabilities at P196.227 billion grew by 11.54% from P175.929 billion. Peso and foreign currency-denominated deposits expanded, in spite of the continued appreciation of the peso and low interest rates, and were used to fund the growth in total loans. The building of a strong sales culture across the Bank and various deposit products and services launched to target not only niche clients but also potential clients with average incomes and those working and living overseas contributed to the substantial growth in deposits. Accordingly, demand, savings and time deposits went up by 3.34%, 13.43% and 11.15% respectively. The 67.33% increase in bills payable from P12.820 billion to P21.453 billion was due to higher foreign currency denominated borrowings. Likewise, the peso equivalent of the outstanding bond issue as of December 31, 2008 and 2007 amounted to P6.003 million and P5.651 million respectively, with an increase of 6.23% or P352.151 million mainly due to the higher peso/dollar exchange rate at year-end. Accruals of interest, taxes and other expenses decreased to P2.787 billion or by 9.72% from the previous year of P3.088 billion due to large volume of time deposits whose interest payments coincide at year-end and lower expense accruals as a result of the Bank’s effort to cut costs. The Bangko Sentral’s Monetary Board, in its Resolution No. 89 dated Jan 24, 2008, approved the Bank’s planned offering of tier 2 notes of up to P7 billion. The notes would qualify as Lower Tier 2 capital and would have a call option after the fifth year, giving the Bank the right but not the

44
obligation to redeem the notes on that year. The new capital notes will replace RCBC’s existing Tier 2 capital worth P5 billion issued in 2003, which was redeemed in July 2008. The new capital notes were successfully issued on February 22, 2008. The outstanding balance of subordinated debt of P6.942 billion represents the carrying value of the new notes issued in 2008, higher by 34.58% or P1.784 billion year on year. Total liabilities accounted for 89.70% of total resources. At 73.15% of total assets, total deposit liabilities continued to be the Bank’s main source of funding, particularly savings and time deposits which comprised 28.23% and 40.77 of total resources, respectively. Bills payable representing 8.00% of total resources is another important source of funding for liquidity purposes. The Bank’s consolidated net income of P2.154 billion for the year 2008 primarily accounted for the 17.42% growth in surplus account. This was, however, offset by the cash dividend payments to common and preferred shareholders in the total amount of P554.528 million and dividends/interest payment on hybrid tier 1 securities of P449.465 million. Total Capital funds attributable to parent company shareholders amounted to P27.681 billion as at year-end 2008, lower by 5.63% or P1.651 billion from last year’s P29.332 billion. The decline was caused by net unrealized mark-to-market losses on AFS securities of P1.569 billion, which is a reversal of last year’s P1.032 billion gains or P2.601 billion decrease in market value year on year. As previously discussed, interest rates, one of the key drivers of market value, almost doubled during the year. Minority interest was 85.80% lower from negative P311.669 million to negative P44.267 million mainly due to decrease in share of losses due to dilution and on account of the lower percentage ownership of minority shareholders in the Bank’s credit card subsidiary. On May 2008, the Bank has finally acquired Merchants Savings and Loan Association, Inc. (Merchant Bank) from Finman Capital Corporation and the heirs of the late Luis O. Manapat. The said acquisition was in line with the general strategy of the Bank to focus on acquisitions of small and medium-sized banks. In relation to the said strategy, the RCBC Board of Directors, in its special meeting held on February 11, 2009, has approved the establishment of a P375.0 million shareholder advance facility which will be infused over a three (3)-year period from 2009-2011 and will result in the acquisition by RCBC of JP Laurel Rural Bank. The decision will take effect upon the final approval by the Monetary Board of the terms of the agreement in line with the BSP’s program encouraging the creation of stronger banks for a more stable banking system. This is one of the first major steps taken by RCBC to enter the microfinance business and assist in the development of small businesses. The JP Laurel Rural Bank has a rich history in serving the community with the prominent Laurel family of Batangas behind it. The rural bank’s geographic coverage is an important market for the overall business thrust of RCBC for its various products, including microfinance. RCBC plans to convert JP Laurel Bank, with its 10-branch network spread over Batangas, Laguna and Mindoro Occidental, into the Luzon base of its microfinance business operations. The Bank’s Board of Directors, in its meeting held dated March 16, 2009, has approved the purchase of 92,421,320 of RCBC common shares and 18,082,311 RCBC convertible preferred shares owned by the Spinnaker Group. The said shares will be lodged as Treasury shares for a temporary period not exceeding six (6) months. Also, the Board of Directors in its meeting held last March 2009, has approved that 41,993,389 RCBC common shares will be exchanged for a 5.64% equity stake in MICO Equities, Inc.

45
The Bank currently services its clients through its 324 business centers and extension offices and 380 ATMs nationwide. In 2008, the Bank introduced its cash card or pre-loaded card called RCBC My Wallet. The card itself is free and does not require any maintaining balance or membership fee. The RCBC My Wallet has scored a double victory when two big groups, namely, the UST Alumni Association and the OmniPrime Marketing Incorporated, the ticketing service provider of the MRT, has signed up for its services. This effectively opened an opportunity for the bank to reach to a huge untapped market like schools, utility companies and telecommunication companies. The RCBC MyWallet has won a Gold Quill Award of Merit from the International Association of Business Communicators (IABC) under its Economic, Social and Environmental Development Category. During the year, there were no known trends, demands, commitments, events or uncertainties that would have a material impact on the Bank’s liquidity. The Bank does not anticipate having within the next twelve (12) months any cash flow or liquidity problems. It is not in default or breach of any note, loan, lease or other indebtedness or financing arrangement. Further, there are no trade payables that have not been paid within the stated terms. To the knowledge and/or information of the Bank, there are no events that will trigger a direct or contingent financial obligation that is material to the company, including any default or acceleration of an obligation. There were no material off-balance sheet transactions, arrangements, obligations (including contingent obligations), and other relationships of the company with unconsolidated entities or other persons created during the reporting period. The 3.96% or P348.92 million decrease in net interest income from P8.819 billion in 2007 was due to the drop in spreads of peso and foreign currency denominated loans, financial market assets and credit card receivables. Representing 41.81% of gross revenues, the said drop in spreads were offset by the growth in interest earning assets, increase in traditional deposits and peso and foreign currency denominated loans. On the other hand, total interest expense increased by 10.41% as interest on deposits ballooned by 22.33% or P936 million while borrowings went down by 11.13% or P258 million. As previously mentioned, average interest rate in 2008 increased by 245 basis points year on year. Accounting for 77.31% of gross revenues is total interest income of P15.660 billion which is comprised mainly of interest income from loans and receivables and investment securities that representing 53.74% and 19.71%, respectively, of total income. At 35.49% of gross income, total interest expense of P7.189 billion consisted of interest on deposit liabilities and bills payable and other borrowings, representing 25.32% and 10.17% of gross revenues, respectively. Net income of P2.154 billion accounted for 10.63% of gross income. At 4.93% of gross revenues, provisioning for impairment losses of P998.49 million was 5.94% higher year on year from P942.49 million in 2007 attributable to management’s stance that the setting up of provision for losses should be sustained especially with the continued challenges facing the economy. To ensure that any possible write-down that may result from its exposure to Lehman Brothers is fully provided for, the Bank has allocated approximately P1.0 billion from its current excess reserves. This provisioning has no adverse effect on the Bank’s capital base. Other income of P4.597 billion accounted for 22.69% of gross income, mainly consisting of foreign exchange gains (losses)-net – 4.21%, service fees – 8.11% and commissions and other income – 9.89% of the total revenues. The 138.52% or P1.841 billion drop in trading and securities gain-net, was offset by the growth in foreign exchange gains (losses) net – 642.28% or

46
P1.009 billion, commissions and other income – 73.07% or P845.66 million, equity in earnings of associates - 14.88% or P52 million, trust fees - 11.45% or P21 million and service fees - 8.51% or P129 million. Other income went up by 4.93% from P4.381 billion. On the other hand, increase on foreign exchange gains was due to the depreciation of peso by 15.12% or P6.24 from P41.28 to P47.52 year on year. Operating expenses of P8.976 billion, representing 44.31% of gross income, was 9.89% or P807.95 million higher than the previous year of P8.168 billion. The 5.89% or P141 million increase in manpower costs from P2.384 billion was basically due to the impact of officers and CBA increases, contribution to retirement fund and the Merchant Bank manpower cost. The impact of soaring oil prices and uncertainties in both local and global economies has pushed prices and the costs of doing business upward. Hence, occupancy and equipment-related expenses moved up by 5.81% from P1.411 billion. Additionally, taxes and licenses and depreciation and amortization went up by 6.98% and 29.34%, respectively. With the continued thrust to provide new and improved products and services, investments in information technology are on going. Additionally, renovation and improvements of existing physical facilities are currently being undertaken. Hence, depreciation and amortization expenses were higher in 2008. Manpower costs, occupancy and equipment-related expenses and taxes and licenses represented 12.47%, 7.37%, and 5.64%, respectively, of total revenues. Miscellaneous operating expenses, representing 16.82% of gross revenues, went up by 14.00% on account of the continuous enhancements and/or improvements of the Bank’s communications and information technology infrastructure in support of its goals. Overall, operating costs during the year were effectively managed and controlled. At P919.42 million, provision for tax expense increased by 8.72%, or by P73.77 million, as a major portion of Bank’s revenues were subjected to final taxes withheld at source. Minority interest in net income went down to P19.36 million from P36.03 million as a result of the dilution of minority stockholders in one of the Bank’s majority-owned subsidiaries. Other than those stated earlier, in 2008, there were no known trends, events or uncertainties that have had or that are reasonably expected to have a material favorable or unfavorable impact on net revenues from continuing operations. Similarly, there were no significant elements of income or loss that did not arise from the Bank’s continuing operations. Lastly, there were no seasonal aspects that have a material effect on the financial condition or results of operation of the Bank. 2009. Philippine GDP in 2009 grew 0.9%, the lowest in 11 years (since 1998), vs. 3.8% in 2008. However, GDP growth in 4Q 2009 improved to a 1-year high of 1.8%, after the global economy recovered modestly from the worst recession since World War II. The Philippine economy still managed to grow, though at a relatively slow pace, better vs. other Southeast Asian economies that fell into recession (such as Thailand, Malaysia, and Singapore). GNP growth was more than halved to 3.0% vs. 6.2% in 2008. Inflation averaged 3.2% in 2009, among the lowest in 2 decades, vs. 9.3% in 2008, partly due to high base effects and slower demand due to the global economic recession. However, inflation started to pick up from the 22-year low of 0.1% posted in Aug. 2009, on low base effects and some pick up in the prices of some major global commodities such as oil, consistent with expectations that the worst of the global recession is over, to be followed by a relatively slow economic recovery. By Dec. 2009, inflation already reached an 8-month high of 4.4%.

47
The 91-Day Treasury Bill Rate ended 2009 at 3.89%, vs. 6.12% in end-2008, fundamentally consistent with lower inflation. The BSP reduced its key overnight interest rate to a record low of 4% since Jul. 2009, down by 2 percentage points from the high of 6% in Nov. 2008, consistent with the moves of other major global central banks in cutting key short-term interest rates to record lows, in an effort to stimulate their economies and counteract the adverse effects of the global recession. Consequently, key Philippine interest rates in the secondary market, as measured by the PDST yields, mostly lingered near record lows amid huge amounts of excess market liquidity. Low interest rate environment was maintained, despite the fact that the Budget Deficit widened to PHP298.5 billion (3.9% of GDP), the worst in 6 years, vs. PHP68.1 billion (0.9% of GDP) in 2008. The Peso Exchange Rate appreciated in 2009 by 1.32 Pesos or 2.8% to close at 46.20 vs. 47.52 in the previous year, less than the appreciation in other Southeast Asian currencies (such as the Indonesian rupiah, Thai baht). Philippine Gross International Reserves (GIR) reached a record high of US$44.2 billion or equivalent to 9 months worth of imports (nearly triple the 2000 level), partly due to increased foreign borrowings, higher foreign investments, double-digit growth in BPO revenues, and continued growth in OFW remittances. OFW Remittances for 2009 grew by 5.6% to US$17.3 billion, vs. the 13.7% growth posted in 2008, better than earlier expectations and defying the global economic recession. For the month of December 2009, OFW Remittances grew by 11.4%, the most in 15 months, to a record high of US$1.6bn. Exports declined by an average of -22% to US$38 billion in 2009, the worst in 6 years, vs. -2.5% in 2008. However, exports for the month of Dec. 2009 already grew by 24%, the most in more than 3 ½ years, as some major export markets emerged from recession. Imports fell by -24% to US$43 billion in 2009, the lowest in 6 years (since 2003), but already grew in Dec. 2009 by 18%, the most in 22 months, partly due to low base effects and consistent with the pickup in exports. Trade deficit for 2009 narrowed to –US$4.7 billion, compared to –US$7.7 billion in 2008, thereby translating to less outflows of foreign currency from the country. Performance Indicators RIZAL COMMERCIAL BANKING CORPORATION and SUBSIDIARIES
In Php Consolidated Parent Audited 2008 2009 2008 2009
Return on Average Assets (ROA)
0.87% 1.24% 0.56% 1.16%
Return on Average Equity (ROE)
7.40% 11.95% 3.50% 10.46%
BIS Capital Adequacy Ratio (CAR)
17.30%
18.47% 16.28% 17.23%
Non-Performing Loans (NPL) Ratio
2.42% 3.75% 2.54% 2.93%
Non-Performing Assets (NPA) 4.40% 5.68%
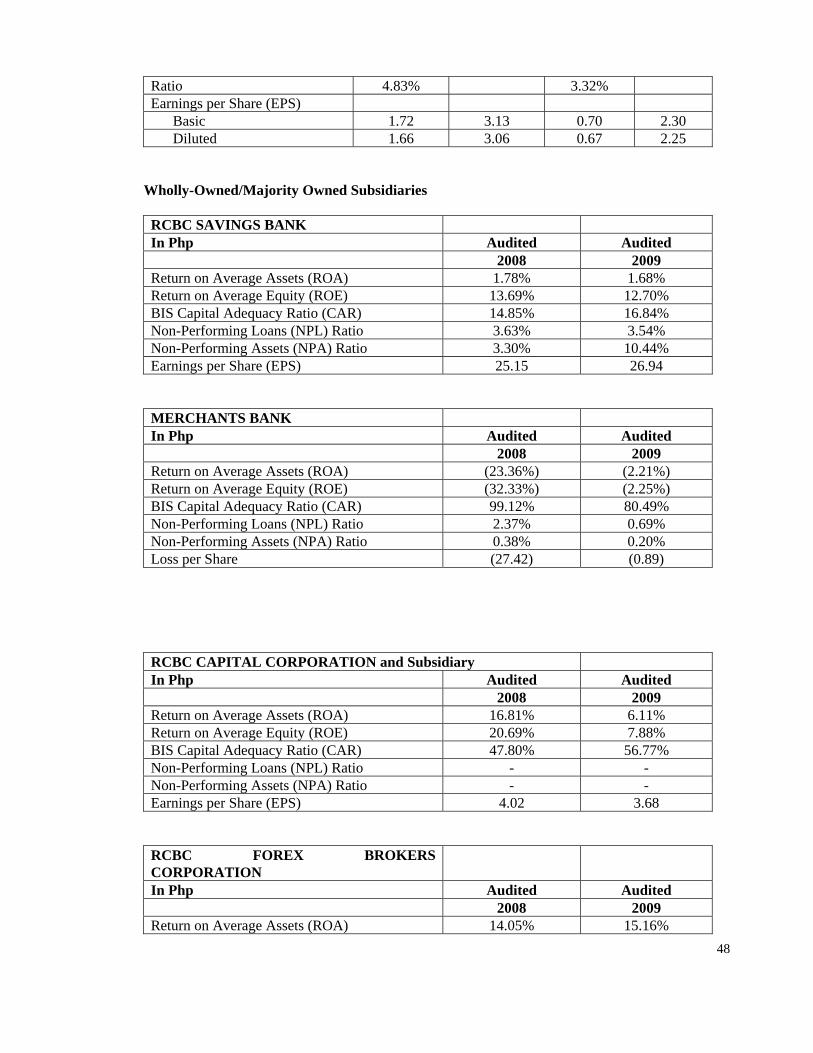
48
Ratio 4.83% 3.32% Earnings per Share (EPS) Basic 1.72 3.13 0.70 2.30 Diluted 1.66 3.06 0.67 2.25
Wholly-Owned/Majority Owned Subsidiaries RCBC SAVINGS BANK In Php Audited Audited 2008 2009 Return on Average Assets (ROA) 1.78% 1.68% Return on Average Equity (ROE) 13.69% 12.70% BIS Capital Adequacy Ratio (CAR) 14.85% 16.84% Non-Performing Loans (NPL) Ratio 3.63% 3.54% Non-Performing Assets (NPA) Ratio 3.30% 10.44% Earnings per Share (EPS) 25.15 26.94
MERCHANTS BANK In Php Audited Audited 2008 2009 Return on Average Assets (ROA) (23.36%) (2.21%) Return on Average Equity (ROE) (32.33%) (2.25%) BIS Capital Adequacy Ratio (CAR) 99.12% 80.49% Non-Performing Loans (NPL) Ratio 2.37% 0.69% Non-Performing Assets (NPA) Ratio 0.38% 0.20% Loss per Share (27.42) (0.89)
RCBC CAPITAL CORPORATION and Subsidiary In Php Audited Audited
2008 2009 Return on Average Assets (ROA) 16.81% 6.11% Return on Average Equity (ROE) 20.69% 7.88% BIS Capital Adequacy Ratio (CAR) 47.80% 56.77% Non-Performing Loans (NPL) Ratio - - Non-Performing Assets (NPA) Ratio - - Earnings per Share (EPS) 4.02 3.68
RCBC FOREX BROKERS CORPORATION
In Php Audited Audited 2008 2009
Return on Average Assets (ROA) 14.05% 15.16%

49
Return on Average Equity (ROE) 26.68% 28.40% Capital to Total Assets 43.61% 81.93% Non-Performing Loans (NPL) Ratio - - Non-Performing Assets (NPA) Ratio - - Earnings per Share (EPS) 118.99 121.17
RCBC INTERNATIONAL FINANCE, LTD. and Subsidiary In Php Audited Audited
2008 2009 Return on Average Assets (ROA) (2.77%) 1.97% Return on Average Equity (ROE) (2.98%) 2.07% Capital to Total Assets 92.22% 93.92% Non-Performing Loans (NPL) Ratio - - Non-Performing Assets (NPA) Ratio - - Earnings (Loss) per Share (2.05) 1.55
RCBCNORTH AMERICA, INC.
In Php Audited Audited 2008 2009
Return on Average Assets (ROA) (14.74%) (40.62%) Return on Average Equity (ROE) (56.86%) (211.99%) Capital to Total Assets 16.15% 9.13% Non-Performing Loans (NPL) Ratio - - Non-Performing Assets (NPA) Ratio - - Earnings (Loss) per Share (1.56) (68.55)
RCBC TELEMONEY EUROPE S.P.A In Php Audited Audited
2008 2009 Return on Average Assets (ROA) 6.82% (0.26%) Return on Average Equity (ROE) 44.06% (2.82%) Capital to Total Assets 11.95% 17.86% Non-Performing Loans (NPL) Ratio - - Non-Performing Assets (NPA) Ratio - - Earnings per Share (EPS) 228.03 (0.95)
BANKARD, INC. In Php Audited Audited 2008 2009 Return on Average Assets (ROA) 31.50% 15.27% Return on Average Equity (ROE) 45.52% 17.39% Capital to Total Assets 72.47% 90.08%

50
Non-Performing Loans (NPL) Ratio - - Non-Performing Assets (NPA) Ratio - - Earnings per Share (EPS) 0.18 51.63
JP LAUREL RURAL BANK, INC. In Php Audited Audited 2008 2009 Return on Average Assets (ROA) (20.23%) Return on Average Equity (ROE) 66.67% Capital to Total Assets (30.35%) Non-Performing Loans (NPL) Ratio 92.97% Non-Performing Assets (NPA) Ratio 90.81% Earnings per Share (EPS) -
NIYOG PROPERTY HOLDINGS, INC. In Php Audited Audited 2008 2009 Return on Average Assets (ROA) (0.40%) Return on Average Equity (ROE) (0.46%) Capital to Total Assets 87.02% Non-Performing Loans (NPL) Ratio - Non-Performing Assets (NPA) Ratio 98.73% Earnings per Share (EPS) (0.95)
Notes to the Computations: 1. Consolidated and Parent company ROA and ROE ratios were taken from the corresponding audited financial statements. ROA ratio of the
subsidiaries was determined based on the average of the quarterly ending balances of total assets, audited and/or unaudited. ROE ratio of the subsidiaries was likewise computed based on the average of the quarterly ending balances of total equity, audited and/or unaudited.
6. CAR covers combined credit, market and operational risks. Where the BIS CAR was not computed, the simple Capital to Total Assets ratio formula
was used.
7. NPL ratio is determined by using the following formula: (Total NPLs net of NPLs fully covered by allowance for losses) / (Total loan portfolio net of NPLs fully covered by allowance for losses).
8. NPA ratio is determined by using the following formula: (Net NPLs + Net ROPA) / Total Assets.
9. For some subsidiaries, the NPL/NPA ratios were not computed since these ratios were not applicable.
RCBC registered strong performance in 2009 with significant improvements in financial results and operations. RCBC showed growth in Assets of P20 billion to P289 billion and Deposits of P24 billion to P220 billion. Net Income grew to P3.33 billion in 2009 from P2.15 billion in 2008. Operating Income expanded by 24% to P16.2 billion. Net Interest Income increased by 21% or P1.8 billion to P10.3 billion as reflected by growth in the bank’s core loan business and an improvement in Net Interest Margin. Non-Interest Income’s growth of 28% was mainly due to Trading gains. Service fees, trust fees, and commissions and other Income, which totalled P3.0 billion, contributed 50% to total Non-Interest Income. Efficient operating cost management resulted in an improvement in the bank’s Cost to Income ratio from 69% to 61%.

51
RCBC’s final figures reflect the ongoing developments in the global economy. But as the Bank continues to strive with the challenges in the present economy, its goal to attract additional one million clients a year with the introduction of new products and services, expansion of the Bank’s network and brand-building, still remain. On the other hand, as a strong and major player in the remittance business with a wide presence overseas through remittance subsidiaries and tie-ups, the Bank will keep on tapping the country’s middle class, overseas Filipino workers (OFWs) and the small and medium enterprises (SMEs). Additionally, the Bank would continue to invest in technology and people as it persists in training its existing employees and hire more young, dedicated and competent people. RCBC continues to be in the market for well-managed mid-sized commercial banks and thrift banks which will enable the Bank to increase its resource base and expand its branch network and reach in a cost-efficient manner. Consolidated total resources grew by 7.55% to P288.516 billion at the end of 2009 for a P20.245 billion increase from the P268.270 billion in 2008. The P20.245 billion expansion in total assets was mainly due to the increase in trading and investment securities – 75.23%, bank premises, furniture, fixtures and equipment – 17.98%, deposits maintained with the Bangko Sentral – 17.88%, and other resources – 12.76%. This was offset, however, by the drop in, due from other banks – 36.92.%, investment properties – 31.42% and investments in subsidiaries and associates – 6.34%. Accounting for 6.70% of total assets, deposits with the Bangko Sentral went up by P2.930 billion mainly due to the increase in peso deposits. Total investment securities, which represents 22.79% of total resources, has grown by 40.49% comprising of financial assets at fair value through profit or loss (FVTPL) – 3.26%, Held-to-maturity investments (HTM) – 6.92% and Available for sale securities (AFS) – 12.61% of total resources. The huge rise in FVTPL and AFS of 173.95% (P5.979 billion) and 60.28% (P13.684 billion), respectively, was funded by the growth in deposits. Total net loans and other receivables amounting to P164.892 billion represented 57.15% of total resources. Bank premises, furniture, fixtures and equipment registered a 17.98% increase or P 724 million from P4.030 billion to P4.754 billion arising from the Bank’s aggressive branch expansion. In 2009, the Parent Bank opened fourteen (14) new business centers, deployed ninety one (91) new ATMs, and piloted foreign exchange booths and E-biz centers. The Bank has also completed its "computer refresh" program during the year wherein new personal computers were acquired to replace older less efficient units. Investment properties decreased from P7.388 billion to P5.067 billion, or by 31.42%. P2.70 billion was just reclassified to other resources. Without the reclassification, there was an increase of P379 million. Sources of funds came mainly from interest bearing liabilities that grew by 7.20% or P17.337 billion to P257.971 billion. Accrued taxes, interest, and other expenses payable increased by P462.398 million or 16.59%. Capital funds grew by 10.52% from P27.637 billion to P30.545 billion. Deposit liabilities at P220.278 billion grew by 12.26% from P196.227 billion. Peso and foreign currency-denominated deposits expanded and were used to fund the growth in investment

52
securities. The building of a strong sales culture across the Bank covering various deposit products and services launched to target not only niche clients but also potential clients with average incomes and those working and living overseas contributed to the substantial growth in deposits. Accordingly, savings and time deposits went up by 23.55% and 5.77% respectively. Bills payable declined by 49.75% from P21.453 billion to P10.781 billion. On April 2, 2009, the BSP approved the issuance of P4.0Bn Lower Tier 2 Unsecured Subordinated Notes which were successfully issued on May 15, 2009 bearing a coupon rate of 7.75%. The notes have a maturity of 10 years, with a call option at the end of the fifth year and subject to a step-up interest rate feature. The Bank may redeem the notes in whole, but not in part, at 100% of the principal plus accrued and unpaid interest at the end of the fifth year, subject to BSP approval. On October 27, 2009, the two series of Lower Tier 2 Unsecured Subordinated Notes worth a total of P11.0Bn were listed in the Philippine Dealing and Exchange Corporation. As a result of the new issuance, Subordinated Debt rose by 57.41% or P3.985 billion from P6.942 billion to P10.927 billion. Total liabilities accounted for 89.41% of total resources. At 76.35% of total assets, total deposit liabilities continued to be the Bank’s main source of funding, particularly savings and time deposits which comprised 32.43% and 40.09% of total resources, respectively. Surplus account increased by 22.28% from P7.626 billion to P9.325 billion, spurred by the growth in the Bank’s consolidated net income by 54.54% from P2.154 billion in 2008 to P3.328 billion in 2009. This growth was achieved despite the cash dividend payments to common and preferred shareholders in the total amount of P314.670 million and dividends/interest payment on hybrid tier 1 securities of P471.161 million. Total Capital funds attributable to parent company shareholders amounted to P30.549 billion at year-end 2009, higher by 10.36% or P2.868 billion from last year’s P27.681 billion. Minority interest improved by 90.32% from negative P44.271 million to negative P4.287 million mainly due to profitable operations of the subsidiaries during the year. In relation to the strategy towards microfinance business, the RCBC Board of Directors, in its special meeting held on February 11, 2009, has approved the establishment of a P375.0 million shareholder advance facility which will be infused over a three (3)-year period from 2009-2011 in relation to the acquisition by RCBC of JP Laurel Rural Bank. The decision will take effect upon the final approval by the Monetary Board of the terms of the agreement in line with the BSP’s program encouraging the creation of stronger banks for a more stable banking system. This is one of the first major steps taken by RCBC to enter the microfinance business and assist in the development of small businesses. The rural bank’s geographic coverage is an important market for the overall business thrust of RCBC for its various products, including microfinance. RCBC plans to convert JP Laurel Bank, with its 10-branch network spread over Batangas, Laguna and Mindoro Occidental, into the Luzon base of its microfinance business operations. The BSP approved the Bank’s acquisition of JPL on May 14, 2009. On March 13, 2009, the Bank purchased 92,421,320 RCBC common shares and 18,082,311 convertible preferred shares of Spinnaker Group.
On 01 September 2009, the Bank received 725,923,568 votes in favor of the proposal for the re-issuance of 41,993,389 RCBC Treasury Shares in exchange for a 5.64% equity stake in MICO
53
Equities, Inc. The said votes represented 77.368% of the outstanding 870,421,715 common shares and 67,851,213 preferred shares entitled to vote as of record date 30 June 2009. The share swap was booked by the Bank on September 30, 2009. During the year, there were no known trends, demands, commitments, events or uncertainties that would have a material impact on the Bank’s liquidity. The Bank does not anticipate having within the next twelve (12) months any cash flow or liquidity problems. It is not in default or breach of any note, loan, lease or other indebtedness or financing arrangement. Further, there are no trade payables that have not been paid within the stated terms. To the knowledge and/or information of the Bank, there are no events that will trigger a direct or contingent financial obligation that is material to the company, including any default or acceleration of an obligation. There were no material off-balance sheet transactions, arrangements, obligations (including contingent obligations), and other relationships of the company with unconsolidated entities or other persons created during the reporting period. The 21.22% or P1.798 billion increase in net interest income from P8.470 billion in 2008 to P10.268 billion in 2009 was due to the rise in spreads of peso and foreign currency denominated loans, financial market assets and credit card receivables. Representing 45.32% of gross revenues, the said rise in spreads were aided by the growth in interest earning assets and increase in traditional deposits. On the other hand, total interest expense decreased by 9.56% as interest on deposits declined by 8.04% or P412 million while borrowings went down by 13.33% or P275 million. The benchmark 91-d Tbill average in 2009 decreased by 44 basis points year on year from 4.68% in 2008 to 4.24% in 2009. Accounting for 74.02% of gross revenues is total interest income of P16.770 billion which is comprised mainly of interest income from loans and receivables and investment securities that representing 53.45% and 17.48%, respectively, of total income. At 28.70% of gross income, total interest expense of P6.502 billion consisted of interest on deposit liabilities and bills payable and other borrowings, representing 20.82% and 7.88% of gross revenues, respectively. Net income of P3.328 billion accounted for 14.69% of gross income. At 9.90% of gross revenues, provisioning for impairment losses of P2.243 billion was 124.66% higher year on year from P998.492 million in 2008 attributable to management’s stance that the setting up of provision for losses should be sustained especially with the continued uncertainties facing the economy. Other income of P5.886 billion accounted for 25.98% of gross income, mainly consisting of trading and securities gain-net – 9.94%, foreign exchange gains (losses)-net – 2.18%, service fees – 7.12% and commissions and other income – 5.02% of the total revenues. The 540.05% or P2.765 billion increase in trading and securities gain-net, was offset by the decline in foreign exchange gains (losses) net – 42.05% or P358.245 million, commissions and other income – 43.19% or P865.029 million, trust fees - 12.07% or P24.866 million, service fees - 1.81% or P29.743 million, and equity in net earnings of associate – 48.82% or P197.335 million. Total other income went up by 28.05% or P1.290 billion from P4.597 billion. Operating expenses of P9.831 billion, representing 43.39% of gross income, was 9.52% or P854.940 million higher than the previous year of P8.976 billion. The 10.07% or P254 million increase in manpower costs from P2.525 billion was basically due to the impact of officers and CBA increases amounting to P3.52 million and additional manpower mainly for the new business centers. Occupancy and equipment-related expenses moved up by 10.61% from P1.493 billion to

54
P1.651 billion as a result of business expansion and computer equipment upgrade. Additionally, taxes and licenses and depreciation and amortization went up by 6.67% and 30.87%, respectively. With the continued thrust to provide new and improved products and services, investments in information technology are on-going. Additionally, renovation and improvements of existing physical facilities done in 2009 resulted in higher depreciation and amortization expenses. Manpower costs, occupancy and equipment-related expenses and taxes and licenses represented 12.27%, 7.29%, and 5.38%, respectively, of total revenues. Miscellaneous operating expenses, representing 16.10% of gross revenues, reached P3.647 billion. Overall, operating costs during the year were effectively managed and controlled. At P744.42 million, provision for tax expense decreased by 19.03%, or by P175 million, mainly due to the reduction in tax rate in 2009 from 35% to 30%. Minority interest in net income went down from P19.365 million to P7.32 million as a result of lower net income of one of the Bank’s not wholly owned subsidiaries. Other than those stated earlier, in 2009, there were no known trends, events or uncertainties that have had or that are reasonably expected to have a material favorable or unfavorable impact on net revenues from continuing operations. Similarly, there were no significant elements of income or loss that did not arise from the Bank’s continuing operations. Lastly, there were no seasonal aspects that have a material effect on the financial condition or results of operation of the Bank. Item 7. Financial Statements
The consolidated financial statements and schedules listed in the accompanying Index to Financial Statements and Supplementary Schedules are filed as part of this Form 17-A.
Item 8. Information on Independent Accountant and other Related Matters External Audit Fees and Services. The Audit Committee is empowered to appoint the external auditor of the Bank and pre-approve all auditing and non-audit services. It recommends to the Board the selection of external auditor considering independence and effectiveness and recommends the fees to be paid. For the audit of the Bank’s annual financial statements and services provided in connection with statutory and regulatory filings or engagements, the aggregate amount to be billed/billed, excluding out-of pocket expenses, by its independent accountant amounts/amounted to P4.535 million and P2.15 million for 2009 and 2008, respectively. Additionally, approximately P4.9 million was paid for other services rendered by the independent accountant in 2009. Changes in and Disagreements With Accountants on Accounting and Financial Disclosure. In connection with the audits of the Bank’s financial statements for the two (2) most recent years

55
ended December 31, 2009 and 2008, there were no disagreements with Punongbayan and Araullo on any matter of accounting principles or practices, financial statement disclosures, audit scope or procedure except for the effects on the financial statements of the Group and the Parent Company for the applicable years described in the Basis for Qualified Opinion section of the Report of the Independent Auditors dated March 29, 2010 which is incorporated as part of this report.
PART III - CONTROL AND COMPENSATION INFORMATION
Item 9. Directors and Executive Officers of the Issuer
The names, ages, citizenship and present positions of all directors are as follows:
Regular Directors Sec Alfonso T. Yuchengco, 87, Filipino is the Bank’s Honorary Chairman. He is also Chairman and Chief Executive Officer of the Bank’s major stockholder, Pan Malayan and the Honorary Chairman of the Board of MICO Equities, Inc. (the holding company of the Malayan Group of Insurance Companies) (“MICO Equities”) and other YGC companies. Secretary Yuchengco is presently the Presidential Adviser on Foreign Affairs, which holds a cabinet rank. He has served as Philippine Ambassador to the People’s Republic of China, Ambassador Extraordinary Plenipotentiary of the Philippines to Japan, and Presidential Special Envoy to Greater China, Japan and Korea. He also served as the Philippines’ Permanent Representative to the United Nations with the rank of Ambassador from 2001 to 2002. He was the first recipient of the Order of Lakandula with the rank of Bayani (Grand Cross) presented by President Gloria Macapagal-Arroyo. Secre tary Yuchengco was the first Asian to be elected to the Insurance Hall of Fame by the International Insurance Society, Inc. He graduated from Far Eastern University with a Bachelor of Science degree in Commerce and completed his graduate studies at Columbia University, New York, USA. He holds several Honorary Doctorate Degrees from universities in the Philippines, Japan and the United States. Ms. Helen Y. Dee, 65, Filipino, is the Bank’s Chairperson. Ms. Dee is also the Chairperson and President of Hydee Management & Resource Corporation and House of Investments. She also holds Chairmanship position in various companies, including Landev Corporation, Hi-Eisai Pharmaceutical Inc., Mapua Information Technology Center, Inc. and Manila Memorial Park. She is the Vice Chairperson of Pan Malayan. She likewise holds directorship positions in Philippine Long Distance Telephone Company, Petro Energy Resources Corp., Great Life Financial Assurance Corporation (formerly Nippon Life Insurance Co. of the Phils.), Malayan Insurance and MICO Equities. Ms. Dee is a Trustee of the Mapua Institute of Technology and the Yuchengco Center. She graduated from Assumption College with a Bachelor of Science degree in Commerce and completed her Masters in Business Administration at De La Salle University. Mr. Lorenzo V. Tan, 48 Filipino, is the Bank’s President and Chief Executive Officer. He is

56
also an Independent Director of Smart Communications, Inc. He is also the Vice-Chairman of RCBC Savings Bank, Director of Bankard, Inc., Great Pacific Life Corporation and Independent Director of Morphs Lab, Inc. Before joining the Bank, Mr. Tan was the President and Chief Executive Officer of Sun Life of Canada (Phils.), Inc., President and Chief Executive Officer of Philippine National Bank, President and Chief Operating Officer of United Coconut Planters Bank, and Group Managing Director of Guoco Holdings (Phils.), Inc. He also held various positions in Citibank N.A. from 1987 to 1995. He graduated from De La Salle University with a Bachelor of Science degree in Commerce. He earned his Master of Management degree from the J.L. Kellog Graduate School of Management in Evanston, Illinois, USA. He is a Certified Public Accountant in the United States and the Philippines. Mr. Cesar E. A. Virata, 79, Filipino, has been a Director since 1995, Corporate Vice Chairman since June 2000 and Senior Adviser from 2007. He is also the Chairman and President of C. Virata and Associates, Inc., Management Consultants. Concurrently, he is a Director and/or Chairman of various companies, such as RCBC Savings Bank, RCBC Capital, RCBC Forex Brokers Corporation, RCBC Realty, RCBC Land, Malayan Insurance, Great Life, Business World Publishing Corporation, Belle Corporation, Coastal Road Corporation, Luisita Industrial Park Corporation, Manila Electric Company, Pacific Fund Inc., Mapua Institute of Technology, Bankard, AY Foundation, Inc. and YGC Corporate Services, Inc. (“YGC Corporate Services”). Mr. Virata has held positions in the Philippine government, including Prime Minister, Secretary/Minister of Finance, Chairman of the Committee on Finance of the Batasan Pambansa (National Assembly) and member of the Monetary Board. He was also Chairman of the Land Bank of the Philippines. He has served as Governor for the Philippines to the World Bank, the Asian Development Bank and the International Fund for Agriculture Development. He was Chairman of the Development Committee of the World Bank and International Monetary Fund from 1976 to 1980 and Chairman of the Board of Governors of the Asian Development Bank. Prior to his Government positions, he was a Professor and Dean of the College of Business Administration of the University of the Philippines and Principal, SyCip Gorres Velayo & Company, Management Services Division. Mr. Virata graduated from the University of the Philippines with degrees in Mechanical Engineering and Business Administration (Cum Laude). He earned his Masters in Business Administration from the Wharton Graduate School, University of Pennsylvania. Mr. Rizalino S. Navarro, 71, Filipino, has been a Director of the Bank since 1999 and a Senior Adviser from 2007. He was the Bank’s Executive Vice Chairman and Chief Executive Officer from 2004 to 2007. Currently, he is Chairman (Non-Executive) of Clark Development Corp. and Member of the Subic-Clark Area Development Council. He is also Chairman of EEI Corporation, Seafront Resources Corporation, Petroenergy Corporation (“Petroenergy”), Bankard, and a Director of Grepalife, Mapua Institute of Technology, House of Investments, Malayan Insurance, YGC Corporate Services, and Upline Food Corporation. He has held various positions in the government including that of Secretary of Trade and Industry and member of the Monetary Board. Mr. Navarro graduated from the University of the East with a Bachelor of Science degree in Business Administration. He received his Masters in Business Administration from Harvard Business School. Atty. Teodoro D. Regala, 76, Filipino, has been a Director of the Bank since 1999 and a Member of the Trust Committee since 2000. He is the Founding & Senior Partner and a member of the Executive Committee of Angara Abello Concepcion Regala & Cruz Law Offices. He is a Director

57
of Bankard, Malayan Insurance, Datacraft Communications Systems, Inc., Datacraft Opsis Inc., MICO Equities, Safeway Philtech, Inc., and Director and Corporate Secretary of OEP Philippines, Inc and Republic Asahi Realty Corporation. He graduated from the University of the Philippines (Cum Laude) with a Bachelor of Laws degree and took his Masters of Law at Harvard University. Atty. Wilfrido E. Sanchez, 72, Filipino, has been a Director of the Bank since 2006. He is a Tax Counsel at Quiason Makalintal Barot Torres & Ibarra Law Offices. He also holds the position of director in Adventure International Tours, Inc., Amon Trading Corp., Center for Leadership & Change, Inc., Dolphin Ship Management, Inc., EEI Corporation, Grepalife Asset Management Corp., Grepalife Fixed Income Fund Corp., HI, and Universal Robina Corporation, among others. He graduated from Ateneo de Manila University with a Bachelor of Laws degree and completed his Master of Laws at Yale University. Mr. Reynaldo B. Vea, 58, Filipino, is currently the President and Chief Executive Officer of Mapua Institute of Technology, President of Mapua Information Technology Center, Malayan High School of Science,and Malayan Colleges Laguna. He also holds directorship position in Wirelesspace, Inc., and Grepalife Fixed Income Fund. Mr. Vea graduated from the University of the Philippines with Bachelor’s Degree in Mechanical Engineering. He earned his Master’s Degree in Naval Architecture and Marine Engineering at the Massachusetts Institute of Technology, and Doctorate Degree in Engineering at University of California at Berkeley. Ms. Yvonne S. Yuchengco, 56, Filipino, joined RCBC in 1989, establishing the Private Banking Unit and heading the General Services and Purchasing Department while handling public relations for the bank. She was the main proponent behind the Bank’s RCBC Dragon campaign and the award-winning crusade to save the country’s freshwater resources. She was appointed president of Malayan Insurance Company, Inc. and MICO Equities in 1995, positions she still holds at present. In recognition of her involvement in various social causes, she was appointed chair of the National Advisory Board of the Presidential Commission for the Urban Poor by President Fidel Ramos. She currently chairs The First Nationwide Assurance Corporation, and sits as a Director of AY Foundation; Honda Cars QC and Kalookan; Manila Memorial Park, Inc. & Grepalife. Atty. Ma. Celia H. Fernandez-Estavillo, 38, Filipino, is the Bank’s Director, Corporate Secretary and Senior Vice President and Head—Legal & Regulatory Affairs Group. She is also a Director and Corporate Secretary in Luisita Industrial Park, Philippine Integrated Advertising Agency, Averon Holdings, Inc., RCBC Capital, and Bankard and is a Trustee of Mapua Institute of Technology and Yuchengco Center. Before joining RCBC, she was the Assistant Vice President for Global Business Development at ABS-CBN Broadcasting Corp., and Chief of Staff at the Office of Senator Edgardo J. Angara. She graduated from the University of the Philippines with a Bachelor of Science in Business Economics (Summa Cum Laude). She also graduated from the same university with a Bachelor of Laws degree (Cum Laude). She earned her Master of Laws (LL.M) in Corporate Law (Cum Laude) from New York University School of Law. She received the highest score in the Philippine Bar examinations of 1997. Independent Directors Atty. Teodoro Q. Peña, 77, Filipino has served as an Independent Director of the Bank since 2002

58
and Director from 1995 to 2002.. He is also an Independent Director of RCBC Securities, Malayan Zurich Insurance Co. Inc, Bankard and RCBC Capital. He is also Chairman of the Bank’s Audit Committee and Personnel & Evaluation Review Committee He is also Chairman of the Bank’s Audit Committee and Personnel & Evaluation Review Committee He is also the Chairman of the Audit Committees of RCBC Savings Bank and EEI Corporation respectively. He holds various positions in Philippine Constitution Association, Palawan State University, Educators Inc. and the Institute of Corporate Directors. He graduated from the University of the Philippines with a Bachelor of Laws degree and received a Master of Laws at Yale University. Mr. Roberto F. de Ocampo, 64, Filipino, has served as an Independent Director of the Bank since 2006. He also holds various Chairmanship and/or Directorship positions with other companies as well. Prior to his current position with the Bank, he was the President of the Asian Institute of Management. He also became Advisory Board Member of Metropolitan Bank & Trust Co. and Director of ABS-CBN Broadcasting, Inc. He also held various positions in the government, including Secretary of Finance, Chairman of the Cabinet Cluster on Macro- Economy, and Chairman of the Committee on Privatization and Fiscal Incentives Review Board. He graduated from Ateneo de Manila University with a Bachelor of Arts degree in Economics. He earned his Masters in Business Administration from the University of Michigan. Mr. Francisco C. Eizmendi, Jr., 73, Filipino, is an Independent Director of the Bank. Prior to assuming this position, he was a member of the Bank’s Advisory Board. Mr. Eizmendi, Jr. is the Chairman of Dearborn Motor Co., and Advisory Board Member of East West Seed. He is also an Independent Director at RCBC Forex and Makati Finance Corporation and Trustee at the Institute of Corporate Directors. He served as President and Chief Operating Officer of San Miguel Corporation from 1987 to 2002. He graduated from the University of Sto. Tomas with a Bachelor of Science degree in Chemical Engineering. Mr. Armando M. Medina, 59, Filipino, is a member of various board committees of the Bank, including the Executive Committee, Trust Committee, and Risk Management Committee He is also an Independent Director of RCBC Capital, RCBC Savings Bank, First Malayan Leasing & Finance Corporation, RCBC Forex and Great Pacific Life Financial Assurance Corporation. He graduated from De La Salle University with a Bachelor of Arts degree in Commerce and Economics and a Bachelor of Science in Commerce—Major in Accounting. Mr. Antonio L. Alindogan, Jr., 70, Filipino, holds directorship position on various companies including House of Investments, C55, Inc., An-Cor Holdings, Inc., Philippines Airlines and PAL Holdings, Inc. among others. Prior to his assumption as director of the Bank, Mr. Alindogan was a member of the Monetary Board of the Bangko Sentral ng Pilipinas. He graduated as Magna Cum Laude from the De La Salle College with a degree of Bachelor of Science degree in Accounting. Executive Officers The names, ages and positions of the Bank’s executive officers are as follows: Executive Vice-Presidents

59
Redentor C. Bancod, (Filipino) 46, Executive Vice President and Concurrent Head of the Operations and IT Shared Services Groups. Previously, he was Vice President & General Manager, Central Systems Asia of Sun Life Financial, Asia and Senior Vice President and Chief Technology Officer of Sun Life Of Canada (Philippines) Inc. from October 2003 to 2007, Senior Vice President & Chief Information Officer of Equitable PCI Bank from July 1996 to September 2003, Assistant Vice President and Head of Applications Development in Far East Bank from October 1993 to June 1996, Assistant Vice President of Regional Operations, Asia Pacific, of Sequel Concepts, Inc. USA/Ayala Systems Technology Inc. from November 1992 to September 1993, Project Manager in Union Bank of Switzerland, NA from April 1988 to November 1992 and Chief Designer and Technical Advisor in Computer Information System Inc. from March 1984 to April 1998. Alfredo S. Del Rosario, Jr., (Filipino) 54, Executive Vice President, is the Head of the Asset Management and Remedial Group. He was the Head of the Overseas Filipino Banking Group from March 2007 to September 2008 and Head of the Commercial Banking Group from May 2006 to February 2007. Prior to joining the Bank, Mr. Del Rosario worked for AB Capital and Investment Corporation as Senior Vice President, Trust and Investment Division Head, and Information Technology Division Head (from Jan 2000 to May 2006). He also held directorship positions in AB Capital Securities, Inc., Stock Transfer Services, Inc., Araullo University, AB Card Corporation and Asianbank Corporation. Furthermore, Mr. Del Rosario previously worked for Global Business Bank as Senior Vice President and Branch Banking Group Head, AsianBank as Senior Vice President and Branch Banking Division and as Senior Vice President, Human Resources and Administration Division, Bank of America as Vice President, Human Resources, and for Philippine Airlines, FNCB Finance and the Ayala Group of Companies. Jose Emmanuel U. Hilado, (Filipino) 45, Executive Vice President, is the Bank’s Treasurer and Head of Treasury Group. Prior to joining RCBC, he was SVP and Head of Trading and Investments of Banco de Oro Unibank from July 2007 to September 2008. He also served as SVP/Treasurer of BDO Private Bank from September 2003 to June 2007. Prior to this, he held various positions in Equitable PCIBank, and Far East Bank and Trust Company. Ismael R. Sandig, (Filipino) 56, Executive Vice President, is the Head of RBG. He was a Senior Consultant and Assistant to the President from 2005 to 2006 at East West Bank Corporation. He also joined Philippine National Bank from 2001 to 2005, where his last appointment was as Retail Banking Sector Head and concurrent Consumer Finance Sector Head. He held various positions in Retail Banking in Union Bank of the Philippines, PCI Bank and Insular Bank of Asia and America. Uy Chun Bing G., (Filipino) 57, Executive Vice President, is the Head of Corporate Banking Group, formerly the Corporate Business Development Group, a position he has held since 1 Jan 1997. He is also a Director of the Financial Brokers’ Insurance Agency. Previously, Mr. Uy was the Head of the Bank’s Binondo Branch and Area Supervisor for Binondo as Senior Vice President (1989 to 1996), First Vice President (1988 to 1989), Vice President (1987 to 1988) and the Head of the Divisoria Branch as Vice President (1982 to 1987) and Assistant Vice President (1980 to 1982). Elbert M. Zosa, (Filipino) 62, Executive Vice President, has been the Head of the Bank’s Corporate Planning Group since April 2006. He was formerly Head of Strategic Planning of

60
Equitable PCI Bank with responsibility over Corporate Planning and Corporate Communications. He also served in other capacities such as Head of International Services Group where he spearheaded the development of its remittance business and coordinated its foreign offices. He also served as Area Head for Marketing and Operations of some branches. He obtained his Master of Business Administration from the Wharton School, University of Pennsylvania. First Senior Vice-Presidents Melissa G. Adalia, (Filipino) 57, is the Head of the Human Resources Group. Prior to joining the Bank, Ms. Adalia was Head of Human Resources for Asia United Bank from March 2001 to April 2006, ABN Amro Bank from 1999 to 2000, Great Pacific Bank in 1999, Bank of America Savings Bank, Dai-Ichi Group of Companies and SM Shoemart. Manuel G. Ahyong Jr., (Filipino) 48, is the current Head of the Wealth Management Segment 2 (Makati). Prior to joining the Bank in 2006, he was a Senior Vice President of Pramerica Financial, Director in Societe Generale, Vice President of Deutsche Bank, AG; Deputy Manager and Head for Private Banking of Banque Indosuez; and Director for Private Banking of American Express Bank. Michael O. de Jesus, (Filipino) 50, , is the current Segment Head of Corporate Banking 2. He has a Bachelor of Arts degree in Economics from Union College in Schenectady, New York and a Masters in Business Administration (Finance) from The Wharton School, University of Pennsylvania. John Thomas G. Deveras, (Filipino) 47, is Head of Strategic Initiatives. Prior to joining the Bank in May 2007, he was an Investment Officer at International Finance Corporation. He also worked for PNB Capital and Investment Corporation as President, and Senior Vice President in PNB Corporate Finance. He holds a degree in Bachelor of Science degree in Management Engineering from Ateneo de Manila University and earned his Masters Business Administration from the University of Chicago. Rommel S. Latinazo, (Filipino) 50, is the Head of the Corporate Banking Segment 1 under the CBG. He joined the Bank in 2000 as First Vice President. Previously, he held various positions in Solidbank Corporation, Standard Chartered Bank, CityTrust Banking Corporation, First Pacific Capital Corporation and Philamlife Insurance Company. Ana Luisa S. Lim, (Filipino) 50, heads the Internal Audit Division of the Bank. She is also a Director and Corporate Secretary of BEAMExchange, Inc. She joined the Bank in 2000 primarily to implement the risk-based audit approach under a shared-services set-up in conformity with the Bank’s strategic risk management initiatives. Ms. Lim is a Certified Public Accountant, Certified Information Systems Auditor and Certified Internal Auditor. Cynthia P. Santos, (Filipino) 56, is the Head of the Overseas Filipino Banking/TeleMoney Group. Prior to this position, Ms. Santos was the Head of the Corporate Planning Group and its Chief Information Officer. She started with RCBC as the Bank Economist.

61
Edgar B. Villanueva (Filipino), 47, is the Head of Global Transactional Services. Work experience includes Business Development Manager/Vice-President of Bank of America from 2006 to 2009, Head of Client Management for North America for ABN AMRO Bank NV from 2004 to 2009, among others. He earned his Bachelor’s Degree in Business Economics from De La Salle University and Master’s Degree in Business Administration from J.L. Kellog Graduate School of Management in Illinois. Senior Vice-Presidents Marcelo E. Ayes, (Filipino) 57, , is the Head of Treasury’s Financial Institution Management Division (FIMD). Prior to joining the Bank, Mr. Ayes was First Vice President and Chief Dealer and Head of the Proprietary Trading Division at Equitable PCI Bank from 2001 to September 2006, and Head of the Treasury Marketing and Product Development Group from 1998 to 2001. Mr. Ayes also held various positions in the Philippine National Bank from 1978 to 1997, including a four-year term in Singapore and a five-and-a half-year term in Hong Kong. Angelito C. Cruz, (Filipino), 60, is currently the Segment Head of Japan Desk/Ecozone. He graduated from University of the East with a degree in Business Administration. Rafael Aloysius M. Dayrit (Filipino) 53, is the Bank's Chief Credit Officer and Head of the Credit Risk Division. He graduated from the University of the Philippines with a Bachelors of Science in Agribusiness and Masters in Business Administration. He was a fellow of the Hubert H. Humphrey scholarship program in Agricultural Economics at the University of California, Davis, USA. Mr. Dayrit is currently a Director of the Professional Risk Managers International Association (PRMIA Philippine Chapter), a non-profit professional association of risk practitioners with members in 190 countries. Prior to joining RCBC, he has worked in three other universal banks, namely, Solidbank, UCPB, and Union Bank primarily in the fields of account management and credit. Siony C. Dy Tang, (Filipino) 56, is currently the Head of Chinese Banking Division 1 of the CBG. She has been with the Bank since 1973. Ma. Celia H. Fernandez-Estavillo, (Filipino), 38, the Bank’s Director, Corporate Secretary and Senior Vice President and Head—Legal & Regulatory Affairs Group. She is also a Director and Corporate Secretary in Luisita Industrial Park, Philippine Integrated Advertising Agency, Averon Holdings, Inc., RCBC Capital, and Bankard and is a Trustee of Mapua Institute of Technology and Yuchengco Center. Before joining RCBC, she was the Assistant Vice President for Global Business Development at ABS-CBN Broadcasting Corp., and Chief of Staff at the Office of Senator Edgardo J. Angara. She graduated from the University of the Philippines with a Bachelor of Science in Business Economics (Summa Cum Laude). She also graduated from the same university with a Bachelor of Laws degree (Cum Laude). She earned her Master of Laws (LL.M) in Corporate Law (Cum Laude) from New York University School of Law. She received the highest score in the Philippine Bar examinations of 1997.

62
Lourdes Bernadette M. Ferrer, (Filipino) 51, is currently the Head of Trust and Investments. Prior to joining the Bank on 1 September 2000, she held various related positions in Solidbank Corporation and the International Corporate Bank. She graduated from the University of the Philippines with a Bachelor of Science degree in Statistics and likewise obtained her Master’s Degree in Business Administration from the same university. Prudencio J. Gesta, (Filipino), 57, is the Regional Sales Manager for Visayas Region composed of 39 branches and 1 ext office. He has been with the bank for 35 years and has held various positions in operations and sales prior to his appointment as RSM in 2008. He finished his Branch Officer's Training Program in 1978 at HO and has attended various seminars and trainings in Sales, Core Credits and Operations. He graduated from St. Paul University in Surigao City with a Bachelor of Science in Commerce major in Accounting (with special academic award as Cum Laude). He is quite active in various local NGOs and professional organizations and recently a member of the Board of Trustees of Cebu Chamber of Commerce and as its VP Finance and Administration serving his 2nd term. He was Past President of Cebu Bankers Club in 2002 and Tacloban Bankers Club in 1986, Past President of Financial Executives of Cebu in 2003 and Past Area Governor for Leyte Samar Area of Lions Club Intl. in 1991. Jose P. Ledesma III, (Filipino), 58, is the Division Head for South Metro Manila Region. He is also the Treasurer/ Director of Nile Agro Industrial Corporation, President of Bacolod Boys Home Foundation, Treasurer of Welcome Home Foundation, Inc., Finance Council Member of the Diocese of Bacolod. Also a Member of the Negros Edconomic Development Foundation and an Independent Director of the Dungganon Bank (an NGO Thrift Bank owned by Negros Women for Tomorrow). He is likewise a Member of the Metro Bacolod Chamber of Commerce & Industry, a Board of Trustees of St. Joseph's High School- La Salle, Vice-President/Board of Trustees of USLS Graduate School Foundation and a Board of Trustees of the De La Salle Philippines. He graduated from the University of St. La Salle in Bacolod City with the degree of AB Commerce Major in Economics and Management. He earned his Masters in Business Administration and his Doctoral (PhD. Major in Business Administration) at the same university on 1995 and 2005 respectively. He was awarded with an Academic Excellence Award in his Doctoral for receiving the highest GPA. Eli D. Lao, (Filipino) 53, is the Head of Chinese Banking Segment under the CBG since 2000. He has been with the Bank since 1978, holding various positions. Regino V. Magno, (Filipino) 51, is the Bank’s Chief Risk Officer and Head of Corporate Risk Management Services (CRISMS). Prior to joining RCBC, he was the Chief Risk Officer of Sterling Bank of Asia from August 2007 to December 2008.He was a Market Risk Consultant of Chase Cooper, a London-based consulting firm; Chief Risk Officer of Philippine National Bank for four years; a Consultant of Philippine Deposit Insurance Corporation for a year; and a Senior Risk Manager at the Bank of the Philippine Islands for four years. He held various positions in CityTrust Banking Corporation. Remedios M. Maranan, (Filipino),50, graduated from the Polytechnic University of the Philippines with a degree of B.S. Accountancy. She has been with the Bank for more than 20 years. She currently a Regional Service Head for Metro Manila.

63
Yasuhiro Matsumoto,(Japanese) 49, is the Head of CBG’s Japanese Business Relationship Office since April 2006. Prior to this, he worked for The Bank of Tokyo-Mitsubishi UFJ, Ltd. since 1984, when the bank was named The Sanwa Bank, Ltd. He has also previously served as a Director of RCBC. Reynaldo P. Orsolino, (Filipino) 50, is the Head of the SME Division. Prior to joining the Bank, he served as Senior Vice President in Philippine National Bank from June 2003 to July 2007, and previously held senior positions at the Planters Development Bank, Asian Banking Corporation, and the Land Bank of the Philippines. He holds a degree in Bachelor of Arts degree in Economics from the University of the Philippines. Ma. Lourdes Jocelyn S. Pineda, (Filipino), 54, is currently the Head of Microfinance of RCBC. She brings with her 14 years of experience in the microfinance business, involving design and set-up of microfinance loan operation, product development, and training of Lending Officers in individual lending methodology. She has worked with Accion International/Accion Technical Advisors India as Principal Microfinance Advisor/ Senior Director and Chemonics International/Microenterprise Access to Banking Services (US AID project) as Regional Manager and Coordinator from August 2005 to March 2007. Most of the Directors and executive officers mentioned above have held their positions for at least five (5) years. Officers with the rank of Assistant Vice President and above are appointed annually by the Board of Directors in its Organizational Board Meeting right after the Stockholders Meeting which is held annually every last Monday of June. There are no binding contracts or arrangements with regard to the tenure of the Bank’s executive officers. There is no person other than the entire human resources as a whole, and the executive officers who are expected to make a significant contribution to the Bank. Sec. Alfonso T. Yuchengco is the father of Ms. Helen Y. Dee and Ms. Yvonne S. Yuchengco. Other than such relationship, none of the Bank’s Directors are related to one another or to any of the Bank’s executive officers. To the knowledge and/or information of the Bank, the present members of the Board of Directors and its executive officers are not, presently or during the last five (5) years, involved or have been involved in any legal proceeding adversely affecting/involving themselves and/or their property before any court of law or administrative body in the Philippines or elsewhere. To the knowledge and/or information of the Bank, the said persons have not been convicted by final judgment of any offense punishable by the laws of the Republic of the Philippines or of the laws of any other nation/country.

64
Item 10. Executive Compensation Information as to the aggregate compensation paid or accrued during the last three fiscal years to the Bank’s Chief Executive Officer and four other most highly compensated executive officers follows: Chief Executive Officer and four most highly compensated executive officers. (In Thousand Pesos)
Names
Principal Position
Year
Aggregate Compensation
(net of bonuses)
Bonuses Lorenzo V. Tan Redentor C. Bancod Uy Chun Bing Jose Emmanuel U. Hilado Ismael R. Sandig
President & Chief Executive Officer Executive Vice President Executive Vice President Executive Vice President Executive Vice President
2010
35,779
7,495
Lorenzo V. Tan Redentor C. Bancod Uy Chun Bing Jose Emmanuel U. Hilado Ismael R. Sandig
President & Chief Executive Officer Executive Vice President Executive Vice President Executive Vice President Executive Vice President
2009
35,077
8,135
Lorenzo V. Tan Redentor C. Bancod Uy Chun Bing Ernesto P. Pinpin Ismael R. Sandig
President & Chief Executive Officer Executive Vice President Executive Vice President Executive Vice President Executive Vice
2008
31,703
6,370
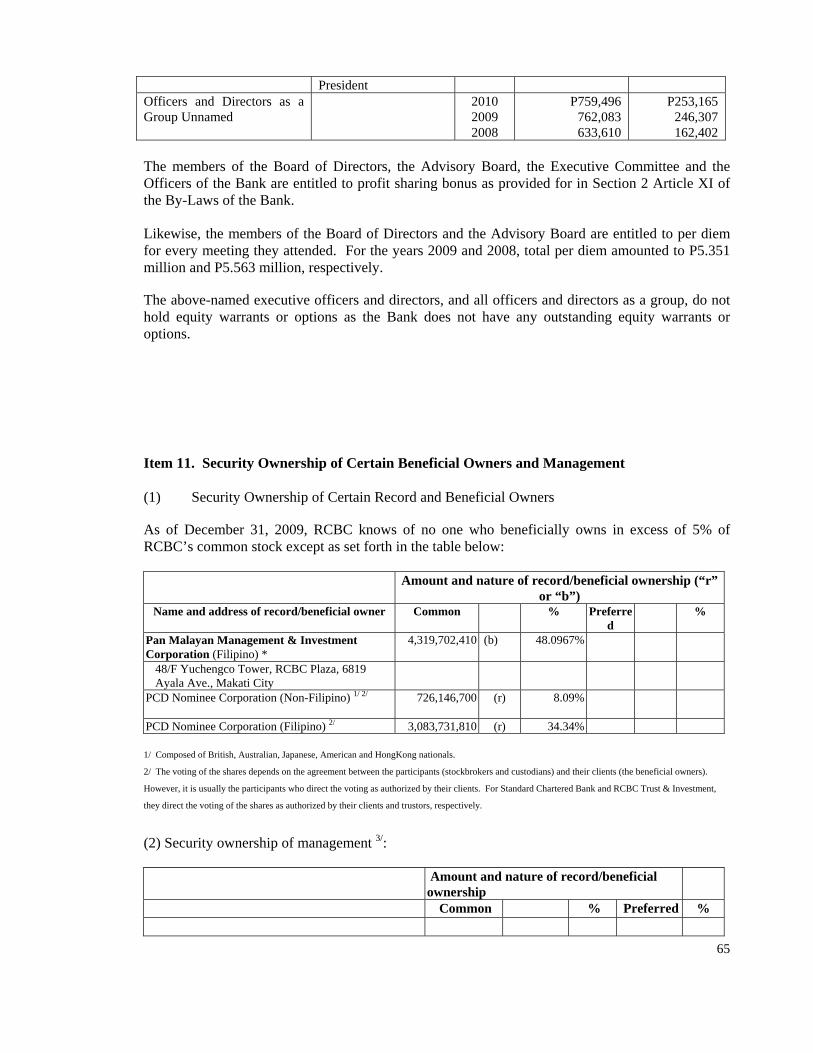
65
President Officers and Directors as a Group Unnamed
2010 2009 2008
P759,496 762,083 633,610
P253,165 246,307 162,402
The members of the Board of Directors, the Advisory Board, the Executive Committee and the Officers of the Bank are entitled to profit sharing bonus as provided for in Section 2 Article XI of the By-Laws of the Bank. Likewise, the members of the Board of Directors and the Advisory Board are entitled to per diem for every meeting they attended. For the years 2009 and 2008, total per diem amounted to P5.351 million and P5.563 million, respectively. The above-named executive officers and directors, and all officers and directors as a group, do not hold equity warrants or options as the Bank does not have any outstanding equity warrants or options. Item 11. Security Ownership of Certain Beneficial Owners and Management (1) Security Ownership of Certain Record and Beneficial Owners As of December 31, 2009, RCBC knows of no one who beneficially owns in excess of 5% of RCBC’s common stock except as set forth in the table below:
Amount and nature of record/beneficial ownership (“r”
or “b”) Name and address of record/beneficial owner Common % Preferre
d %
Pan Malayan Management & Investment Corporation (Filipino) *
4,319,702,410 (b) 48.0967%
48/F Yuchengco Tower, RCBC Plaza, 6819 Ayala Ave., Makati City
PCD Nominee Corporation (Non-Filipino) 1/ 2/ 726,146,700 (r) 8.09%
PCD Nominee Corporation (Filipino) 2/ 3,083,731,810 (r) 34.34%
1/ Composed of British, Australian, Japanese, American and HongKong nationals.
2/ The voting of the shares depends on the agreement between the participants (stockbrokers and custodians) and their clients (the beneficial owners).
However, it is usually the participants who direct the voting as authorized by their clients. For Standard Chartered Bank and RCBC Trust & Investment,
they direct the voting of the shares as authorized by their clients and trustors, respectively.
(2) Security ownership of management 3/:
Amount and nature of record/beneficial ownership
Common % Preferred %

66
Alfonso T. Yuchengco (Filipino) 39,970 voting 0.00 Helen Y. Dee (Filipino) 4,380 voting 0.00
Pan Malayan Management & Investment Corporation (Beneficial Owner: Helen Y. Dee, Filipino)
135,712,510 voting 1.51
Hydee Management & Resource Corporatio (Beneficial Owner: Helen Y. Dee, Filipino)
19,238,190 voting 0.21
Rizalino S. Navarro (Filipino) 2,608,660 voting 0.03 Cesar E. A. Virata (Filipino) (Direct) 1,670 voting 0.00
(Indirect) 500,000 voting 0.00 Lorenzo V. Tan (Filipino) 50 voting 0.00 Teodoro D. Regala (Filipino) (Direct) 10 voting 0.00
(Indirect) 20,000 0.00 Wilfrido E. Sanchez (Filipino) (Direct) 10 voting 0.00
(Indirect) 300,000 0.00 Yvonne S. Yuchengco (Filipino) (Direct) (Indirect)
1040,000
Voting 0.00 0.00
Armando M. Medina (Filipino) (Indirect) 1,950 Voting 0.00 Reynaldo B. Vea (Filipino) (Direct) 10 Voting 0.00 Ma. Celia H. Fernandez-Estavillo (Filipino) (Direct) 180 voting 0.00 Teodoro Q. Peña (Filipino) (Indirect)
1,11030,780
voting 0.00
Francisco C. Eizmendi, Jr. (Filipino) 10 voting 0.00 Roberto F. de Ocampo (Filipino) 10 voting 0.00 Antonino L. Alindogan, Jr. (Filipino) 10 voting 0.00 Uy Chun Bing (Filipino) (Direct) 31,700 voting 0.00
(Indirect) 1,120,000 voting 0.01 Alfredo G. Del Rosario (Filipino) (Indirect) 209,000 voting 0.00 Eli D. Lao (Filipino) (Indirect) 73,370 voting 0.00 Rommel S. Latinazo (Filipino) (Indirect) 74,000 voting 0.00 Elbert M. Zosa (Filipino) (Indirect) 100,000 voting 0.00
Total 160,107,590 1.76 3/ There are no additional shares which the listed beneficial or record owners have the right to acquire within thirty (30) days, from options,
warrants, rights, conversion privilege or similar obligations, or otherwise.
The aggregate number of shares owned of record by all directors and executive officers as a group named herein as of December 31, 2009 is 160,107,590.00 common shares or approximately 1.76% of the Bank’s outstanding common shares. Other than the above-named persons or groups holding more than 5% of the Bank’s outstanding common stock, there are no other persons that hold more than 5% of any class of stock under a voting trust or similar agreement. There are also no arrangements, existing or otherwise, which may result in a change in control of the Bank.

67
Item 12. Certain Relationships and Related Transactions The Bank is a member of the Yuchengco Group of Companies (YGC). The Yuchengco family, primarily through Pan Malayan Management and Investment Corporation, is the largest shareholder, and as of December 31, 2009 owned 431,970,241 shares, or approximately 48.10% of the Bank’s issued and outstanding common shares. The Bank and its subsidiaries, in the ordinary course of business, engage in transactions with the YGC and its subsidiaries. The Bank’s policy with respect to related party transactions is to ensure that these transactions are entered into on terms comparable to those available from unrelated third parties. The law firm of Angara Abello Concepcion Regala & Cruz (ACCRA) Law Office is among the firms engaged by the Bank to render legal services. Atty. Teodoro Dy-Liaco Regala, Board Member, is a Senior Partner of ACCRA Law Office. During the year, the Company paid ACCRA legal fees that the Company believes to be reasonable for the services provided. The Bank, as Lessor, entered into lease contracts with Great Pacific Life Assurance Corporation (GPL) and Malayan Insurance Co. Inc. (MICO) for the lease of office spaces. As Lessee, the Bank has existing lease contracts with GPL for the lease of its Buendia Avenue, Makati City and Fuente Osmeña branch offices. Amb. Alfonso T. Yuchengco is a Director of GPL and the Honorary Chairman of MICO Group. Ms. Helen Y. Dee and Messrs. Navarro, Virata and Regala are also directors of MICO. Ms. Helen Y. Dee, together with Mr. Navarro, is a member of the Board of Directors of GPL. The Bank is also a lessee of the RCBC Realty Corporation (RRC) which it directly owns 25%. Additionally, through its equity holdings in RCBC Land Inc., it indirectly owns 9.8% of RRC. RCBC Land Inc., 49% owned by the Bank, owns 20% of RRC, the owner and developer of the RCBC Plaza Building complex in which the Bank’s head office is located. In the ordinary course of business, the Bank has loan and other transactions with its subsidiaries and affiliates, and with certain directors, officers, stockholders and related interests (DOSRI). Under existing policies of the Bank, these loans are on commercial, arm’s length terms, i.e., substantially on the same terms as loans to other individuals and businesses of comparable risks. For cost effectiveness and cost-savings, the Bank entered into a Memorandum of Agreement (MOA) with House of Investments, Inc. (HI), a member of the YGC, for procurement outsourcing. Under the agreement, HI was the Bank’s sole representative in negotiating the terms of the contracts with selected suppliers or service providers for the procurement of certain IT related and non-IT related items. The agreement stipulated that HI would not charge fees for its service except for its share in the savings generated from suppliers and service providers. Moreover, HI was obligated to ensure that contracts they initiated do not prejudice the Bank in any way and that the Bank does not pay more than the cost of buying the items without aggregation.

68
In December 2006, Bankard and RCBC entered into a services agreement wherein RCBC outsourced the servicing of the credit card business to Bankard. These services include card acquisition and marketing services, verification and approval services and collection services. Transactions under the agreement are carried out on a “cost plus” basis whereby Bankard receives a premium above the costs that it expends to conduct its services. In December 2007, RCBC Land transferred 25% of its equity holdings in RCBC Realty Corporation to RCBC in partial settlement of its outstanding loan with the Bank. In October 2009, RCBC entered into a joint development agreement with RCBC Savings Bank, MICO, Grepalife and Bankard for the development of the RSB Corporate Centre located at Bonifacio Global City. Pursuant to this agreement, RCBC will obtain ownership and possession of certain floors in the RSB Corporate Centre building which it will use as office space for some of its business units. The Bank’s other transactions with affiliates include leasing office premises to subsidiaries, availment of computer services of an affiliate and regular banking transactions (including purchases and sales of trading account securities, securing insurance coverage on loans and property risks and intercompany advances), all of which are conducted in the ordinary course of business. The Bank does not have any transactions with promoters within the past five (5) years.
PART IV - CORPORATE GOVERNANCE
Item 13. Performance Evaluation System RCBC is committed to the ideals of good corporate governance. In compliance with the SEC Code of Corporate Governance, the Bank has adopted an Evaluation System to measure the performance of the Chief Excecutive Officer (CEO), Board of Directors and senior management on an annual basis. This Evaluation System was based on the basic principles of transparency, accountability and fairness/equity. The Bank has adopted fit and proper standards on key personnel taking into consideration their integrity, technical expertise, education, diligence, and experience or training. Corporate governance rules/principles were established to ensure that the interest of stakeholders are always taken into account; that directors, officers and employees are conducting business in a safe and sound manner; and that transactions entered into between the Bank and related interests are conducted at arm’s length basis and in the regular course of business. The Bank has sufficient number of independent directors that gives the assurance of independent views and perspective. Likewise, independent functions of internal audit, the compliance office, and the risk management unit lend comfort to stakeholders, including the regulators, of Bank’s commitment to the principles and practices of good corporate governance. Based on the latest annual performance evaluation made in Jan 2010 relative to year 2009 using a self-assessment checklist, the Bank is generally in compliance with the leading practices and principles on good corporate governance for the year 2009. A certification to that effect was submitted to the Securities and Exchange Commission (SEC), the Philippine Stock Exchange (PSE)

69
and the Philippine Dealing and Exchange Corporation (PDEx) on Jan 25, 2010. No major findings were noted.
PART V - EXHIBITS AND SCHEDULES
Item 14. Exhibits and Reports on SEC Form 17-C (a) Exhibits - See accompanying Index to Exhibits The following exhibit is filed as a separate section of this report: (18) Subsidiaries of the Registrant The other exhibits, as indicated in the Index to Exhibits are either not applicable to the Company or require no answer.
(b) Reports on SEC Form 17-C Reports under SEC Form 17-C (Current Reports) that were filed during the last six months covered by this report: 12.14.09 – Item 9. Other Events Please be advised that the Board of Directors, in its special meeting, approved the proposed 2010 Budget of RCBC. 12.10.09 – Item 9. Other Events
Please be informed a total of 392 RCBC Preferred shares of Antonio Alipio were converted to RCBC Common shares at the rate of 2.3542 Preferred shares to 1 Common share per written request of the said stockholder. A total of 166 common shares (net of fractional shares) were issued on December 09, 2009 as a result of the said conversion. 12.01.09 – Item 9. Other Events Please be informed that the Board of Directors, in its regular meeting, approved the amendments to Bank’s Manual of Corporate Governance, pursuant to the requirements of the Securities and Exchange Commission. 11.11.09 – Item 9. Other Events Please be informed that the Board of Directors, in its special meeting, approved the recommendation for RCBC to sell to Great Pacific life Assurance Corporation (“Grepalife”) its

70
1,000,000 shares in Great Life Financial Assurance Corporation (“Great Life; formerly Nippon Life Insurance Company of the Philippines, Inc”), thereby confirming, approving and ratifying all Management’s actions relative to the same. The said shares represent 20% of the total outstanding shares of Great Life Financial Assurance Corporation 10.09.09 – Item 9. Other Events Please be informed that a total of 4,319 RCBC Preferred shares of Fortunato F. Young were converted to RCBC Common shares at the rate of 2.3542 Preferred Shares to 1 Common Share per written assent of the said stockholder. A total of 1,834 common shares (net of fractional shares) were issued on October 07, 2009 as a result of the said conversion. 08.07.09 – Item 9. Other Events Please be advised that the Board of Directors, in its special meeting, approved the extension of deadline for submission of written assent of shareholders from 26 August 2009 to 01 September 2009 on connection with the proposal for the re-issuance of RCBC Treasury shares in exchange for shares of stocks of MICO Equities, Inc. 07.27.09 – Item 9. Other Events The Board of Directors, in its regular meeting, approved the appointment of Mr. Edgar B. Villanueva as Head of Global Transaction Services with the rank of First Senior Vice President, subject to the final confirmation of Monetary Board of the Bangko Sentral ng Pilipinas. Mr. Villanueva brings with him 20 years of experience in commercial and transaction banking with a track record of increasing respnsibility in a variety of challenging roles in business development, operations, change management, client services, cash management, electronic banking, and trade services, among others. He has worked with the following institutions:
1. Bank of America (formerly LaSalle Bank) as Vice President / Business Development Manager from 2006 to 2009;
2. ABN AMRO Bank N.V. as Director / Client Management Head for North America Global Client Operations from 2004 – 2006;
3. Chase Manhattan Bank as Vice President / Business Manager and Trust Manager for Capital Markets Fiduciary Services from 1997 – 2000. 07.13.09 – Item 9. Other Events Please be informed that the Board of Directors, in its special meeting resolved to seek the written assent of the shareholders for the issuance of Treasury Shares in exchange for the shares of stock of MICO Equities, Inc., and fixed the following pertinent dates in connection therewith: Record Date July 30, 2009 Deadline for Shareholder Assent August 26, 2009


72
RIZAL COMMERCIAL BANKING CORPORATION
INDEX TO FINANCIAL STATEMENTS AND SUPPLEMENTARY SCHEDULES
FORM 17-A, Item 7 Consolidated Financial Statements Page No. Statement of Management’s Responsibility for Financial Statements 73
Report of Independent Public Accountants 75 Statements of Condition as of December 31, 2009 and 2008 78 Statements of Income for the years ended December 31, 2009, 2008 and 2007 79 Statements of Changes in Capital Funds for the years ended December 31, 2009, 2008 and 2007 80 Statements of Comprehensive Income for the years ended December 31, 2009, 2008 and 2007 82 Statements of Cash Flows for the years ended December 31, 2009, 2008 and 2007 83 Notes to Financial Statements 85
Supplementary Schedules
Report of Independent Public Accountants on Supplementary Schedules
A. Marketable Securities - (Current Marketable Equity Securities and Other Short-Term Cash Investments) * B. Amounts Receivable from Directors, Officers, Employees, Related Parties and Principal Stockholders (Other than Affiliates) 198 C. Non-Current Marketable Equity Securities, Other Long-Term Investments, and Other Investments * D. Indebtedness to Unconsolidated Subsidiaries and Affiliates * E. Property, Plant and Equipment * F. Accumulated Depreciation * G. Intangible Assets - Other Assets * H. Long-Term Debt * I. Guarantees of Securities of Other Issuers * K. Capital Stock *
Supplementary Schedule to Parent Financial Statements (SEC Circular 11) Reconciliation of Parent Company Retained Earnings for Dividend Declaration. 200 __________ * These schedules, which are required by paragraph 4 (e) of SRC Rule 68, have been omitted because
they are either not required, not applicable or the information required to be presented is included in the Company’s financial statements or the notes to financial statements.


Notes 2009 2008 2009 2008
CASH AND OTHER CASH ITEMS 7 6,811,443 P 6,807,939 P 5,408,491 P 5,595,736 P
DUE FROM BANGKO SENTRAL NG PILIPINAS 7 19,321,339 16,390,973 17,914,204 15,656,119
DUE FROM OTHER BANKS 7 3,066,922 4,862,225 1,788,841 3,197,593
INVESTMENT SECURITIES
Financial assets at fair value through profit or loss 8 9,415,889 3,437,138 8,034,236 3,084,380
Held-to-maturity investments 9 19,962,360 20,673,614 17,638,584 17,892,114
Available-for-sale securities - net 10 36,384,430 22,700,044 32,260,486 21,077,161
LOANS AND RECEIVABLES - Net 11 164,892,417 164,402,907 131,733,336 130,292,206
INVESTMENTS IN SUBSIDIARIES AND ASSOCIATES - Net 12 4,021,767 4,294,182 10,700,809 10,311,051
BANK PREMISES, FURNITURE, FIXTURES
AND EQUIPMENT - Net 13 4,754,121 4,029,769 3,382,627 3,037,628
INVESTMENT PROPERTY - Net 14 5,066,543 7,387,613 2,873,265 3,500,460
DEFERRED TAX ASSETS - Net 28 1,408,302 1,391,709 1,389,497 1,389,497
OTHER RESOURCES - Net 15 13,410,044 11,892,093 9,475,346 10,817,548
TOTAL RESOURCES 288,515,577 P 268,270,206 P 242,599,722 P 225,851,493 P
DEPOSIT LIABILITIES 17
Demand 11,034,257 P 11,125,069 P 8,535,205 P 8,392,524 P
Savings 93,571,654 75,738,446 81,165,706 66,269,393
Time 115,671,983 109,363,471 90,852,468 84,267,161
Total Deposit Liabilities 220,277,894 196,226,986 180,553,379 158,929,078
BILLS PAYABLE 18 10,780,964 21,452,609 10,535,173 21,410,087
BONDS PAYABLE 19 5,836,076 6,002,821 5,836,076 6,002,821
ACCRUED TAXES, INTEREST AND OTHER EXPENSES 20 3,249,854 2,787,456 2,326,142 1,976,052
OTHER LIABILITIES 21 6,898,896 7,221,711 5,889,579 5,957,810
SUBORDINATED DEBT 22 10,926,978 6,941,899 10,926,978 6,941,899
Total Liabilities 257,970,662 240,633,482 216,067,327 201,217,747
CAPITAL FUNDS
Attributable to Parent Company Shareholders
Preferred stock 23 207,038 859,335 207,038 859,335
Treasury shares 23 952,709 )( - 952,709 )( -
Common stock 23 9,905,508 9,628,430 9,905,508 9,628,430
Hybrid perpetual securities 24 4,883,139 4,883,139 4,883,139 4,883,139
Capital paid in excess of par 23 6,039,794 5,571,906 6,039,794 5,571,906
Revaluation reserves on available-for-sale securities 407,015 1,568,758 )( 456,007 1,351,022 )(
Revaluation increment in property of an associate 12 58,917 28,243 - -
Accumulated translation adjustment . 97,771 83,889 - -
Reserve for trust business 29 285,724 276,973 278,775 270,024
Other reserves 12 240,889 )( 240,889 )( - -
Share in additional paid-in capital of an associate 12 532,583 532,583 - -
Surplus 23 9,325,311 7,626,144 5,714,843 4,771,934
30,549,202 27,680,995 26,532,395 24,633,746
Non-controlling interest 4,287 )( 44,271 )( - -
Total Capital Funds 30,544,915 27,636,724 26,532,395 24,633,746
TOTAL LIABILITIES AND CAPITAL FUNDS 288,515,577 P 268,270,206 P 242,599,722 P 225,851,493 P
See Notes to Financial Statements.
RIZAL COMMERCIAL BANKING CORPORATION AND SUBSIDIARIES
STATEMENTS OF FINANCIAL POSITION
DECEMBER 31, 2009 AND 2008
LIABILITIES AND CAPITAL FUNDS
RESOURCES
CONSOLIDATED PARENT
(Amounts in Thousand Philippine Pesos)

Notes 2009 2008 2007 2009 2008 2007
INTEREST INCOME ON
Loans and receivables 11 12,109,348 P 10,885,349 P 9,583,739 P 8,347,262 P 7,365,395 P 6,369,342 P
Investment securities 8,9,10 3,959,516 3,991,885 4,917,942 3,448,859 3,735,538 4,614,971
Others 7 701,361 782,398 828,726 642,873 683,548 694,513
16,770,225 15,659,632 15,330,407 12,438,994 11,784,481 11,678,826
INTEREST EXPENSE ON
Deposit liabilities 17 4,716,435 5,128,787 4,192,593 3,347,079 3,772,306 2,952,030
Bills payable and other borrowings 18 1,785,958 2,060,697 2,318,741 1,752,383 2,032,540 2,287,019
6,502,393 7,189,484 6,511,334 5,099,462 5,804,846 5,239,049
NET INTEREST INCOME 10,267,832 8,470,148 8,819,073 7,339,532 5,979,635 6,439,777
IMPAIRMENT LOSSES - Net 11, 16 2,243,192 998,492 942,490 1,683,463 830,597 680,535
NET INTEREST INCOME AFTER
IMPAIRMENT LOSSES 8,024,640 7,471,656 7,876,583 5,656,069 5,149,038 5,759,242
OTHER OPERATING INCOME
Trading and securities gains (losses) - net 8 2,252,821 511,946 )( 1,329,128 1,902,230 612,623 )( 1,007,936
Service fees 1,613,652 1,643,395 1,514,472 902,197 1,045,435 1,032,985
Foreign exchange gains (losses) - net 493,716 851,961 157,107 )( 383,834 715,623 250,627 )(
Equity in net earnings of associates 12 206,857 404,192 351,842 - - -
Trust fees 181,153 206,019 184,849 167,918 186,419 164,212
Commissions and other income 1,138,030 2,003,059 1,157,399 1,236,976 1,814,650 907,704
5,886,229 4,596,680 4,380,583 4,593,155 3,149,504 2,862,210
OTHER OPERATING EXPENSES
Employee benefits 25 2,779,236 2,524,956 2,384,398 1,864,571 1,682,187 1,640,155
Occupancy and equipment-related 26 1,651,224 1,492,784 1,410,766 1,348,043 1,150,968 1,107,099
Taxes and licenses 28 1,219,775 1,143,463 1,068,856 912,063 849,633 768,967
Depreciation and amortization 13 533,797 407,881 315,366 377,126 288,499 224,570
Miscellaneous 27 3,646,715 3,406,723 2,988,471 2,656,267 2,588,221 2,397,935
9,830,747 8,975,807 8,167,857 7,158,070 6,559,508 6,138,726
PROFIT BEFORE TAX 4,080,122 3,092,529 4,089,309 3,091,154 1,739,034 2,482,726
TAX EXPENSE 28 744,420 919,424 845,650 519,030 568,720 543,376
NET PROFIT 3,335,702 2,173,105 3,243,659 2,572,124 1,170,314 1,939,350
NET PROFIT ATTRIBUTABLE
TO NON-CONTROLLING INTEREST 7,320 19,365 36,027 - - -
NET PROFIT ATTRIBUTABLE TO PARENT
COMPANY'S SHAREHOLDERS 3,328,382 P 2,153,740 P 3,207,632 P 2,572,124 P 1,170,314 P 1,939,350 P
Earnings Per Share* 32
Basic 3.13 P 1.72 P 2.93 P 2.30 P 0.70 P 1.53 P
Diluted 3.06 P 1.66 P 2.84 P 2.25 P 0.67 P 1.48 P
* After giving retroactive effect to the 15% stock dividends issued in 2007 (see Note 23).
See Notes to Financial Statements.
RIZAL COMMERCIAL BANKING CORPORATION AND SUBSIDIARIES
STATEMENTS OF INCOME
FOR THE YEARS ENDED DECEMBER 31, 2009, 2008 AND 2007
(Amounts in Thousand Philippine Pesos, Except Per Share Data)
CONSOLIDATED PARENT

Notes 2009 2008 2007 2009 2008 2007
ATTRIBUTABLE TO PARENT COMPANY SHAREHOLDERS
PREFERRED STOCK
Balance at beginning of year 859,335 P 859,512 P 1,054,940 P 859,335 P 859,512 P 1,054,940 P
Conversion of preferred stock to common stock 652,297 )( 177 )( 195,428 )( 652,297 )( 177 )( 195,428 )(
Balance at end of year 23 207,038 859,335 859,512 207,038 859,335 859,512
TREASURY SHARES
Purchase of treasury shares during the year 1,594,925 )( - - 1,594,925 )( - -
Reissuance of treasury shares during the year 642,216 - - 642,216 - -
Balance at the end of year 23 952,709 )( - - 952,709 )( - -
COMMON STOCK
Balance at beginning of year 9,628,430 9,628,369 6,329,640 9,628,430 9,628,369 6,329,640
Conversion of preferred stock to common stock 277,078 61 104,598 277,078 61 104,598
Issuance of common stock - - 2,100,000 - - 2,100,000
Stock dividends - - 1,094,131 - - 1,094,131
Balance at end of year 23 9,905,508 9,628,430 9,628,369 9,905,508 9,628,430 9,628,369
CAPITAL PAID IN EXCESS OF PAR
Balance at beginning of year 5,571,906 5,571,793 2,118,688 5,571,906 5,571,793 2,118,688
Conversion of preferred stock to common stock 375,219 113 90,830 375,219 113 90,830
Excess of consideration given over cost of treasury shares reissued 23 92,669 - - 92,669 - -
Issuance of common stock 23 - - 3,362,275 - - 3,362,275
Balance at end of year 6,039,794 5,571,906 5,571,793 6,039,794 5,571,906 5,571,793
HYBRID PERPETUAL SECURITIES 24 4,883,139 4,883,139 4,883,139 4,883,139 4,883,139 4,883,139
REVALUATION RESERVES ON AVAILABLE-FOR-SALE SECURITIES
Balance at beginning of year 1,568,758 )( 1,032,344 2,907,648 1,351,022 )( 977,649 2,747,231
Fair value gains (losses) on available-for-sale securities, net of tax 10 1,975,773 2,601,102 )( 1,875,304 )( 1,807,029 2,328,671 )( 1,769,582 )(
Balance at end of year 407,015 1,568,758 )( 1,032,344 456,007 1,351,022 )( 977,649
REVALUATION INCREMENT IN PROPERTY OF AN ASSOCIATE
Balance at beginning of year 28,243 7,014 7,014 - - -
Increase during the year 30,674 21,229 - - - -
Balance at end of year 12 58,917 28,243 7,014 - - -
ATTRIBUTABLE TO
PARENT COMPANY SHAREHOLDERS (Carried Forward) 20,548,702 P 19,402,295 P 21,982,171 P 20,538,777 P 19,591,788 P 21,920,462 P
CONSOLIDATED PARENT
RIZAL COMMERCIAL BANKING CORPORATION AND SUBSIDIARIESSTATEMENTS OF CHANGES IN CAPITAL FUNDS
FOR THE YEARS ENDED DECEMBER 31, 2009, 2008 AND 2007(Amounts in Thousand Philippine Pesos)

Notes 2009 2008 2007 2009 2008 2007
ATTRIBUTABLE TO
PARENT COMPANY SHAREHOLDERS (Brought Forward) 20,548,702 P 19,402,295 P 21,982,171 P 20,538,777 P 19,591,788 P 21,920,462 P
ACCUMULATED TRANSLATION ADJUSTMENTS
Balance at beginning of year 83,889 63,937 144,572 - - -
Translation adjustment during the year 13,882 19,952 80,635 )( - - -
Balance at end of year 97,771 83,889 63,937 - - -
RESERVE FOR TRUST BUSINESS
Balance at beginning of year 276,973 258,348 247,595 270,024 258,348 247,595
Transfer from surplus free 8,751 18,625 10,753 8,751 11,676 10,753
Balance at end of year 29 285,724 276,973 258,348 278,775 270,024 258,348
OTHER RESERVES 12 240,889 )( 240,889 )( - - - -
SHARE IN ADDITIONAL PAID-IN CAPITAL OF AN ASSOCIATE 12 532,583 532,583 532,583 - - -
SURPLUS
Balance at beginning of year 7,626,144 6,495,022 5,448,793 4,771,934 4,617,289 4,839,342
Net profit for the year 3,328,382 2,153,740 3,207,632 2,572,124 1,170,314 1,939,350
Cash dividends 23 785,831 )( 1,003,993 )( 1,056,519 )( 785,831 )( 1,003,993 )( 1,056,519 )(
Amortization of deferred charges 11, 15 834,633 )( - - 834,633 )( - -
Transfer to reserve for trust business 29 8,751 )( 18,625 )( 10,753 )( 8,751 )( 11,676 )( 10,753 )(
Stock dividends 23 - - 1,094,131 )( - - 1,094,131 )(
Balance at end of year 9,325,311 7,626,144 6,495,022 5,714,843 4,771,934 4,617,289
ATTRIBUTABLE TO
PARENT COMPANY SHAREHOLDERS 30,549,202 27,680,995 29,332,061 26,532,395 24,633,746 26,796,099
NON-CONTROLLING INTEREST
Balance at beginning of year 44,271 )( 311,669 )( 282,699 )( - - -
Increase in non-controlling interest due to acquisition of a new subsidiary 32,795 12,585 - - - -
Net profit for the year 7,320 19,365 36,027 - - -
Fair value gains on available-for-sale securities, net of tax 10 131 )( 5,441 )( 64,997 )( - - -
Decrease in share of losses due to dilution 12 - 240,889 - - - -
Balance at end of year 4,287 )( 44,271 )( 311,669 )( - - -
TOTAL CAPITAL FUNDS 30,544,915 P 27,636,724 P 29,020,392 P 26,532,395 P 24,633,746 P 26,796,099 P
See Notes to Financial Statements.
-2-
PARENTCONSOLIDATED

Notes 2009 2008 2007 2009 2008 2007
NET PROFIT FOR THE YEAR 3,335,702 P 2,173,105 P 3,243,659 P 2,572,124 P 1,170,314 P 1,939,350 P
OTHER COMPREHENSIVE INCOME (LOSSES)
Fair value gains (losses) on available-for-sale securities, net of tax 10 1,975,773 2,601,102 )( 1,875,304 )( 1,807,029 2,328,671 )( 1,769,582 )(
Increase in revaluation increment in property of an associate 30,674 21,229 - - - -
Translation adjustment during the year 13,882 19,952 80,635 )( - - -
Increase in other reserves 12 - 240,889 )( - - - -
2,020,329 2,800,810 )( 1,955,939 )( 1,807,029 2,328,671 )( 1,769,582 )(
TOTAL COMPREHENSIVE INCOME (LOSS) FOR THE YEAR 5,356,031 627,705 )( 1,287,720 4,379,153 1,158,357 )( 169,768
TOTAL COMPREHENSIVE INCOME ATTRIBUTABLE TO NON-CONTROLLING INTEREST 131 5,441 64,997 - - -
TOTAL COMPREHENSIVE INCOME (LOSS) ATTRIBUTABLE
TO PARENT COMPANY'S SHAREHOLDERS 5,355,900 P 633,146 )( P 1,222,723 P 4,379,153 P 1,158,357 )( P 169,768 P
RIZAL COMMERCIAL BANKING CORPORATION AND SUBSIDIARIESSTATEMENTS OF COMPREHENSIVE INCOME
FOR THE YEARS ENDED DECEMBER 31, 2009, 2008 AND 2007
PARENT
(Amounts in Thousand Philippine Pesos)
See Notes to Financial Statements.
CONSOLIDATED

Notes 2009 2008 2007 2009 2008 2007
CASH FLOWS FROM OPERATING ACTIVITIES
Profit before tax 4,080,122 P 3,092,529 P 4,089,309 P 3,091,154 P 1,739,034 P 2,482,726 P
Adjustments for:
Impairment losses 11, 16 2,243,192 998,492 942,490 1,683,463 830,597 680,535
Depreciation and amortization 13 533,797 407,881 315,366 377,126 288,499 224,570
Amortization of deferred charges 15 51,726 42,247 30,410 51,726 42,247 34,067
Equity in net earnings of associates 12 206,857 )( 404,192 )( 351,842 )( - - -
Dividend income - - - 217,904 )( 30,979 )( -
Operating income before working capital changes 6,701,980 4,136,957 5,025,733 4,985,565 2,869,398 3,421,898
Decrease (increase) in financial assets at fair value through profit and loss 5,978,751 )( 5,583,598 1,130,140 4,949,856 )( 5,568,698 1,401,061
Increase in loans and receivables 2,205,572 )( 41,812,593 )( 9,204,264 )( 2,597,463 )( 36,557,885 )( 5,696,413 )(
Decrease (increase) in investment property 447,783 )( 357,354 2,223,422 173,634 387,085 2,191,634
Decrease (increase) in other resources 313,295 4,702 )( 55,581 455,843 337,371 294,402
Increase in deposit liabilities 24,050,908 20,298,111 18,378,706 21,624,301 16,437,910 17,034,785
Increase (decrease) in accrued taxes, interest and other expenses 336,889 244,348 )( 660,633 290,910 509,907 )( 358,163
Decrease in other liabilities 322,815 )( 518,042 )( 2,749,634 )( 68,231 )( 808,945 )( 2,789,654 )(
Cash generated from (used in) operations 22,448,151 12,203,665 )( 15,520,317 19,914,703 12,276,275 )( 16,215,876
Cash paid for taxes 635,504 )( 721,071 )( 1,067,699 )( 459,850 )( 571,258 )( 566,742 )(
Net Cash From (Used in) Operating Activities 21,812,647 12,924,736 )( 14,452,618 19,454,853 12,847,533 )( 15,649,134
CASH FLOWS FROM INVESTING ACTIVITIES
Decrease (increase) in available-for-sale securities 11,602,604 )( 4,254,996 10,057,102 )( 9,270,156 )( 4,297,281 10,019,060 )(
Acquisitions of bank premises, furniture, fixtures and equipment 13 1,340,431 )( 1,035,459 )( 571,515 )( 772,316 )( 649,148 )( 407,980 )(
Increase in held-to-maturity investments 711,254 - - 253,530 - -
Decrease (increase) in investments in subsidiaries and associates 324,837 85,991 1,956,812 )( 1,327 )( 450,612 )( 2,925,562 )(
Cash dividends received 12 217,904 230,718 185,364 217,904 30,979 -
Proceeds from disposals of bank premises, furniture, fixtures and equipment 13 82,282 85,708 139,872 50,191 36,995 104,269
Net Cash From (Used in) Investing Activities 11,606,758 )( 3,621,954 12,260,193 )( 9,522,174 )( 3,265,495 13,248,333 )(
CASH FLOWS FROM FINANCING ACTIVITIES
Proceeds from (payments of) bills payable 18 10,671,645 )( 8,632,109 4,813,495 )( 10,874,914 )( 8,932,177 4,722,936 )(
Net proceeds from issuance of subordinated debt 22 3,985,079 1,937,725 - 3,985,079 1,937,725 -
Purchase of treasury shares 23 1,594,925 )( - - 1,594,925 )( - -
Dividends paid 23 785,831 )( 1,003,993 )( 1,056,519 )( 785,831 )( 1,003,993 )( 1,056,519 )(
Redemption of bonds payable 19 - 433,954 )( - - 433,954 )( -
Issuance of common shares 23 - - 5,462,275 - - 5,462,275
Net Cash From (Used in) Financing Activities 9,067,322 )( 9,131,887 407,739 )( 9,270,591 )( 9,431,955 317,180 )(
NET INCREASE (DECREASE) IN CASH AND CASH EQUIVALENTS (Carried Forward) 1,138,567 P 170,895 )( 1,784,686 P 662,088 P 150,083 )( 2,083,621 P
RIZAL COMMERCIAL BANKING CORPORATION AND SUBSIDIARIES
(Amounts in Thousand Philippine Pesos)
FOR THE YEARS ENDED DECEMBER 31, 2009, 2008 AND 2007
STATEMENTS OF CASH FLOWS
CONSOLIDATED PARENT
P P

Notes 2009 2008 2007 2009 2008 2007
NET INCREASE (DECREASE) IN CASH AND CASH EQUIVALENTS (Brought Forward) 1,138,567 P 170,895 )( 1,784,686 P 662,088 P 150,083 )( 2,083,621 P
CASH AND CASH EQUIVALENTS AT BEGINNING OF YEAR
Cash and other cash items 7 6,807,939 5,875,727 5,005,742 5,595,736 4,827,540 4,181,906
Due from Bangko Sentral ng Pilipinas 7 16,390,973 17,611,380 13,787,927 15,656,119 16,750,323 12,844,278
Due from other banks 7 4,862,225 4,744,925 7,653,677 3,197,593 3,021,668 5,489,726
28,061,137 28,232,032 26,447,346 24,449,448 24,599,531 22,515,910
CASH AND CASH EQUIVALENTS AT END OF YEAR
Cash and other cash items 7 6,811,443 6,807,939 5,875,727 5,408,491 5,595,736 4,827,540
Due from Bangko Sentral ng Pilipinas 7 19,321,339 16,390,973 17,611,380 17,914,204 15,656,119 16,750,323
Due from other banks 7 3,066,922 4,862,225 4,744,925 1,788,841 3,197,593 3,021,668
29,199,704 P 28,061,137 P 28,232,032 P 25,111,536 P 24,449,448 P 24,599,531 P
Supplemental Information on Noncash Investing Activities
In 2009, the Group and the Parent Company reclassified its investment in special purpose companies (SPCs), previously presented as investment property, with total carrying amount of P3,092,154 and P388,431, respectively, to investments in subsidiaries.
Accordingly, the net assets of the SPCs were consolidated to the Group's 2009 financial statements (see Note 14).
In 2009, the Parent Company exchanged its common shares previously purchased as treasury shares amounting to P642,216 for a 5.64% equity stake in MICO Equities, Inc. (see Note 23).
In 2008, the Group and the Parent Company made the following reclassifications of investment securities (see Notes 8, 9, 10 and 11):
- Financial assets at fair value through profit or loss (FVTPL) with a total carrying value of P411,228 were reclassified to held-to-maturity (HTM) investments both in the Group and Parent Company's financial statements.
- Available-for-sale (AFS) securities with a total carrying value of P5,960,822 were reclassified to loans and receivables in the Group and Parent Company's financial statements.
- Financial derivative instruments with a negative carrying value of P307,836 were reclassified to loans and receivables in the Group and Parent Company's financial statements .
- AFS securities with a total carrying value of P20,373,408 and P17,588,835 were reclassified from AFS securities to HTM investments in the Group and Parent Company's financial statements, respectively.
- Financial assets at FVTPL with carrying value of P527,223 were reclassified to AFS securities in the Group's financial statements.
See Notes to Financial Statements.
-2-
CONSOLIDATED PARENT
PP

RIZAL COMMERCIAL BANKING CORPORATION AND SUBSIDIARIES NOTES TO FINANCIAL STATEMENTS
DECEMBER 31, 2009, 2008 AND 2007 (Amounts in Thousands of Philippine Pesos, Except Per Share Data or as Indicated)
1. CORPORATE INFORMATION
Rizal Commercial Banking Corporation (the “Parent Company”) holds interest in the following subsidiaries and associates:
Effective Percentage Country of Explanatory of Ownership Subsidiaries/Associates Incorporation Notes 2009 2008 Subsidiaries: RCBC Savings Bank, Inc. (RSB) Philippines 100.00 100.00 RCBC Forex Brokers Corporation (RCBC Forex) Philippines 100.00 100.00 RCBC Telemoney Europe Italy 100.00 100.00 RCBC North America, Inc. (RCBC North America) California, USA (a) 100.00 100.00 RCBC International Finance Limited (RCBC IFL) Hongkong 99.99 99.99 RCBC Investment Ltd. Hongkong (b) 100.00 100.00 RCBC Capital Corporation (RCBC Capital) Philippines 99.96 99.96 RCBC Securities, Inc. (RSI) Philippines (c) 100.00 100.00 Pres. Jose P. Laurel Rural Bank, Inc. (JPL) Philippines (d) 99.00 - Bankard, Inc. (Bankard) Philippines (e) 91.69 91.69 Merchants Savings and Loan Association, Inc. (Merchants Bank) Philippines (f) 96.38 96.38 Special Purpose Companies (SPCs): Under Parent Company: Niyog Property Holdings, Inc. (NPHI) Philippines (g) 100.00 - Under RSB: (h) Goldpath Properties Development Corporation (GPDC) Philippines 100.00 - Manchesterland Properties, Inc. Philippines (i) 100.00 - Hexagonland Corporation Philippines (i) 100.00 - Best Value Property and Development Corporation Philippines 100.00 - Crescent Park Property and Development Corporation Philippines 100.00 - Crestview Properties Development Corporation Philippines 100.00 - Eight Hills Property and Development Corporation Philippines 100.00 - Fairplace Property and Development Corporation Philippines 100.00 - Gold Place Properties Development Corporation Philippines 100.00 - Greatwings Properties Development Corporation Philippines 100.00 - Happyville Property and Development Corporation Philippines 100.00 - Landview Property and Development Corporation Philippines 100.00 - Lifeway Property and Development Corporation Philippines 100.00 - Niceview Property and Development Corporation Philippines 100.00 - Princeway Properties Development Corporation Philippines 100.00 -

- 2 -
Effective Percentage Country of Explanatory of Ownership Subsidiaries/Associates Incorporation Notes 2009 2008 Under RSB: (h) Stockton Realty Development Corporation Philippines 100.00 - Top Place Properties Development Corporation Philippines 100.00 - Associates: RCBC Land, Inc. (RLI) Philippines 49.00 49.00 YGC Corporate Services, Inc. (YCS) Philippines 40.00 40.00 Luisita Industrial Park Co. (LIPC) Philippines 35.00 35.00 Subic Power Corporation (SPC) Philippines 26.50 26.50 RCBC Realty Corporation (RRC) Philippines 34.80 34.80 Honda Cars Phils., Inc. (HCPI) Philippines 12.88 12.88 Roxas Holdings, Inc. (RHI) Philippines 4.71 4.71 Great Life Financial Assurance Corporation (GLFAC) Philippines (j) - 20.00
Explanatory Notes:
(a) Includes 25.29% and 31% ownership of RCBC IFL in 2009 and 2008, respectively.
(b) A wholly owned subsidiary of RCBC IFL. (c) A wholly owned subsidiary of RCBC Capital. (d) In 2009, the Parent Company made a total capital infusion to JPL amounting to
P175 million which resulted in its full and irrevocable voting and economic rights for 99% of JPL’s outstanding shares (see Note 12).
(e) Owned 59.07% by RCBC Capital in 2007. In 2008, the Parent Company’s P1 billion capital infusion by way of conversion of debt to equity was effected (see Note 12). As of December 31, 2009 and 2008, the Parent Company has 66.58% direct ownership and 25.11% indirect ownership through RCBC Capital.
(f) In 2008, the Parent Company acquired 96.38% ownership in Merchants Bank from Finman Capital Corporation.
(g) In 2009, the Parent Company and RSB reclassified their 58% and 42%, respectively, investment in NPHI from Investment Property account to Investments in Subsidiaries and Associates account (see Notes 12 and 14).
(h) In 2009, RSB reclassified its investment with SPCs from Investment Property account to Investments in Subsidiaries and Associates account which resulted into its consolidation with the Parent Company (see Note 14).
(i) A wholly owned subsidiary of GPDC. (j) Sold in 2009 to Grepalife Financial, Inc. (Grepalife), formerly Great Pacific Life
Assurance Corporation (see Note 12). The Parent Company is a universal bank engaged in all aspects of banking. It provides products and services related to traditional loans and deposits, trade finance, domestic and foreign fund transfers or remittance, cash management, treasury, and trust and custodianship services. The Parent Company also enters into forward currency contracts as an accommodation to its clients and as a means of managing its foreign exchange exposures. The Parent Company and its subsidiaries are engaged in all aspects of traditional banking, investment banking, retail financing (credit cards, auto loans and mortgage/ housing loans), leasing and stock brokering. At the end of December 31, 2009, the Parent Company has 367 automated teller machines, 219 branches, 19 E-biz centers, 3 extension offices and 3 foreign exchange booths within and outside of the Philippines.

- 3 -
The Parent Company’s common shares are listed in the Philippine Stock Exchange (PSE) and is a 48.10% owned subsidiary of Pan Malayan Management and Investment Corporation (PMMIC), a company incorporated and domiciled in the Philippines. PMMIC is the holding company of the flagship institutions of the Yuchengco Group of Companies.
The registered address of the Parent Company is located at Yuchengco Tower, RCBC Plaza, 6819 Ayala Avenue, Makati City. The accompanying financial statements for the year ended December 31, 2009 (including the comparatives for the years ended December 31, 2008 and 2007) were approved and authorized for issue by the Board of Directors (BOD) on March 29, 2010.
2. SUMMARY OF SIGNIFICANT ACCOUNTING POLICIES
The significant accounting policies that have been used in the preparation of these financial statements are summarized in the succeeding pages. The policies have been consistently applied to all years presented, unless otherwise stated.
2.1 Basis of Preparation of Financial Statements
(a) Statement of Compliance with Financial Reporting Standards in the Philippines for Banks and
Philippine Financial Reporting Standards The 2009 and 2008 consolidated financial statements of Rizal Commercial Banking Corporation and its subsidiaries (together hereinafter referred to as the “Group”) and the separate 2009 and 2008 financial statements of Rizal Commercial Banking Corporation have been prepared in accordance with the Financial Reporting Standards in the Philippines for Banks (FRSPB); and the 2007 comparative financial statements of the Group and of the Parent Company have been prepared in accordance with Philippine Financial Reporting Standards (PFRS), except for the following matters: the staggered recognition of required additional allowance for impairment and losses, and the derecognition of certain non-performing assets (NPAs) transferred, as discussed fully in Note 11. PFRS are adopted by the Financial Reporting Standards Council (FRSC) from the pronouncements issued by the International Accounting Standards Board (IASB). FRSPB are similar to PFRS, except for the following reclassifications of certain financial instruments which are not allowed under PFRS, but allowed under FRSPB starting October 2008 as permitted by the Bangko Sentral ng Pilipinas (BSP) for prudential regulation, and by the Securities and Exchange Commission (SEC) for financial reporting purposes: (i) the reclassification of the embedded derivatives in credit-linked notes (CLNs) and other similar instruments that are linked to Republic of the Philippines (ROP) bonds from the fair value through profit or loss (FVTPL) classification to loans and receivables and available-for-sale (AFS) classifications; and (ii) the reclassification of certain financial assets previously classified under AFS category due to the tainting of held-to-maturity (HTM) portfolio back to HTM category. The effects of the reclassification to certain statement of financial position items as of December 31, 2009 and 2008 and net profit for the years then ended under FRSPB are discussed fully in Notes 8, 9, 10, and 11.

- 4 -
These financial statements have been prepared using the measurement bases specified by FRSPB and PFRS for each type of resource, liability, income and expense. These financial statements have been prepared on the historical basis, except for the revaluation of certain financial assets. The measurement bases are more fully described in the accounting policies that follow.
(b) Presentation of Financial Statements The financial statements are presented in accordance with Philippine Accounting Standards (PAS) 1 (Revised 2007), Presentation of Financial Statements. The Group presents all items of income and expense in two statements: a Statement of Income and a Statement of Comprehensive Income. Two comparative periods are presented for the statement of financial position when the Group applies an accounting policy retrospectively, makes a retrospective restatement of items in its financial statements, or reclassifies items in the financial statements.
(c) Functional and Presentation Currency
These financial statements are presented in Philippine pesos, the Group’s functional and presentation currency, and all values represent absolute amounts except for per share data or when otherwise indicated (see also Note 2.17). Items included in the financial statements of the Group are measured using the currency of the primary economic environment in which the Group operates (the functional currency).
2.2 Adoption of New Interpretations, Revisions and Amendments to PFRS (a) Effective in 2009 that are Relevant to the Group
In 2009, the Group adopted the following new revisions and amendments to PFRS
that are relevant to the Group and effective for financial statements for the annual period beginning on or after January 1, 2009:
PAS 1 (Revised 2007) : Presentation of Financial Statements PAS 23 (Revised 2007) : Borrowing Costs PAS 32 and PAS 1
(Amendments) : Financial Instruments: Presentation and Presentation of Financial
Statements – Puttable Financial Instruments and Obligations
Arising on Liquidation PFRS 7 (Amendment) : Financial Instruments: Disclosures PFRS 8 : Operating Segments Philippine Interpretation
IFRIC 13 : Customer Loyalty Programmes Various Standards : 2008 Annual Improvements to PFRS

- 5 -
Discussed below are the effects on the financial statements of the new accounting interpretation and amended standards: (i) PAS 1 (Revised 2007), Presentation of Financial Statements, requires an entity to
present all items of income and expense recognized in the period in a single statement of comprehensive income or in two statements: a separate statement of income and a statement of comprehensive income. Income and expense recognized in profit or loss is presented in the statement of income in the same way as the previous version of PAS 1. The statement of comprehensive income includes the profit or loss for the period and each component of income and expense recognized outside of profit or loss or the “non-owner changes in equity,” which are no longer allowed to be presented in the statements of changes in equity, classified by nature (e.g., gains or losses on available-for-sale assets or translation differences related to foreign operations). A statement showing an entity’s financial position at the beginning of the previous period is also required when the entity retrospectively applies an accounting policy or makes a retrospective restatement, or when it reclassifies items in its financial statements.
The Group’s adoption of PAS 1 (Revised 2007) did not result in any material adjustments in its financial statements as the change in accounting policy only affects presentation aspects. The Group has elected to present all income and expense in two statements: a statement of income and statement of comprehensive income (see Note 2.1).
(ii) PAS 23 (Revised 2007), Borrowing Costs. Under the revised PAS 23, all borrowing costs that are directly attributable to the acquisition, construction or production of a qualifying asset shall be capitalized as part of the cost of that asset. The option of immediately expensing borrowing costs that qualify for asset recognition has been removed. The Group’s adoption of this new standard does not have any significant effect on the 2009 financial statements, as well as for prior periods, as the Group’s existing accounting policy is to capitalize all interest directly to qualifying assets.
(iii) PAS 32 (Amendment), Financial Instruments: Presentation and PAS 1 (Amendment), Presentation of Financial Statements – Puttable Financial Instruments and Obligations Arising on Liquidation. The amendments require certain financial instruments that represent a residual interest in the net assets of an entity, which would otherwise be classified as financial liabilities, to be classified as equity, if both the financial instrument and the capital structure of the issuing entity meet certain conditions. The Group’s adoption of this standard does not have material effect on its financial statements.
(iv) PFRS 7 (Amendment), Financial Instruments: Disclosures. The amendment
requires additional disclosures for financial instruments that are measured at fair value in the statement of financial position. These fair value measurements are categorized into a three-level fair value hierarchy, which reflects the extent to which they are based on observable market data. A separate quantitative maturity analysis must be presented for derivative financial liabilities that shows the remaining contractual maturities, where these are essential for an understanding of the timing of cash flows. The change in accounting policy only results in additional disclosures (see Note 4.5).

- 6 -
(v) PFRS 8, Operating Segments. Under this new standard, a reportable operating segment is identified based on the information about the components of the entity that management uses to make decisions about operating matters. In addition, segment resources, liabilities and performance, as well as certain disclosures, are to be measured and presented based on the internal reports prepared for and reviewed by the chief decision makers. The Group identifies operating segments and reports on segment resources, liabilities and performance based on internal management reports, hence, adoption of this new standard does not have a material impact on the Group’s financial statements.
(vi) Philippine Interpretation IFRIC 13, Customer Loyalty Programmes. This new
Philippine Interpretation clarifies that when goods or services are sold together with a customer loyalty incentive (for example loyalty points or free products), the arrangement is a multiple-element arrangement and the consideration receivable from the customer is allocated between the components of the arrangement using fair values. This new interpretation has no impact on the Group’s financial statements.
(vii) 2008 Annual Improvements to PFRS. The FRSC has adopted the Improvements
to International Financial Reporting Standards 2008. These amendments became effective in the Philippines in annual periods beginning on or after January 1, 2009. The Group determined the amendments to the following standards to be relevant to the Group’s accounting policies:
• PAS 1 (Amendment), Presentation of Financial Statements. The amendment
clarifies that financial instruments classified as held for trading in accordance with PAS 39 are not necessarily required to be presented as current assets or current liabilities. Instead, normal classification principles under PAS 1 should be applied. Since the presentation of assets and liabilities in the Group’s financial statements are unclassified, this new standard has no impact on the Group’s financial statements.
• PAS 19 (Amendment), Employee Benefits. The amendment includes the
following:
- Clarification that a curtailment is considered to have occurred to the extent that benefit promises are affected by future salary increases and a reduction in the present value of the defined benefit obligation results in negative past service cost.
- Change in the definition of return of plan assets to require the
deduction of plan administration costs in the calculation of plan assets return only to the extent that such costs have been excluded from measurement of the defined benefit obligation.
- Distinction between short-term and long-term employee benefits will
be based on whether benefits are due to be settled within or after 12 months of employee service being rendered.
- 7 -
- Removal of the reference to recognition in relation to contingent liabilities in order to be consistent with PAS 37, Provisions, Contingent Liabilities and Contingent Assets, which requires contingent liabilities to be disclosed and not recognized.
This amendment to PAS 19 has no impact on the Group’s 2009 financial statements.
• PAS 23 (Amendment), Borrowing Costs. The amendment clarifies the
definition of borrowing costs to include interest expense determined using the effective interest method under PAS 39. This amendment had no significant effect on the Group’s financial statements.
• PAS 28 (Amendment), Investments in Associates. Where an investment in
associate is accounted for in accordance with PAS 39, only certain rather than all disclosure requirements in PAS 28 need to be made in addition to disclosures required by PFRS 7. The Group’s adoption of this new standard does not have any significant effect on the 2009 financial statements, as all investment in associates of the Group are in accordance with PAS 28.
• PAS 36 (Amendment), Impairment of Assets. Where fair value less cost to sell
is calculated on the basis of discounted cash flows, disclosures equivalent to those for value-in-use calculation should be made. The Group’s adoption of this amendment has no material effect on its 2009 financial statements.
• PAS 38 (Amendment), Intangible Assets. The amendment clarifies when to
recognize a prepayment asset, including advertising or promotional expenditures. In the case of supply of goods, the entity recognizes such expenditure as an expense when it has a right to access the goods. For services, an expense is recognized on receiving the service. Also, prepayment may only be recognized in the event that payment has been made in advance of obtaining right of access to goods or receipt of services. The Group’s adoption of this amendment had no material effect on its 2009 financial statements.
• PAS 39 (Amendment), Financial Instruments: Recognition and Measurement. The
definition of financial asset or financial liability at fair value through profit or loss as it relates to items that are held for trading was changed. A financial asset or liability that is part of a portfolio of financial instruments managed together with evidence of an actual recent pattern of short-term profit taking is included in such a portfolio on initial recognition. The Group’s adoption of this amendment has no material effect on its 2009 financial statements.

- 8 -
• PAS 40 (Amendment), Investment Property. PAS 40 is amended to include property under construction or development for future use as investment property in its definition of investment property. This results in such property being within the scope of PAS 40; previously, it was within the scope of PAS 16. Also, if an entity’s policy is to measure investment property at fair value, but during construction or development of an investment property the entity is unable to reliably measure its fair value, then the entity would be permitted to measure the investment property at cost until construction or development is complete. At such time, the entity would be able to measure the investment property at fair value. The Group’s adoption of this new standard has no material effect on its financial statements.
• PFRS 5 (Amendment), Non-current Assets Held-for-Sale and Discontinued
Operations. The amendment clarifies that all the assets and liabilities of a subsidiary should be classified as held for sale if the entity is committed to a sale plan involving loss of control of the subsidiary, regardless of whether the entity will retain a non-controlling interest after the sale. Relevant disclosures should be made for this subsidiary if the definition of a discontinued operation is met. The Group’s adoption of this amendment did not result to significant impact on its financial statements.
(b) Effective in 2009 but not Relevant to the Group
The following amendments and interpretations to published standards are mandatory
for accounting periods beginning on or after January 1, 2009 but are not relevant to the Group’s financial statements:
PFRS 1 and PAS 27 (Amendments) : PFRS 1 – First Time Adoption of PFRS and PAS 27 – Consolidated and
Separate Financial Statements PFRS 2 (Amendment) : Share-based Payment Philippine Interpretations IFRIC 16 : Hedges of a Net Investment in a
Foreign Operation

- 9 -
(c) Effective Subsequent to 2009
There are new PFRS, revisions, amendments, annual improvements and interpretations to existing standards that are effective for periods subsequent to 2009. Among those, management has initially determined the following, which the Group will apply in accordance with their transitional provisions, to be relevant to its financial statements:
(i) PAS 27 (Revised 2008), Consolidated and Separate Financial Statements
(effective from July 1, 2009). The amendment requires that dividends received out of the investee's pre-acquisition profits be no longer deducted from cost in the parent or investor's separate financial statements, instead, dividends receivable will be recorded as income (but may also give rise to impairment of the investment). Moreover, the amendment introduces new guidance on accounting when a parent reorganizes the structure of its group by establishing a new entity as its parent and the interests of shareholders are not affected. The Group does not expect any impact on its consolidated financial statements when it applies the standard subsequently.
(ii) PFRS 3 (Revised), Business Combinations (effective from July 1, 2009). The
revised standard continues to apply the acquisition method to business combinations, with some significant changes. For example, all payments to purchase a business are to be recorded at fair value at the acquisition date, with contingent payments classified as debt subsequently re-measured through the income statement. There is a choice on an acquisition-by-acquisition basis to measure the non-controlling interest in the acquiree either at fair value or at the non-controlling interest’s proportionate share of the acquiree’s net assets. All acquisition-related costs should be expensed. The Group will apply PFRS 3 (Revised) prospectively to all business combinations from January 1, 2010.
(iii) PFRS 9, Financial Instruments (effective from January 1, 2013). PFRS 9 is the first part of Phase 1 of the project to replace PAS 39, Financial Instruments: Recognition and Measurement, in its entirety by the end of 2010. The main phases are (with a separate project dealing with derecognition):
o Phase 1 : Classification and Measurement o Phase 2 : Impairment Methodology o Phase 3 : Hedge Accounting
PFRS 9 introduces major simplifications of the classification and measurement provisions under PAS 39. These include reduction from four measurement categories into two categories, i.e. fair value and amortized cost, and from several impairment methods into one method. Management is yet to assess the impact that this amendment is likely to have on the financial statements. However, it does not expect to implement the amendments until 2013 when all phases of the PAS 39 replacement have been published at which time the Group expects it can comprehensively assess the impact of the revised standard.

- 10 -
(iv) Philippine Interpretation IFRIC 14, Prepayments of a Minimum Funding Requirement – Amendment to IFRIC 14 (effective on or before January 1, 2011). This interpretation addresses unintended consequences that can arise from the previous requirements when an entity prepays future contributions into a defined benefit pension plan. It sets out guidance on when an entity recognizes an asset in relation to a PAS 19 surplus for defined benefit plans that are subject to a minimum funding requirement. Management does not expect that its future adoption of the amendment will have a material effect on its financial statements because it does not usually make substantial advance contribution to its retirement fund.
(v) Philippine Interpretation IFRIC 18, Transfers of Assets from Customers
(effective from July 1, 2009). This interpretation provides guidance on how to account for items of property, plant and equipment received from customers; or cash that is received and used to acquire or construct specific assets. It is only applicable to agreements in which an entity receives from a customer such assets that the entity must either use to connect the customer to a network or to provide ongoing access to a supply of goods or services or both. Management does not anticipate the adoption of the interpretation to have material impact on its financial statements.
(vi) Philippine Interpretation IFRIC 19, Extinguishing Financial Liabilities with Equity
Instruments (effective on or after July 1, 2010). It addresses accounting by an entity when the terms of a financial liability are renegotiated and result in the entity issuing equity instruments to a creditor to extinguish all or part of the financial liability. These transactions are sometimes referred to as “debt for equity” exchanges or swaps, and have happened with increased regularity during the financial crisis. The interpretation requires the debtor to account for a financial liability which is extinguished by equity instruments as follows:
• the issue of equity instruments to a creditor to extinguish all (or part) of a
financial liability is considered as payment in accordance with PAS 39;
• the entity measures the equity instruments issued at fair value, unless this cannot be reliably measured;
• if the fair value of the equity instruments cannot be reliably measured, then
the fair value of the financial liability extinguished is used; and, • the difference between the carrying amount of the financial liability
extinguished and the consideration paid is recognized in profit or loss.
Management has determined that the adoption of the interpretation will not have a material effect on it financial statements as it does not normally extinguish financial liabilities through equity swap.

- 11 -
(vii) 2009 Annual Improvements to PFRS. The FRSC has adopted the Improvements to Philippine Financial Reporting Standards 2009. Most of these amendments became effective for annual periods beginning on or after July 1, 2009, or January 1, 2010. Among those improvements, only the following amendments were identified to be relevant to the Group’s financial statements:
• PAS 1 (Amendment), Presentation of Financial Statements (effective from
January 1, 2010). The amendment clarifies the current and non-current classification of a liability that can, at the option of the counterparty, be settled by the issue of the entity’s equity instruments. The Group will apply the amendment in its 2010 financial statements but expects to have no material impact in the Group’s financial statements.
• PAS 7 (Amendment), Statement of Cash Flows (effective from
January 1, 2010). The amendment clarifies that only an expenditure that results in a recognized asset can be classified as a cash flow from investing activities. The amendment will not have a material impact on the financial statements since only recognized assets are classified by the Group as cash flow from investing activities.
• PAS 17 (Amendment), Leases (effective from January 1, 2010). The amendment clarifies that when a lease includes both land and building elements, an entity assesses the classification of each element as finance or an operating lease separately in accordance with the general guidance on lease classification set out in PAS 17. Management has initially determined that this will not have material impact on the Group’s financial statements.
• PAS 18 (Amendment), Revenue (effective from January 1, 2010). The
amendment provides guidance on determining whether an entity is acting as a principal or as an agent. Management will apply this amendment prospectively in its 2010 financial statements.
2.3 Basis of Consolidation and Accounting for Investments in Subsidiaries and
Associates in Separate Financial Statements
The Group obtains and exercises control through voting rights. The Group’s consolidated financial statements comprise the accounts of the Parent Company and its subsidiaries as enumerated in Note 1, after the elimination of material intercompany transactions. All intercompany balances and transactions with subsidiaries, including income, expenses and dividends, are eliminated in full. Unrealized profits and losses from intercompany transactions that are recognized in assets are also eliminated in full. Intercompany losses that indicate an impairment are recognized in the consolidated financial statements. The financial statements of subsidiaries are prepared for the same reporting period as the Parent Company, using consistent accounting policies.

- 12 -
The Group accounts for its investments in subsidiaries and associates, and non-controlling interest as follows: (a) Investments in Subsidiaries
Subsidiaries are all entities over which the Group has the power to control the financial and operating policies. The Parent Company obtains and exercises control through voting rights. The existence and effect of potential voting rights that are currently exercisable or convertible are considered from the date in which the Parent Company controls another entity. Subsidiaries are fully consolidated from the date when the Parent Company obtains control. They are de-consolidated from the date the control ceases. Acquired subsidiaries are subject to application of the purchase method for acquisitions. This involves the revaluation at fair value of all identifiable assets and liabilities, including contingent liabilities of the subsidiary, at the acquisition date, regardless of whether or not they were recorded in the financial statements of the subsidiary prior to acquisition. On initial recognition, the assets and liabilities of the subsidiary are included in the consolidated statement of financial position at their revalued amounts, which are also used as the bases for subsequent measurement in accordance with the Group accounting policies. Goodwill (positive) represents the excess of acquisition cost over the fair value of the Group’s share of the identifiable net assets of the acquired subsidiary at the date of acquisition. Negative goodwill represents the excess of the Group’s share in the fair value of identifiable net assets of the subsidiary at date of acquisition over acquisition cost. All intercompany balances and transactions with subsidiaries, including the unrealized profits arising from intra-group transactions, have been eliminated in full. Unrealized losses are eliminated unless costs cannot be recovered.
(b) Transactions with Non-controlling Interests
Non-controlling interests represent the portion of the net assets and profit or loss not attributable to the Group. The Group applies a policy of treating transactions with non-controlling interests as transactions with parties external to the Group. Disposals to non-controlling interests result in gains and losses for the Group that are recorded in the statement of income. Purchases of equity shares from non-controlling interests may result in goodwill, being the difference between any consideration paid and the relevant share acquired of the carrying value of net assets of the subsidiary. In the consolidated financial statements, the non-controlling interest component is shown as part of statements of changes in capital funds.
(c) Investments in Associates
Associates are those entities over which the Group is able to exert significant influence but which are neither subsidiaries nor interest in a joint venture. In the consolidated financial statements, Investments in Associates are initially recognized at cost and subsequently accounted for using the equity method. Under the equity method, the Group recognizes in its statement of income its share in the earnings or losses of the associates. The cost of the investment is increased or decreased by the Group’s equity in net earnings or losses of the associates since the date of acquisition.

- 13 -
Dividends received are recorded as reduction in the carrying values of the investments.
Acquired investments in associates are also subject to purchase accounting. However, any goodwill or fair value adjustment attributable to the share in the associate is included in the amount recognized as investment in associates. All subsequent changes to the share of interest in the equity of the associate are recognized in the Group’s carrying amount of the investment. Changes resulting from the profit or loss generated by the associate are charged against Equity in Net Earnings of Associates in the Group’s statement of income and therefore affect net results of the Group. These changes include subsequent depreciation, amortization or impairment of the fair value adjustments of assets and liabilities. Items that have been directly recognized in the associate’s equity, for example, resulting from the associate’s accounting for available-for-sale financial assets, are recognized in consolidated Capital Funds of the Group. Any non-financial income related equity movements of the associate that arise, for example, from the distribution of dividends or other transactions with the associate’s shareholders, are charged against the proceeds received or granted. No effect on the Group’s net result or capital funds is recognized in the course of these transactions. However, when the Group’s share of losses in an associate equals or exceeds its interest in the associate, including any other unsecured receivables, the Group does not recognize further losses, unless it has incurred obligations or made payments on behalf of the associate.
Unrealized gains on transactions between the Group and its associates are eliminated to the extent of the Group’s interest in the associates. Unrealized losses are also eliminated unless the transaction provides evidence of an impairment of the assets transferred. Accounting policies of associates have been changed where necessary to ensure consistency with the policies adopted by the Group.
In the Parent Company financial statements, the Parent Company’s Investments in Subsidiaries and Associates are accounted for at cost, less any impairment loss. Investment costs are inclusive of unamortized positive goodwill, if any. If there is an objective evidence that the investments in subsidiaries and associates will not be recovered, an impairment loss is provided. Impairment loss is measured as the difference between the carrying amount of the investment and the present value of the estimated cash flows discounted at the current market rate of return for similar financial assets. The amount of the impairment loss is recognized in profit or loss.
2.4 Segment Reporting
A business segment is a group of assets and operations engaged in providing products or services that are subject to risks and returns that are different from those of other business segments. A geographical segment is a segment engaged in providing products or services within a particular economic environment that is subject to risks and returns that are different from those of segments operating in other economic environments. The Group’s operations are structured according to the nature of the services provided (primary segment) and different markets served (secondary segment). Financial information on business segments is presented in Note 6.

- 14 -
2.5 Financial Assets
Financial assets, which are recognized when the Group becomes a party to the contractual terms of the financial instrument, include cash and other financial instruments. Financial assets, other than hedging instruments, are classified into the following categories: financial assets at fair value through profit or loss, loans and receivables, held-to-maturity investments and available-for-sale securities. Financial assets are assigned to the different categories by management on initial recognition, depending on the purpose for which the investments were acquired. The designation of financial assets is re-evaluated at every reporting period at which date a choice of classification or accounting treatment is available, subject to compliance with specific provisions of applicable accounting standards.
Regular purchases and sales of financial assets are recognized on their trade date. All financial assets that are not classified as at fair value through profit or loss are initially recognized at fair value plus any directly attributable transaction costs. Financial assets carried at fair value through profit or loss are initially recorded at fair value and transaction costs related to it are recognized as expense in the statement of income. The foregoing categories and detailed description of the categories of financial instruments are more fully discussed below and in the succeeding pages.
(a) Financial Assets at Fair Value through Profit or Loss
This category includes derivative financial instruments and financial assets that are either classified as held for trading or are designated by the entity to be carried at fair value through profit or loss upon initial recognition. A financial asset is classified in this category if acquired principally for the purpose of selling in the short term or if so designated by management. Derivatives are also categorized as “held for trading” unless they are designated as hedges. Financial assets at fair value through profit or loss are measured at fair value, and changes therein are recognized in profit or loss. Financial assets may be reclassified out of fair value through profit or loss category if they are no longer held for the purpose of being sold or repurchased in the near term. Derivatives and financial assets originally designated as financial assets at fair value through profit or loss may not be subsequently reclassified, except for derivatives embedded in CLNs linked to ROP bonds as allowed by BSP for prudential reporting and SEC for financial reporting purposes.
(b) Loans and Receivables
Loans and receivables are non-derivative financial assets with fixed or determinable payments that are not quoted in an active market. They arise when the Group provides money, goods or services directly to the debtor with no intention of trading the receivables. Included in this category are those arising from direct loans to customers, interbank loans and receivables, sales contracts receivable, all receivables from customers and cash and cash equivalents. Cash and cash equivalents comprise balances with less than three months maturity from the date of acquisition, including cash and non-restricted balances with the BSP and amounts due from other banks.

- 15 -
Loans and receivables are subsequently measured at amortized cost using the effective interest method, less impairment losses. Any change in their value is recognized in profit or loss, except for changes in fair values of reclassified financial assets under PAS 39 and PFRS 7 (Amendments). Increases in estimates of future cash receipts from such financial assets shall be recognized as an adjustment to the effective interest rate from the date of the change in estimate rather than as an adjustment to the carrying amount of the financial asset at the date of the change in estimate. Impairment losses is the estimated amount of losses in the Group’s loan portfolio, based on the evaluation of the estimated future cash flows discounted at the loan’s original effective interest rate or the last repricing rate for loans issued at variable rates (see Note 2.6). It is established through an allowance account which is charged to expense. Loans and receivables are written off against the allowance for impairment losses when management believes that the collectibility of the principal is unlikely, subject to BSP regulations.
(c) Held-to-maturity Investments This includes non-derivative financial assets with fixed or determinable payments and a fixed date of maturity. Investments are classified as held-to maturity if the Group has the positive intention and ability to hold them until maturity. Investments intended to be held for an undefined period are not included in this classification. Held-to-maturity investments consist of government and private debt securities. Should the Group sell other than an insignificant amount of held-to-maturity assets, the entire category would be tainted and reclassified as available-for-sale securities. The tainting provision will not apply if the sales or reclassifications of held-to-maturity investments are so close to maturity or the financial asset’s call date that changes in the market rate of interest would not have a significant effect on the financial asset’s fair value; occur after the Group has collected substantially all of the financial asset’s original principal through scheduled payments or prepayments; or are attributable to an isolated event that is beyond the control of the Group, is nonrecurring and could not have been reasonably anticipated by the Group. Financial assets that are booked under the available-for-sale category because of the tainting provision may be reclassified to held-to-maturity investments or loans and receivables using the fair value carrying amount of the financial assets as of the date of reclassification in accordance with BSP Circular No. 628.
Held-to-maturity investments are subsequently measured at amortized cost using the effective interest method. In addition, if there is objective evidence that the investment has been impaired, the financial asset is measured at the present value of estimated cash flows (see Note 2.6). Any changes to the carrying amount of the investment due to impairment are recognized in profit or loss.
(d) Available-for-sale Securities
This includes non-derivative financial assets that are either designated to this category or do not qualify for inclusion in any of the other categories of financial assets.

- 16 -
Non-derivative financial asset classified as available-for-sale may be reclassified to loans and receivables category that would have met the definition of loans and receivables (effective in July 1, 2008) if there is an intention and ability to hold that financial asset for the foreseeable future or until maturity. Any previous gain or loss on the asset that has been recognized in the capital funds shall be amortized to profit or loss over the remaining life of the held-to-maturity investment, in case of financial asset with a fixed maturity, using the effective interest method. Any difference between the new amortized cost and maturity amount shall also be amortized over the remaining life of the financial asset using the effective interest method.
All financial assets within this category are subsequently measured at fair value, unless otherwise disclosed, with changes in value recognized in other comprehensive income, net of any effects arising from income taxes. When the asset is disposed of or is determined to be impaired the cumulative gain or loss recognized in other comprehensive income is reclassified from revaluation reserve to profit or loss and presented as a reclassification adjustment within other comprehensive income. Reversal of impairment loss is recognized in other comprehensive income, except for financial assets that are debt securities which are recognized in profit or loss only if the reversal can be objectively related to an event occurring after the impairment loss is recognized.
Impairment losses recognized on financial assets are presented as part of Impairment Losses account in the statement of income. The fair values of quoted investments in active markets are based on current bid prices. If the market for a financial asset is not active (and for unlisted securities), the Group establishes the fair value by using valuation techniques, which include the use of recent arm’s length transactions, discounted cash flow analysis, option pricing models and other valuation techniques commonly used by market participants. Gains and losses arising from changes in the fair value of the financial assets at fair value through profit or loss category are included in Trading and Securities Gains (Losses) - Net account in the statement of income in the period in which they arise. Gains and losses arising from changes in the fair value of available-for-sale securities are recognized as other comprehensive income, until the financial asset is derecognized or impaired at which time the cumulative gain or loss previously recognized in capital funds shall be recognized in profit or loss. However, interest calculated using the effective interest method is recognized in the statement of income. Dividends on available-for-sale equity instruments are recognized in the statement of income when the entity’s right to receive payment is established. Non-compounding interest and other cash flows resulting from holding impaired financial assets are recognized in profit or loss when received, regardless of how the related carrying amount of financial assets is measured. Derecognition of financial assets occurs when the right to receive cash flows from the financial instruments expire or are transferred and substantially all of the risks and rewards of ownership have been transferred.

- 17 -
2.6 Impairment of Financial Assets The Group assesses at the end of each reporting period whether there is objective evidence that a financial asset or group of financial assets is impaired. A financial asset or a group of financial assets is impaired and impairment losses incurred if, and only if, there is objective evidence of impairment as a result of one or more events that occurred after the initial recognition of the asset (a loss event) and that loss event (or events) has an impact on the estimated future cash flows of the financial asset or group of financial assets that can be reliably estimated. Objective evidence that a financial asset or group of assets is impaired includes observable data that comes to the attention of the Group about the following loss events: i. significant financial difficulty of the issuer or obligor; ii. a breach of contract, such as a default or delinquency in interest or principal
payments; iii. the Group granting to the borrower, for economic or legal reasons relating to the
borrower’s financial difficulty, a concession that the lender would not otherwise consider;
iv. it becoming probable that the borrower will enter bankruptcy or other financial
reorganization; v. the disappearance of an active market for that financial asset because of financial
difficulties; or, vi. observable data indicating that there is a measurable decrease in the estimated
future cash flows from a group of financial assets since the initial recognition of those assets, although the decrease cannot yet be identified with the individual financial assets in the group, including: adverse changes in the payment status of borrowers in the group, or national or local economic conditions that correlate with defaults on the assets in the group.
(a) Assets Carried at Amortized Cost
The Group first assesses whether objective evidence of impairment exists individually for financial assets that are individually significant and individually or collectively for financial assets that are not individually significant. If the Group determines that no objective evidence of impairment exists for an individually assessed financial asset, whether significant or not, it includes the asset in a group of financial assets with similar credit risk characteristics and collectively assesses them for impairment. Assets that are individually assessed for impairment and for which an impairment loss is or continues to be recognized are not included in a collective assessment of impairment.

- 18 -
If there is objective evidence that an impairment loss on loans and receivable or held-to-maturity investments carried at amortized cost has been incurred, the amount of the loss is measured as the difference between the asset’s carrying amount and the present value of estimated future cash flows (excluding future credit losses that have not been incurred) discounted at the financial asset’s original effective interest rate. The carrying amount of the asset is reduced through the use of an allowance account and the amount of the loss is recognized in the statement of income. If a loan or held-to-maturity investment has a variable interest rate, the discount rate for measuring any impairment loss is the current effective interest rate determined under the contract. As a practical expedient, the Group may measure impairment on the basis of an instrument’s fair value using an observable market price.
The calculation of the present value of the estimated future cash flows of a collateralized financial asset reflects the cash flows that may result from foreclosure less costs for obtaining and selling the collateral, whether or not foreclosure is probable.
For the purpose of a collective evaluation of impairment, financial assets are grouped on the basis of similar credit risk characteristics (i.e., on the basis of the Group’s grading process that considers asset type, industry, geographical location, collateral type, past-due status and other relevant factors). Those characteristics are relevant to the estimation of future cash flows for groups of such assets by being indicative of the debtors’ ability to pay all amounts due according to the contractual terms of the assets being evaluated.
Future cash flows in a group of financial assets that are collectively evaluated for impairment are estimated on the basis of the contractual cash flows of the assets in the group and historical loss experience for assets with credit risk characteristics similar to those in the group. Historical loss experience is adjusted on the basis of current observable data to reflect the effects of current conditions that did not affect the period on which the historical loss experience is based and to remove the effects of conditions in the historical period that do not exist currently.
Estimates of changes in future cash flows for groups of assets should reflect and be directionally consistent with changes in related observable data from period to period (for example, changes in unemployment rates, property prices, payment status, or other factors indicative of changes in the probability of losses in the group and their magnitude). The methodology and assumptions used for estimating future cash flows are reviewed regularly by the Group to reduce any differences between loss estimates and actual loss experience.
When a loan/receivable is determined to be uncollectible, it is written off against the related allowance for impairment. Such loan/receivable is written off after all the prescribed procedures have been completed and the amount of the loss has been determined. Subsequent recoveries of amounts previously written off decrease the amount of impairment losses in the statement of income. If, in a subsequent period, the amount of the impairment loss decreases and the decrease can be related objectively to an event occurring after the impairment was recognized (such as an improvement in the debtor’s credit rating), the previously recognized impairment loss is reversed by adjusting the allowance account. The amount of the reversal is recognized in the statement of income.

- 19 -
(b) Assets Carried at Fair Value In the case of equity investments classified as available-for-sale, a significant or prolonged decline in the fair value of the security below its cost is considered in determining whether the assets are impaired. If any such evidence exists for available-for-sale financial assets, the cumulative loss – measured as the difference between the acquisition cost and the current fair value, less any impairment loss on that financial asset previously recognized in profit or loss – is removed from Capital Funds and recognized in the profit or loss. Impairment losses recognized in the statement of income on equity instruments are not reversed through the statement of income. If, in a subsequent period, the fair value of a debt instrument classified as available for sale increases and the increase can be objectively related to an event occurring after the impairment loss was recognized in profit or loss, the impairment loss is reversed through the statement of income.
(c) Assets Carried at Cost
If there is objective evidence of impairment for any of the unquoted equity securities and derivative assets linked to and required to be settled in such unquoted equity instruments, which are carried at cost, the amount of impairment loss is recognized. The impairment loss is the difference between the carrying amount of the equity security and the present value of the estimated future cash flows discounted at the current market rate of return of a similar asset. Impairment losses on assets carried at cost cannot be reversed.
2.7 Derivative Financial Instruments and Hedge Accounting The Parent Company is a party to various foreign currency forward contracts, cross currency swaps, futures, and interest rate swaps. These contracts are entered into as a service to customers and as a means of reducing or managing the Parent Company’s foreign exchange and interest rate exposures as well as for trading purposes. Amounts contracted are recorded as contingent accounts that are not included in the statement of financial position. Derivatives are initially recognized as Financial Assets at Fair Value Through Profit or Loss at fair value on the date on which a derivative contract is entered into and are subsequently remeasured at their fair value. Fair values are obtained from quoted market prices in active markets and valuation techniques, including discounted cash flow models and options pricing models, as appropriate. The change in fair value of derivative financial instruments is recognized in profit or loss, except when their effects qualify as a hedging instrument. All derivatives are carried as assets when fair value is positive and as liabilities when fair value is negative. The best evidence of the fair value of a derivative at initial recognition is the transaction price (i.e., the fair value of the consideration given or received) unless the fair value of that instrument is evidenced by comparison with other observable current market transactions in the same instrument (i.e., without modification or repackaging) or based on a valuation technique whose variables include only data from observable markets. When such evidence exists, the Parent Company and certain subsidiaries recognize the profits at initial recognition.

- 20 -
Certain derivatives embedded in other financial instruments, such as credit default swaps in a credit linked note, are treated as separate derivatives when their economic characteristics and risks are not closely related to those of the host contract and the host contract is not carried at fair value through profit or loss. These embedded derivatives are measured at fair value, with changes in fair value recognized in the profit or loss except for the embedded derivatives in CLNs linked to ROP bonds which were not bifurcated from the host contracts and were reclassified to loans and receivables as permitted by the BSP for prudential regulation and SEC for financial reporting purposes. Except for derivatives that qualify as a hedging instrument, changes in fair value of derivatives are recognized in profit and loss. For a derivative that is designated as a hedging instrument, the method of recognizing the resulting fair value gain or loss depends on the type of hedging relationship. The Parent Company designates certain derivatives as either: (a) hedges of the fair value of recognized assets or liabilities or firm commitments (fair value hedges); or (b) hedges of highly probable future cash flows attributable to a recognized asset or liability, or a forecasted transaction (cash flow hedge). Hedge accounting is used for derivatives designated in this way provided certain criteria are met. 2.8 Offsetting Financial Instruments Financial assets and liabilities are offset and the net amounts are reported in the statement of financial position when there is a legally enforceable right to offset the recognized amounts and there is an intention to settle on a net basis, or realize the asset and settle the liability simultaneously. 2.9 Bank Premises, Furniture, Fixtures and Equipment
Land is stated at cost. As no finite useful life for land can be determined, related carrying amount are not depreciated. All other bank premises, furniture, fixtures and equipment are stated at cost less accumulated depreciation, amortization and any impairment in value. The cost of an asset comprises its purchase price and directly attributable costs of bringing the asset to working condition for its intended use. Expenditures for additions, major improvements and renewals are capitalized; expenditures for repairs and maintenance are charged to expense as incurred. When assets are sold, retired or otherwise disposed of, their cost and related accumulated depreciation, amortization and impairment losses, if any, are removed from the accounts and any resulting gain or loss is reflected in income for the period. Depreciation is computed on the straight-line method over the estimated useful lives of the depreciable assets as follows:
Buildings 20-25 years Furniture, fixtures and equipment 3-15 years
Leasehold rights and improvements are amortized over the term of the lease or the estimated useful lives of the improvements, whichever is shorter. An asset’s carrying amount is written down immediately to its recoverable amount if the asset’s carrying amount is greater than its estimated recoverable amount (see Note 2.18).

- 21 -
The residual values and estimated useful lives of bank premises, furniture, fixtures and equipment are reviewed, and adjusted if appropriate, at each statement of financial position date. An item of bank premises, furniture, fixtures and equipment is derecognized upon disposal or when no future economic benefits are expected to arise from the continued use of the asset. Any gain or loss arising on derecognition of the asset (calculated as the difference between the net disposal proceeds and the carrying amount of the item) is included in the statement of income in the year the item is derecognized.
2.10 Investment Property Investment property pertains to land, buildings or condominium units acquired by the Group, in settlement of loans from defaulting borrowers through foreclosure or dacion in payment, and not held for sale in the next 12 months.
Investment property is initially recognized at cost, which includes acquisition price plus directly attributable cost incurred such as legal fees, transfer taxes and other transaction costs. Subsequent to initial recognition, investment property is stated at cost less accumulated depreciation and any impairment losses (see Note 2.18).
The Group adopted the cost model in measuring its investment property, hence, it is carried at cost less accumulated depreciation and any impairment in value. Depreciation and impairment loss are recognized in the same manner as in Bank Premises, Furniture, Fixtures and Equipment.
Investment property is derecognized upon disposal or when permanently withdrawn from use and no future economic benefit is expected from its disposal. Any gain or loss on the retirement or disposal of an investment property is recognized in the statement of income in the year of retirement or disposal.
2.11 Assets Held-for-Sale
Assets held-for-sale (presented as part of Other Resources) include real and other properties acquired through repossession or foreclosure or purchase that certain subsidiaries intend to sell within one year from the date of classification as held-for-sale. Assets classified as held-for-sale are measured at the lower of their carrying amounts, immediately prior to their classification as held-for-sale and their fair value less costs to sell. Assets classified as held-for-sale are not subject to depreciation or amortization. The profit or loss arising from the sale or revaluation of held-for-sale assets is included in the Other Operating Income (Expenses) account in the statement of income. 2.12 Intangible Assets
Intangible assets include goodwill, branch licenses, and computer software licenses. Goodwill represents the excess of the cost of acquisition over the fair value of the net assets acquired and branch licenses at the date of acquisition. Branch licenses, on the other hand, represent the rights given to the Parent Company to establish certain number of branches in the restricted areas in the country as incentive in acquiring a certain rural bank.

- 22 -
Goodwill is classified as intangible asset with indefinite useful life and, thus, not subject to amortization but would require an annual test for impairment. Goodwill is subsequently carried at cost less accumulated impairment losses. Goodwill is allocated to cash generating units for the purpose of impairment testing. Each of those cash generating units is represented by each primary reporting segment. Branch licenses are amortized over five years, its estimated useful life, starting from the year the branch is opened. Computer software licenses are capitalized on the basis of the costs incurred to acquire and bring to use the specific software. These costs are amortized on the basis of the expected useful lives (three to five years). Costs associated with developing or maintaining computer software programs are recognized as an expense as incurred. Costs that are directly associated with the production of identifiable and unique software products controlled by the Group, and that will probably generate economic benefits exceeding costs beyond one year, are recognized as intangible assets. Direct costs include software development employee costs and an appropriate portion of relevant overheads. Computer software development costs recognized as assets are amortized using the straight-line method over their useful lives (not exceeding five years). 2.13 Financial Liabilities
Financial liabilities include deposit liabilities, bills payable, bonds payable, subordinated debt, accrued interest and other expenses, and other liabilities. Financial liabilities are recognized when the Group becomes a party to the contractual agreements of the instrument. All interest-related charges are recognized as an expense in the statement of income. Financial liabilities are generally at their fair value at initial recognition and subsequently measured at amortized cost less settlement payments. Deposit liabilities are stated at amounts in which they are to be paid. Interest is accrued periodically and recognized in a separate liability account before recognizing as part of deposit liabilities. Bills payable, bonds payable and subordinated debt are recognized initially at fair value, which is the issue proceeds (fair value of consideration received) net of direct issue costs. Bills payable, bonds payable and subordinated debt are subsequently stated at amortized cost; any difference between the proceeds net of transaction costs and the redemption value is recognized in the statement of income over the period of the borrowings using the effective interest method. Preferred shares that carry mandatory coupons or are redeemable on a specific date or at the option of the shareholder, are classified as financial liabilities and are presented as part of Other Liabilities in the statement of financial position. The dividends on these preference shares are recognized in the statement of income as interest expense on an amortized cost basis using the effective interest method.

- 23 -
Derivative financial liabilities represent the cumulative changes in net fair value losses arising from the Group’s foreign currency forward transactions and interest rate swaps. Dividend distributions to shareholders are recognized as financial liabilities when the dividends are approved by the BSP. Financial liabilities are derecognized from the statement of financial position only when the obligations are extinguished either through discharge, cancellation or expiration. 2.14 Provisions
Provisions are recognized when present obligations will probably lead to an outflow of economic resources and they can be estimated reliably even if the timing or amount of the outflow may still be uncertain. A present obligation arises from the presence of a legal or constructive commitment that has resulted from past events. Provisions are measured at the estimated expenditure required to settle the present obligation, based on the most reliable evidence available at the end of the reporting period, including the risks and uncertainties associated with the present obligation. Where there are a number of similar obligations, the likelihood that an outflow will be required in settlement is determined by considering the class of obligations as a whole. When time value of money is material, long-term provisions are discounted to their present values using a pretax rate that reflects market assessments and the risks specific to the obligation. Provisions are reviewed at the end of each reporting period and adjusted to reflect the current best estimate. In those cases where the possible outflow of economic resource as a result of present obligations is considered improbable or remote, or the amount to be provided for cannot be measured reliably, no liability is recognized in the financial statements. Similarly, possible inflows of economic benefits to the Group that do not yet meet the recognition criteria of an asset are considered contingent assets, hence, are not recognized in the financial statements. On the other hand, any reimbursement that the Group can be virtually certain to collect from a third party with respect to the obligation is recognized as a separate asset not exceeding the amount of the related provision. Prior to 2007, Bankard, under a rewards program, offers monetized rewards to active cardholders. Provisions for rewards are recognized at a certain rate of cardholders’ credit card availments, determined by management based on redeemable amounts. The program was assumed by the Parent Company when Bankard sold certain assets, including credit card receivables, to the Parent Company.

- 24 -
2.15 Revenue and Cost Recognition
Revenue is recognized to the extent that it is probable that the economic benefits will flow to the Group and the revenue can be reliably measured. The following specific recognition criteria must also be met before revenue is recognized:
(a) Interest Income and Expenses are recognized in the statement of income for all
instruments measured at amortized cost using the effective interest method. The effective interest method is a method of calculating the amortized cost of a financial asset or a financial liability and of allocating the interest income or interest expense over the relevant period. The effective interest rate is the rate that exactly discounts estimated future cash payments or receipts through the expected life of the financial instrument or, when appropriate, a shorter period to the net carrying amount of the financial asset or financial liability. When calculating the effective interest rate, the Group estimates cash flows considering all contractual terms of the financial instrument (for example, prepayment options) but does not consider future credit losses. The calculation includes all fees and points paid or received between parties to the contract that are an integral part of the effective interest rate, transaction costs and all other premiums or discounts. Once a financial asset or a group of similar financial assets has been written down as a result of an impairment loss, interest income is recognized using the rate of interest used to discount the future cash flows for the purpose of measuring the impairment loss.
(b) Trading and Securities Gains (Losses) recognized when the ownership of the securities is transferred to the buyer (at an amount equal to the excess or deficiency of the selling price over the carrying amount of securities) and as a result of the mark-to-market valuation of certain securities at year-end.
(c) Commission and Other Income includes the following accounts:
(i) Finance charges are recognized on credit card revolving accounts, other than
those accounts classified as installment, as income as long as those outstanding account balances are not 90 days and over past due. Finance charges on installment accounts, first year and renewal membership fees are recognized as income when billed to cardholders. Purchases by cardholders which are collected on installment are recorded at the cost of items purchased.
(ii) Late payment fees are billed on delinquent credit card receivable balances until
179 days past due. These late payment fees are recognized as income upon collection.
(iii) Loan syndication fees are recognized upon completion of all syndication activities
and where there are no further obligations to perform under the syndication agreement. Service charges and penalties are recognized only upon collection or accrued where there is a reasonable degree of certainty as to its collectibility.

- 25 -
(iv) Discounts earned, net of interchange costs, are recognized as income upon presentation by member establishments of charges arising from Bankard and non-Bankard (associated with MasterCard, JCB and VISA labels) credit card availments passing through the Point of Sale (POS) terminals of Bankard. These discounts are computed based on agreed rates and are deducted from amounts remitted to member establishments. Interchange costs pertain to the other credit card companies’ share in Bankard’s merchant discounts whenever their issued credit cards transact in a Bankard POS terminal.
(v) Profit from assets sold or exchanged is recognized when the title to the acquired
assets is transferred to the buyer, or when the collectibility of the entire sales price is reasonably assured.
Cost and expenses are recognized in the statement of income upon utilization of the assets or services or at the date they are incurred. 2.16 Leases
The Group accounts for its leases as follows:
(a) Group as Lessee
Leases which transfer to the Group substantially all risks and benefits incidental to ownership of the leased item are classified as finance leases and are recognized as resources and liabilities in the statement of financial position at amounts equal at the inception of the lease to the fair value of the leased property or, if lower, at the present value of minimum lease payments. Lease payments are apportioned between the finance costs and reduction of the lease liability so as to achieve a constant rate of interest on the remaining balance of the liability. Finance costs are directly charged against income. Capitalized leased assets are depreciated over the shorter of the estimated useful life of the asset or the lease term. Leases which do not transfer to the Group substantially all the risks and benefits of ownership of the asset are classified as operating leases. Operating lease payments are recognized as expense in the statement of income on a straight-line basis over the lease term. Associated costs, such as maintenance and insurance, are expensed as incurred.
(b) Group as Lessor
Leases, wherein the Group substantially transfers to the lessee all risks and benefits incidental to ownership of the leased item, are classified as finance leases and are presented as receivable at an amount equal to the Group’s net investment in the lease. Finance income is recognized based on the pattern reflecting a constant periodic rate of return on the Group’s net investment outstanding in respect of the finance lease. Leases which do not transfer to the lessee substantially all the risks and benefits of ownership of the asset are classified as operating leases. Operating lease collections are recognized as income in the statement of income on a straight-line basis over the lease term.
- 26 -
The Group determines whether an arrangement is, or contains a lease based on the substance of the arrangement. It makes an assessment of whether the fulfillment of the arrangement is dependent on the use of a specific asset or assets and the arrangement conveys a right to use the asset.
2.17 Foreign Currency Transactions and Translations
(a) Transaction and Balances Except for the foreign subsidiaries and accounts from the Group’s foreign currency denominated unit (FCDU), the accounting records of the Group are maintained in
Philippine pesos. Foreign currency transactions during the period are translated into the functional currency at exchange rates which approximate those prevailing at transaction dates. Resources and liabilities denominated in foreign currencies are translated to Philippine pesos at prevailing Philippine Dealing System closing rates (PDSCR) at the statement of financial position date.
For financial reporting purposes, the accounts of the FCDU are translated into their
equivalents in Philippine pesos based on PDSCR prevailing at the end of the period (for resources and liabilities) and at the average PDSCR for the period (for income and expenses).
Foreign exchange gains and losses resulting from the settlement of such transactions
and from the translation at year-end exchange rates of monetary resources and liabilities denominated in foreign currencies are recognized in the statement of income, except when deferred in capital funds as qualifying cash flow hedges and qualifying net investment hedges. Translation differences on non-monetary items, such as equities held at fair value through profit or loss, are reported as part of the fair value gain or loss. Translation differences on non-monetary items, such as equities classified as available-for-sale securities, are recognized as part of the Revaluation Reserves on AFS Securities account presented in capital funds.
(b) Translation of Financial Statements of Foreign Subsidiaries
The results and financial position of all the foreign subsidiaries (none of which has the currency dependency of a hyperinflationary economy) that have a functional currency different from the presentation currency are translated into the presentation currency as follows: • Resources and liabilities for each statement of financial position presented are
translated at the closing rate at the date of that statement of financial position;
• Income and expenses for each statement of income are translated at average exchange rates during the year (unless this average is not a reasonable approximation of the cumulative effect of the rates prevailing on the transactions’ dates, in which case income and expenses are translated at the dates of the transactions); and
• All resulting exchange differences are recognized as a separate component of capital funds.

- 27 -
On consolidation, exchange differences arising from the translation of the net investment in foreign entities are taken to Capital Funds. When a foreign operation is sold, such exchange differences are recognized in the statement of income as part of the gain or loss on sale. The translation on the financial statements into Philippine peso should not be construed as a representation that the amounts stated in currencies other than the Philippine peso could be converted in Philippine peso amounts at the translation rates or at any other rates of exchange.
2.18 Impairment of Non-financial Assets The Group’s investments in associates, bank premises, furniture, fixtures and equipment, investment property and other resources (including intangible assets) are subject to impairment testing. Intangible assets with an indefinite useful life or those not yet available for use are tested for impairment at least annually. All other individual assets or cash-generating units are tested for impairment whenever events or changes in circumstances indicate that the carrying amount may not be recoverable. For purposes of assessing impairment, assets are grouped at the lowest levels for which there are separately identifiable cash flows (cash-generating units). As a result, some assets are tested individually for impairment and some are tested at cash-generating unit level. An impairment loss is recognized for the amount by which the asset or cash-generating unit’s carrying amount exceeds its recoverable amount. The recoverable amount is the higher of fair value, reflecting market conditions less costs to sell and value in use, based on an internal discounted cash flow evaluation. Impairment loss is charged pro rata to the other assets in the cash generating unit. All assets are subsequently reassessed for indications that an impairment loss previously recognized may no longer exist and the carrying amount of the asset is adjusted to the recoverable amount resulting in the reversal of the impairment loss. 2.19 Employee Benefits (a) Post-employment Benefits
Post-employment benefits are provided to employees through a defined benefit plan,
as well as defined contribution plans. A defined benefit plan is a post-employment plan that defines an amount of post-employment benefit that an employee will receive on retirement, usually
dependent on one or more factors such as age, years of service and salary. The legal obligation for any benefits from this kind of post-employment plan remains with the Group, even if plan assets for funding the defined benefit plan have been acquired. Plan assets may include assets specifically designated to a long-term benefit fund, as well as qualifying insurance policies. The Group’s post-employment defined benefit pension plan covers all regular full-time employees. The pension plan is tax-qualified, noncontributory and administered by a trustee.

- 28 -
The asset recognized in the statement of financial position for post-employment defined benefit pension plans is the present value of the defined benefit obligation (DBO) at the end of the reporting period less the fair value of plan assets, together with adjustments for unrecognized actuarial gains or losses and past service costs. The DBO is calculated by independent actuaries using the projected unit credit method. The present value of the DBO is determined by discounting the estimated future cash outflows using interest rates of high quality corporate bonds that are denominated in the currency in which the benefits will be paid and that have terms to maturity approximating the terms of the related pension liability.
Actuarial gains and losses are not recognized as an expense unless the total unrecognized gain or loss exceeds 10% of the greater of the obligation and related plan assets. The amount exceeding this 10% corridor is charged or credited to profit or loss over the employees’ expected average remaining working lives. Actuarial gains and losses within the 10% corridor are disclosed separately. Past-service costs are recognized immediately in the statement of income, unless the changes to the pension plan are conditional on the employees remaining in service for a specified period of time (the vesting period). In this case, the past service costs are amortized on a straight-line basis over the vesting period.
A defined contribution plan is a pension plan under which the Group pays fixed
contributions into an independent entity such as the Social Security System. The Group has no legal or constructive obligations to pay further contributions after payment of the fixed contribution. The contributions recognized in respect of defined contribution plans are expensed as they fall due. Liabilities and assets may be recognized if underpayment or prepayment has occurred and are included in current liabilities or current assets as they are normally of a short term nature.
(b) Termination Benefits
Termination benefits are payable when employment is terminated by the Group before the normal retirement date, or whenever an employee accepts voluntary redundancy in exchange for these benefits. The Group recognizes termination benefits when it is demonstrably committed to either: (i) terminating the employment of current employees according to a detailed formal plan without possibility of withdrawal; or (ii) providing termination benefits as a result of an offer made to encourage voluntary redundancy. Benefits falling due more than 12 months after the end of each reporting period are discounted to present value.
(c) Profit-sharing and Bonus Plans
The Group recognizes a liability and an expense for bonuses, based on a formula that is fixed regardless of the Group’s income after certain adjustments and does not take into consideration the profit attributable to the Group’s shareholders. The Group recognizes a provision where it is contractually obliged to pay the benefits, or where there is a past practice that has created a constructive obligation.
(d) Compensated Absences
Compensated absences are recognized for the number of paid leave days
(including holiday entitlement) remaining at the end of the reporting period. They are included in the Accrued Taxes, Interest and Other Expenses account at the undiscounted amount that the Group expects to pay as a result of the unused entitlement.

- 29 -
2.20 Income Taxes
Tax expense recognized in profit or loss comprises the sum of deferred tax and current tax not recognized in other comprehensive income or directly in capital funds, if any. Current tax assets or liabilities comprise those claims from, or obligations to, tax authorities relating to the current or prior reporting period, that are unpaid at the reporting period. They are calculated according to the tax rates and tax laws applicable to the periods to which they relate, based on the taxable profit for the year. All changes to current tax assets or liabilities are recognized as a component of Tax Expense in the statement of income. Deferred tax is provided, using the liability method on temporary differences at the end of the reporting period between the tax bases of assets and liabilities and their carrying amounts for financial reporting purposes. Under the liability method, with certain exceptions, deferred tax liabilities are recognized for all taxable temporary differences and deferred tax assets are recognized for all deductible temporary differences and the carryforward of unused tax losses and unused tax credits to the extent that it is probable that taxable profit will be available against which the deferred tax assets can be utilized. The carrying amount of deferred tax assets is reviewed at each statement of each reporting period and reduced to the extent that it is probable that sufficient taxable profit will be available to allow all or part of the deferred tax assets to be utilized. Deferred tax assets and liabilities are measured at the tax rates that are expected to apply to the period when the asset is realized or the liability is settled provided such tax rates have been enacted or substantively enacted at the end of the reporting period. Most changes in deferred tax assets or liabilities are recognized as a component of tax expense in profit or loss. Only changes in deferred tax assets or liabilities that relate to items recognized in other comprehensive income or directly in capital funds are recognized in other comprehensive income or directly in capital funds. 2.21 Related Parties
Parties are considered related when one party has the ability, directly or indirectly, to control the other party or exercise significant influence over the other party in making financial and operating decisions. Parties are also considered to be related if they are subject to common control or common significant influence. Related parties may be individuals or corporate entities. 2.22 Capital Funds
Preferred and common stocks represent the nominal value of shares that have been issued. Treasury shares are stated at the cost of reacquiring such shares. Hybrid perpetual securities reflect the net proceeds from the issuance of non-cumulative step-up callable perpetual securities.

- 30 -
Capital paid in excess of par includes any premiums received on the issuance of capital stocks. Any transaction costs associated with the issuance of shares are deducted from additional paid-in capital, net of any related income tax benefits. Revaluation reserves on available-for-sale securities pertain to changes in the fair values of available-for-sale securities resulting in net gains and losses as a result of the revaluation of available-for-sale financial assets. Revaluation increment in property of an associate consists of gains arising from the revaluation of land. Accumulated translation adjustment represents the cumulative gain from the translation of the financial statements of foreign subsidiaries whose functional currency is different to that of the Group. Reserve for trust business represents the accumulated amount set aside under existing regulations requiring the Parent Company and a subsidiary to carry to surplus 10% of its net profits accruing from trust business until the surplus shall amount to 20% of authorized capital stock. The reserve shall not be paid out in dividends, but losses accruing in the course of the trust business may be charged against this account. Other reserves refers to the amount attributable to the Parent Company arising from the change in the ownership of the non-controlling interest in the Parent Company’s subsidiary. Share in additional paid-in capital of an associate represents the share of the Parent Company in the additional paid-in capital of an associate accounted for under the equity method in the consolidated financial statements. Surplus includes all current and prior period results as disclosed in the statement of income. Non-controlling interests represent the portion of the net assets and profit or loss not attributable to the Group and are presented separately in the Group statement of income and statement of comprehensive income and within capital funds in the Group statements of financial position and changes in capital funds. 2.23 Earnings Per Share
Basic earnings per share is determined by dividing the net profit for the year attributable to common shareholders by the weighted average number of common shares outstanding during the year, after giving retroactive effect to any stock dividends declared in the current year.
Diluted earnings per common share is also computed by dividing net profit by the weighted average number of common shares subscribed and issued during the period. However, net profit attributable to common shares and the weighted average number of common shares outstanding are adjusted to reflect the effects of potentially dilutive convertible preferred shares. Convertible preferred shares are deemed to have been converted into common shares at the issuance of preferred shares.

- 31 -
2.24 Trust Activities The Group commonly acts as trustee and in other fiduciary capacities that result in the holding or placing of assets on behalf of individuals, trusts, retirement benefit plans and other institutions. These assets and income arising thereon are excluded from these financial statements, as they are not assets of the Group. 2.25 Subsequent Events
Any post-year-end event that provides additional information about the Group’s position at the statement of financial position date (adjusting event) is reflected in the financial statements. Post-year-end events that are not adjusting events, if any, are disclosed when material to the financial statements.
3. SIGNIFICANT ACCOUNTING JUDGMENTS AND ESTIMATES
The Group’s financial statements prepared in accordance with FRSPB and PFRS require management to make judgments and estimates that affect amounts reported in the financial statements and related notes. Judgments and estimates are continually evaluated and are based on historical experience and other factors, including expectations of future events that are believed to be reasonable under the circumstances. Actual results may ultimately vary from these estimates. 3.1 Critical Management Judgments in Applying Accounting Policies
In the process of applying the Group’s and the Parent Company’s accounting policies, management has made the following judgments, apart from those involving estimation, which have the most significant effect on the amounts recognized in the financial statements.
(a) Held-to-maturity Investments
The Group follows the guidance of PAS 39, Financial Instruments: Recognition and Measurement, in classifying non-derivative financial assets with fixed or determinable payments and fixed maturity as held-to-maturity. This classification requires significant judgment. In making this judgment, the Group evaluates its intention and ability to hold such investments to maturity. If the Group fails to keep these investments at maturity other than for the allowed specific circumstances – for example, selling a not insignificant amount close to maturity – it will be required to reclassify the entire class to available-for-sale securities. However, the tainting provision will not apply if the sales or reclassifications of held-to-maturity investments are so close to maturity or the financial asset’s call date that changes in the market rate of interest would not have a significant effect on the financial asset’s fair value; or occurs after the Group has collected substantially all of the financial asset’s original principal through scheduled payments or prepayments; or are attributable to an isolated event that is beyond the control of the Group, is nonrecurring and could not have been reasonably anticipated by the Group. The investments would therefore be measured at fair value and not at amortized cost. In October 2008, the Group was permitted by the BSP and SEC to reclassify certain financial assets previously classified under AFS category due to the tainting of HTM portfolio back to HTM category (see Note 9).

- 32 -
(b) Impairment of Available-for-sale Securities
The Group also follows the guidance of PAS 39 on determining when an investment is other-than-temporarily impaired. This determination requires significant judgment. In making this judgment, the Group evaluates, among other factors, the duration and extent to which the fair value of an investment is less than its cost; and the financial health of and near-term business outlook for the investee, including factors such as industry and sector performance, changes in technology and operational and financing cash flow. For investments issued by counterparty under bankcruptcy, the Group determines permanent impairment based on the price of the most recent transaction and on latest indications obtained from reputable counterparties (which regularly quotes prices for distressed securities) since current bid prices are no longer available. The Group recognized allowance for impairment on its available-for-sale securities amounting to P1,336,264 and P1,276,157 in 2009 in the consolidated and Parent Company financial statements, respectively, and P811,207 in 2008 both in the consolidated and Parent Company’s financial statements (see Note 10).
(c) Distinction Between Investment Property and Owner-occupied Properties
The Group determines whether a property qualifies as investment property. In making its judgment, the Group considers whether the property generated cash flows largely independently of the other assets held by an entity. Owner-occupied properties generate cash flows that are attributable not only to property but also to other assets used in the production or supply process. Some properties comprise a portion that is held to earn rental or for capital appreciation and another portion that is held for use in the production and supply of goods and services or for administrative purposes. If these portion can be sold separately (or leased out separately under finance lease), the Group accounts for the portions separately. If the portion cannot be sold separately, the property is accounted for as investment property only if an insignificant portion is held for use in operations or for administrative purposes. Judgment is applied in determining whether ancillary services are so significant that a property does not qualify as investment property. The Group considers each property separately in making its judgment.
(d) Operating and Finance Leases
The Group has entered into various lease agreements as either a lessor or lessee. Critical judgment was exercised by management to distinguish each lease agreement as either an operating or finance lease by looking at the transfer or retention of significant risk and rewards of ownership of the properties covered by the agreements. Failure to make the right judgment will result in either overstatement or understatement of assets and liabilities.

- 33 -
(e) Classification of Acquired Properties and Fair Value Determination of Assets Held- for-Sale and Investment Property
The Group classifies its acquired properties as Bank Premises, Furniture, Fixtures and Equipment if used in operations, as Assets Held-for-sale if the Group expects that the properties will be recovered through sale rather than use, as Investment Property if the Group intends to hold the properties for capital appreciation or as Financial Assets in accordance with PAS 39. At initial recognition, the Group determines the fair value of acquired properties through internally and externally generated appraisal. The appraised value is determined based on the current economic and market conditions, as well as the physical condition of the property.
(f) Provisions and Contingencies
Judgment is exercised by management to distinguish between provisions and contingencies. Policies on recognition and disclosure of provision and disclosure of contingencies are discussed in Note 2.14 and relevant disclosures are presented in Note 31.
3.2 Key Sources of Estimation Uncertainty
The following are the key assumptions concerning the future, and other key sources of estimation uncertainty at the statement of financial position date, that have a significant risk of causing a material adjustment to the carrying amounts of assets and liabilities within the next financial year.
(a) Impairment Losses on Financial Assets (Loans and Receivables and Held-to-maturity
Investments)
The Group reviews its loans and receivables and held-to-maturity investments portfolios to assess impairment at least on an annual basis. In determining whether an impairment loss should be recorded in the statement of income, the Group makes judgments as to whether there is any observable data indicating that there is a measurable decrease in the estimated future cash flows from the portfolio before the decrease can be identified with an individual item in that portfolio. This evidence may include observable data indicating that there has been an adverse change in the payment status of borrowers or issuers in a group, or national or local economic conditions that correlate with defaults on assets in the group. Management uses estimates based on historical loss experience for assets with credit risk characteristics and objective evidence of impairment similar to those in the portfolio when scheduling its future cash flows. The methodology and assumptions used for estimating both the amount and timing of future cash flows are reviewed regularly to reduce any differences between loss estimates and actual loss experience.
Impairment losses on loans and receivables, net of recoveries, amounted to P1,661,931 in 2009, P873,545 in 2008 and P942,490 in 2007 in the consolidated financial statements; and P1,156,333 in 2009, P830,597 in 2008 and P680,535 in 2007 in the Parent Company financial statements (see Note 11).

- 34 -
(b) Valuation of Financial Assets Other than Loans and Receivables
The Group carries certain financial assets at fair value, which requires the extensive use of accounting estimates and judgment. In cases when active market quotes are not available, fair value is determined by reference to the current market value of another instrument which is substantially the same or is calculated based on the expected cash flows of the underlying net base of the instrument. The amount of changes in fair value would differ if the Group utilized different valuation methods and assumptions. Any change in fair value of these financial assets and liabilities would affect profit or loss and other comprehensive income.
The Group recognized the change in value of financial assets at fair value through
profit or loss resulting to an increase of P39,227 in 2009, P1,557,064 decrease in 2008, and P86,769 increase in 2007; and P10,376 increase in 2009, P1,316,222 decrease in 2008, and P80,504 increase in 2007; in the consolidated and Parent Company financial statements, respectively. The changes in fair values from available-for-sale securities that were reported in the statement of comprehensive income amounted to fair value gains of P1,975,773 in 2009, fair value losses of P2,601,102 in 2008 and P1,875,304 in 2007 in the consolidated financial statements; and fair value gains of P1,807,029 in 2009 and fair value losses of P2,328,671 in 2008 and P1,769,582 in 2007 in the Parent Company financial statements. The carrying values of the assets are disclosed in Notes 8 and 10, respectively.
(c) Useful Lives of Bank Premises, Furniture, Fixtures and Equipment and Investment Property
The Group estimates the useful lives of bank premises, furniture, fixtures and equipment and investment property based on the period over which the assets are expected to be available for use. The estimated useful lives of bank premises, furniture, fixtures and equipment and investment property are reviewed periodically and are updated if expectations differ from previous estimates due to physical wear and tear, technical or commercial obsolescence and legal or other limits on the use of the assets. The carrying amount of bank premises, furniture, fixtures and equipment and investment property are analyzed in Notes 13 and 14, respectively. Based on management’s assessment as at December 31, 2009, there are no changes in the useful lives of bank premises, furniture, fixtures and equipment and investment property during the period. Actual results, however, may vary due to changes in estimates brought about by changes in factors mentioned above.

- 35 -
(d) Fair Values of Financial Assets and Liabilities
The following table summarizes the carrying amounts and fair values of those significant financial assets and liabilities not presented on the statement of financial position at their fair value.
Consolidated
2009 2008 Carrying Carrying Amount Fair Value Amount Fair Value
Due from BSP P 19,321,339 P 19,321,339 P 16,390,973 P 16,390,973 Due from other banks 3,066,922 3,066,922 4,862,225 4,862,225 Held-to-maturity investments 19,962,360 20,973,194 20,673,614 19,483,613 Loans and receivables 164,892,417 164,948,621 164,402,907 164,306,650 Deposit liabilities:
Demand 11,034,257 11,034,257 11,125,069 11,125,069 Savings 93,571,654 93,571,654 75,738,446 75,738,446 Time 115,671,983 115,671,983 109,363,471 109,363,471
Bills payable 10,780,964 10,780,964 21,452,609 21,452,609 Bonds payable 5,836,076 5,870,927 6,002,821 6,168,088 Subordinated debt 10,926,978 11,176,735 6,941,899 6,923,354
Parent
2009 2008 Carrying Carrying Amount Fair Value Amount Fair Value
Due from BSP P 17,914,204 P 17,914,204 P 15,656,119 P 15,656,119 Due from other banks 1,788,841 1,788,841 3,197,593 3,197,593 Held-to-maturity investments 17,638,584 18,649,418 17,892,114 16,764,396 Loans and receivables 131,733,336 131,472,666 130,292,206 130,195,949 Deposit liabilities
Demand 8,535,205 8,535,205 8,392,524 8,392,524 Savings 81,165,706 81,165,706 66,269,393 66,269,393 Time 90,852,468 90,852,468 84,267,161 84,267,161
Bills payable 10,535,173 10,535,173 21,410,087 21,410,087 Bonds payable 5,836,076 5,870,927 6,002,821 6,168,088 Subordinated debt 10,926,978 11,176,735 6,941,899 6,923,354 See Notes 2.5 and 2.13 for a description of the accounting policies for each category of financial instrument. A description of the Group’s risk management objectives and policies for financial instruments is provided in Note 4.
(e) Fair Value of Derivatives
The fair value of derivative financial instruments that are not quoted in an active market are determined through valuation techniques using the net present value computation.
Valuation techniques are used to determine fair values which are validated and periodically reviewed. To the extent practicable, models use observable data, however, areas such as credit risk (both own and counterparty), volatilities and correlations require management to make estimates. Changes in assumptions could affect reported fair value of financial instruments. The Group uses judgment to select a variety of methods and make assumptions that are mainly based on market conditions existing at the end of each reporting period.

- 36 -
(f) Realizable Amount of Deferred Tax Assets
The Group reviews its deferred tax assets at the end of each reporting period and reduces the carrying amount to the extent that it is no longer probable that sufficient taxable profit will be available to allow all or part of the deferred tax asset to be utilized. The carrying value of deferred tax assets as of December 31, 2009 and 2008 is disclosed in Note 28.
(g) Impairment of Non-financial Assets
Except for intangible assets with indefinite useful lives, PFRS requires that an impairment review be performed when certain impairment indicators are present. The Group’s policy on estimating the impairment of non-financial assets is discussed in detail in Note 2.18. Though management believes that the assumptions used in the estimation of fair values reflected in the financial statements are appropriate and reasonable, significant changes in these assumptions may materially affect the assessment of recoverable values and any resulting impairment loss could have a material adverse effect on the results of operations.
(h) Retirement Benefits The determination of the Group’s obligation and cost of pension and other retirement benefits is dependent on the selection of certain assumptions used by actuaries in calculating such amounts. Those assumptions are described in Note 25 and include, among others, discount rates, expected return on plan assets and salary increase rate. In accordance with PFRS, actual results that differ from the assumptions are accumulated and amortized over future periods and therefore, generally affect the recognized expense and recorded obligation in such future periods. The retirement benefit asset and net unrecognized actuarial losses amounted to P71,103 and P267,511, respectively, in the 2009 consolidated financial statements, and P75,583 and P168,676, respectively, in the 2008 consolidated financial statements. The retirement benefit asset and net unrecognized actuarial losses amounted to P40,434 and P295,427, respectively, in the 2009 Parent Company financial statements, and P36,225 and P257,339, respectively, in the 2008 Parent Company financial statements. Fair value of plan assets amounted to P1,761,844 and P1,167,540 in the 2009 and 2008 consolidated financial statements, respectively, and P1,323,988 and P772,209 in the 2009 and 2008 Parent Company financial statements, respectively (see Note 25).
4. RISK MANAGEMENT POLICIES AND OBJECTIVES
The Group is exposed to a variety of risks that are particular to its operating, investing, and financing activities, and the business environment in which it operates. As such, the Group’s risk management is closely coordinated with those charged with governance and focuses on identifying, measuring, monitoring, and controlling the various risks that arise from its business activities and ensuring the Group’s strict adherence to the policies, procedures, and control systems which are established to address these risks.
- 37 -
4.1 Parent Company’s and RSB’s Strategy in Using Financial Instruments Majority of the Group’s operating, investing and financing activities are undertaken by the Parent Company and RSB, its subsidiary savings bank. It is the Parent Company’s and RSB’s intent to generate returns mainly from their traditional financial intermediation and service-provision activities, rather than from any substantial positions based on views of the financial markets. The main source of risk, therefore, remains to be that arising from credit risk exposures. Nevertheless, within BSP regulatory constraints, and subject to limits and parameters established by the BOD, the Parent Company and RSB are exposed to liquidity risk and interest rate risk inherent in the statement of financial position, and other market risks, which include foreign exchange risk. In the course of performing financial intermediation function, the Parent Company and RSB accept deposits from customers at fixed and floating rates, for various periods, and seek to earn above-average interest margins by investing these funds in high-quality assets. Given a normal upward-sloping yield curve, a conventional strategy to enhance margin is the investment of short-term funds in longer-term assets, including fixed-income securities. While, in doing so, the Parent Company and RSB maintain liquidity at prudent levels to meet all claims that fall due, the Parent Company and RSB fully recognize the consequent interest rate risk exposure. Foreign exchange risk arises from the Parent Company’s and RSB’s net foreign exchange positions. The investment portfolio is composed mainly of marketable, sovereign-risk fixed-income securities. It also includes a small portfolio of equity securities and a modest exposure to credit derivatives, in most of which the underlying is Republic of the Philippines sovereign debt. Other than aforementioned derivatives, short-term foreign currency forward contracts are used mostly in the context of swap transactions where an offsetting spot position is taken at the same time. There are outstanding long-term, cross-currency swaps where the Parent Company is committed to pay fixed-rate interest and principal in US dollars and is entitled to receive fixed-rate interest and principal in pesos. But these closely match, in terms of interest rate characteristics, tenor and amount, the local currency Subordinated Debt issued in 2003 which was redeemed in 2008 on one hand, and certain foreign currency denominated assets on the other. A committee system is a fundamental part of the Parent Company’s and RSB’s process of managing risk. Three committees of the BOD are relevant in this context: • The Executive Committee, which meets weekly, approves credit policies and
decides on large counter-party credit facilities and limits.
• The Risk Management Committee (RMC), which meets monthly, carries out the BOD’s oversight responsibility for risk management, covering credit, market and operational risk. Market risk limits are reviewed and approved by the RMC.
• The Audit Committee, which meets monthly, reviews results of Internal Audit examinations and recommends remedial actions to the BOD as appropriate.
- 38 -
Two senior management committees also provide a regular forum, at a lower-level, to take up risk issues:
• The Credit and Collection Committee, chaired by the Chief Executive Officer and composed of the heads of credit risk-taking business units and the head of credit risk management, meets weekly to review and approve credit exposures within its authority. It also reviews plans and progress on the resolution of problem loan accounts.
• The Asset/Liability Committee (ALCO), chaired by the Treasurer of the Parent Company but with the Chief Executive Officer and key business and support unit heads including the President of RSB participating, meets weekly to appraise market trends, and economic and political developments. It provides direction in the management of interest rate risk, liquidity risk, foreign currency risk, and trading and investment portfolio decisions. It sets prices/rates for various asset and liability and trading products, in light of funding costs and competitive and other market conditions. It receives confirmation that market risk limits (as described in Note 4.3 are not breached; or if breached, provides guidance on the handling of the relevant risk exposure.
The Parent Company established a Corporate Risk Management Services (CRISMS) group, headed by a chief risk officer, to ensure that the objectives of risk identification, measurement and/or assessment, mitigation, and monitoring are pursued via practices commensurate with the risk profile. CRISMS is independent of all risk-taking business segments and reports directly to the BOD’s RMC. It participates in the Credit and Collection Committee (through the head of credit risk management) and in ALCO. In addition to the risk management systems and controls, the Parent Company and RSB hold capital commensurate with the levels of risk they undertake (see Note 5.1) in accordance with minimum regulatory capital requirements. 4.2 Liquidity Risk
Liquidity risk is the potential insufficiency of funds available to meet the credit demands of the Parent Company’s and RSB’s customers and repay maturing liabilities. The Parent Company and RSB manage liquidity risk by limiting the maturity mismatch between assets and liabilities, and by holding sufficient liquid assets of appropriate quality and marketability. The Parent Company and RSB recognize the liquidity risk inherent in their activities, and identify, measure, monitor and control the liquidity risk inherent as financial intermediaries. The Parent Company’s and RSB’s liquidity policy is to manage its operations to ensure that funds available are more than adequate to meet credit demands of its customers and to enable deposits to be repaid on maturity. The Parent Company’s and RSB’s liquidity policies and procedures are set out in its funding and liquidity plan which contains certain funding requirement based on assumptions and uses asset and liability maturity gap analysis.

- 39 -
The gap analyses (before elimination of intercompany accounts/transactions) as of December 31, 2009 and 2008 in accordance with account classification of the BSP are presented below (amounts in millions). Parent and RSB 2009 One to Three One to More Three Months to Five Than Five Months One Year Years Years Non-maturity Total Resources: Cash P 427 P - P - P - P 6,365 P 6,792 Cash equivalents 5,077 371 - - 17,504 22,952 Loans and receivables 32,025 15,548 18,551 8,087 91,193 165,404 Investments 35,223 139 5,963 17,725 18,383 77,433 Other resources 132 67 258 18 20,078 20,553 Total resources 72,884 16,125 24,772 25,830 153,523 293,134 Liabilities: Deposits liabilities 16,611 666 728 - 203,648 221,653 Bills payable and due to other banks 7,201 2,573 12 749 - 10,535 Bonds payable 5,836 - - - - 5,836 Subordinated debt - - 10,927 - - 10,927 Other liabilities 3,158 10 - - 8,818 11,986 Total liabilities 32,806 3,249 11,667 749 212,466 260,937 Capital funds - - - - 33,335 33,335
Total liabilities and capital
funds 32,806 3,249 11,667 749 245,801 294,272
On-book gap 40,078 12,876 13,105 25,081 ( 92,278 ) ( 1,138 ) Cumulative on-book gap 40,078 52,954 66,059 91,140 ( 1,138 ) -
Contingent resources 70,378 25,499 334 - - 96,211 Contingent liabilities 80,422 25,716 329 - 3,656 110,123 Total gap ( 10,044 ) ( 217 ) 5 - ( 3,656 ) ( 13,912 ) Cumulative off-book gap ( 10,044 ) ( 10,261 ) ( 10,256 ) ( 10,256 ) ( 13,912 ) -
Cumulative total gap P 30,034 P 42,693 P 55,803 P 80,884 ( P 15,050 ) P -

- 40 -
Parent and RSB 2008 One to Three One to More Three Months to Five Than Five Months One Year Years Years Non-maturity Total Resources: Cash P 1,202 P - P - P - P 5,588 P 6,790 Cash equivalents 5,645 - - - 15,723 21,368 Loans and receivables 38,683 11,028 22,661 17,443 86,203 176,018 Investments 17,110 2,342 11,089 16,075 9,020 55,636 Other resources 298 53 179 114 23,591 24,235 Total resources 62,938 13,423 33,929 33,632 140,125 284,047 Liabilities: Deposits liabilities 44,142 13,766 3,771 - 136,292 197,971 Bills payable and due to other banks 11,451 5,902 3,321 771 1 21,446 Bonds payable - - - 6,003 - 6,003 Subordinated debt - 6,942 - - - 6,942 Other liabilities 3,988 10 - - 5,445 9,443 Total liabilities 59,581 26,620 7,092 6,774 141,738 241,805 Capital funds - - - - 30,674 30,674
Total liabilities and capital
funds 59,581 26,620 7,092 6,774 172,412 272,479
On-book gap 3,357 ( 13,197 ) 26,837 26,858 ( 32,287 ) 11,568 Cumulative on-book gap 3,357 ( 9,840 ) 16,997 43,855 11,568 -
Contingent resources 44,951 3,760 549 - - 49,260 Contingent liabilities 25,487 3,702 2,447 - 3,021 34,657 Total gap 19,464 58 ( 1,898 ) - ( 3,021 ) 14,603 Cumulative off-book gap 19,464 19,522 17,624 17,624 14,603 -
Cumulative total gap P 22,821 P 9,682 P 34,621 P 61,479 P 26,171 P -

- 41 -
Parent Only 2009 One to Three One to More Three Months to Five Than Five Months One Year Years Years Non-maturity Total Resources : Cash P 414 P - P - P - P 4,994 P 5,408 Cash equivalents 1,828 371 - - 17,504 19,703 Loans and receivables 27,624 8,291 75 6,018 89,725 131,733 Investments 31,161 139 5,585 16,339 15,410 68,634 Other resources - - - - 17,122 17,122 Total resources 61,027 8,801 5,660 22,357 144,755 242,600 Liabilities: Deposits liabilities 15,857 603 679 - 163,414 180,553 Bills payable and due to other banks 7,201 2,573 12 749 - 10,535 Bonds payable 5,836 - - - - 5,836 Subordinated debt - - 10,927 - - 10,927 Other liabilities 2,128 10 - - 6,079 8,217 Total liabilities 31,022 3,186 11,618 749 169,493 216,068 Capital funds - - - - 26,532 26,532
Total liabilities and capital
funds 31,022 3,186 11,618 749 196,025 242,600
On-book gap 30,005 5,615 ( 5,958 ) 21,608 ( 51,270 ) - Cumulative on-book gap 30,005 35,620 29,662 51,270 - -
Contingent resources 70,378 25,499 334 - - 96,211 Contingent liabilities 75,238 25,716 329 - 3,656 104,939 Total gap ( 4,860 ) ( 217 ) 5 - ( 3,656 ) ( 8,728 ) Cumulative off-book gap ( 4,860 ) ( 5,077 ) ( 5,072 ) ( 5,072 ) ( 8,728 ) -
Cumulative total gap P 25,145 P 30,543 P 24,590 P 46,198 ( P 8,728 ) P -

- 42 -
Parent Only 2008 One to Three One to More Three Months to Five Than Five Months One Year Years Years Non-maturity Total Resources : Cash P 8 P - P - P - P 5,588 P 5,596 Cash equivalents 3,553 - - - 15,301 18,854 Loans and receivables 35,334 2,810 2,197 5,539 84,412 130,292 Investments 16,980 1,948 9,977 14,388 9,072 52,365 Other resources - - - - 18,744 18,744 Total resources 55,875 4,758 12,174 19,927 133,117 225,851 Liabilities: Deposits liabilities 23,415 12,142 30 - 123,342 158,929 Bills payable and due to other banks 11,416 5,902 3,321 771 1 21,411 Bonds payable - - - 6,003 - 6,003 Subordinated debt - 6,942 - - - 6,942 Other liabilities 3,604 10 - - 4,318 7,932 Total liabilities 38,435 24,996 3,351 6,774 127,661 201,217 Capital funds - - - - 24,634 24,634
Total liabilities and capital
funds 38,435 24,996 3,351 6,774 152,295 225,851
On-book gap 17,440 ( 20,238 ) 8,823 13,153 ( 19,178 ) - Cumulative on-book gap 17,440 ( 2,798 ) 6,025 19,178 - -
Contingent resources 44,951 3,760 549 - - 49,260 Contingent liabilities 25,485 3,702 2,447 - 1,235 32,869 Total gap 19,466 58 ( 1,898 ) - ( 1,235 ) 16,391 Cumulative off-book gap 19,466 19,524 17,626 17,626 16,391 -
Cumulative total gap P 36,906 P 16,726 P 23,651 P 36,804 P 16,391 P - Pursuant to applicable BSP regulations, the Parent Company and RSB are required to maintain liquidity reserve and statutory legal reserve which are based on a certain percentages of deposits. A portion of the required reserve must be deposited with BSP. The remaining portion of the required reserve may be held by the Parent Company and RSB in the form of cash in vault and or government securities. Under a current BSP circular, the liquidity reserve is required to be in the form of reserve deposits with the BSP. The BSP also requires the Parent Company and RSB to maintain asset cover of 100% for foreign currency liabilities of their FCDU, of which 30% must be in liquid assets.

- 43 -
4.2.1 Foreign Currency Liquidity Management The liquidity risk management policies and objectives described also apply to the management of any foreign currency to which the Parent Company and RSB maintain significant exposure. Specifically, the Parent Company and RSB ensure that their measurement, monitoring, and control systems account for these exposures as well. The Parent Company and RSB set and regularly review limits on the size of their cash flow mismatches for each significant individual currency and in aggregate over appropriate time horizons. The Parent Company and RSB also assess their access to foreign exchange markets when setting up their risk limits.
4.3 Market Risk The Parent Company’s and RSB’s exposure to market risk, as mentioned earlier, is the potential diminution of accrual earnings arising from the movement of market interest rates as well as the potential loss of market value, primarily of its holdings of debt securities and derivatives, due to price fluctuation. The market risks of the Parent Company and RSB are (a) foreign exchange risk, (b) interest rate risk, and (c) equity price risk. The Parent Company and RSB manage this risk via a process of identifying, analyzing, measuring and controlling relevant market risk factors, and establishing appropriate limits for the various exposures. The market risk metrics in use, each of which has a corresponding limit, include the following: • Nominal Position – an open risk position that is held as of any point in time
expressed in terms of the nominal amount of the exposure. • Value-at-Risk (VaR) – an estimate of the amount of loss that a given risk exposure
is unlikely to exceed during a given time period, at a given level of statistical confidence. Analytically, VaR is the product of: (a) the sensitivity of the market value of the position to movement of the relevant market risk factors, and (b) the volatility of the market risk factor for the given time horizon at a specified level of statistical confidence. Typically, the Parent Company and RSB use a 99% confidence level for this measurement. VaR is used as a risk measure for trading positions, which are marked-to-market (as opposed to exposures resulting from banking, or accrual, book assets and liabilities). Foreign Exchange position VaR uses a 1-day holding period, while Fixed Income VaR uses a defeasance period assessed periodically as appropriate to allow an orderly unwinding of the position. VaR models are back-tested to ensure results remain consistent with the expectations based on the chosen statistical confidence level. While the Parent Company and RSB use VaR as an important tool for measuring market risk, they are cognizant of its limitations, notably the following:
− The use of historical data as a basis for determining the possible range of future
outcomes may not always cover all possible scenarios, especially those of an exceptional nature.
− VaR is based on historical volatility. Future volatility may be different due to either random, one-time events or structural changes (including changes in correlation). VaR may be unable to capture volatility due to either of these.
− The holding period assumption may not be valid in all cases, such as during periods of extremely stressed market liquidity.

- 44 -
− VaR is, by definition, an estimate at a specified level of confidence. Losses may occur beyond VaR. A 99% VaR implies that losses can exceed VaR 1% of the time.
− In cases where a parametric distribution is assumed to calculate VaR, the
assumed distribution may not fit the actual distribution well.
− VaR assumes a static position over the holding period. In reality, trading positions change, even during the trading day.
• Earnings-at-Risk (EaR) – more specifically, in its current implementation, this
refers to the impact on Net Interest Income for a 12-month horizon of adverse movements in interest rates. For this purpose the Parent Company and RSB employs a gap analysis to measure the interest rate sensitivity of their statements of financial position (local and foreign currencies). As of a given reporting period, the gap analysis (see Note 4.3.2) measures mismatches between the amounts of interest-earning assets and interest-bearing liabilities re-pricing within “time buckets” going forward from the statement of financial position date. A positive gap means net asset sensitivity, which implies that an increase in the interest rates would have a positive effect on the Parent Company’s and RSB’s net interest income. Conversely, a negative gap means net liability sensitivity, implying that an increase in the interest rates would have a negative effect on the Parent Company’s and RSB’s net interest income. The rate movements assumed for measuring EaR are consistent with a 99% confidence level with respect to historical rate volatility, assuming a 1-year holding period.
In addition to the limits corresponding to the above measurements, the following are also in place:
• Loss Limit - represents a ceiling on accumulated month-to-date losses. For trading
positions, a Management Action Trigger (MAT) is also usually defined to be at 50% of the Loss Limit. When MAT is breached, the risk-taking unit must consult with ALCO for approval of a course of action moving forward.
• Product Limit – the nominal position exposure for certain specific financial
instruments is established. Stress Testing, which uses more severe rate/price volatility and/or holding period assumptions, (relative to those used for VaR) is applied to marked-to-market positions to arrive at “worst case” loss estimates. This supplements the VaR measure, in recognition of its limitations already mentioned earlier.

- 45 -
A summary of the VaR position of the trading portfolios at December 31 is as follows: Parent and RSB 2009 At December 31 Average Maximum Minimum Foreign currency risk P 7,312 P 6,407 P 18,631 P 978 Interest rate risk 120,294 111,934 307,422 8,379 Overall P 127,606 P 118,341 P 326,053 P 9,357 2008 At December 31 Average Maximum Minimum Foreign currency risk P 4,618 P 6,865 P 18,973 P 816 Interest rate risk 14,860 53,711 171,771 5,097 Overall P 19,478 P 60,576 P 190,744 P 5,913 Parent Only 2009 At December 31 Average Maximum Minimum Foreign currency risk P 5,658 P 5,012 P 16,411 P 304 Interest rate risk 110,304 98,757 273,448 8,378 Overall P 115,962 P 103,769 P 289,859 P 8,682 2008 At December 31 Average Maximum Minimum Foreign currency risk P 3,442 P 6,095 P 17,693 P 581 Interest rate risk 12,811 43,214 152,175 3,048 Overall P 16,253 P 49,309 P 169,868 P 3,629 4.3.1 Foreign Currency Risk Foreign currency risk is the risk to earnings or capital arising from changes in foreign exchange rates. The net foreign currency exposure, or the difference between foreign currency assets and foreign currency liabilities, is capped by current BSP regulations. Compliance with this ceiling by the Parent Company and RSB and the respective foreign currency positions of its subsidiaries are reported to the BSP on a daily basis as required. Beyond this constraint, the Parent Company and RSB manage their foreign exchange exposure by limiting it to within conservative levels justifiable from a return/risk perspective. In addition, the Parent Company and RSB regularly calculate VaR for each currency position, which is incorporated in market risk management discussion in Note 4.3.

- 46 -
The breakdown of the financial resources and liabilities as to foreign and peso-denominated balances (before elimination of intercompany accounts/transactions) as of December 31 is as follows: Parent and RSB 2009 Foreign Currency Peso Total
Resources: Due from BSP P - P 19,119,211 P 19,119,211 Due from other banks 3,281,679 551,448 3,833,127 Financial assets at fair value through profit or loss 2,954,638 6,009,668 8,964,306 Available-for-sale securities 19,674,201 15,641,284 35,315,485 Held-to-maturity investments 17,211,665 2,535,924 19,747,589 Loans and receivables 42,345,946 121,645,552 163,991,498 Other resources 1,700,330 7,905,453 9,605,783
Liabilities: Deposit liabilities 55,545,468 166,107,823 221,653,291 Bills payable 8,746,430 1,788,743 10,535,173 Derivative liabilities 77,685 625,919 703,604 Bonds payable 5,836,076 - 5,836,076 Other liabilities 695,869 6,614,481 7,310,350 Subordinated debt - 10,926,978 10,926,978 2008 Foreign Currency Peso Total
Resources: Due from BSP P - P 16,360,396 P 16,360,396 Due from other banks 4,620,947 386,560 5,007,507 Financial assets at fair value through profit or loss 2,578,987 505,393 3,084,380 Available-for-sale securities 8,382,477 13,416,268 21,798,745 Held-to-maturity investments 18,143,421 2,350,997 20,494,418 Loans and receivables 43,626,103 120,605,063 164,231,166 Other resources 2,935,430 8,585,520 11,520,950 Liabilities: Deposit liabilities 52,767,476 145,203,807 197,971,283 Bills payable 13,675,252 7,770,269 21,445,521 Derivative liabilities 248,075 81,430 329,505 Bonds payable 6,002,821 - 6,002,821 Other liabilities 2,389,465 4,440,478 6,829,943 Subordinated debt - 6,941,899 6,941,899

- 47 -
Parent Only 2009 Foreign Currency Peso Total Resources: Due from BSP P - P 17,914,204 P 17,914,204 Due from other banks 1,404,960 383,881 1,788,841 Financial assets at fair value through profit or loss 2,954,638 5,079,598 8,034,236 Available-for-sale securities 19,344,712 12,915,774 32,260,486 Held-to-maturity investments 15,102,660 2,535,924 17,638,584 Loans and receivables 42,152,177 89,581,159 131,733,336 Other resources 1,569,893 7,905,453 9,475,346
Liabilities: Deposit liabilities 51,026,925 129,526,454 180,553,379 Bills payable 8,746,430 1,788,743 10,535,173 Derivative liabilities 77,685 625,919 703,604 Bonds payable 5,836,076 - 5,836,076 Other liabilities 695,869 5,193,710 5,889,579 Subordinated debt - 10,926,978 10,926,978 2008 Foreign Currency Peso Total Resources: Due from BSP P - P 15,656,119 P 15,656,119 Due from other banks 2,943,916 253,677 3,197,593 Financial assets at fair value through profit or loss 2,578,987 505,393 3,084,380 Available-for-sale securities 8,382,477 12,694,684 21,077,161 Held-to-maturity investments 15,541,116 2,350,998 17,892,114 Loans and receivables 42,923,236 87,368,970 130,292,206 Other resources 2,728,038 8,089,510 10,817,548 Liabilities: Deposit liabilities 47,961,695 110,967,383 158,929,078 Bills payable 13,675,252 7,734,835 21,410,087 Derivative liabilities 248,075 81,430 329,505 Bonds payable 6,002,821 - 6,002,821 Other liabilities 2,251,078 3,706,732 5,957,810 Subordinated debt - 6,941,899 6,941,899 4.3.2 Interest Rate Risk The interest risk inherent in the Parent Company’s and RSB’s statement of financial position arises from re-pricing mismatches between resources and liabilities. The Parent Company and RSB follow a policy on managing its assets and liabilities so as to ensure that exposure to fluctuations in interest rates is kept within acceptable limits. ALCO meets at least weekly to set rates for various financial assets and liabilities and trading products. ALCO employs interest rate gap analysis to measure interest rate sensitivity of its assets and liabilities.

- 48 -
The interest rate gap analyses of resources and liabilities as of December 31 based on re-pricing maturities appear below and on the succeeding pages. It should be noted that this interest rate gap analysis is based on certain assumptions, the key ones being: • Loans and time deposits are subject to re-pricing on their contractual maturity
dates. Non-performing loans (NPLs), however, do not re-price.
• Held-for-trading securities are treated as if they are assets subject to re-pricing within the first month maturity bucket; available-for-sale securities re-price on contractual maturity.
• Non-rate sensitive deposits such as Demand Accounts and Savings Accounts have
a certain volatile portion that is responsive to interest rate changes. The size of this portion as well as its rate sensitivity was determined from historical analysis.
Parent and RSB 2009 One to Three One to More Three Months to Five Than Five Non-rate Months One Year Years Years Sensitive Total Resources : Cash and cash equivalents P 5,734,000 P - P - P - P 6,779,491 P 12,513,491 Loans and advances to banks 1,537,496 371,106 - - 17,794,443 19,703,045 Loans and advances to customers 106,153,782 15,457,227 24,525,205 13,107,364 8,312,758 167,556,336 Investment securities 16,452,229 325,753 14,587,072 32,442,687 14,709,374 78,517,115 Total resources P 129,877,507 P 16,154,086 P 39,112,277 P 45,550,051 P 47,596,066 P 278,289,987
Liabilities: Deposits from banks P 7,200,818 P 2,573,259 P 11,923 P 749,173 P - P 10,535,173 Deposits from customers 102,295,868 7,218,961 7,589,640 1,000 104,547,910 221,653,379 Debt securities issued 5,836,076 - - - - 5,836,076 Subordinated liabilities - - 10,926,978 - - 10,926,978 Total liabilities P 115,332,762 P 9,792,220 P 18,528,541 P 750,173 P 104,547,910 P 248,951,606 Gap 1 P 14,544,745 P 6,361,866 P 20,583,736 P 44,799,878 ( P 56,951,844 ) P 29,338,381 Cumulative gap P 14,544,745 P 20,906,611 P 41,490,347 P 86,290,225 P 29,338,381

- 49 -
Parent and RSB 2008 One to Three One to More Three Months to Five Than Five Non-rate Months One Year Years Years Sensitive Total Resources : Cash and cash equivalents P 8,143 P - P - P - P 24,442,499 P 24,450,642 Loans and advances to banks 22,113,666 381,709 - 381,709 - 22,877,084 Loans and advances to customers 12,463,680 2,396,373 1,469,394 5,952,017 85,184,862 107,466,326 Investment securities 17,702,663 2,058,149 5,591,439 10,455,496 6,249,179 42,056,926 Total resources P 52,288,152 P 4,836,231 P 7,060,833 P 16,789,222 P 115,876,540 P 196,850,978
Liabilities: Deposits from banks P 7,460,783 P 9,859,434 P 3,320,562 P 770,759 P - P 21,411,538 Deposits from customers 18,950,677 16,628,757 33,571 - 123,355,115 158,968,120 Debt securities issued - - 6,002,821 - - 6,002,821 Subordinated liabilities - - 6,941,899 - - 6,941,899 Total liabilities P 26,411,460 P 26,488,191 P 16,298,853 P 770,759 P 123,355,115 P 193,324,378 Gap 1 P 25,876,692 ( P 21,651,960 ) ( P 9,238,020 ) P 16,018,463 ( P 7,478,575 ) P 3,526,600 Cumulative gap P 25,876,692 P 4,224,732 ( P 5,013,288 ) P 11,005,175 P 3,526,600 Parent Only 2009 One to Three One to More Three Months to Five Than Five Non-rate Months One Year Years Years Sensitive Total Resources: Cash and cash equivalents P - P - P - P - P 5,408,491 P 5,408,491 Loans and advances to banks 1,537,496 371,106 - - 17,794,443 19,703,045 Loans and advances to customers 101,890,782 7,632,227 4,604,205 10,876,364 6,729,758 131,733,336 Investment securities 8,520,229 325,753 14,209,072 31,056,687 14,522,374 68,634,115 Total
resources (Carried
forward) P 111,948,507 P 8,329,086 P 18,813,277 P 41,933,051 P 44,455,066 P 225,478,987

- 50 -
2009 One to Three One to More
Three Months to Five Than Five Non-rate Months One Year Years Years Sensitive Total
Total
resources (Brought
forward) P 111,948,507 P 8,329,086 P 18,813,277 P 41,933,051 P 44,455,066 P 225,478,987 Liabilities: Deposits from banks P 7,200,818 P 2,573,259 P 11,923 P 749,173 P - P 10,535,173 Deposits from customers 80,807,868 4,524,961 5,519,640 - 89,700,910 180,553,379 Debt securities issued 5,836,076 - - - - 5,836,076 Subordinated liabilities - - 10,926,978 - - 10,926,978 Total liabilities P 93,844,762 P 7,098,220 P 16,458,541 P 749,173 P 89,700,910 P 207,851,606 Gap 1 P 18,103,745 P 1,230,866 P 2,354,736 P 41,183,878 ( P 45,245,844 ) P 17,627,381 Cumulative gap P 18,103,745 P 19,334,611 P 21,689,347 P 62,873,225 P 17,627,381 Parent Only 2008 One to Three One to More Three Months to Five Than Five Non-rate Months One Year Years Years Sensitive Total Resources: Cash and cash equivalents P 8,119 P - P - P - P 24,441,329 P 24,449,448 Loans and advances to banks 22,112,203 381,709 - 381,709 - 22,875,621 Loans and advances to customers 12,461,783 2,388,112 1,448,759 5,940,000 85,177,931 107,416,585 Investment securities 17,702,533 2,057,755 5,590,327 10,453,809 6,249,231 42,053,655 Total
resources P 52,284,638 P 4,827,576 P 7,039,086 P 16,775,518 P 115,868,491 P 196,795,309
Liabilities: Deposits from banks P 7,460,783 P 9,859,434 P 3,320,562 P 770,759 P - P 21,411,538 Deposits from customers 18,929,955 16,627,133 29,830 - 123,342,160 158,929,078 Debt securities issued - - 6,002,821 - - 6,002,821 Subordinated liabilities - - 6,941,899 - - 6,941,899 Total liabilities P 26,390,738 P 26,486,567 P 16,295,112 P 770,759 P 123,342,160 P 193,285,336 Gap 1 P 25,893,900 ( P 21,658,991 ) ( P 9,256,026 ) P 16,004,759 ( P 7,473,669 ) P 3,509,973 Cumulative gap P 25,893,900 P 4,234,909 ( P 5,021,117 ) P 10,983,642 P 3,509,973

- 51 -
4.3.3 Equity Price Risk The Parent Company and RSB have minimal exposures to equity securities price risk on their investments held and classified on the statement of financial position as available-for-sale. The Group is not exposed to commodity price risk. To manage price risk, the Parent Company and RSB diversify their portfolio. Diversification of the portfolio is done in accordance with the limits set by the Parent Company and RSB. 4.4 Credit Risk Credit risk is the risk that the counterparty in a transaction may default, and arises from lending, trade finance, treasury, derivatives and other activities undertaken by the Parent Company and RSB. The Group manages credit risk through a system of policies and authorities that govern the processes and practices of all credit-originating and borrowing relationship management units. Credit Risk Division of CRISMS assists senior management : (a) to develop credit policy; (b) to establish risk concentration limits accepted at the level of the single borrower, related-borrower group, industry segments, and sovereign jurisdiction; and, (c) to continuously monitor the actual credit risk portfolio from the perspective of those limits and other risk management objectives. In performing this function, the Credit Risk Division works hand-in-hand with the business units and with the Corporate Planning Group. At the individual borrower level, exposure to credit risk is managed via adherence to a set of policies, the most notable features of which, in this context, are: (a) credit approving authority is not exercised by a single individual but rather, through a hierarchy of limits, is effectively exercised collectively; (b) branch managers have limited approval authority only for credit exposure related to deposit-taking operations in the form of bills purchased, acceptance of second endorsed checks, and 1:1 loan accommodations; (c) an independent credit risk assessment by the Credit Risk Division of large corporate and middle-market borrowers, summarized into a borrower risk rating, is provided as input to the credit decision-making process; and, (d) borrower credit analysis is performed at origination and at least annually thereafter. Impairment provisions are recognized for losses that have been incurred at the statement of financial position date. Significant changes in the economy, or in particular industry segments that represent a concentration in the Parent Company’s and RSB’s portfolio, could result in losses that are different from those provided for at the end of the reporting period. Management therefore carefully monitors the changes and adjusts its exposure to such credit risk, as necessary.

- 52 -
4.4.1 Exposure to Credit Risk The carrying amount of financial resources recorded in the consolidated financial statements, grossed up for any allowances for losses, which represents the maximum exposure to credit risk, without taking into account of the value of any collateral obtained, as of December 31 follows: Parent and RSB 2009 Loans and Investment Receivables Securities Carrying Amount P 163,991,498 P 62,285,284 Individually Impaired Grade 1 to 5: Unclassified 372,000 - Grade 6 to 7: Impaired 564,189 - Grade 8: Impaired 816,269 - Grade 9: Impaired 1,667,533 - Grade 10: Impaired 533,880 - Gross amount 3,953,871 3,393,319 Allowance for impairment ( 1,710,715 ) ( 1,276,157 ) Carrying amount 2,243,156 2,117,162 Collectively Impaired Grade 1 to 5: Unclassified 107,030,198 - Grade 6 to 7: Impaired 16,896,119 - Grade 8: Impaired 3,917,908 - Grade 9: Impaired 9,500 - Grade 10: Impaired 678,000 - Gross amount 128,531,725 - Allowance for impairment ( 3,019,846 ) - Carrying amount 125,511,879 - Unquoted debt securities classified as loans 5,689,068 - Allowance for impairment ( 462,000 ) - Carrying amount 5,227,068 - Neither Past Due Nor Impaired 31,009,395 60,168,122 Total Carrying Amount P 163,991,498 P 62,285,284

- 53 -
Parent and RSB 2008 Loans and Investment Receivables Securities Carrying Amount P 164,231,166 P 44,459,397 Individually Impaired Grade 1 to 5: Unclassified 629,000 - Grade 6 to 7: Impaired 477,319 - Grade 8: Impaired 1,699,807 - Grade 9: Impaired 999,817 - Grade 10: Impaired 874,873 - Gross amount 4,680,816 2,466,280 Allowance for impairment ( 1,571,731 ) ( 811,207 ) Carrying amount 3,109,085 1,655,073 Collectively Impaired Grade 1 to 5: Unclassified 111,883,119 - Grade 6 to 7: Impaired 9,691,743 - Grade 8: Impaired 1,438,809 - Grade 9: Impaired 29,840 - Grade 10: Impaired 548,000 - Gross amount 123,591,511 - Allowance for impairment ( 4,745,066 ) - Carrying amount 118,846,445 - Unquoted debt securities classified as loans 6,621,885 - Allowance for impairment ( 1,082,467 ) - Carrying amount 5,539,418 - Neither Past Due Nor Impaired 36,736,218 42,804,324 Total Carrying Amount P 164,231,166 P 44,459,397
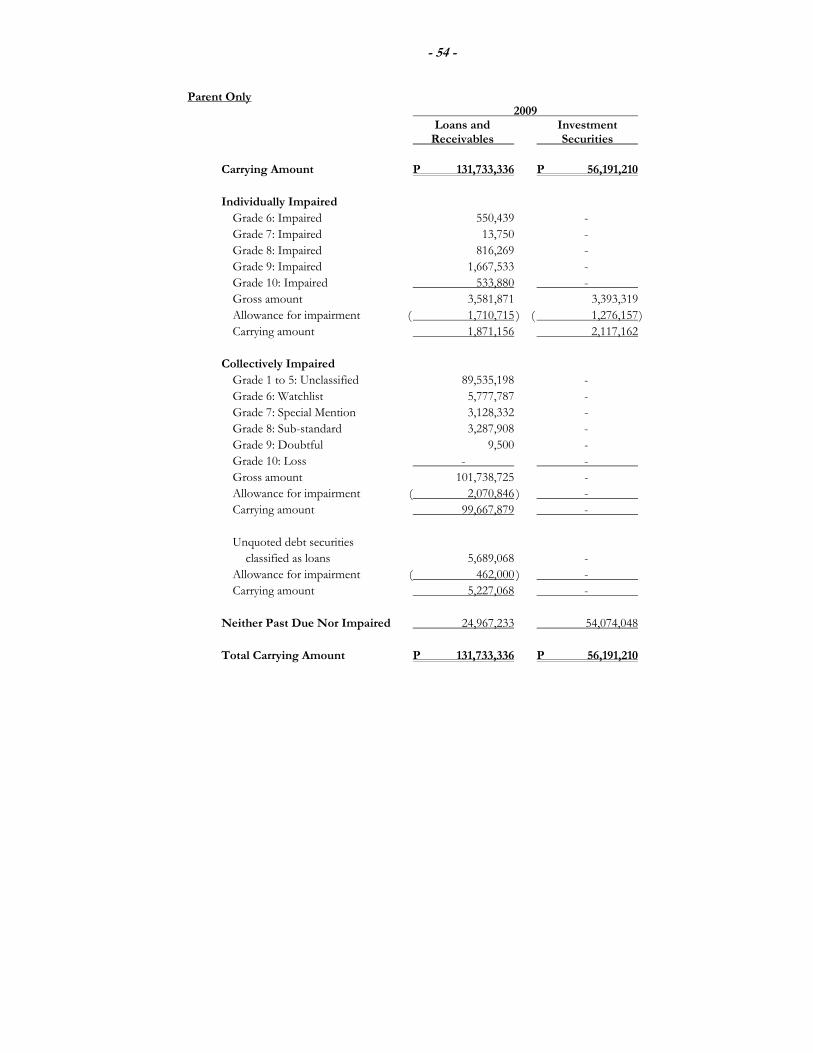
- 54 -
Parent Only 2009
Loans and Investment Receivables Securities Carrying Amount P 131,733,336 P 56,191,210 Individually Impaired Grade 6: Impaired 550,439 - Grade 7: Impaired 13,750 - Grade 8: Impaired 816,269 - Grade 9: Impaired 1,667,533 - Grade 10: Impaired 533,880 - Gross amount 3,581,871 3,393,319 Allowance for impairment ( 1,710,715 ) ( 1,276,157 ) Carrying amount 1,871,156 2,117,162 Collectively Impaired Grade 1 to 5: Unclassified 89,535,198 - Grade 6: Watchlist 5,777,787 - Grade 7: Special Mention 3,128,332 - Grade 8: Sub-standard 3,287,908 - Grade 9: Doubtful 9,500 - Grade 10: Loss - - Gross amount 101,738,725 - Allowance for impairment ( 2,070,846 ) - Carrying amount 99,667,879 - Unquoted debt securities classified as loans 5,689,068 - Allowance for impairment ( 462,000 ) - Carrying amount 5,227,068 - Neither Past Due Nor Impaired 24,967,233 54,074,048 Total Carrying Amount P 131,733,336 P 56,191,210

- 55 -
Parent Only 2008
Loans and Investment Receivables Securities Carrying Amount P 130,292,206 P 41,135,509 Individually Impaired Grade 6: Impaired 383,219 - Grade 7: Impaired 94,100 - Grade 8: Impaired 1,699,807 - Grade 9: Impaired 999,817 - Grade 10: Impaired 874,873 - Gross amount 4,051,816 2,466,280 Allowance for impairment ( 1,571,731 ) ( 811,207 ) Carrying amount 2,480,085 1,655,073 Collectively Impaired Grade 1 to 5: Unclassified 94,300,118 - Grade 6: Watchlist 2,797,107 - Grade 7: Special Mention 303,637 - Grade 8: Sub-standard 711,809 - Grade 9: Doubtful 29,840 - Grade 10: Loss - - Gross amount 98,142,511 - Allowance for impairment ( 1,526,066 ) - Carrying amount 96,616,445 - Unquoted debt securities classified as loans 6,621,885 - Allowance for impairment ( 1,082,467 ) - Carrying amount 5,539,418 - Neither Past Due Nor Impaired 25,656,258 39,480,436 Total Carrying Amount P 130,292,206 P 41,135,509
The credit risk for cash and cash equivalents such as Due from BSP and Due from Other Banks is considered negligible, since the counterparties are reputable banks with high quality external credit ratings. 4.4.2 Collateral Held as Security and Other Credit Enhancements The Parent Company and RSB hold collateral against loans and advances to customers in the form of mortgage interests over property, other registered securities over assets, and guarantees. Estimates of fair value are based on the value of collateral assessed at the time of borrowing and are generally updated annually. Collateral, generally, is not held over loans and advances to banks, except when securities are held as part of reverse repurchase and securities borrowing activity. Collateral usually is not held against investment securities, and no such collateral was held at December 31, 2009 and 2008.

- 56 -
The Parent Company and RSB hold collateral against Loans and Other Receivables in the form of hold-out on deposits, real estate mortgage, standby letters of credit or bank guaranty, government guaranty, chattel mortgage, assignment of receivables, pledge of shares, personal and corporate guaranty and other forms of security. An estimate of the fair value of collateral and other security enhancements held against loans and receivables as of December 31, 2009 and 2008 are shown below. Parent and RSB
2009 2008 Against individually impaired Real property P 2,287,915 P 4,648,242 Chattels 254,544 392,084 Equities - 461,000 Others - 236,980 Against past due but not impaired Real property 24,720,064 18,700,355 Chattels 14,441,811 12,751,047 Equities 1,191,823 710,190 Debt securities - - Others 1,970,065 1,422,824 Against neither past due nor impaired Real property 38,596,440 42,111,183 Chattels 516,000 486,000 Others 15,107,528 14,645,252 Total P 99,086,190 P 96,565,157 Parent Only
2009 2008
Against individually impaired Real property P 1,915,915 P 4,020,242 Chattels 254,544 392,084 Equities - 461,000 Other 167,881 236,980 Against past due but not impaired Real property 8,505,064 5,983,355 Chattels 2,183,811 837,047 Equities 1,191,823 710,190 Debt securities - - Other 1,344,065 814,824 Against neither past due nor impaired Real property 36,130,440 34,407,183 Chattels - - Other 15,107,528 14,645,252 Total P 66,801,071 P 62,508,157

- 57 -
4.4.3 Concentrations of Credit Risk The Parent Company and RSB monitor concentrations of credit risk by sector. An analysis of concentrations of credit risk at the reporting date is shown in Note 11. 4.5 Fair Value Hierarchy The Parent Company and RSB adopted the amendments to PFRS 7, Improving Disclosures about Financial Instruments, effective January 1, 2009. These amendments require the Parent Company and RSB to present certain information about financial instruments measured at fair value in the statement of financial position. In the first year of application, comparative information need not be presented for the disclosures required by the amendment. Accordingly, the disclosure for the fair value hierarchy is only presented for December 31, 2009. In accordance with this amendment, financial assets and liabilities measured at fair value in the statement of financial position are categorized in accordance with the fair value hierarchy. This hierarchy groups financial assets and liabilities into three levels based on the significance of inputs used in measuring the fair value of the financial assets and liabilities. The fair value hierarchy has the following levels: • Level 1: quoted prices (unadjusted) in active markets for identical assets or
liabilities; • Level 2: inputs other than quoted prices included within Level 1 that are observable
for the resource or liability, either directly (i.e. as prices) or indirectly (i.e. derived from prices); and
• Level 3: inputs for the asset or liability that are not based on observable market data
(unobservable inputs). The level within which the financial asset or liability is classified is determined based on the lowest level of significant input to the fair value measurement. The table in the next page presents the breakdown of the Parent Company’s and RSB’s financial assets and liabilities measured at fair value in the statement of financial position as of December 31, 2009.

- 58 -
Parent Company and RSB 2009 Level 1 Level 2 Level 3 Total
Financial assets at fair
value through profit and loss: Government bonds P 6,198,850 P 342,319 P - P 6,541,169
Other debt securities 1,610,277 - - 1,610,277 Derivative assets 54,163 758,697 - 812,860
7,863,290 1,101,016 - 8,964,306
Available-for-sale securities: Government bonds 16,114,700 4,558,429 - 20,673,129 Other debt securities 14,236,515 - - 14,236,515 Equity securities 1,742,095 - - 1,742,095 32,093,310 4,558,429 - 36,651,739 Allowance for impairment ( 1,336,254 ) - - ( 1,336,254 ) 30,757,056 4,558,429 - 35,315,485 Total Resources at Fair Value P 38,620,346 P 5,659,445 P - P 44,279,791
Derivative liability P - P 703,604 P - P 703,604
Parent Company 2009 Level 1 Level 2 Level 3 Total Financial assets at fair value through profit and loss: Government bonds P 5,268,780 P 342,319 P - P 5,611,099 Other debt securities 1,610,277 - - 1,610,277 Derivative assets 54,163 758,697 - 812,860 6,933,220 1,101,016 - 8,034,236
Available-for-sale securities:
Government bonds 12,999,604 4,558,429 - 17,558,033 Other debt securities 14,236,515 - - 14,236,515
Equity securities 1,742,095 - - 1,742,095 28,978,214 4,558,429 - 33,536,643 Allowance for impairment ( 1,276,157 ) - - ( 1,276,157 ) 27,702,057 4,558,429 - 32,260,486 Total Resources at Fair Value P 34,635,277 P 5,659,445 P - P 40,294,722
Derivative liability P - P 703,604 P - P 703,604

- 59 -
4.6 Operations Risk and Reputation Risk Operations risk is the risk arising from the potential that inadequate information systems, operations or transactional problems (relating to service or product delivery), breaches in internal controls and fraud or unforeseen catastrophes will result in unexpected loss. Operations risk includes the risk of loss arising from various types of human or technical error, the risk of settlement or payments failures, the risk of business interruption, administrative and legal risks and the risk arising from systems not performing adequately. Reputation risk is the risk to earnings or capital arising from negative public opinion. This affects the Parent Company’s and RSB’s ability to establish new relationships or services, or to continue servicing existing relationships. This risk can expose the Parent Company and RSB to litigation, financial loss, or damage to their reputation. Reputation risk arises whenever technology-based banking products, services, delivery channels, or processes may generate adverse public opinion such that it seriously affects the Parent Company’s and RSB’s earnings or impairs capital. This risk is present in activities such as asset management and regulatory compliance. The Parent Company and RSB maintain departmental operations manuals that are periodically updated. The Parent Company and RSB have also developed a Business Contingency Plan which is tested at least annually and updated for any major changes in systems procedures. Transactions and items of value are subject to a system of dual control whereby the work of one person is verified by a second person to ensure that the transaction is properly authorized, recorded and settled. The Parent Company and RSB place emphasis on the security of their computer systems and have a comprehensive information technology (IT) security policy. The Parent Company and RSB designate a security administrator independent of the front office who is responsible for maintaining strict control over user access privileges to the Parent Company and RSB’s information systems. The Parent Company’s and RSB’s IT Groups have also created a disaster recovery plan to cover the recovery of critical data and contingency processing requirements in the event of a disaster. 4.7 Legal Risk and Regulatory Risk Management Changes in laws and regulations could adversely affect the Parent Company and RSB. In addition, the Parent Company and RSB face legal risks in enforcing its rights under its loan agreements, such as foreclosing on collateral. Legal risk is higher in new areas of business where the law remains untested by the courts. The Parent Company and RSB use a legal review process as the primary control mechanism for legal risk. Such a legal review aims to verify and validate the existence, genuineness and due execution of legal documents, and verify the capacity and authority of counterparties and customers to enter into transactions. In addition, the Parent Company and RSB seek to minimize its legal risk by using stringent legal documentation, imposing certain requirements designed to ensure that transactions are properly authorized and consulting internal and external legal advisors.
- 60 -
Regulatory risk refers to the potential for the Parent Company and RSB to suffer financial loss due to changes in the laws or monetary, tax or other governmental regulations of a country. The Parent Company’s and RSB’s Compliance Program, the implementation of which is overseen and coordinated by the Compliance Office, is the primary control process for regulatory risk issues. The Compliance Office is responsible for communicating and disseminating new rules and regulations to all units, analyzing and addressing compliance issues, performing periodic compliance testing on branches and Head Office units, and reporting compliance findings to the Audit Committee and the BOD. 4.8 Anti-Money Laundering Controls The Anti-Money Laundering Act was passed in September 2001 and was amended in March 2003. Under the Anti-Money Laundering Act, as amended, the Parent Company and RSB are required to submit “Covered Transaction Reports” involving single transactions in cash or other equivalent monetary instruments in excess of P500,000 within one banking day. The Parent Company and RSB are also required to submit “Suspicious Transaction Reports” to the Anti-Money Laundering Council of the BSP in the event that there are reasonable grounds to believe that any amounts processed are the proceeds of money-laundering activities. The Parent Company and RSB are required to establish and record the identities of its clients based on official documents. In addition, all records of transactions are required to be maintained and stored for five years from the date of the transaction. Records of closed accounts must also be kept for five years after their closure. Under BSP Circular No. 279 dated April 2, 2001, within 20 banking days after the end of each financial year, the Parent Company and RSB are required to submit to the BSP a certificate signed by the President and the Chief Compliance Officer stating that they have monitored compliance and that the Parent Company and RSB are complying with the anti-money laundering rules and regulations. In an effort to further prevent money laundering activities, the Parent Company and RSB have adopted Know Your Customer policies and guidelines. Under the guidelines, each business unit is required to validate the true identity of a customer based on official or other reliable identifying documents or records before an account may be opened. Each business unit is also required to monitor account activities to determine whether transactions conform to the normal or expected transactions for a customer or an account. For a high-net worth individual whose source of funds is unclear, a more extensive due diligence is required. Decisions to enter into a business relationship with a higher risk customer, such as a politically exposed person or a private individual holding a prominent position, are made exclusively at the senior management level. The Parent Company’s and RSB’s procedures for compliance with the Anti-Money Laundering Act are set out in its Anti-Money Laundering Policy Manual. The Parent Company’s and RSB’s Compliance Offices monitor compliance and conduct compliance testing of business units.

- 61 -
The Parent Company’s and RSB’s Anti-Money Laundering Committee evaluates suspicious transaction reports submitted by branches for final determination if the suspicions are based on reasonable grounds and are therefore reportable to the Anti-Money Laundering Council. All banking groups are required to submit to the Compliance Office certificates of compliance with the Anti-Money Laundering Rules & Regulations on a quarterly basis. 4.9 Other Subsidiaries’ Policies and Objectives
The other subsidiaries have essentially the same risk management policies and objectives as that of the Parent Company and RSB. The other subsidiaries’ risk management is coordinated with the Parent Company, in close cooperation with their respective BOD.
5. CAPITAL MANAGEMENT
5.1 Regulatory Capital The BSP, Group’s lead regulator, sets and monitors capital requirements of the Parent Company, RSB and RCBC Capital and the Group as a whole. In implementing current capital requirements, BSP requires the Parent Company and the Group to maintain a minimum capital amount and a prescribed ratio of qualifying capital to risk-weighted assets or the capital adequacy ratio (CAR). Risk-weighted assets is the sum of credit risk, market risks, and operational risks, computed based on BSP-prescribed formula provided under its circulars. Under the relevant provisions of the current BSP regulations, the minimum capitalization of the Parent Company, RSB and RCBC Capital is P4.95 billion, P325 million and P300 million, respectively. In computing CAR, the regulatory qualifying capital is analyzed into two tiers which are: (i) Tier 1 Capital, and (ii) Tier 2 Capital; less deductions from the Total Tier 1 and Tier 2 for the following: (a) Investments in equity of unconsolidated subsidiary banks and other financial allied
undertakings, but excluding insurance companies; (b) Investments in debt capital instruments of unconsolidated subsidiary banks; (c) Investments in equity of subsidiary insurance companies and non-financial allied
undertakings; (d) Reciprocal investments in equity of other banks/enterprises; and, (e) Reciprocal investments in unsecured subordinated term debt instruments of other
banks/quasi-banks qualifying as Hybrid Tier 1, Upper Tier 2 and Lower Tier 2, in excess of the lower of (i) an aggregate ceiling of 5% of total Tier 1 capital of the bank excluding Hybrid Tier 1; or (ii) 10% of the total outstanding unsecured subordinated term debt issuance of the other bank/quasi-banks. Provided, that any asset deducted from the qualifying capital in computing the numerator of the risk-based capital ratio shall not be included in the risk-weighted assets in computing the denominator of the ratio.
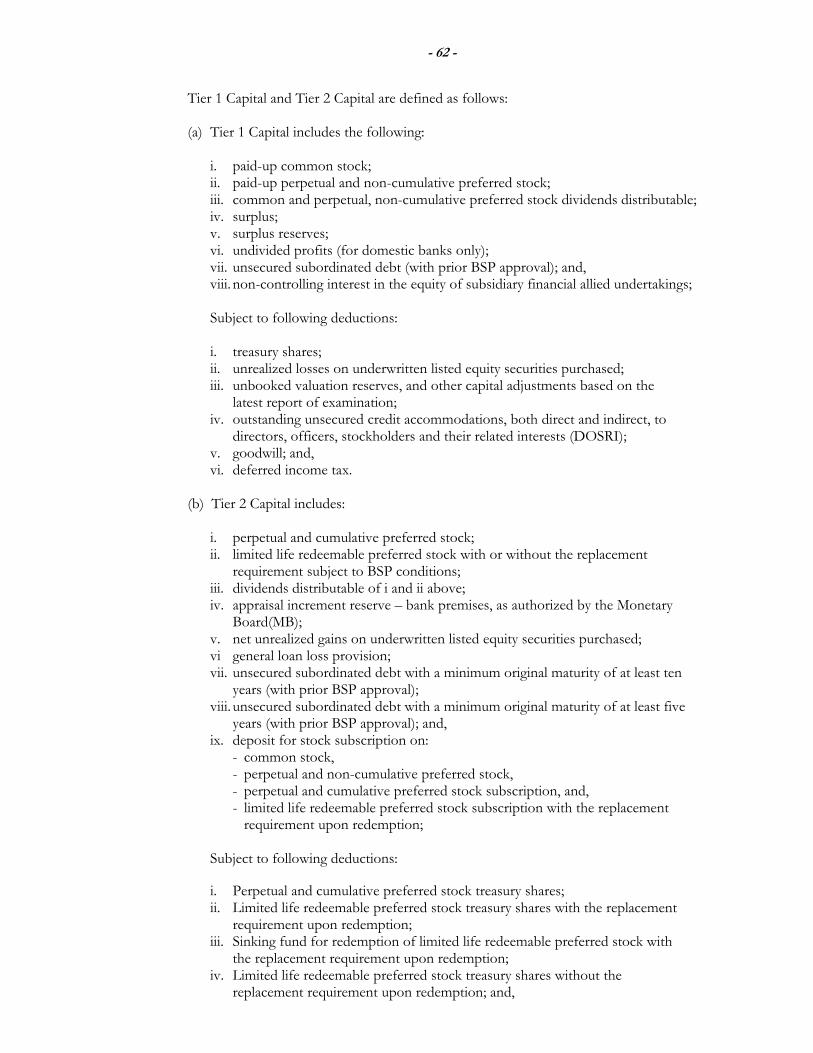
- 62 -
Tier 1 Capital and Tier 2 Capital are defined as follows:
(a) Tier 1 Capital includes the following: i. paid-up common stock; ii. paid-up perpetual and non-cumulative preferred stock; iii. common and perpetual, non-cumulative preferred stock dividends distributable; iv. surplus; v. surplus reserves; vi. undivided profits (for domestic banks only); vii. unsecured subordinated debt (with prior BSP approval); and, viii. non-controlling interest in the equity of subsidiary financial allied undertakings;
Subject to following deductions:
i. treasury shares; ii. unrealized losses on underwritten listed equity securities purchased; iii. unbooked valuation reserves, and other capital adjustments based on the latest report of examination; iv. outstanding unsecured credit accommodations, both direct and indirect, to directors, officers, stockholders and their related interests (DOSRI); v. goodwill; and, vi. deferred income tax.
(b) Tier 2 Capital includes:
i. perpetual and cumulative preferred stock; ii. limited life redeemable preferred stock with or without the replacement requirement subject to BSP conditions; iii. dividends distributable of i and ii above; iv. appraisal increment reserve – bank premises, as authorized by the Monetary
Board(MB); v. net unrealized gains on underwritten listed equity securities purchased; vi general loan loss provision; vii. unsecured subordinated debt with a minimum original maturity of at least ten years (with prior BSP approval); viii. unsecured subordinated debt with a minimum original maturity of at least five years (with prior BSP approval); and, ix. deposit for stock subscription on:
- common stock, - perpetual and non-cumulative preferred stock, - perpetual and cumulative preferred stock subscription, and, - limited life redeemable preferred stock subscription with the replacement
requirement upon redemption;
Subject to following deductions:
i. Perpetual and cumulative preferred stock treasury shares; ii. Limited life redeemable preferred stock treasury shares with the replacement requirement upon redemption; iii. Sinking fund for redemption of limited life redeemable preferred stock with the replacement requirement upon redemption; iv. Limited life redeemable preferred stock treasury shares without the replacement requirement upon redemption; and,

- 63 -
v. Sinking fund for redemption of limited life redeemable preferred stock without the replacement requirement upon redemption.
The Group’s regulatory capital position as of December 31 is presented as follows:
2009 2008
Tier 1 Capital P 27,128,731 P 26,015,850 Tier 2 Capital 12,733,761 8,111,092
Total Qualifying Capital, after deductions P 39,862,491 P 34,126,942
Total Risk Weighted Assets P 215,825,856 P 197,222,586 Capital ratios:
Total regulatory capital expressed as percentage of total risk weighted assets 18.47% 17.30%
Total Tier 1 expressed as percentage of total risk weighted assets 12.57% 13.19%
The Parent Company’s regulatory capital position as of December 31 is presented as follows:
2009 2008
Tier 1 Capital P 22,091,302 P 21,369,107 Tier 2 Capital 7,350,514 3,235,534
Total Qualifying Capital, after deductions P 29,441,816 P 24,604,641
Total Risk Weighted Assets P 170,922,058 P 151,148,326
Capital ratios:
Total regulatory capital expressed as percentage of total risk weighted assets 17.23% 16.28% Total Tier 1 expressed as percentage of total risk weighted assets 12.92% 14.14%
The preceding capital ratios comply with the related BSP prescribed ratio of at least 10%.

- 64 -
6. SEGMENT INFORMATION
The Group’s operating businesses are recognized and managed separately according to the nature of services provided (primary segments) and the different markets served (secondary segments) with a segment representing a strategic business unit. The Group’s business segments follow: a. Retail Banking – principally handles the business centers offering a wide range of
financial products and services to the commercial “middle market” customers. Products offered include individual customer’s deposits, term loans, revolving credit lines, overdraft facilities, trade finance, payment remittances, and foreign exchange transactions.
b. Corporate Banking – principally handles loans and other credit facilities and deposit and current accounts for corporate and institutional customers.
c. Treasury – principally provides money market, trading and treasury services, as well as
the management of the Group’s funding operations by use of treasury bills, government securities and placements and acceptances with other banks, through treasury and wholesale banking.
d. Others – consists of the Parent Company’s various support groups and consolidated
subsidiaries.
These segments are the basis on which the Group reports its primary segment information. Other operations of the Group comprise the operations and financial control groups. Transactions between segments are conducted at estimated market rates on an arm’s length basis. Segment revenues and expenses that are directly attributable to a primary business segment and the relevant portions of the Group’s revenues and expenses that can be allocated to that business segment are accordingly reflected as revenues and expenses of that business segment. For secondary segment, revenues and expenses are attributed to geographic areas based on the location of the resources producing the revenues, and in which location the expenses are incurred.

- 65 -
Primary segment information (by business segment) on a consolidated basis as of and for the years ended December 31, 2009 and 2008 (in millions of Philippine Pesos) follows: 2009 Retail Corporate Banking Banking Treasury Group Group Group Others Total
Results of operations Net interest income P 4,006 P 1,859 P 1,080 P 3,323 P 10,268 Non-interest income 1,808 938 2,388 752 5,886 Total revenue 5,814 2,797 3,468 4,075 16,154 Non-interest expense 4,084 827 399 6,764 12,074 Profit (loss) before tax 1,730 1,970 3,069 ( 2,689 ) 4,080 Tax expense - - - 745 745 Non-controlling interest in net profit - - - ( 7 ) ( 7 ) Net profit (loss) P 1,730 P 1,970 P 3,069 (P 3,441 ) P 3,328 Statement of financial position Total Resources P 184,765 P 96,875 P 75,578 (P 68,702 ) P 288,516 Total Liabilities P 184,765 P 96,875 P 75,578 (P 99,247 ) P 257,971 Other segment information Capital expenditures P 150 P 13 P 4 P 1,173 P 1,340 Depreciation and amortization P 103 P 10 P 5 P 416 P 534 2008 Retail Corporate Banking Banking Treasury Group Group Group Others Total
Results of operations Net interest income P 3,123 P 930 P 311 P 4,106 P 8,470 Non-interest income 1,177 548 1,014 1,858 4,597 Total revenue 4,300 1,478 1,325 5,964 13,067 Non-interest expense 2,349 411 227 6,988 9,975 Profit (loss) before tax 1,951 1,067 1,098 ( 1,024 ) 3,092 Tax expense - - - 919 919 Non-controlling interest in net profit - - - ( 19 ) ( 19 ) Net profit (loss) P 1,951 P 1,067 P 1,098 (P 1,962 ) 2,154 Statement of financial position Total Resources P 144,720 P 63,248 P 69,421 (P 9,119 ) P 268,270 Total Liabilities P 144,720 P 63,248 P 69,421 (P 36,756 ) P 240,633

- 66 -
2008 Retail Corporate Banking Banking Treasury Group Group Group Others Total Other segment information Capital expenditures P 225 P 38 P 7 P 765 P 1,035 Depreciation and amortization P 131 P 9 P 11 P 257 P 408 Secondary information (by geographical location) as of and for the years ended December 31, 2009 and 2008 (in millions of Philippine pesos) follows: 2009 Asia and Philippines United States Europe Total Results of operations Total revenues P 22,462 P 75 P 119 P 22,656 Total expenses 19,068 144 116 19,328 Net profit (loss) P 3,394 ( P 69 ) P 3 P 3,328 Statement of financial position Total resources P 287,950 P 147 P 419 P 288,516 Total liabilities P 257,640 P 133 P 198 P 257,971 Other segment information Capital expenditures P 1,333 P 3 P 4 P 1,340 Depreciation and amortization P 528 P 5 P 1 P 534 2008 Asia and Philippines United States Europe Total Results of operations Total revenues P 20,045 P 97 P 114 P 20,256 Total expenses 17,873 132 97 18,102 Net profit (loss) P 2,172 ( P 35 ) P 17 P 2,154 Statement of financial position Total resources P 267,490 P 246 P 534 P 268,270 Total liabilities P 240,138 P 207 P 288 P 240,633 Other segment information Capital expenditures P 1,008 P 23 P 4 P 1,035 Depreciation and amortization P 405 P 2 P 1 P 408

- 67 -
7. CASH AND CASH EQUIVALENTS
The components of Cash and Cash Equivalents are as follows: Consolidated Parent 2009 2008 2009 2008 Cash and other cash items P 6,811,443 P 6,807,939 P 5,408,491 P 5,595,736 Due from BSP 19,321,339 16,390,973 17,914,204 15,656,119 Due from other banks 3,066,922 4,862,225 1,788,841 3,197,593 P 29,199,704 P 28,061,137 P 25,111,536 P 24,449,448
Cash consists primarily of funds in the form of Philippine currency notes and coins in the bank’s vault and those in the possession of tellers, including automated teller machines. Other Cash Items include cash items (other than currency and coins on hand), such as checks drawn on other banks or other branches after the bank’s clearing cut-off time until the close of the regular banking hours. Due from BSP represents the aggregate balance of deposit accounts maintained with the BSP primarily to meet reserve requirements, to serve as clearing account for interbank claims and to comply with existing trust regulations.
The balance of Due from Other Banks account represents regular deposits with the following:
Consolidated Parent 2009 2008 2009 2008 Foreign banks P 1,972,975 P 3,120,283 P 1,089,096 P 1,872,693 Local banks 1,093,947 1,741,942 699,745 1,324,900 P 3,066,922 P 4,862,225 P 1,788,841 P 3,197,593 The breakdown of Due from Other Banks by currency is shown below. Consolidated Parent 2009 2008 2009 2008 Foreign currencies P 2,549,536 P 4,116,106 P 1,404,960 P 2,943,916 Philippine pesos 517,386 746,119 383,881 253,677 P 3,066,922 P 4,862,225 P 1,788,841 P 3,197,593 Interest rates on these deposits range from 0.50% to 5.25% in 2009, 0.50% to 7.00% in
2008 and 1% to 4.5% in 2007.

- 68 -
8. FINANCIAL ASSETS AT FAIR VALUE THROUGH PROFIT OR LOSS
This account is composed of the following: Consolidated Parent 2009 2008 2009 2008 Government bonds P 6,825,653 P 1,940,272 P 5,611,099 P 1,619,470 Other debt securities 1,727,831 1,059,205 1,610,277 1,059,205 Derivative financial assets 812,860 405,705 812,860 405,705 Equity securities Quoted 49,529 31,431 - - Unquoted 16 525 - - P 9,415,889 P 3,437,138 P 8,034,236 P 3,084,380
The carrying amounts of the above financial assets are classified as follows:
Consolidated Parent 2009 2008 2009 2008 Held-for-trading P 8,350,243 P 1,762,624 P 7,221,376 P 1,619,470 Designated as fair value through profit or loss on initial recognition 1,065,646 1,674,514 812,860 1,464,910 P 9,415,889 P 3,437,138 P 8,034,236 P 3,084,380
Treasury bills and other debt securities issued by the government and other private corporations earn annual interest as follows:
2009 2008 2007 Peso denominated 4.016% - 11.875% 5.50% - 18.75 % 5.50% - 16.50% Foreign currency denominated 3.75 % - 11.375% 6.25% - 10.625% 6.38% - 10.63%
Fair values of government bonds were determined by reference to published closing prices available from electronic financial data service providers which had been based on price quoted or actually dealt in an active market.
Fair values of certain derivative financial assets were determined through valuation techniques using net present value computation. Derivatives instruments used by the Parent Company include foreign currency short term forwards and cross currency swaps. Foreign currency forwards represent commitments to purchase/sell on a future date at a specific exchange rate. Foreign currency short term swaps are simultaneous foreign currency spot and forward deals with tenor of one year. The aggregate contractual or notional amount of derivatives financial instruments and the aggregative fair values of derivative financial assets and liabilities as of December 31 both in the consolidated and Parent Company financial statements are set out in the succeeding page.

- 69 -
2009 Notional Fair Values Amount Assets Liabilities
Currency swaps P 1,762,750 P 722,561 P 597,165 Interest rate swaps 1,700,000 11,579 4,998 Futures 260,200 110 - Currency forwards/futures 169,243 24,471 101,441 Debt warrants - 54,139 - P 3,892,193 P 812,860 P 703,604
2008 Notional Fair Values Amount Assets Liabilities
Currency swaps ( P 1,911,200) P 192,752 P 247,108 Currency forwards/futures ( 4,447,600) 176,751 82,397 Debt warrants - 36,202 - ( P 6,358,800) P 405,705 P 329,505
The derivative liabilities of P703,604 and P329,505 as of December 31, 2009 and 2008, respectively, are shown as part of Other Liabilities (see Note 21). The Group recognized the change in value of financial assets at fair value through profit or loss resulting to an increase of P39,227 in 2009, P1,557,064 decrease in 2008, and P86,769 increase in 2007; and P10,376 increase in 2009, P1,316,222 decrease in 2008, and P80,504 increase in 2007 in the consolidated and Parent Company financial statements, respectively, which were included as part of Trading and Securities Gains (Losses) - net account in the statements of income. In 2008, the Group reclassified certain debt securities and embedded derivatives of CLNs from financial assets at fair value through profit or loss to held-to-maturity investments, available-for-sale securities and loans and receivables categories (see Notes 9, 10 and 11).
9. HELD-TO-MATURITY INVESTMENTS
The balance of this account as of December 31 is composed of the following:
Consolidated Parent 2009 2008 2009 2008
Government bonds P 19,476,766 P 20,621,861 P 17,172,858 P 17,840,361 Other debt securities 485,594 51,753 465,726 51,753 P 19,962,360 P 20,673,614 P 17,638,584 P 17,892,114

- 70 -
As to currency, held-to-maturity investments comprise of the following:
Consolidated Parent 2009 2008 2009 2008
Foreign currency P 17,231,532 P 18,143,420 P 15,102,660 P 15,541,116 Philippine pesos 2,730,828 2,530,194 2,535,924 2,350,998 P 19,962,360 P 20,673,614 P 17,638,584 P 17,892,114 Changes in the held-to-maturity investments account in December 31, 2009 and 2008
are summarized below. Consolidated Parent 2009 2008 2009 2008
Balance at beginning of year P 20,673,614 P - P 17,892,114 P - Additions 398,290 - 378,397 - Amortization of premium – net ( 285,389) ( 111,022 ) ( 261,027) ( 107,949) Maturities ( 453,255) - - - Revaluation of foreign currency ( 370,900) - ( 370,900) -
Reclassification from FVTPL - 411,228 - 411,228 Reclassification from AFS - 20,373,408 - 17,588,835
Balance at end of year P 19,962,360 P 20,673,614 P 17,638,584 P 17,892,114
In accordance with BSP Circular No. 670, the Parent Company entered into a bond exchange transaction with Power Sector Assets and Liabilities Management Corporation (PSALM) on December 2, 2009 to convert its guaranteed notes and bonds originally issued by National Power Corporation with total face value of
US$100.0 million to PSALM’s newly issued guaranteed global bonds amounting to US$105.0 million which will mature on 2024. The carrying amount of the investment in PSALM classified as held-to-maturity investment amounted to P4,847,997 as of December 31, 2009.
9.1 Reclassification to HTM Investments The Monetary Board of the BSP, through BSP Circular No. 628, approved the prudential reporting guidelines for banks governing the reclassification of investments in debt and equity securities between categories in accordance with the provisions of the amendments to the PAS 39 and PFRS, and provided additional guidelines which include, among others, the reclassification of certain financial assets previously classified under available-for-sale securities due to tainting of held-to-maturity portfolio back to held-to-maturity investments category. On February 2, 2009, the SEC approved the adoption of such BSP Circular No. 628 as being compliant with generally accepted accounting principles for banks.

- 71 -
Pursuant to these amendments and guidelines, the Group and the Parent Company reclassified certain financial assets classified under AFS Securities due to the previous tainting of HTM portfolio and certain financial assets at fair value through profit or loss to HTM Investments category with an aggregate carrying value of P20,784,636 and P18,000,063, respectively, at reclassification date. The carrying amount and the corresponding fair values of the reclassified AFS securities and financial assets at fair value through profit or loss as of December 31 are presented below. Consolidated
2009 2008 Carrying Fair Carrying Fair Amount Value Amount Value From AFS to HTM P 14,508,235 P 15,438,869 P 20,264,434 P 19,059,065 From FVTPL to HTM 404,453 431,129 409,180 424,548 P 14,912,688 P 15,869,998 P 20,673,614 P 19,483,613
Parent
2009 2008 Carrying Fair Carrying Fair Amount Value Amount Value From AFS to HTM P 12,204,352 P 13,014,557 P 17,482,934 P 16,339,848 From FVTPL to HTM 404,453 431,129 409,180 424,548 P 12,608,805 P 13,445,686 P 17,892,114 P 16,764,396
The effective interest rates of FVTPL denominated in foreign currency and peso which were reclassified to HTM range from 7.75% to 10.63% and 8.43% to 8.85%, respectively, both in the consolidated and Parent Company financial statements. Had no reclassification been made, the net trading gain on FVTPL that would have been recognized for the years ended December 31, 2009 and 2008 both in the consolidated and Parent Company financial statements would have amounted to P85,060 and P13,320, respectively. The net unrealized fair value gains on AFS that would have been recognized in the capital funds as of December 31, 2009 would have amounted to P453,146 and P332,718 for the Group and Parent Company, respectively, and the unrealized fair value losses would have amounted to P1,311,269 and P1,248,987 as of December 31, 2008 for the Group and Parent Company, respectively, if the reclassification had not been made. The amortization of the amount of net unrealized fair value losses at the date of reclassification of the reclassified AFS recognized in the profit or loss for the years ended December 31, 2009 and 2008 amounted to P15,574 and P29,651, respectively, in the consolidated statements of income; and P7,660 and P36,598, respectively, in the Parent Company statements of income.
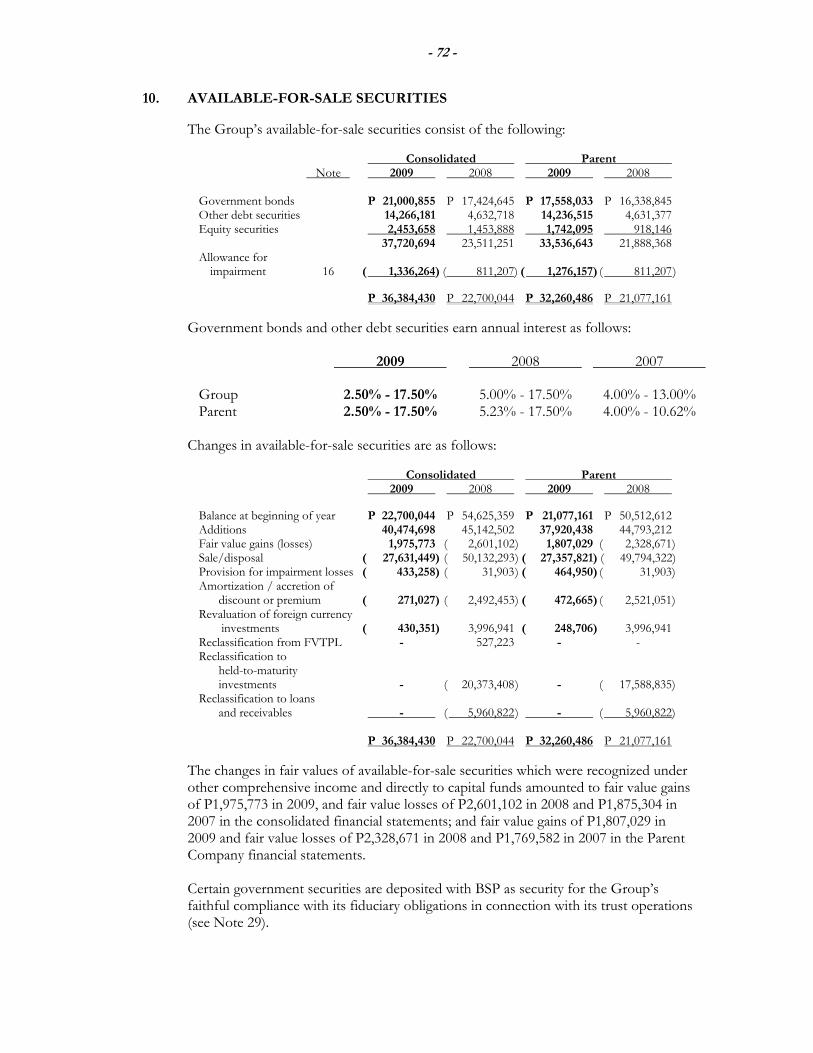
- 72 -
10. AVAILABLE-FOR-SALE SECURITIES
The Group’s available-for-sale securities consist of the following:
Consolidated Parent Note 2009 2008 2009 2008
Government bonds P 21,000,855 P 17,424,645 P 17,558,033 P 16,338,845 Other debt securities 14,266,181 4,632,718 14,236,515 4,631,377 Equity securities 2,453,658 1,453,888 1,742,095 918,146 37,720,694 23,511,251 33,536,643 21,888,368 Allowance for impairment 16 ( 1,336,264) ( 811,207) ( 1,276,157) ( 811,207 ) P 36,384,430 P 22,700,044 P 32,260,486 P 21,077,161
Government bonds and other debt securities earn annual interest as follows:
2009 2008 2007 Group 2.50% - 17.50% 5.00% - 17.50% 4.00% - 13.00% Parent 2.50% - 17.50% 5.23% - 17.50% 4.00% - 10.62%
Changes in available-for-sale securities are as follows: Consolidated Parent 2009 2008 2009 2008
Balance at beginning of year P 22,700,044 P 54,625,359 P 21,077,161 P 50,512,612
Additions 40,474,698 45,142,502 37,920,438 44,793,212 Fair value gains (losses) 1,975,773 ( 2,601,102 ) 1,807,029 ( 2,328,671) Sale/disposal ( 27,631,449) ( 50,132,293 ) ( 27,357,821) ( 49,794,322) Provision for impairment losses ( 433,258) ( 31,903 ) ( 464,950) ( 31,903) Amortization / accretion of discount or premium ( 271,027) ( 2,492,453 ) ( 472,665) ( 2,521,051)
Revaluation of foreign currency investments ( 430,351) 3,996,941 ( 248,706) 3,996,941
Reclassification from FVTPL - 527,223 - - Reclassification to
held-to-maturity investments - ( 20,373,408 ) - ( 17,588,835) Reclassification to loans and receivables - ( 5,960,822 ) - ( 5,960,822)
P 36,384,430 P 22,700,044 P 32,260,486 P 21,077,161
The changes in fair values of available-for-sale securities which were recognized under other comprehensive income and directly to capital funds amounted to fair value gains of P1,975,773 in 2009, and fair value losses of P2,601,102 in 2008 and P1,875,304 in 2007 in the consolidated financial statements; and fair value gains of P1,807,029 in 2009 and fair value losses of P2,328,671 in 2008 and P1,769,582 in 2007 in the Parent Company financial statements.
Certain government securities are deposited with BSP as security for the Group’s faithful compliance with its fiduciary obligations in connection with its trust operations (see Note 29).

- 73 -
In 2008, the Group reclassified financial assets at FVTPL to AFS in accordance with PFRS. The carrying value and fair value of the securities at the date of reclassification amounted to P527,223. Had no reclassification been made, the Group would have earned additional fair value gain of P197,156 for the year ended December 31, 2009 and incurred additional loss of P232,726 for the year ended December 31, 2008. The carrying amount of the securities as of December 31, 2009 and 2008 amounted to P660,391 and P294,497, respectively, in the consolidated financial statements.
Also in 2008, the Group reclassified private and government debt securities with
carrying value at the date of reclassification of P20,373,408 to held-to-maturity investments in accordance with FRSPB (see Note 9). In addition, the Parent Company reclassified CDOs and CLNs that are linked to ROP bonds, with an aggregate carrying value of P5,960,822 to loans and receivables (see Note 11).
11. LOANS AND RECEIVABLES This account consists of the following:
Consolidated Parent 2009 2008 2009 2008
Loans and discounts P 118,502,226 P 113,607,267 P 85,264,805 P 78,727,671 Customers’ liabilities on acceptances, import bills and trust receipts 11,643,552 15,883,708 11,643,552 15,883,708 Bills purchased 2,211,973 2,106,007 2,187,432 2,085,789 Securities purchased under reverse repurchase agreements 646,000 488,000 - - 133,003,751 132,084,982 99,095,789 96,697,168 Interbank loans receivables 24,358,198 23,598,507 22,958,198 22,875,621 Credit card receivables 8,187,585 8,256,256 5,523,286 5,497,159 Unquoted debt securities classified as loans 5,689,068 6,621,885 5,689,068 6,621,885 Accrued interest receivable 2,249,005 2,205,587 1,938,864 1,955,747 Accounts receivable 1,315,520 1,921,735 876,248 1,247,660 Sales contract receivables 1,216,938 1,196,328 701,523 767,117 Miscellaneous 11,212 52,721 - 30,979 176,031,277 175,938,001 136,782,976 135,693,336 Allowance for impairment (see Note 16) ( 7,465,624) ( 7,943,278) ( 4,433,774) ( 4,943,286) Unearned discount ( 2,096,986) ( 2,149,136 ) ( 173,171) ( 155,933) Prompt payment discount ( 368,137) ( 363,597) - - Reserves for credit card ( 1,208,113) ( 1,079,083) ( 442,695) ( 301,911 )
P 164,892,417 P 164,402,907 P 131,733,336 P 130,292,206
Loans and receivables bear average interest rates of 2% to 11% per annum in 2009, 3.4% to 9.7% in 2008 and 3.4% to 10.5% in 2007 in the consolidated and Parent Company financial statements.

- 74 -
Included in these accounts in the consolidated financial statements are NPLs amounting to P6,137,804 (net of allowance of P1,687,007) as of the end of 2009 and P3,930,841 (net of allowance of P1,799,778) as of the end of 2008, and in the Parent Company financial statements amounting to P4,764,124 (net of allowance of P1,520,843) as of the end of 2009 and P3,141,378 (net of allowance of P1,352,750) as of the end of 2008. Loans and receivables amounting to P2,354,515 and P10,729,055 as of December 31, 2009 and 2008, respectively, both in the consolidated and Parent Company financial statements are assigned as collateral to BSP as security for rediscounting availments (see Note 18). The concentration of credit as to industry follows:
Consolidated Parent 2009 2008 2009 2008
Other community, social and personal activities P 43,847,227 P 46,179,659 P 13,959,662 P 13,923,573 Manufacturing (various industries) 27,761,730 30,281,180 27,686,254 30,261,981 Real estate, renting and other related activities 17,077,568 14,293,382 16,286,233 13,733,296 Electricity, gas and water 10,699,371 9,294,329 10,370,757 9,097,739 Wholesale and retail trade 10,604,224 10,165,040 9,125,960 9,002,426 Transportation and communication 9,608,088 7,503,127 9,606,957 7,503,127 Financial intermediaries 3,597,550 7,481,284 2,944,300 7,456,284 Hotels and restaurants 1,539,718 1,176,779 1,539,241 1,176,779 Agriculture, fishing and forestry 1,069,909 663,740 659,821 299,469 Others 7,198,366 5,046,462 6,916,604 4,242,494
P 133,003,751 P 132,084,982 P 99,095,789 P 96,697,168 The BSP considers that loan concentration exists when the total loan exposure to a particular industry exceeds 30% of the total loan portfolio above plus the outstanding credit card receivables and interbank loans receivables. The breakdown of total loans as to secured and unsecured follows:
Consolidated Parent 2009 2008 2009 2008 Secured: Real estate mortgage P 47,178,874 P 47,739,934 P 27,930,851 P 26,646,468 Deposit hold-out 6,489,238 11,731,613 5,862,811 11,123,949 Chattel mortgage 12,898,454 12,549,276 123,215 148,981 Other securities 12,523,486 6,207,297 11,948,486 5,744,296 79,090,052 78,228,120 45,865,363 43,663,694 Unsecured 53,913,699 53,856,862 53,230,426 53,033,474 P 133,003,751 P 132,084,982 P 99,095,789 P 96,697,168
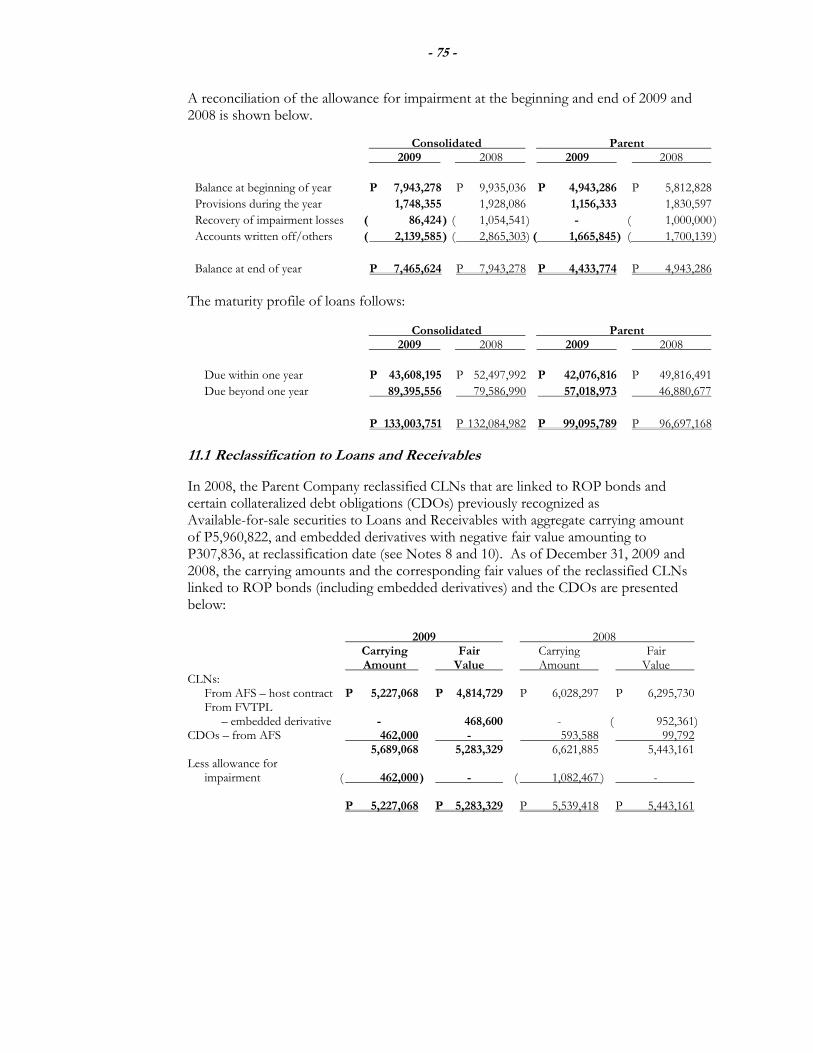
- 75 -
A reconciliation of the allowance for impairment at the beginning and end of 2009 and 2008 is shown below.
Consolidated Parent 2009 2008 2009 2008 Balance at beginning of year P 7,943,278 P 9,935,036 P 4,943,286 P 5,812,828 Provisions during the year 1,748,355 1,928,086 1,156,333 1,830,597 Recovery of impairment losses ( 86,424 ) ( 1,054,541 ) - ( 1,000,000 ) Accounts written off/others ( 2,139,585 ) ( 2,865,303 ) ( 1,665,845 ) ( 1,700,139 ) Balance at end of year P 7,465,624 P 7,943,278 P 4,433,774 P 4,943,286
The maturity profile of loans follows:
Consolidated Parent 2009 2008 2009 2008 Due within one year P 43,608,195 P 52,497,992 P 42,076,816 P 49,816,491 Due beyond one year 89,395,556 79,586,990 57,018,973 46,880,677 P 133,003,751 P 132,084,982 P 99,095,789 P 96,697,168
11.1 Reclassification to Loans and Receivables In 2008, the Parent Company reclassified CLNs that are linked to ROP bonds and certain collateralized debt obligations (CDOs) previously recognized as Available-for-sale securities to Loans and Receivables with aggregate carrying amount of P5,960,822, and embedded derivatives with negative fair value amounting to P307,836, at reclassification date (see Notes 8 and 10). As of December 31, 2009 and 2008, the carrying amounts and the corresponding fair values of the reclassified CLNs linked to ROP bonds (including embedded derivatives) and the CDOs are presented below:
2009 2008 Carrying Fair Carrying Fair Amount Value Amount Value CLNs: From AFS – host contract P 5,227,068 P 4,814,729 P 6,028,297 P 6,295,730 From FVTPL – embedded derivative - 468,600 - ( 952,361) CDOs – from AFS 462,000 - 593,588 99,792 5,689,068 5,283,329 6,621,885 5,443,161 Less allowance for impairment ( 462,000 ) - ( 1,082,467 ) - P 5,227,068 P 5,283,329 P 5,539,418 P 5,443,161

- 76 -
The effective interest at reclassification date ranges from 4.9% to 10.5% and 5.0% to 8.8% for CLNs and CDOs, respectively. The unrealized fair value losses that should have been recognized in the Group’s capital funds had the CLNs and CDOs not been reclassified to Loans and Receivables amounted to P729,270 and nil, respectively, as of December 31, 2009, and P134,962 and P375,408, respectively, as of December 31, 2008. Had the embedded derivatives not been reclassified by the Parent Company, interest income on loans and receivables would have decreased by P20,721 in 2009 and P7,477 in 2008 and the additional trading gains to be recognized in profit or loss amounted to P1,420,959 for the year ended December 31, 2009, and additional trading losses amounted to P644,524 from the date of reclassification to December 31, 2008. 11.2 Special Purpose Vehicle (SPV) Transactions In accordance with the provisions of Republic Act (RA) No. 9182 (the SPV Act) and BSP Resolution No. 135, the Parent Company entered into either “sale and purchase” or “asset sale” agreements with SPVs, namely: • New Pacific Resources Management (SPV-AMC), Inc. (NPRMI) on May 14, 2008
and February 26, 2007, • Philippine Investments One, Inc. (PIOI) on August 25, 2004 and April 12, 2005, • Star Two (SPV-AMC), Inc. (Star Two) on November 15, 2006,
• Global Ispat Holdings and Global Steelworks International (collectively referred
herein as the Global SPVs) on October 15, 2004, and
• Asian Pacific Recoveries (SPV-AMC) Corporation (Asian Pacific Recoveries) on February 21, 2005.
The agreements cover the transfer of specific NPAs, consisting of NPLs and real and other properties acquired (ROPA; presented as Investment Property), amounting to P50,728 in 2008 and P1,698,558 in 2007 to NPRMI; P3,770,948 and P1,433,228 in 2004 and 2005, respectively to PIOI; P3,878,781 in 2006 to Star Two; P685,561 to Global SPVs in 2004; and P2,070,064 to Asian Pacific Recoveries in 2005. The agreement with the Global SPVs was made in conjunction with other participating banks. The agreement with Star Two also covers the sale of NPAs not eligible under the SPV Act amounting to P486,142. The Certificates of Eligibility, obtained for purposes of availing of the tax exemptions and privileges on the NPLs transferred and ROPAs sold, were completely issued by the BSP to the Parent Company on various dates in 2004, 2005, 2007 and 2008. The significant terms and conditions of the “asset sale” agreement with NPRMI and the “sale and purchase” agreements with PIOI, among others, follow: • The SPVs shall issue 10-year subordinated/SPV notes in exchange for the NPLs
transferred. The issuance of the subordinated/SPV notes constitutes full settlement for the NPLs transferred.
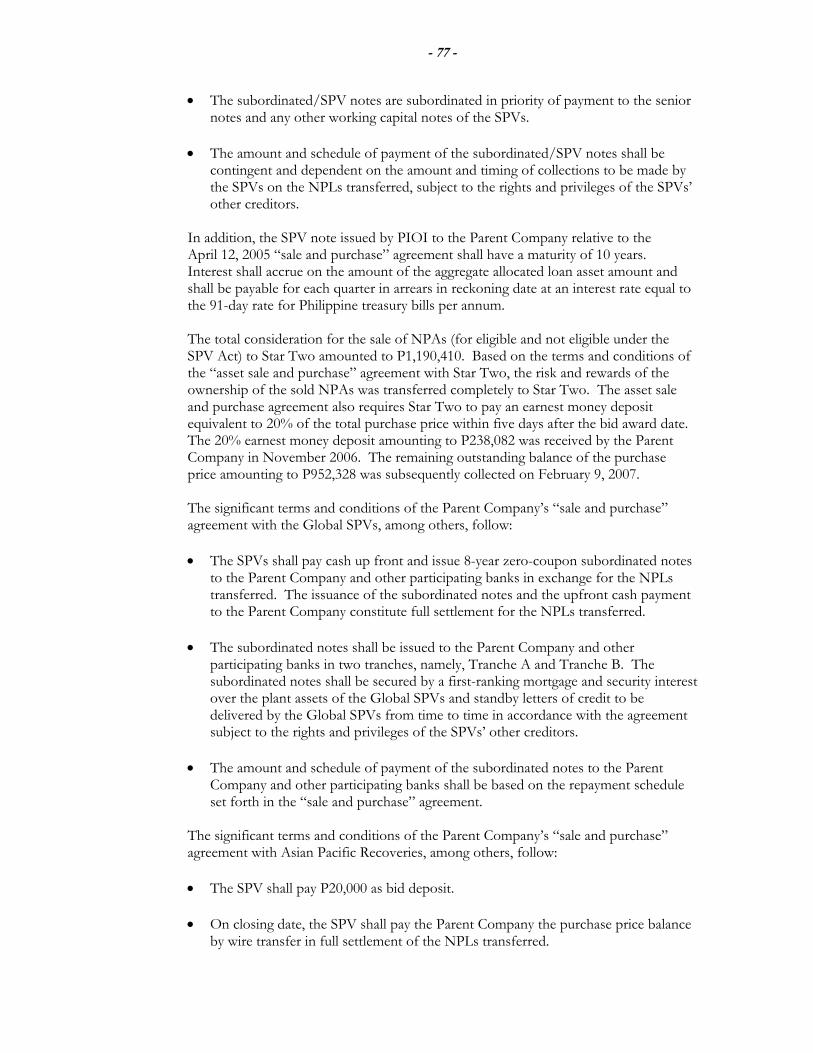
- 77 -
• The subordinated/SPV notes are subordinated in priority of payment to the senior notes and any other working capital notes of the SPVs.
• The amount and schedule of payment of the subordinated/SPV notes shall be
contingent and dependent on the amount and timing of collections to be made by the SPVs on the NPLs transferred, subject to the rights and privileges of the SPVs’ other creditors.
In addition, the SPV note issued by PIOI to the Parent Company relative to the April 12, 2005 “sale and purchase” agreement shall have a maturity of 10 years. Interest shall accrue on the amount of the aggregate allocated loan asset amount and shall be payable for each quarter in arrears in reckoning date at an interest rate equal to the 91-day rate for Philippine treasury bills per annum. The total consideration for the sale of NPAs (for eligible and not eligible under the SPV Act) to Star Two amounted to P1,190,410. Based on the terms and conditions of the “asset sale and purchase” agreement with Star Two, the risk and rewards of the ownership of the sold NPAs was transferred completely to Star Two. The asset sale and purchase agreement also requires Star Two to pay an earnest money deposit equivalent to 20% of the total purchase price within five days after the bid award date. The 20% earnest money deposit amounting to P238,082 was received by the Parent Company in November 2006. The remaining outstanding balance of the purchase price amounting to P952,328 was subsequently collected on February 9, 2007. The significant terms and conditions of the Parent Company’s “sale and purchase” agreement with the Global SPVs, among others, follow: • The SPVs shall pay cash up front and issue 8-year zero-coupon subordinated notes
to the Parent Company and other participating banks in exchange for the NPLs transferred. The issuance of the subordinated notes and the upfront cash payment to the Parent Company constitute full settlement for the NPLs transferred.
• The subordinated notes shall be issued to the Parent Company and other
participating banks in two tranches, namely, Tranche A and Tranche B. The subordinated notes shall be secured by a first-ranking mortgage and security interest over the plant assets of the Global SPVs and standby letters of credit to be delivered by the Global SPVs from time to time in accordance with the agreement subject to the rights and privileges of the SPVs’ other creditors.
• The amount and schedule of payment of the subordinated notes to the Parent
Company and other participating banks shall be based on the repayment schedule set forth in the “sale and purchase” agreement.
The significant terms and conditions of the Parent Company’s “sale and purchase” agreement with Asian Pacific Recoveries, among others, follow: • The SPV shall pay P20,000 as bid deposit. • On closing date, the SPV shall pay the Parent Company the purchase price balance
by wire transfer in full settlement of the NPLs transferred.

- 78 -
• The SPV acknowledges and agrees that if there is occurrence of a default by any obligor under any loan document, SPV will remain bound by all terms and conditions to purchase all the loans in the transaction without any adjustment or alteration in the purchase price unless the Parent Company removes loans from the transaction prior to closing.
In relation to such transactions, the BSP has informed the Parent Company that the allowance for impairment amounting to P23,280 and P289,994 on the NPAs transferred to NPRMI in 2008 and 2007, respectively; P1,474,440 on the NPAs transferred to Star Two in 2006, P2,225,558 and P163,814 to PIOI and the Global SPVs, respectively, in 2004; and P1,211,332 to PIOI and P245,477 to Asian Pacific Recoveries in 2005, shall be “freed” and used only for general loan loss provision and/or for specific provision of loan accounts that may be classified in the future. In 2008, the Parent Company reversed portion of the freed allowance amounting to P1,000,000 by charging it to the current operations, instead of to Surplus. Portion of the freed allowance was charged against amortization for deferred charges (as discussed below) totaling P536,684 in 2008 and P1,077,401 in 2007 and prior years. In 2006, the Parent Company charged portion of the freed allowance for the write-off of certain impaired credit card receivables amounting to P2,593,440. FRSPB, however, requires the derecognition of the related allowance for impairment of the NPAs transferred that qualified for derecognition at the time of sale. The face value of the subordinated/SPV notes issued by NPRMI in 2008 amounted to P48,192 and P1,688,902 in 2007; subordinated/SPV notes issued by PIOI in 2005 amounted to P1,418,896 and P3,770,948 in 2004; the SPV note issued by Global SPVs amounted to P548,930 in 2004. In addition to the subordinated notes, the Global SPV also paid cash to the Parent Company amounting to P27,439 in 2004; PIOI and Asian Pacific Recoveries paid cash amounting to P14,332 and 427,564, respectively, for the 2005 transfer; and NPRMI paid cash amounting to P2,536 in 2008 and P9,656 in 2007. In recording the transfers of the NPAs, the Parent Company derecognized the NPAs from its financial records and recorded the subordinated/SPV notes as part of Available-for-sale Securities (unquoted debt securities) at their fair values as of the dates of issuance. However, one of the significant conditions stated in the terms of the subordinated/SPV notes from NPRMI and PIOI is that the amount and timing of payment of the subordinated/SPV notes are dependent on the collections to be made by NPRMI and PIOI on the NPAs transferred. Under FRSPB, this is indicative of an incomplete transfer of the risks and rewards of ownership of the NPAs from the Parent Company to NPRMI and PIOI. FRSPB requires that: (a) the entity retaining majority of the residual risks and rewards of ownership of certain assets of SPV should reflect in its financial statements its proportionate interest in such SPV; and (b) an entity should substantially transfer all the risks and rewards of ownership of an asset before such asset could be derecognized.

- 79 -
As permitted under BSP Resolution No. 135, the Parent Company has deferred over 10 years the recognition of the required additional allowance for impairment as determined from the NPAs transferred to PIOI, and the losses determined from the NPAs transferred to Star Two, Global SPVs and Asian Pacific Recoveries, totaling to P1,335,149 in 2006, P1,604,587 in 2005 and P1,955,768 in 2004. The schedule of amortization of the required additional allowance for impairment and losses as prescribed under BSP Resolution No. 135 shall be 5% for the first three years, 10% for the next four years, and 15% for the remaining three years. In accordance with BSP Resolution No. 135, total amortization recognized by the Parent Company amounted to P834,633 (charged to Surplus) for the year ended December 31, 2009 and P745,342 (P536,684 of which was charged against the “freed” allowance for impairment while the remaining balance of P208,658 was charged to profit or loss) for the year ended December 31, 2008. FRSPB, however, requires the full recognition of the required additional allowance for impairment and the losses against current operations in the period such impairment and losses were determined instead of capitalizing it as deferred charges and amortizing it over future periods. Had the Parent Company (i) reflected in its financial statements its interest in NPRMI and PIOI and not derecognized the NPAs transferred; (ii) derecognized the allowance for impairment related to the NPAs transferred that qualified for derecognition at the time of sale; and, (iii) not deferred the recognition of the required additional allowance for impairment and the losses determined from the NPAs transferred in accordance with FRSPB, the gross balance of the Group’s and Parent Company’s Loans and Receivables - Net account would have decreased by P188,088 in 2009 and 2008; Available-for-sale Securities would have decreased by P1,423,820 in 2009 and 2008; Investment Property would have increased by P1,436,012 in 2009 and 2008; Deferred Charges (part of Other Resources account in Note 15) would have decreased by P7,047,308 and P7,844,385 in 2009 and 2008, respectively; Other Liabilities would have increased by P12,192 and P26,524 in 2009 and 2008, respectively, Surplus would have decreased by P7,047,308 in 2009 and P8,264,501 in 2008, and net income would have decreased by P791,342 in 2008.

- 80 -
12. INVESTMENTS IN SUBSIDIARIES AND ASSOCIATES
The components of the carrying values of investments in subsidiaries and associates are as follows:
Consolidated Effective Percentage of Ownership 2009 2008 Acquisition costs of associates: RRC 34.80 P 1,947,320 P 1,999,934 RLI 49.00 921,076 921,076 SPC 26.50 120,095 120,095 RHI 4.71 101,665 101,665 HCPI 12.88 91,050 91,050 LIPC 35.00 52,500 52,500 YCS 40.00 5,070 5,070 GLFAC 20.00 - 200,000 3,238,776 3,491,390
Equity in net earnings (losses): Balance at beginning of year 294,466 120,992 Equity in net earnings for the year 206,857 404,192 Equity earnings in associate sold ( 39,428) - Dividends ( 217,904) ( 230,718 ) Balance at end of year 243,991 294,466 3,482,767 3,785,856 Share in additional paid-in capital of an associate 532,583 532,583 Revaluation increment in property of an associate 58,917 28,243 4,074,267 4,346,682 Allowance for impairment (see Note 16) ( 52,500) ( 52,500 ) P 4,021,767 P 4,294,182

- 81 -
Parent Effective Percentage of Ownership 2009 2008 Subsidiaries: RSB 100.00 P 3,190,000 P 3,190,000 RCBC Capital 99.96 2,230,673 2,230,673 Bankard 66.58 1,000,000 1,000,000 Merchants Bank 96.38 492,389 493,039 NPHI 100.00 388,431 - RCBC Forex 100.00 150,000 150,000 RCBC Telemoney Europe 100.00 71,796 16,055 RCBC North America* 100.00 59,896 36,046 RCBC IFL 99.99 58,013 58,013 7,641,198 7,173,826
Associates:
RRC 25.00 1,947,320 1,999,934 RLI 49.00 921,076 921,076 SPC 26.50 120,095 120,095 HCPI 12.88 91,050 91,050 LIPC 35.00 52,500 52,500 YCS 40.00 5,070 5,070 GLFAC 20.00 - 200,000 3,137,111 3,389,725 10,778,309 10,563,551 Allowance for impairment (see Note 16) ( 252,500) ( 252,500 ) Deposit for future stock subscription 175,000 - P 10,700,809 P 10,311,051
*Includes the 25.29% and 31% ownership of RCBC IFL in RCBC North America in 2009 and 2008, respectively.
The following table presents the audited financial information (except for HCPI and GLFAC for which 2009 and 2008 information were based on unaudited financial statements) on the significant associates as of and for the years ended December 31, 2009 and 2008: Income Assets Liabilities Revenues (Loss) 2009: RRC P 8,806,554 P 2,626,142 P 1,283,114 P 459,236 RLI 847,630 199,964 1,252 ( 6,363 ) HCPI 3,754,622 1,522,563 13,148,182 30,925 2008: RRC P 9,060,000 P 2,608,410 P 1,154,322 P 335,398 RLI 1,027,227 175,198 38,747 ( 17,750) GLFAC 3,210,333 2,148,668 617,376 26,981

- 82 -
The Parent Company, under a shareholders agreement, agreed with another stockholder of HCPI, to commit and undertake to vote as a unit the shares of stock thereof, which they proportionately own and hold, and to regulate the conduct of the voting and the relationship between them with respect to their exercise of their voting rights. As a result of this agreement, the Parent Company is able to exercise significant influence over the operating and financial policies of HCPI. Thus, HCPI has been accounted for using the equity method. RCBC Capital entered into an agreement with another stockholder of RHI to commit and undertake to vote as a unit the shares of stock of RHI, representing 54.68% of the outstanding capital stock thereof, which they own and hold, to regulate the conduct of the voting and the relationship between them with respect to the exercise of the voting rights. Thus, notwithstanding the RCBC Capital’s ownership of only 4.71% in RHI, its investment is carried under the equity method of accounting. On November 27, 2006, as part of its corporate restructuring strategy, the Parent Company’s BOD approved the capital infusion of P1 billion each into Bankard and RCBC Capital. The Parent Company, in its letter to the BSP dated January 9, 2007, requested for the approval of such capital infusion by way of conversion of Bankard’s and RCBC Capital’s debt to the Parent Company into equity which was approved by BSP on February 23, 2007. Thereafter, on January 4, 2008, the application for increase in Bankard’s authorized capital to cover the Parent Company’s capital infusion was approved by the SEC. Starting 2008, with the capital infusion (previously classified as Deposit for Stock Subscription) applied against subscription to Bankard’s capital stock, the Parent Company now holds direct percentage interest of 66.58%. Prior to 2008 and the additional capital infusion made by the Parent Company to Bankard, the Parent Company owns 59% indirectly of Bankard’s net assets through RCBC Capital. As a result of the capital infusion, the Parent Company’s interest in Bankard’s net assets increased to 91.69% (representing 66.58% direct ownership and 25.11% indirect ownership through RCBC Capital). This change in ownership with Bankard did not result on gaining or losing control. In accordance with the relevant accounting standards, Parent Company and Non-controlling Interest (other than RCBC Capital) share in Bankard’s net assets were adjusted to reflect the changes in their relative interest. The difference between the amount of additional investment made by the Parent Company and the adjustment in the Non-controlling Interest share in Bankard’s net assets amounting to P240,889, was recognized directly in equity and presented as Other Reserves in the statements of changes in capital funds for the years ended December 31, 2009 and 2008. After a series of earlier consultations and discussions among the parties and BSP, the Parent Company entered into a formal Reorganization Agreement and Deed of Assignment of Rights with PMMIC and RLI on December 26, 2007 to transfer RLI’s ownership with RRC to the Parent Company and PMMIC by 25% and 15%, respectively, in exchange of partial and full settlement of RLI’s obligations with the Parent Company and PMMIC, respectively. The Parent Company recorded its equity investment with RRC by the carrying amount of loan paid and the interest income accrued which amounted to P2,071,777. This was earlier approved by the BSP on September 27, 2007 through MB Resolution No. 1097. RRC redeemed a certain percentage of its preferred shares which resulted to the decrease in the Parent Company’s cost of investment by P52,614 and P71,843 in 2009 and 2008, respectively.

- 83 -
On October 30, 2007, the Parent Company’s BOD approved the acquisition of 96.38% interest in Merchants Bank for P493,039, inclusive of capital gains tax, property claims and buyer’s tax claims which was temporarily held in escrow upon determination of the final amount of tax claims that will be paid by Merchants Bank through the Parent Company. This investment cost was reduced to P492,389 in 2009 as a result of the tax claims amounting to P650 which was returned to the Parent Company in 2009. On May 25, 2009, the BOD of the Parent Company approved the reclassification of its investment in NPHI with carrying amount of P388,431 from Investment Property account to Investments in Subsidiaries and Associates account in accordance with BSP Circular No. 520 (see Note 14). On February 12 and 13, 2009, an agreement was executed between the Parent Company and JPL whereby the Parent Company infused an initial amount of P125,000 in JPL as stock subscription which resulted in the Parent Company’s 33% ownership and full management control of JPL . The Parent Company was also granted the option to own the remaining 66% of the outstanding shares of the JPL by way of future equity infusion into JPL of P125,000 on February 2010 and another P125,000 on February 2011 bringing the total equity investment of the Parent Company to P375,000 or 99% by 2011. In March 2009, the Parent Company made an additional investment amounting to P50,000. On December 29, 2009, BSP approved JPL’s proposed amendments on its articles of incorporation which includes, among others, the reduction of the par value of JPL’s common stock from P100 per share to P1.00 per share. These amendments were subsequently approved by the SEC on March 4, 2010. On March 16, 2009, JPL’s BOD approved the increase in its authorized capital stock. As of December 31, 2009, such proposed increase is pending approval by the SEC. As of December 31, 2009, the Parent Company has full management control of JPL and, accordingly, recognized its full stock subscription to JPL (net of subscription payable amounting to P200,000) and presented as Deposit for future Stock Subscription (presented under Investments in Subsidiaries and Associates account) pending approval by the SEC of the proposed increase in authorized capital stock of JPL. On October 12, 2009, the Parent Company sold its 20% shareholdings with GLFAC for the amount of P211,488 to Grepalife in accordance with the sale and purchase agreement entered into between the two parties.

- 84 -
13. BANK PREMISES, FURNITURE, FIXTURES AND EQUIPMENT
The gross carrying amounts and accumulated depreciation, amortization and impairment at the beginning and end of 2009 and 2008 are shown below. Consolidated
Furniture, Leasehold Fixtures and Rights and Land Buildings Equipment Improvements Total December 31, 2009 Cost P 1,438,279 P 1,736,213 P 3,466,248 P 991,279 P 7,632,019 Accumulated depreciation, amortization and impairment - ( 698,569 ) ( 2,108,646 ) ( 70,683 ) ( 2,877,898 ) Net carrying amount P 1,438,279 P 1,037,644 P 1,357,602 P 920,596 P 4,754,121 December 31, 2008 Cost P 1,102,951 P 1,579,867 P 2,941,206 P 956,548 P 6,580,572 Accumulated depreciation, amortization and impairment ( 10,831 ) ( 616,060 ) ( 1,878,153 ) ( 45,759 ) ( 2,550,803 ) Net carrying amount P 1,092,120 P 963,807 P 1,063,053 P 910,789 P 4,029,769 January 1, 2008 Cost P 1,074,222 P 1,494,050 P 2,420,036 P 799,484 P 5,787,792 Accumulated depreciation, amortization, and impairment - ( 533,786 ) ( 1,735,538 ) ( 14,652 ) ( 2,283,976 ) Net carrying amount P 1,074,222 P 960,264 P 684,498 P 784,832 P 3,503,816
Parent
Furniture, Leasehold Fixtures and Rights and Land Buildings Equipment Improvements Total December 31, 2009 Cost P 693,259 P 1,382,220 P 2,645,002 P 817,905 P 5,538,386 Accumulated depreciation and amortization - ( 539,819 ) ( 1,615,940 ) - ( 2,155,759 ) Net carrying amount P 693,259 P 842,401 P 1,029,062 P 817,905 P 3,382,627 December 31, 2008 Cost P 668,740 P 1,288,176 P 2,195,692 P 821,491 P 4,974,099 Accumulated depreciation and amortization - ( 484,029 ) ( 1,452,442 ) - ( 1,936,471 ) Net carrying amount P 668,740 P 804,147 P 743,250 P 821,491 P 3,037,628 January 1, 2008 Cost P 678,438 P 1,269,650 P 1,821,953 P 731,406 P 4,501,447 Accumulated depreciation and amortization - ( 431,924 ) ( 1,355,549 ) - ( 1,787,473 ) Net carrying amount P 678,438 P 837,726 P 466,404 P 731,406 P 2,713,974

- 85 -
A reconciliation of the carrying amounts at the beginning and end of 2009 and 2008, of bank premises, furniture, fixtures and equipment is shown below.
Consolidated
Furniture, Leasehold Fixtures and Rights and Land Buildings Equipment Improvements Total Balance at January 1, 2009, net of accumulated depreciation, amortization, and impairment P 1,092,120 P 963,807 P 1,063,053 P 910,789 P 4,029,769 Additions 365,735 160,123 677,523 137,050 1,340,431 Disposals ( 19,576 ) ( 5,649 ) ( 57,033 ) ( 24 ) ( 82,282 ) Depreciation and amortization charge for the year - ( 80,637 ) ( 325,941 ) ( 127,219 ) ( 533,797 ) Balance at December 31, 2009, net of accumulated depreciation, amortization, and impairment P 1,438,279 P 1,037,644 P 1,357,602 P 920,596 P 4,754,121 Balance at January 1, 2008, net of accumulated depreciation, amortization, and impairment P 1,074,222 P 960,264 P 684,498 P 784,832 P 3,503,816 Additions 69,358 96,851 650,963 218,287 1,035,459 Disposals ( 40,629 ) ( 15,988 ) ( 29,091 ) - ( 85,708 ) Depreciation and amortization charge for the year - ( 72,234 ) ( 243,317 ) ( 92,330 ) ( 407,881 ) Impairment loss (see Note 16) ( 10,831 ) ( 5,086 ) - - ( 15,917 ) Balance at December 31, 2008, net of accumulated depreciation, amortization, and impairment P 1,092,120 P 963,807 P 1,063,053 P 910,789 P 4,029,769 Parent Furniture, Leasehold Fixtures and Rights and Land Buildings Equipment Improvements Total Balance at January 1, 2009, net of accumulated depreciation and amortization P 668,740 P 804,147 P 743,250 P 821,491 P 3,037,628 Additions 24,519 94,044 550,782 102,971 772,316 Disposals - - ( 50,167 ) ( 24 ) ( 50,191 ) Depreciation and amortization charge for the year - ( 55,790 ) ( 214,803 ) ( 106,533 ) ( 377,126 ) Balance at December 31, 2009, net of accumulated depreciation and amortization P 693,259 P 842,401 P 1,029,062 P 817,905 P 3,382,627

- 86 -
Parent Furniture, Leasehold Fixtures and Rights and Land Buildings Equipment Improvements Total Balance at January 1, 2008, net of accumulated depreciation and amortization P 678,438 P 837,726 P 466,404 P 731,406 P 2,713,974 Additions 650 25,093 455,382 168,023 649,148 Disposals ( 10,348 ) ( 4,455 ) ( 22,192 ) - ( 36,995 ) Depreciation and amortization charge for the year - ( 54,217 ) ( 156,344 ) ( 77,938 ) ( 288,499 ) Balance at December 31, 2008, net of accumulated depreciation and amortization P 668,740 P 804,147 P 743,250 P 821,491 P 3,037,628
In October 2009, the Parent Company, RSB and Bankard entered into an agreement with Grepalife and Malayan Insurance Company, Inc., all related parties, to form a consortium for the pooling of their resources and establishment of an unincorporated joint venture for the construction and development of high rise, mixed use commercial/office building. The initial cash contribution of the Parent Company and Bankard to the joint venture amounted to P40,499 and P24,290 as of December 31, 2009, respectively, and the land costing P315,000 were recorded as part of Buildings and Land accounts (see Note 30). Under BSP rules, investments in bank premises, furniture, fixtures and equipment should not exceed 50% of the respective unimpaired capital of the Parent Company and RSB. As of December 31, 2009 and 2008, the Parent Company and RSB have satisfactorily complied with this BSP requirement.
14. INVESTMENT PROPERTY
Investment property consists of various land and building acquired through foreclosure or dacion as payment of outstanding loans by the borrowers. A reconciliation of the carrying amounts at the beginning and end of 2009 and 2008, and the gross carrying amounts and the accumulated depreciation and impairment of investment property are as follows:
Consolidated Parent 2009 2008 2009 2008 Balance at January 1, net of accumulated depreciation and impairment P 7,387,613 P 7,761,435 P 3,500,460 P 3,887,545 Additions 1,825,943 1,338,653 222,812 563,040 Disposal ( 777,449) ( 1,338,863 ) ( 327,503) ( 886,704 ) Reclassification to investment in subsidiaries ( 3,092,154) - ( 388,431) - Write-off ( 25,895) ( 244,779) ( 25,365) - Depreciation and impairment charges for the year ( 251,515) ( 128,833 ) ( 108,708) ( 63,421 ) Balance at December 31, net of accumulated depreciation and impairment P 5,066,543 P 7,387,613 P 2,873,265 P 3,500,460

- 87 -
Consolidated Parent 2009 2008 2009 2008
December 31
Cost P 6,546,189 P 9,013,278 P 3,661,410 P 4,354,687 Accumulated depreciation and impairment (see Note 16) ( 1,479,646) ( 1,625,665) ( 788,145) ( 854,227 ) Net carrying amount P 5,066,543 P 7,387,613 P 2,873,265 P 3,500,460
The fair value of investment property as of December 31, 2009 and 2008, based on the available appraisal values, amounted to P8,978,128 and P11,025,506, respectively, for the Group; and P5,484,871 and P5,670,707, respectively, for the Parent Company. On May 25, 2009, the BOD of the Parent Company approved the reclassification of its investment in NPHI with carrying amount of P388,431 from Investment Property account to Investments in Subsidiaries and Associates account (see Note12) in accordance with BSP Circular No. 520. This resulted into the consolidation of NPHI’s assets, liabilities and net income in the Group’s financial statements as of and for year ended December 31, 2009. In November 2003, RSB entered into a memorandum of Agreement (MOA) with certain borrowers for the settlement of their indebtedness with RSB amounting to P4.1 billion through dacion of certain real properties. Under the MOA, the transfer of the properties may be effected through the creation of special purpose companies (SPCs). On June 17, 2004, RSB entered into another MOA setting the guidelines in creating the SPC as well as the ultimate assignment to RSB of the shares of stock of the SPCs. On various dates in 2005 and 2004, certain SPCs were incorporated and created, covering certain real properties with carrying values of P2,472,830 and P1,938,234 in 2005 and 2004, respectively, being assigned to the SPCs. Moreover, the shares of stock of certain SPCs were transferred to RSB in 2005 and 2004. In 2008, the remaining properties covered by the MOA have been transferred to specific SPCs, and the ultimate assignment of the corresponding shares of stock of these specific SPCs to RSB has been effected. There were no new SPCs that were incorporated nor shares of stock that were transferred to RSB in 2006 to 2009. Prior to 2009, the real properties, although assigned to the incorporated SPCs or will be incorporated SPCs, are recognized by RSB as part of Investment Property on the basis that the SPCs are merely transitory holders of the assets while RSB is looking for ways to eventually dispose of such assets. This treatment is consistent with the letter of the BSP to RSB in 2005 which emphasized that the dacioned properties be recorded as ROPA-Real Properties, and which were subsequently reclassified as Investment Property when RSB transitioned to PFRS. However, in 2009, in accordance with another letter received by RSB from the BSP dated March 26, 2009, RSB reclassified these investment property to equity investments, subject to the following conditions: (i) RSB should immediately dissolve the SPCs once the underlying dacioned real property assets are sold or disposed; and, (ii) the equity investments in the SPCs shall be disposed of within a reasonable period not beyond October 5, 2012. The reclassification resulted into consolidation of the SPCs in the Group’s financial statements. Accordingly, the assets, liabilities, income and expenses of the SPCs were consolidated in the Group’s financial statements as of and for the year ended December 31, 2009.

- 88 -
In its meeting on February 19, 2007, the BOD of RSB approved the sale of certain NPAs to Innovative Property Solutions, Inc. (IPSI), a corporation duly organized and existing under Philippine laws. An Asset Sale Agreement was executed by both parties on February 26, 2007 to formalize the sale of the NPAs. Subsequently, in a separate Accession Agreement dated July 16, 2007, IPSI assigned all its rights and obligations as the purchaser in the aforementioned Asset Sale Agreement to NPRMI, an SPV entity. The BSP approved and issued on August 28, 2007 the certificate of eligibility of the NPAs under the SPV Act of 2002 and transfer/sale of the assets to NPRMI. In November 2008, RSB completed the obligations as stated under the Asset Sale Agreement and Accession Agreement to fully consummate the transaction and in accordance with the provisions of RA No. 9182 (the SPV Act) and BSP Resolution No. 135, recognized the aforementioned sale. The significant terms and conditions of the “asset sale” agreement follow:
• The SPVs shall issue 10-year subordinated/SPV notes in exchange for the NPLs
transferred. The issuance of the subordinated/SPV notes constitutes full settlement for the NPLs transferred.
• The subordinated/SPV notes are subordinated in priority of payment to the senior
notes and any other working capital notes of the SPV. • The amount and schedule of payment of the subordinated/SPV notes shall be
contingent and dependent on the amount and timing of collections to be made by the SPVs on the NPLs transferred, subject to the rights and privileges of the SPV’s other creditors.
In consideration of the sale, RSB received cash amounting to P347 and subordinated note with a face value of P60,097. One of the significant conditions stated in the terms of the subordinated/SPV notes from NPRMI is that the amount and timing of payment of the subordinated/SPV notes are dependent on the collections to be made by NPRMI on the NPAs transferred. RSB initially recognized the subordinated note as AFS securities amounting to P60,097 but subsequently provided an allowance for impairment for the entire amount.

- 89 -
15. OTHER RESOURCES Other resources consist of the following:
Consolidated Parent 2009 2008 2009 2008 Deferred charges - net (see Note 11.2) P 7,359,991 P 8,094,653 P 7,359,991 P 8,094,653 Real estate properties for sale 2,698,942 - - - Foreign currency notes and coins on hand 1,148,555 1,701,866 1,018,118 1,494,082 Goodwill - net 425,985 426,635 - - Branch licenses 264,429 - - - Prepaid expenses 247,770 510,866 201,018 457,683 Returned checks and other cash items 154,843 168,469 154,776 168,465 Assets held-for-sale 141,195 - - - Inter-office float items 100,457 59,721 228,399 187,909 Unused stationery and supplies 91,459 154,954 90,503 153,843 Miscellaneous checks and other cash items 12,877 20,492 12,854 20,487 Miscellaneous (see Note 25) 928,935 919,987 543,869 372,429 13,575,438 12,057,643 9,609,528 10,949,551 Accumulated depreciation ( 11,419) ( 15,270 ) ( 11,419 ) ( 15,270) Allowance for impairment (see Note 16) ( 153,975) ( 150,280 ) ( 122,763 ) ( 116,733) P 13,410,044 P 11,892,093 P 9,475,346 P 10,817,548
Deferred charges mainly represent the unamortized balance of the required additional allowance for impairment and losses as determined from the asset exchanges of the Parent Company’s NPAs to certain SPVs; these are amortized over a period of 10 years in accordance with BSP Resolution No. 135 (see Note 11.2). In addition, this account also includes the cost of software, net of accumulated amortization. The following shows the movement in the Group’s Deferred Charges account.
Consolidated Parent 2009 2008 2009 2008 Balance at beginning of year P 8,094,653 P 9,167,132 P 8,094,653 P 9,167,132 Additions 187,057 167,089 187,057 167,089 Amortization/disposals ( 921,719 ) ( 1,239,568 ) ( 921,719 ) ( 1,239,568 ) Balance at end of year P 7,359,991 P 8,094,653 P 7,359,991 P 8,094,653
The total amortization pertaining to SPVs amounted to P834,633 and P745,342 for the years ended December 31, 2009 and 2008, respectively. The Parent Company charged the amortization for the year ended December 31, 2009 against Surplus. On the other hand, out of the total amortization of P745,342 for the year ended December 31, 2008, P536,684 was charged against the “freed” allowance for impairment while P208,658 was charged to profit or loss (see Note 11). The total amortization pertaining to the computer software amounted to P51,726, P42,247 and P34,067 for the years ended December 31, 2009, 2008 and 2007, respectively, both for the Group and Parent Company’s financial statements, respectively.

- 90 -
Real estate properties for sale represent those properties held by SPCs that were consolidated to the Group’s statement of financial position as of December 31, 2009 (see Note 14). On May 14, 2009, BSP approved the Parent Company’s acquisition of JPL under the terms and conditions specified under the Term Sheet dated February 12, 2009 and Addendum to Term Sheet dated February 13, 2009, executed by the Parent Company and JPL subject to certain conditions (see Note 12). As a result of this approval to acquire JPL through capital infusion over three years, the Parent Company recognized the excess of the total cost of investment over the allocated net assets of JPL amounting to P264,429 as Branch Licenses in its financial statements.
16. ALLOWANCE FOR IMPAIRMENT Changes in the allowance for impairment are summarized as follows: Consolidated Parent Notes 2009 2008 2009 2008 Balance at beginning of year Loans and receivables 11 P 7,943,278 P 9,935,036 P 4,943,286 P 5,812,828 Available-for-sale securities 10 811,207 779,304 811,207 779,304 Investment in subsidiaries and associates 12 52,500 52,500 252,500 252,500 Bank premises 13 18,911 - - -
Investment property 14 963,466 1,244,281 429,183 491,015 Other resources 15 150,280 369,225 116,733 174,553 9,939,642 12,380,346 6,552,909 7,510,200
Provisions during the year 2,329,616 2,053,033 1,683,463 1,830,597 Recovery of impairment losses ( 86,424 ) ( 1,054,541 ) - ( 1,000,000) Charge-offs during the year ( 2,319,269 ) ( 3,439,196 ) ( 1,725,610) ( 1,787,888) Balance at end of year
Loans and receivables 11 7,465,624 7,943,278 4,433,774 4,943,286 Available-for-sale securities 10 1,336,264 811,207 1,276,157 811,207 Investment in subsidiaries and associates 12 52,500 52,500 252,500 252,500 Bank premises 13 - 18,911 - -
Investment property 14 855,202 963,466 425,568 429,183 Other resources 15 153,975 150,280 122,763 116,733 P 9,863,565 P 9,939,642 P 6,510,762 P 6,552,909

- 91 -
17. DEPOSIT LIABILITIES
The following is the breakdown of deposit liabilities: Consolidated Parent 2009 2008 2009 2008 Demand P 11,034,257 P 11,125,069 P 8,535,205 P 8,392,524 Savings 93,571,654 75,738,446 81,165,706 66,269,393 Time 115,671,983 109,363,471 90,852,468 84,267,161 P 220,277,894 P 196,226,986 P 180,553,379 P 158,929,078 The maturity profile of the deposit liabilities follow: Consolidated Parent 2009 2008 2009 2008 Within one year P 212,118,663 P 191,875,263 P 176,370,989 P 158,739,468 Beyond one year, within five years 8,158,163 4,351,723 4,182,390 189,610 Beyond five years 1,068 - - - P 220,277,894 P 196,226,986 P 180,553,379 P 158,929,078
Deposit liabilities are in the form of savings, demand and time deposit accounts with annual interest rates of 0.5% to 4.5% in 2009, 0.5% to 5% in 2008 and 0.5% to 4.25% in 2007. Deposit liabilities are stated at amounts they are to be paid which approximate the market value.
Under existing BSP regulations, non-FCDU deposit liabilities of the Group are subject to liquidity reserves and statutory reserves equivalent to 11% and 8%, respectively, as of December 31, 2009 and 2008. As of December 31, 2009 and 2008, the Group is in compliance with such regulations. Available reserves as of December 31, 2009 and 2008 follow:
Consolidated Parent 2009 2008 2009 2008 Cash and other cash items P 7,748,975 P 6,409,809 P 6,355,743 P 5,215,356 Due from BSP 5,272,834 4,240,275 4,056,075 3,535,622 Reserve deposit account (BSP) 13,513,000 11,797,000 13,513,000 11,797,000 Available-for-sale securities 550,462 553,498 550,462 110,361 Securities purchased under reverse repurchase agreement 71,000 25,000 - - P 27,156,271 P 23,025,582 P 24,475,280 P 20,658,339
On September 30, 2009, the Parent Company issued US$85 million worth of US$-denominated Negotiable Certificates of Time Deposits (“September NCTD”). On October 19, 2009, the Parent Company issued a second offering worth US$13.2 million of US$-denominated NCTD (“October NCTD”). The September NCTD and the October NCTD carry a fixed annual interest rate of 3.75% per annum, payable quarterly until September 30, 2012. The NCTDs are presented as part of the Time Deposit Liabilities account in both the Group and Parent Company financial statements.

- 92 -
18. BILLS PAYABLE
This account consists of borrowings from:
Consolidated Parent 2009 2008 2009 2008 Foreign banks P 8,003,907 P 12,842,101 P 8,003,907 P 12,842,101 BSP 2,130,456 7,925,719 2,130,456 7,925,719 Local banks 539,560 - 293,769 523,142 Others 107,041 684,789 107,041 119,125 P 10,780,964 P 21,452,609 P 10,535,173 P 21,410,087
The maturity profile of bills payable follows:
Consolidated Parent 2009 2008 2009 2008 Within one year P 8,972,993 P 21,388,718 P 8,727,202 P 21,381,630 Beyond one year, within five years 1,807,971 63,891 1,807,971 28,457 P 10,780,964 P 21,452,609 P 10,535,173 P 21,410,087
Borrowings with foreign and local banks are mainly short-term in nature. In the consolidated financial statements, peso borrowings are subject to annual fixed interest rates ranging from 4.75% to 5.5% in 2009 and 5% to 12% in 2008 and 2007, while foreign currency-denominated borrowings are subject to annual fixed interest rates ranging from 0.10% to 3.18% in 2009, 0.25% to 5% in 2008 and 2% to 8.41% in 2007. In the Parent Company financial statements, peso borrowings are subject to annual fixed interest rates ranging from 3.50% to 4.75% in 2009, 5% to 6.7% in 2008 and 5% to 12% in 2007, while foreign currency-denominated borrowings are subject to annual fixed interest rates ranging from 0.10% to 3.18% in 2009, 0.25% to 5% in 2008 and 2% to 8.41% in 2007. The interest rates on bills payable maturing beyond one year are repriced semi-annually at effective market interest rates. Bills payable include rediscounting availments from the BSP amounting to P2,130,456 and P7,925,719 as of December 31, 2009 and 2008, respectively, both in the consolidated and Parent Company financial statements. Such borrowings are collateralized by the assignment of certain loans amounting to P2,354,515 and P10,729,055 as of December 31, 2009 and 2008, respectively, both in the consolidated and Parent Company financial statements (see Note 11).

- 93 -
19. BONDS PAYABLE On February 23, 2005, the Parent Company issued to local and foreign entities (excluding those in the United States of America) unsecured bonds (Global Notes) with a principal amount of US$150,000 at an issue price of 99.67% and bearing an interest of 6.875% per annum. The Global Notes, unless previously redeemed or cancelled, will be redeemed on February 24, 2010. The Parent Company, at the option of the holder of the Global Notes, redeemed portion of the Global Notes with principal amount of US$10,678 on February 23, 2008. Interest is payable semi-annually in arrears on February 23 and August 23 of each year commencing on August 23, 2005, except that the last payment of the interest will be on February 24, 2010. As of December 31, 2009 and 2008, the peso equivalent of the outstanding bond issue amounted to P5,836,076 and P6,002,821, respectively. In February 2010, the outstanding principal balance of US$139,322 was fully redeemed. Also, in February 2010, the Parent Company issued US$ denominated Senior Notes with principal amount of US$250,000 bearing an interest of 6.25% per annum, payable semi-annually in arrears on February 9 and August 9 of each year, commencing on August 9, 2010. The Senior Notes, unless redeemed, will mature on February 9, 2015.
20. ACCRUED TAXES, INTEREST AND OTHER EXPENSES The composition of this account follows:
Consolidated Parent 2009 2008 2009 2008 Accrued expenses P 1,364,718 P 1,056,690 P 916,753 P 722,290 Accrued interest payable 869,539 1,055,671 801,318 929,048 Taxes payable 179,686 69,172 77,585 17,843 Others 835,911 605,923 530,486 306,871 P 3,249,854 P 2,787,456 P 2,326,142 P 1,976,052

- 94 -
21. OTHER LIABILITIES
Other liabilities consist of the following:
Consolidated Parent 2009 2008 2009 2008 Accounts payable P 2,260,356 P 2,788,020 P 1,660,398 P 2,024,610 Bills purchased - contra 1,790,172 1,675,239 1,790,172 1,675,239 Manager’s checks 703,662 643,652 485,163 433,551 Derivatives with negative fair values (see Note 8) 703,604 329,505 703,604 329,505 Unearned income 399,336 518,400 399,282 518,400 Outstanding acceptances payable 250,421 318,908 250,421 318,908 Other credits 161,555 154,426 137,330 125,268 Payment orders payable 120,115 196,071 89,101 151,212 Withholding taxes payable 114,918 125,103 89,671 96,634 Guaranty deposits 91,674 60,369 91,674 60,369 Sundry credits 39,793 23,741 39,777 23,651 Due to BSP 24,179 107,923 24,179 93,365 Due to other banks 21,042 1,452 21,042 1,452 Miscellaneous 218,069 278,902 107,765 105,646 P 6,898,896 P 7,221,711 P 5,889,579 P 5,957,810 22. SUBORDINATED DEBT
On November 26, 2007, the Parent Company’s BOD approved the issuance of P7 billion unsecured subordinated notes (the “P7 billion Notes”) with the following significant terms and conditions: a. The P7 billion Notes shall mature on February 22, 2018, provided that they are not
previously redeemed. b. Subject to satisfaction of certain regulatory approval requirements, the Parent
Company may, on February 22, 2013, redeem all of the outstanding notes at redemption price equal to 100% of the face value of the P7 billion Notes together with accrued and unpaid interest thereon.
c. The P7 billion Notes bear interest at the rate of 7% per annum from
February 22, 2008 and shall be payable quarterly in arrears at the end of each interest period on May 22, August 22, November 22 and February 22 each year.
d. Unless the P7 billion Notes are previously redeemed, the interest rate from 2013 to 2018 will be reset at the equivalent of the five-year Fixed Rate Treasury Note benchmark bid yield as of February 22, 2013 multiplied by 80% plus 3.53% per annum. Such stepped-up interest shall be payable quarterly commencing 2013.
The P7 billion Notes were issued on February 22, 2008 and were fully subscribed. The
carrying amount of the P7 billion Notes amounted to P6,954,332 and P6,941,899 as of December 31, 2009 and 2008, respectively.

- 95 -
On January 26, 2009, the Parent Company’s BOD approved another issuance of P4 billion unsecured subordinated notes (the “P4 billion Notes”) with the following significant terms and conditions: a. The P4 billion Notes shall mature on May 15, 2019, provided that they are not
previously redeemed. b. Subject to satisfaction of certain regulatory approval requirements, the Parent
Company may, on May 15, 2014, redeem all of the outstanding notes at redemption price equal to 100% of the face value of the P4 billion Notes together with accrued and unpaid interest thereon.
c. The P4 billion Notes bear interest at the rate of 7.75% per annum from
May 15, 2009 and shall be payable quarterly in arrears at the end of each interest period on August 15, November 15, February 15 and May 15 each year.
d. Unless the P4 billion Notes are previously redeemed, the interest rate from
May 15, 2014 to May 15, 2019 will be increased to the rate equivalent to 80% of benchmark rate as of the first day of the 21st interest period plus the step-up spread. Such stepped up interest shall be payable quarterly in arrears.
The P4 billion Notes were issued on May 15, 2009 and were fully subscribed. The carrying amount of the P4 billion Notes amounted to P3,972,646 as of December 31, 2009.
The subordinated debt is measured at amortized cost at each statement of financial position date.
23. CAPITAL FUNDS
23.1 Capital Stock
Capital stock consists of (amounts and shares in thousands, except per par value): Shares 2009 2008 2007 Preferred stock – voting, non-cumulative non-redeemable, participating, convertible into common shares – P10 par value Authorized – 200 million shares Issued and outstanding 20,704 85,934 85,951 Common stock – P10 par value Authorized – 1,100 million shares Issued and outstanding 990,551 962,843 962,837

- 96 -
Amount 2009 2008 2007 Preferred stock – voting, non-cumulative non-redeemable, participating, convertible into common shares – P10 par value Authorized – 200 million shares Issued and outstanding P 207,038 P 859,335 P 859,512 Common stock – P10 par value Authorized – 1,100 million shares Issued and outstanding P 9,905,508 P 9,628,430 P 9,628,369
On January 22, 2007, the Parent Company stockholders, owning or representing more than 2/3 of the outstanding capital stock, unanimously confirmed and ratified the approval by the majority of the BOD held on December 4, 2006, the increase of the Parent Company’s authorized capital stock from P9,000,000 to P13,000,000, by amending its Articles of Incorporation. The increase in authorized capital stock of the Parent Company was approved by the BSP and SEC on February 12, 2007 and March 8, 2007, respectively. The authorized capital stock of the Parent Company of P13 billion is divided into the following classes of shares:
a. One billion one hundred million (1,100 million) common shares of stock with
par value of ten pesos (P10.00) per share; and,
b. Two hundred million (200 million) preferred shares of stock with par value of ten pesos (P10.00) per share.
On March 29, 2007 and April 13, 2007, the Parent Company issued additional shares from its unissued common shares with total par value amounting to P1,826,087 and P273,913, respectively. The corresponding additional paid-in capital on the additional issuances of shares amounted to P3,362,275. On May 29, 2006, the Parent Company’s stockholders approved the issuance of up to 200,000 thousand convertible preferred shares with a par value of P10 per share, subject to the approval, among others of the PSE. The issuance of the convertible preferred shares was also approved by the Parent Company’s stockholders on May 29, 2006. The purpose of the issuance of the preferred shares is to raise the Tier 1 capital pursuant to BSP regulations, thereby strengthening the capital base of the Parent Company and allowing it to expand its operations. On February 13, 2007, the PSE approved the listing application of the underlying common shares for the 105,494 thousand convertible preferred shares, subject to the compliance of certain conditions of the PSE. Preferred shares have the following features: a. Entitled to dividends at floating rate equivalent to the applicable base rate plus a
spread of 2% per annum, calculated quarterly;
b. Convertible to common stocks at any time after the issue date at a conversion price using the adjusted net book value per share of the Parent Company based on the latest available financial statements prepared in accordance with PFRS adjusted by local regulations;

- 97 -
c. Non-redeemable; and,
d. Participating as to dividends on a pro rata basis with the common stockholders in the Surplus of the Parent Company after quarterly dividends payments had been made to the preferred shares.
In 2009, P652 million or 65 thousand preferred shares were converted to 27.7 thousand common shares. In 2008, P0.20 million or 17.7 thousand preferred shares were converted to 6 thousand common shares. Common shares may be transferred to Philippine and foreign nationals and shall, at all times, not be less than 60% and not more than 40% of the voting stock, be beneficially owned by Philippine nationals and by foreign nationals, respectively. The determination of the Parent Company’s compliance with regulatory requirements and ratios is based on the amount of the Parent Company’s “unimpaired capital” (regulatory net worth) required and reported to the BSP, determined on the basis of regulatory accounting policies, which differ from PFRS in some aspects. Specifically, under existing banking regulations, the combined capital accounts of the Parent Company should not be less than an amount equal to 10% of its risk assets. A portion of the Group’s surplus corresponding to the undistributed income of subsidiaries and equity in net earnings of certain associates totaling P1,813,912, P1,450,528, and P1,216,532 as of December 31, 2009, 2008 and 2007, respectively, is not currently available for distribution as dividends. 23.2 Declaration of Stock Dividends The shareholders confirmed and ratified the approval by the majority of the BOD during the December 4, 2006 meeting, of a 15% stock dividend corresponding to 109,413 thousand shares, to support the foregoing increase of authorized capital stock, payable to holders of common and preferred class shares of record as of March 14, 2007. The 15% stock dividend was approved by the BSP on January 26, 2007 and by the SEC on March 8, 2007, and was issued on March 19, 2007. Documentary stamp tax (DST) on the stock dividends amounting to P15,325 was deducted from capital paid in excess of par.

- 98 -
23.3 Purchase of Treasury Shares On March 16, 2009, the BOD of the Parent Company approved the acquisition of 92,421,320 common shares and 18,082,311 convertible preferred shares at P15.20 per share and P10.00 per share, respectively. Total cost of purchasing the treasury shares including the buying charges and documentary stamp taxes incurred amounted to P1,594,925. On September 1, 2009, majority of the stockholders approved the reissuance of the 41,993,389 common treasury shares amounting to P642,216 in exchange for 5.64% ownership or 169,059 shares of stock in MICO Equities, Inc. (MICO) amounting to P734,884. The excess of the carrying amount of the investment in MICO over the cost of treasury stock re-issued amounting to P92,669 was recognized as part of Capital Paid in Excess of Par in the consolidated and Parent Company’s financial statements as of December 31, 2009. The remaining balance of the total cost of purchasing the treasury shares amounting to P952,709 was presented as Treasury Stock in the consolidated and Parent Company’s financial statements as of December 31, 2009. 23.4 Cash Dividend Declaration The details of the cash dividend declarations and distributions in 2009, 2008 and 2007 follow: Date Dividend Stockholders of Date Approved by Date Declared Per Share Total Amount Record as of BOD BSP Paid/Payable October 30, 2007 P 0.1829 P 15,054 December 21, 2007 October 30, 2007 January 4, 2008 January 10, 2008 January 28, 2008 P 0.1740 P 14,945 March 21, 2008 January 28, 2008 April 4, 2008 April 17, 2008 July 30, 2007 * P 207,572 * July 30, 2007 April 4, 2008 April 25, 2008 March 31, 2008 P 0.1177 P 10,671 June 21, 2008 March 31, 2008 June 19, 2008 July 3, 2008 March 31, 2008 P 0.4800 P 462,165 June 29, 2008 March 31, 2008 June 19, 2008 June 30, 2008 March 31, 2008 P 0.4800 P 41,248 June 29, 2008 March 31, 2008 June 19, 2008 June 30, 2008 June 30, 2008 P 0.1227 P 10,445 September 21, 2008 June 30, 2008 September 3, 2008 September 30, 2008 July 30, 2007 P * P 241,893 * July 30, 2007 September 3, 2008 October 24, 2008 September 29, 2008 P 0.1331 P 11,317 December 21, 2008 September 29, 2008 February 10, 2009 February 23, 2009 September 29, 2008 * P 239,123 * September 29, 2008 April 16, 2009 April 24, 2009 September 29, 2008 * P 232,038 * September 29, 2008 September 1, 2009 October 27, 2009 January 26, 2009 P 0.0881 P 5,978 December 31, 2008 January 26, 2009 April 16, 2009 May 8, 2009 March 30, 2009 P 0.0824 P 5,589 February 28, 2009 March 30, 2009 June 10, 2009 July 3, 2009 March 30, 2009 P 0.3060 P 20,762 March 11, 2009 March 30, 2009 June 10, 2009 July 13, 2009 March 30, 2009 P 0.3060 P 266,349 March 11, 2009 March 30, 2009 June 10, 2009 July 13, 2009 June 29, 2009 P 0.0667 P 4,526 May 31, 2009 June 29, 2009 September 1, 2009 September 10, 2009 September 28, 2009 P 0.0579 P 146 December 21, 2009 September 28, 2009 December 7, 2009 January 5, 2010 September 28, 2009 * P 228,113 * September 28, 2009 Pending Pending * Cash dividends on Hybrid perpetual securities
24. HYBRID PERPETUAL SECURITIES On October 30, 2006, the Parent Company received the proceeds from the issuance of Non-Cumulative Step-Up Callable Perpetual Securities (“Perpetual Securities”) amounting to US$98.045 million, net of fees and other charges. Net proceeds were used to strengthen the CAR of the Parent Company, repay certain indebtedness and, thereby, enhance its financial stability and for general corporate purposes. The issuance of the Perpetual Securities was approved by the Parent Company’s BOD on June 7, 2006.

- 99 -
The Perpetual Securities represent US$100 million, 9.875%, non-cumulative step-up callable perpetual securities issued pursuant to a trust deed dated October 27, 2006 between the Parent Company and Bank of New York - London Branch each with a liquidation preference of US$1 thousand per US$1 thousand in principal amount of the Perpetual Securities. The actual listing and quotation of the Perpetual Securities in a minimum board lot size of US$1 hundred with the Singapore Exchange Securities Trading Limited (“SGX-ST”) was on November 1, 2006. The Perpetual Securities were issued pursuant to BSP Circular 503 dated December 22, 2005 allowing the issuance of perpetual, non-cumulative securities up to US$125 million which are eligible to qualify as Hybrid Tier 1 Capital. The significant terms and conditions of the issuance of the Perpetual Securities, among others, follow: • Interest will be paid from and including October 27, 2006 (the “issue date”) to
(but excluding) October 27, 2016 (the “First Optional Redemption Date”) at a rate of 9.875% per annum payable semi-annually in arrears from April 27, 2007 and, thereafter at a rate preset and payable quarterly in arrears, of 7.02% per annum (which incorporates a step-up in margin equal to 1% above the initial credit spread after adjusting for the applicable swap spread) above the then prevailing London interbank offered rate (“LIBOR”) for three-month US dollar deposits;
• Except as described below, interest will be payable on April 27 and October 27 in each year, commencing on April 27, 2007 and ending on the First Optional Redemption Date, and thereafter (subject to adjustment for days which are not business days) on January 27, April 27, July 27, October 27 in each year commencing on January 27, 2016;
• The Parent Company may, in its absolute discretion, elect not to make any interest payment in whole or in part if the Parent Company has not paid or declared a dividend on its common shares in the preceding financial year; or determines that no dividend is to be paid on such shares in the current financial year;
• The rights and claims of the holders will be subordinated to the claims of all senior creditors (as defined in the conditions) and the holders of any priority preference shares (as defined in the conditions), in that payments in respect of the securities are conditional upon the Parent Company being solvent at the time of payment and in that no payments shall be due except to the extent the Parent Company could make such payments and still be solvent immediately thereafter;
• The Perpetual Securities are not deposits of the Parent Company and are not guaranteed or insured by the Parent Company or any party related to the Parent Company or the Philippine Deposit Insurance Corporation and they may not be used as collateral for any loan made by the Parent Company or any of its subsidiaries or affiliates;

- 100 -
• The Parent Company undertakes that, if on any Interest Payment Date payment of all Interest Payments scheduled to be made on such date is not made in full it shall not declare or pay any distribution or dividend or make any other payment on, and will procure that no distribution or dividend or other payment is made on, any junior share capital or any parity security, and it shall not redeem, repurchase, cancel, reduce or otherwise acquire any junior share capital or any parity securities, other than in the case of any partial interest payment, pro rata payments on, or redemptions of, parity securities the dividend and capital stopper shall remain in force so as to prevent the Parent Company from undertaking any such declaration, payment or other activity as aforesaid unless and until a payment is made to the holders in an amount equal to the unpaid amount (if any) of interest payments in respect of interest periods in the twelve months including and immediately preceding the date such interest payment was due and the BSP does not otherwise object; and,
• The Perpetual Securities will have fixed or final redemption date although the Parent Company may, having given not less than 30 nor more than 60 days’ notice to the Trustee, the Registrar, the Principal Paying Agent and the Holders, redeem all (but not some only) of the securities (i) on the first optional redemption date; and (ii) on each interest payment date thereafter, at an amount equal to the liquidation preference plus accrued interest.
25. EMPLOYEE BENEFITS
Expenses recognized for employee benefits are analyzed below.
Consolidated 2009 2008 2007 Salaries and wages P 1,730,326 P 1,580,233 P 1,436,465 Bonuses 505,734 442,669 416,427 Retirement - defined benefit plan 142,050 145,566 151,015 Compensated absences 92,265 83,847 78,250 Social security costs 74,345 68,739 65,477 Other short-term benefits 234,516 203,902 236,764 P 2,779,236 P 2,524,956 P 2,384,398 Parent 2009 2008 2007 Salaries and wages P 1,067,277 P 970,772 P 905,528 Bonuses 369,027 338,112 315,513 Retirement - defined benefit plan 125,882 115,610 107,394 Compensated absences 90,264 82,628 76,475 Social security costs 49,333 45,975 44,671 Other short-term benefits 162,788 129,090 190,574 P 1,864,571 P 1,682,187 P 1,640,155
The Parent Company and its subsidiaries maintain a tax-qualified, noncontributory
retirement plan that is being administered by a trustee covering all of their respective regular full-time employees.

- 101 -
The amounts of retirement benefit asset (presented as part of Other Resources - Miscellaneous) recognized in the financial statements (see Note 15) are determined as follows:
Consolidated Parent 2009 2008 2009 2008 Fair value of plan assets P 1,761,844 P 1,167,540 P 1,323,988 P 772,209 Present value of the obligation 1,958,428 1,257,968 1,578,981 993,323 Excess of obligation ( 196,584) ( 90,428) ( 254,993 ) ( 221,114 ) Addition (reduction) due to ceiling 176 ( 2,665 ) - - Unrecognized actuarial losses 267,511 168,676 295,427 257,339 Retirement benefit asset P 71,103 P 75,583 P 40,434 P 36,225
The movements in the present value of the retirement benefit obligation recognized in the books are as follows:
Consolidated Parent 2009 2008 2009 2008 Balance at the beginning of year P 1,257,968 P 1,826,186 P 993,323 P 1,516,414 Current service cost and interest cost 222,910 234,271 167,649 175,221 Actuarial losses (gains) 615,388 ( 596,644 ) 553,367 ( 501,823) Benefits paid by the plan ( 137,838) ( 205,845 ) ( 135,358 ) ( 196,489) Balance at end of the year P 1,958,428 P 1,257,968 P 1,578,981 P 993,323
The movements in the fair value of plan assets are presented below.
Consolidated Parent 2009 2008 2009 2008 Balance at the beginning of year P 1,167,540 P 1,670,105 P 772,209 P 1,352,252 Actuarial gains (losses) 515,045 ( 624,621 ) 508,409 ( 612,591 ) Expected return on plan assets 80,897 110,963 48,637 83,841 Contributions paid into the plan 136,200 216,938 130,091 145,196 Benefits paid by the plan ( 137,838) ( 205,845 ) ( 135,358 ) ( 196,489 ) Balance at end of the year P 1,761,844 P 1,167,540 P 1,323,988 P 772,209
The plan assets consist of the following:
Consolidated Parent 2009 2008 2009 2008 Assets Equity securities P 1,393,654 P 918,136 P 1,296,503 P 906,877 Government securities 571,444 461,955 353,680 276,047 Deposit with banks 127,047 181,944 48,670 26,349 Loans and receivables 78,213 47,456 75,811 27,848 Unit investment trust fund 53,242 30,000 53,242 30,000 ROPA 19,046 35,906 19,046 35,905 Long-term equity investments - 44,220 - 44,220 Other investments 62,183 23,496 20,000 - 2,304,829 1,743,113 1,866,952 1,347,246 Liabilities 542,985 575,573 542,964 575,037 P 1,761,844 P 1,167,540 P 1,323,988 P 772,209

- 102 -
Actual return on plan assets were P596 million and P557 million in 2009, while actual loss on plan assets were P513 million and P529 million in 2008, for the Group and the Parent Company, respectively.
The amounts of retirement benefit expense recognized as part of Employee Benefits account in the statements of income are as follows:
Consolidated 2009 2008 2007 Current service costs P 83,254 P 83,301 P 122,242 Interest costs 140,674 151,536 113,002 Expected return on plan assets ( 80,897) ( 110,963) ( 108,191) Net transition obligation recognized - 24,232 24,232 Retirement expense (income) due to ceiling ( 2,489) 1,048 1,161 Net actuarial losses (gains) recognized during the year 1,508 ( 3,588) ( 1,431) Retirement benefits P 142,050 P 145,566 P 151,015 Parent 2009 2008 2007 Current service costs P 56,198 P 49,205 P 82,315 Interest costs 111,451 126,014 91,286 Expected return on plan assets ( 48,637) ( 83,841) ( 84,782) Net transition obligation recognized - 24,232 24,232 Net actuarial gains recognized during the year 6,870 - ( 5,657) Retirement benefits P 125,882 P 115,610 P 107,394
For determination of the pension liability, the following actuarial assumptions were used: Consolidated 2009 2008 2007 Discount rates 9.2% 11.2% 8.3% Expected rate of return on plan assets 6% 6.3% 6.3% Expected rate of salary increases 5% 2.5% 5% Parent 2009 2008 2007 Discount rates 9.2% 11.2% 8.3% Expected rate of return on plan assets 6% 6.3% 6.3% Expected rate of salary increases 5% 2.5% 5%
26. LEASE CONTRACTS
The Parent Company and certain subsidiaries lease some of the premises occupied by their respective branches/business centers. The Group’s rental expense (included in Occupancy and Equipment-related account in the statements of income) based on the lease contracts amounted to P541,825 in 2009, P477,383 in 2008 and P440,943 in 2007, of which P430,385 in 2009, P374,226 in 2008 and P363,779 in 2007 and pertains to the Parent Company. The lease periods are from 1 to 25 years. Most of the lease contracts contain renewal options, which give the Parent Company and its subsidiaries the right to extend the lease on terms mutually agreed upon by the parties.

- 103 -
As of December 31, 2009, future minimum rentals payable under non-cancelable operating leases follow:
Consolidated Parent Within one year P 570,369 P 498,757 After one year but not more than five years 745,110 562,639 More than five years 242,181 220,446 P 1,557,660 P 1,281,842 27. MISCELLANEOUS EXPENSES
Miscellaneous expenses consist of the following:
Consolidated 2009 2008 2007 Insurance P 511,587 P 469,135 P 409,200 Management and other professional fees 460,755 433,967 340,055 Litigation/Assets acquired expense 420,765 479,199 323,089 Transportation and travel 328,538 354,705 236,527 Communication and information services 301,824 247,341 235,461 Other credit card related expenses 265,385 234,880 200,015 Advertising and publicity 260,436 263,808 396,475 Other outside services 165,943 135,859 117,071 Stationery and office supplies 116,761 112,095 146,576 Banking fees 101,028 85,715 78,741 Depreciation – investment property 89,448 111,085 79,018 Service charges 59,102 48,201 32,156 Others 565,143 430,733 394,087 P 3,646,715 P 3,406,723 P 2,988,471 Parent 2009 2008 2007 Management and other professional fees P 411,912 P 394,737 P 333,475 Insurance 375,438 347,205 306,053 Litigation/Assets acquired expense 315,458 401,435 234,940 Other credit card related expenses 265,385 234,880 200,015 Communication and information services 207,096 156,203 151,421 Advertising and publicity 188,554 190,171 365,956 Transportation and travel 165,976 167,019 164,856 Banking fees 92,341 85,715 78,741 Stationery and office supplies 81,017 79,099 75,238 Other outside services 67,042 69,746 49,507 Service charges 59,102 48,201 32,156 Depreciation – investment property 43,579 63,421 65,518 Others 383,367 350,389 340,059 P 2,656,267 P 2,588,221 P 2,397,935

- 104 -
28. INCOME AND OTHER TAXES
Under Philippine tax laws, the Parent Company and its domestic subsidiaries are subject to percentage and other taxes (presented as Taxes and Licenses in the statement of income), as well as income taxes. Percentage and other taxes paid consist principally of the gross receipts tax (GRT) and DST. In 2003, the Parent Company and its financial intermediary subsidiaries were subjected to the value-added tax (VAT) instead of GRT. However, effective January 1, 2004 as prescribed under RA No. 9238, the Parent Company and certain subsidiaries were again subjected to GRT instead of VAT. RA No. 9238, which was enacted on February 10, 2004, provides for the reimposition of GRT on banks and non-bank financial intermediaries performing quasi-banking functions and other non-bank financial intermediaries beginning January 1, 2004. The liability of the Parent Company and certain subsidiaries for GRT is based on the related regulations issued by the authorities. Income taxes include the corporate income tax discussed below, and final tax paid at the rate of 20%, which represents the final withholding tax on gross interest income from government securities and other deposit substitutes. Under the tax regulations, the regular corporate income tax rate (RCIT) applicable is 32% up to October 31, 2005 and 35% up to December 31, 2008. Effective January 1, 2009, in accordance with RA No. 9337, RCIT was reduced from 35% to 30% and nonallowable deductions for interest expense from 42% to 33% of interest income subjected to final tax. Effective July 2008, RA No. 9504 was approved giving corporate taxpayers an option to claim itemized deduction or optional standard deduction equivalent to 40% of gross sales. Once the option is made, it shall be irrevocable for the taxable year for which the option was made. In 2009 and 2008, the Group opted to continue claiming itemized deductions.
Interest allowed as a deductible expense is reduced by an amount equivalent to certain percentage of interest income subjected to final tax. Minimum corporate income tax (MCIT) of 2% on modified gross income is computed and compared with the RCIT. Any excess of the MCIT over the RCIT is deferred and can be used as a tax credit against future income tax liability for the next three years. In addition, the Group net operating loss carry over (NOLCO) is allowed as a deduction from taxable income in the next three years. In accordance with the Revenue Regulation (RR) No. 09-05 relative to the tax exemptions and privileges granted under the SPV Act, the losses incurred by the Group as a result of transferring its NPA to an SPV within the period of 2 years from April 12, 2003 shall be carried over as a deduction from its taxable gross income for a period of 5 consecutive taxable years. On December 29, 2009, the Parent Company received a certification from BIR that the exchange of shares between the Parent Company (41,993,389 common treasury shares) and PMMIC (169,059 shares of stock in MICO) is a tax-free exchange in accordance with Revenue Regulations No. 18-2001 (see Note 23).

- 105 -
Effective May 2004, RA No. 9294 restored the tax exemption of FCDUs and offshore banking units (OBUs). Under such law, the income derived by the FCDU from foreign currency transactions with nonresidents, OBUs, local commercial banks including branches of foreign banks is tax-exempt while interest income on foreign currency loans from residents other than OBUs or other depository banks under the expanded system is subject to 10% gross income tax. Interest income on deposits with other FCDUs and offshore banking units is subject to 7.5% final tax. The Parent Company’s foreign subsidiaries are subject to income and other taxes based on the enacted tax laws of the countries where they operate. The components of tax expense as reported in statements of income consist of:
Consolidated 2009 2008 2007 Current Final withholding tax P 450,566 P 480,272 P 473,421 RCIT 196,647 95,833 102,667 MCIT 97,702 88,619 87,754 Deferred tax expense (income) ( 495 ) 254,700 181,808 Tax expense reported in the statements of income P 744,420 P 919,424 P 845,650 Parent 2009 2008 2007 Current Final withholding tax P 367,207 P 444,858 P 455,622 RCIT 53,837 43,870 - MCIT 97,986 79,992 87,754 Tax expense reported in the statements of income P 519,030 P 568,720 P 543,376

- 106 -
A reconciliation of tax on pretax income computed at the applicable statutory rates to tax expense reported in the statements of income is as follows:
Consolidated 2009 2008 2007 Statutory income tax at 30% in 2009 and 35% in 2008 and 2007 P 1,224,036 P 1,082,385 P 1,431,258 Adjustments for income subjected to lower income tax rates ( 91,273) ( 33,873 ) 6,596 Tax effects of: Unrecognized temporary differences 321,449 ( 117,428 ) 221,193 Non-deductible expenses 231,533 349,017 229,489 Non-taxable income ( 1,097,760) ( 247,305 ) ( 828,917) Application of unrecognized MCIT ( 991) - - Application of unrecognized NOLCO ( 986) - - Decrease in deferred tax assets due to reduction in RCIT rate - 276 - Others 158,412 ( 113,648) ( 213,969) Tax expense reported in the statements of income P 744,420 P 919,424 P 845,650 Parent 2009 2008 2007 Statutory income tax at 30% in 2009 and 35% in 2008 and 2007 P 927,346 P 608,661 P 868,954 Adjustments for income subjected to lower income tax rates ( 46,856) ( 42,856) ( 2,382 ) Tax effects of: Unrecognized temporary differences 335,107 ( 62,429) 251,312 Non-deductible expenses 148,577 245,463 215,293 Non-taxable income ( 845,144) ( 180,119) ( 602,385) Application of unrecognized NOLCO - - ( 187,416) Tax expense reported in the statements of income P 519,030 P 568,720 P 543,376
The components of deferred tax assets - net as of December 31 follow: Consolidated Parent 2009 2008 2009 2008 Allowance for impairment P 1,407,407 P 1,391,302 P 1,389,497 P 1,389,497 Unamortized past services costs 599 1,100 - - Retirement benefits 539 - - - Unrealized foreign exchange losses 132 - - - Accrued rent 68 99 - - Gain on rediscounting ( 443) ( 799) - - Accounts receivable - 7 - - P 1,408,302 P 1,391,709 P 1,389,497 P 1,389,497
The Group did not set up deferred tax liabilities on accumulated translation adjustment, particularly those relating to its foreign subsidiaries, since their reversal can be controlled, and it is probable that the temporary difference will not reverse in the foreseeable future.

- 107 -
In light of the provision of PAS 12 Income Taxes, the Parent Company and certain subsidiaries have taken a conservative position by not recognizing deferred tax assets (liabilities) on certain temporary differences. Accordingly, the Group did not set up the net deferred tax assets on the following temporary differences:
Consolidated Parent 2009 2008 2009 2008 NOLCO P 4,587,890 P 10,319,892 P 4,471,011 P 10,217,785 Allowance for impairment 4,924,425 6,375,047 1,657,150 1,538,670 MCIT 274,075 269,546 265,732 208,540 Unamortized past service cost 271,802 299,604 268,129 290,457 Loss on revaluation 2,709 421 - - Retirement liability 423 38,964 - - Accrued rent 8 31 - - Unrealized foreign exchange gains ( 1,496) ( 4,973) - - P 10,059,836 P 17,298,532 P 6,662,022 P 12,255,452
The breakdown of the Group’s NOLCO, which can be claimed as deduction from future taxable income within three years from the year the taxable loss was incurred and within five years from the year SPV losses were incurred, is shown below. Inception Used/ Expiry Year Amount Expired Balance Year 2005 P 3,629,720 P 568,324 P 3,061,396* 2010 2006 6,484,406 6,484,406 - 2009 2007 21,089 - 21,089 2010 2008 753,001 - 753,001 2011 2009 752,404 - 752,404 2012 P 11,640,620 P 7,052,730 P 4,587,890
*Refers to losses incurred from SPV transactions in 2005. The breakdown of the Parent Company’s NOLCO, which can be claimed as deduction from future taxable income within three years from the year the taxable loss was incurred and within five years from the year SPV losses were incurred, is shown below. Inception Expiry Year Amount Expired Balance Year 2005 P 3,629,720 P 568,324 P 3,061,396* 2010 2006 6,484,406 6,484,406 - 2009 2008 671,983 - 671,983 2011 2009 737,632 - 737,632 2012 P 11,523,741 P 7,052,730 P 4,471,011
*Refers to losses incurred from SPV transactions in 2005.

- 108 -
As of December 31, 2009, the Group has MCIT of P274,705 that can be applied against RCIT for the next three consecutive years after the MCIT was incurred. The breakdown of MCIT with the corresponding validity periods follow: Inception Used/ Expiry Year Amount Expired Balance Year 2006 P 93,173 P 93,173 P - 2007 87,754 - 87,754 2010 2008 88,619 - 88,619 2011 2009 97,702 - 97,702 2012 P 367,248 P 93,173 P 274,075 The breakdown of the Parent Company’s MCIT with the corresponding validity periods follow: Inception Expiry Year Amount Expired Balance Year
2006 P 40,794 P 40,794 P - 2007 87,754 - 87,754 2010 2008 79,992 - 79,992 2011 2009 97,986 - 97,986 2012 P 306,526 P 40,794 P 265,732
29. TRUST OPERATIONS
Securities and properties (other than deposits) held by the Parent Company and RSB in fiduciary or agency capacities for their respective customers are not included in the accompanying financial statements, since these are not resources of the Parent Company and RSB. The Group’s total trust resources amounted to P52,448,850 and P46,945,928 as of December 31, 2009 and 2008, respectively. The Parent Company’s total trust resources amounted to P47,306,436 and P45,193,199 as of December 31, 2009 and 2008, respectively. In connection with the trust operations of the Parent Company and RSB, time deposit placements and government securities with a total face value of P 670,967 (Group) and P605,967 (Parent Company); and P860,667 (Group) and P769,715 (Parent Company) as of December 31, 2009 and 2008, respectively, are deposited with the BSP in compliance with existing trust regulations (see Notes 7 and 10). In compliance with existing BSP regulations, 10% of the Parent Company’s and RSB’s profit from trust business is appropriated to surplus reserve. This yearly appropriation is required until the surplus reserve for trust business equals 20% of the Parent Company’s and RSB’s regulatory capital. The surplus reserve is shown as Reserve for Trust Business in the statements of changes in capital funds.

- 109 -
30. RELATED PARTY TRANSACTIONS 30.1 DOSRI In the ordinary course of business, the Group has loan transactions with each other, their other affiliates, and with certain DOSRIs. Under existing policies of the Group, these loans are made substantially on the same terms as loans to other individuals and business of comparable risks. Under current BSP regulations, the amount of individual loans to a DOSRI, 70% of which must be secured, should not exceed the amount of his deposit and book value of his investment in the Parent Company and/or any of its lending and nonbanking financial subsidiaries. In the aggregate, loans to DOSRIs, generally, should not exceed the total capital funds or 15% of the total loan portfolio of the Parent Company and/or any of its lending and nonbanking financial subsidiaries, whichever is lower. BSP Circular No. 423 dated March 15, 2004 amended the definition of DOSRI accounts. The following table shows information relating to the loans, other credit accommodations and guarantees classified as DOSRI accounts under regulations existing prior to said circular and new DOSRI loans, other credit accommodations and guarantees granted under said circular as of December 31, 2009 and 2008:
Consolidated Parent 2009 2008 2009 2008 Total outstanding DOSRI loans P 4,562,445 P 9,213,808 P 4,371,850 P 9,142,497 Percent of DOSRI accounts to total loans 2.76% 5.94% 4.18% 7.65% Percent of unsecured DOSRI accounts to total DOSRI accounts 5.03% 2.35% 4.92% 2.29% Percent of past due DOSRI accounts to total loans 0.32% - 0.50% - Percent of nonaccruing DOSRI accounts to total loans 0.32% - 0.50% -
30.2 Joint Development Agreement
On October 1, 2009, the Parent Company entered into a Joint Development Agreement (Agreement) with RSB, Bankard, Grepalife, MICO, and Hexagonland (all related parties, collectively referred to as the Consortium) and with the conformity of Goldpath, the parent company of Hexagonland, whereby the Consortium agreed to pool their resources and enter into an unincorporated joint venture arrangement for the construction and development of a high rise, mixed use commercial/office building which shall be referred to by the Consortium as the RCBC Savings Bank Building Project (the Project). The estimated cost for the Project is at P2,200,000.

- 110 -
The Consortium shall share in the Project cost as follows: Type of Party Contribution % RSB Cash 36.59% Parent Company Cash 23.16% Hexagonland Land 17.42% Bankard Cash 13.89% MICO Cash 4.47% Grepalife Cash 4.47% 100%
Furthermore, within six months from the execution of the Agreement, RSB shall undertake to liquidate Goldpath and Hexagonland to acquire ownership of the land, thereby increasing the RSB’s share in the Project cost to 54.01%. As of December 31, 2009, RSB is still in the process of completing the requirements for the liquidation of Goldpath and Hexagonland.
The Group and the Parent Company’s initial cash contribution to the joint venture amounted to P64,791 and P40,499 as of December 31, 2009, respectively, and the land costing P315,000. The Group and Parent Company’s contributions are presented as part of the Bank Premises, Furniture, Fixtures and Equipment account in the Group and Parent Company’s statement of financial position (see Note 13). 30.3 Key Management Personnel Compensation The breakdown of key management personnel compensation follow:
Consolidated 2009 2008 2007 Short-term benefits P 154,414 P 186,231 P 159,410 Post-employment benefits 41,054 38,022 38,428 Termination benefits - 48 254 Other long-term benefits - 404 634 P 195,468 P 224,705 P 198,726
Parent 2009 2008 2007 Short-term benefits P 52,529 P 59,789 P 53,040 Post-employment benefits 41,054 37,421 37,946 P 93,583 P 97,210 P 90,986

- 111 -
30.4 Lease Contract with RRC The Parent Company and certain subsidiaries occupy several floors of RCBC Plaza as leaseholders of RRC. Related rental expense reported in the consolidated and Parent Company financial statements amounted to P167,639 and P159,067 in 2009 and P163,027 and P156,063 in 2008, respectively, and is included as part of Occupancy and Equipment-related account in the statements of income. While advance rentals included as part of Deferred Charges under Other Resources in the statements of financial position amounted to P42,049 as of December 31, 2008 and nil as of December 31, 2009, both in the consolidated and Parent Company financial statements. The Parent Company’s lease contract with RRC is until December 31, 2010. 30.5 Deposits As of December 31, 2009 and 2008, certain related parties have deposits with the Parent Company.
31. COMMITMENTS AND CONTINGENCIES
In the normal course of operations of the Group, there are various outstanding commitments and contingent liabilities such as guarantees, commitments to extend credit, tax assessments, etc., which are not reflected in the accompanying financial statements. As at December 31, 2009, management does not anticipate losses from these transactions that will adversely affect the Group’s operations. Several suits and claims remain unsettled. In the opinion of management, the suits and claims, if decided adversely, will not involve sums with a material effect on the Parent Company and its subsidiaries’ financial position or operating results. The following is a summary of contingencies and commitments arising from off-statement of financial position items at their equivalent peso contractual amounts as of December 31, 2009 and 2008:
Consolidated Parent 2009 2008 2009 2008 Derivatives P 92,918,002 P 24,776,281 P 92,918,002 P 24,776,281 Trust department accounts (see Note 29) 52,448,850 46,945,928 47,306,436 45,193,199 Unused commercial letters of credit 4,484,766 5,646,927 4,484,766 5,646,927 Inward bills for collection 4,127,816 1,261,327 4,127,816 1,259,476 Spot exchange sold 3,138,383 3,310,091 3,138,383 3,310,091 Spot exchange bought 2,823,634 3,520,890 2,823,634 3,520,890 Outward bills for collection 454,530 412,444 454,283 412,444 Outstanding guarantees issued 870,655 - 870,655 - Late deposits/payments received 634,677 260,874 592,893 227,892 Minimum lease rentals under non-cancellable operating lease 215,625 222,291 - - Items held for safekeeping/collateral 1,414 3,587 1,387 3,561 Traveller’s check unsold 1,225 21,577 1,225 21,577

- 112 -
Derivatives include the Parent Company’s outstanding long-term cross currency swap contracts wherein it is committed to sell US dollars and buy Philippine pesos in the future at a precontracted rate from a counterparty bank, with an aggregate notional amount of P1,911,200 or $40 million as of December 31, 2008. The Parent Company then invested the proceeds from the cross currency swap contracts in interbank placements with various foreign banks. The US dollar placements outstanding as of December 31, 2007 have a “credit link” to underlying securities that would be received by the Parent Company in lieu of the US dollar funds it originally invested in case of a credit default event as defined in the agreement between the Parent Company and its counterparties. RCBC Capital has filed an arbitration claim with the International Chamber of Commerce against a local bank relating to RCBC Capital’s acquisition of Bankard. RCBC Capital is seeking a rescission of the sale or compensation for damages. In September 2007, the arbitral tribunal upheld the claim of RCBC Capital and stated that RCBC Capital is entitled to damages for the breach, the amount of which would be determined by the tribunal with the assistance of an expert appointed by it. The hearings concerning the amount of damages due to RCBC Capital were concluded in October 2009, and RCBC’s Capital’s Memorandum and Reply Memorandum were submitted on December 1, 2009 and December 15, 2009, respectively. On January 15, 2010, final evidence on RCBC Capital’s arbitration costs was submitted by its external counsel and the case was submitted for resolution. A final decision is expected to be published in April or May 2010.
32. EARNINGS PER SHARE
The following reflects the income and per share data used in the basic and diluted earnings per share (EPS) computations (figures in thousands, except EPS data):
Consolidated 2009 2008 2007
Basic Earnings Per Share
a. Net profit attributable to parent company’s shareholders P 3,328,382 P 2,153,740 P 3,207,632 Less allocated for preferred and Hybrid Tier 1 dividends ( 487,401 ) ( 496,844) ( 544,691) 2,840,981 1,656,896 2,662,941 b. Weighted average number of outstanding common shares 907,994 962,841 909,325 c. Basic EPS (a/b) P 3.13 P 1.72 P 2.93
Diluted Earnings Per Share
a. Net profit attributable to parent company’s shareholders P 2,840,981 P 1,656,896 P 2,662,941 b. Weighted average number of outstanding common shares 928,454 999,344 939,168 c. Diluted EPS (a/b) P 3.06 P 1.66 P 2.84

- 113 -
Parent 2009 2008 2007
Basic Earnings Per Share
a. Net profit attributable to parent company’s shareholders P 2,572,124 P 1,170,314 P 1,939,350 Less allocated for preferred and Hybrid Tier 1 dividends ( 487,401 ) ( 496,844) ( 544,691 ) 2,084,723 673,470 1,394,659 b. Weighted average number of outstanding common shares 907,994 962,841 909,325 c. Basic EPS (a/b) P 2.30 P 0.70 P 1.53
Diluted Earnings Per Share a. Net profit attributable to parent company’s shareholders P 2,084,723 P 673,470 P 1,394,659 b. Weighted average number of outstanding common shares 928,454 999,344 939,168 c. Diluted EPS (a/b) P 2.25 P 0.67 P 1.48
The above computation does not take into consideration the effects of certain accounting treatment allowed by BSP but not allowed under FRSPB and PFRS as discussed in Note 11.
33. SELECTED FINANCIAL PERFORMANCE INDICATORS
The following basic ratios measure the financial performance of the Group and the Parent Company:
Consolidated 2009 2008 2007 Return on average capital funds 11.95% 7.40% 12.43% Return on average assets 1.24% 0.87% 1.42% Net interest margin 4.62% 4.25% 5.00% Capital adequacy ratio 18.47% 17.30% 18.70% Parent 2009 2008 2007 Return on average capital funds 10.46% 3.56% 7.26% Return on average assets 1.14% 0.56% 1.04% Net interest margin 4.00% 3.57% 4.47% Capital adequacy ratio 17.23% 16.28% 18.21%
The above computation does not take into consideration the effects of certain accounting treatment allowed by BSP but not allowed under FRSPB and PFRS as discussed in Note 11.

Schedule BRIZAL COMMERCIAL BANKING CORPORATIONAccounts Receivable from Directors/Officers/Employees/Related Partiesand Principal Stockholders (Other than Affiliates)As of December 31, 2009
Bal. at beg Amounts Amounts Not Bal. at endName and Designation of Debtor of period Additions Collected Written off Current Current of period
Pan Malayan Mgt. TLS (Sec A) 1,160,000,000.00 47,000,000.00 - 1,207,000,000.00 1,207,000,000.00
HELEN Y. DEE (D)
Pacific Plans Inc DOM BPS 15,047,246.78 15,047,246.78 - - FCDU SEC 3,641,932,800.00 3,641,932,800.00 - -
House of Investment TLC 85,000,000.00 - - 85,000,000.00 85,000,000.00 TLS 389,000,000.00 12,000,000.00 377,000,000.00 377,000,000.00 TR DOM 38,149,848.96 12,775,829.47 50,925,678.43 50,925,678.43
Isuzu Manila DOM BPS 22,678,066.19 22,678,066.19 22,678,066.19
Malayan Colleges TLS 890,937,500.00 - 48,146,551.72 842,790,948.28 842,790,948.28
First Malayan Leasing TLS 520,000,000.00 - 520,000,000.00 -
Grepaland, Inc. TLS 19,400,000.00 4,500,000.00 23,900,000.00 23,900,000.00 DOM BPS - - - -
Luisita Indl Park BP DOC PD 52,500,000.00 - - - 52,500,000.00 52,500,000.00 TLS PD 471,800,000.00 - 471,800,000.00 471,800,000.00
Malayan Rental TLS 107,000,000.00 - 107,000,000.00 - -
Pan Malayan Express DOM BPS - - - - - -
RCBC Forex TLC 55,000,000.00 - 55,000,000.00 55,000,000.00 BDS 135,000,000.00 - 135,000,000.00 135,000,000.00 DOM BPS 516,162.09 - 516,162.09 - -
RCBC Securities DOM BPS 4,547.00 - 4,547.00 - -
RIZALINO S NAVARRO (D)
EEI Corporation TLS 438,000,000.00 - 133,333,332.00 304,666,668.00 304,666,668.00
EEI Realty TLS 73,166,610.00 - 14,272,970.00 58,893,640.00 58,893,640.00
EEI Retirement Fund TLS 530,000,000.00 - - 530,000,000.00 530,000,000.00
CESAR VIRATA (D)
RCBC Land Inc TLS 174,195,054.12 - 172,520,054.14 1,674,999.98 1,674,999.98
Deductions

Schedule BRIZAL COMMERCIAL BANKING CORPORATIONAccounts Receivable from Directors/Officers/Employees/Related Partiesand Principal Stockholders (Other than Affiliates)As of December 31, 2009
Bal. at beg Amounts Amounts Not Bal. at endName and Designation of Debtor of period Additions Collected Written off Current Current of period
TEODORO D. REGALA (D)
Accrain Holdings TLS 22,400,000.00 - 22,400,000.00 22,400,000.00
Accra Law TLS - 10,000,000.00 - 10,000,000.00 10,000,000.00
Masagana Holdings FCDU 123,552,000.00 - 3,432,000.00 120,120,000.00 120,120,000.00
TERI CHEN Chen, Chua m/t Cristina TLS (1:1) - 500,000.00 500,000.00 500,000.00
SPINAKKER CAPITAL GROUP Rustans Supercenter 199,894,857.12 199,894,857.12 0.00 -
GRAND TOTAL 9,142,496,626.07 97,453,895.66 4,868,100,520.85 - 3,847,550,000.88 524,300,000.00 4,371,850,000.88
Deductions

UNAPPROPRIATED RETAINED EARNINGS FOR DIVIDEND DECLARATION AT BEGINNING OF YEAR 4,771,934 P
Net Income Realized for the YearNet income per audited financial statements 2,572,124 Less unrealized income, net of tax:
Equity in net income of associate and joint venture - Unrealized foreign exchange gain - net
(except those attributable to cash and cash equivalents) 8,497 )( Fair value gains arising from mark-to-market measurement 10,376 )( Fair value gains from investment properties - Unrealized actuarial gains on defined benefit plan - Adjustment due to deviation from PFRS/GAAP - 18,873 )(
Add unrealized loss, net of tax:Depreciation on revaluation increments - Adjustment due to deviation from PFRS/GAAP - Fair value loss from investment properties - -
2,553,251
Add (Less) Changes in Retained Earnings for the Year
Dividend declarations during the period 785,831 )( Appropriations of retained earnings during the period - Reserve for
Trust Business 8,751 )( Reversals of appropriations of retained earnings - Deferred income tax set up in prior years 1,389,497 )( Effects of prior period adjustments - Amortization of deferred charges 834,633 )( Treasury shares 952,709 )( 3,971,421 )(
UNAPPROPRIATED RETAINED EARNINGS
FOR DIVIDEND DECLARATION AT END OF YEAR 3,353,764 P
(Amounts in thousand)
RIZAL COMMERCIAL BANKING CORPORATIONYuchengco Tower, RCBC Plaza No. 6819 Ayala Avenue, Makati City
Parent Company Reconciliation of Retained Earnings for Dividend DeclarationDecember 31, 2009
Note: (1) Unrealized foreign exchange loss can be offset to the extent of unrealized foreign exchange gain.
(1)

201
INDEX TO EXHIBITS
Form 17-A
No. Page No. (3) Plan of Acquisition, Reorganization, Arrangement, Liquidation, or Succession * (5) Instruments Defining the Rights of Security Holders, Including Indentures * (8) Voting Trust Agreement * (9) Material Contracts * (10) Annual Report to Security Holders, Form 17-Q or Quarterly Report to Security Holders * (13) Letter re Change in Certifying Accountant * (16) Report Furnished to Security Holders * (18) Subsidiaries of the Registrant 202 (19) Published Report Regarding Matters Submitted to Vote of Security Holders * (20) Consent of Experts and Independent Counsel * (21) Power of Attorney * (29) Additional Exhibits * _________ * These Exhibits are either not applicable to the Company or require no answer.

Exhibit 18. SUBSIDIARIES OF THE REGISTRANT
Rizal Commercial Banking Corporation (the “Parent Company”) holds interest in the following subsidiaries and associates:
Country of Effective Percentage Subsidiaries/Associates Incorporation ___of Ownership Subsidiaries: RCBC Savings Bank, Inc. (RSB) Philippines 100.00 RCBC Forex Brokers Corporation (RCBC Forex) Philippines 100.00 RCBC Telemoney Europe Italy 100.00 RCBC North America, Inc. (RCBC North America) California, USA (a) 100.00 RCBC International Finance Limited (RCBC IFL) Hongkong 99.99 RCBC Investment Ltd. Hongkong (b) 100.00 RCBC Capital Corporation (RCBC Capital) Philippines 99.96 RCBC Securities, Inc. (RSI) Philippines (c) 100.00 Pres. Jose P. Laurel Rural Bank, Inc. (JPL) Philippines (d) 99.00 Bankard, Inc. (Bankard) Philippines (e) 91.69 Merchants Savings and Loan Association, Inc. (Merchants Bank) Philippines (f) 96.38 Special Purpose Companies (SPCs): Under Parent Company: Niyog Property Holdings, Inc. (NPHI) Philippines (g) 100.00 Under RSB: (h) Goldpath Properties Development Corporation (GPDC) Philippines 100.00 Manchesterland Properties, Inc. Philippines (i) 100.00 Hexagonland Corporation Philippines (i) 100.00 Best Value Property and Development Corporation Philippines 100.00 Crescent Park Property and Development Corporation Philippines 100.00 Crestview Properties Development Corporation Philippines 100.00 Eight Hills Property and Development Corporation Philippines 100.00 Fairplace Property and Development Corporation Philippines 100.00 Gold Place Properties Development Corporation Philippines 100.00 Greatwings Properties Development Corporation Philippines 100.00 Happyville Property and Development Corporation Philippines 100.00 Landview Property and Development Corporation Philippines 100.00 Lifeway Property and Development Corporation Philippines 100.00

Country of Effective Percentage Subsidiaries/Associates Incorporation ___of Ownership Under RSB: (h) Niceview Property and Development Corporation Philippines 100.00 Princeway Properties Development Corporation Philippines 100.00 Stockton Realty Development Corporation Philippines 100.00 Top Place Properties Development Corporation Philippines 100.00 Associates: RCBC Land, Inc. (RLI) Philippines 49.00 YGC Corporate Services, Inc. (YCS) Philippines 40.00 Luisita Industrial Park Co. (LIPC) Philippines 35.00 Subic Power Corporation (SPC) Philippines 26.50 RCBC Realty Corporation (RRC) Philippines 34.80 Honda Cars Phils., Inc. (HCPI) Philippines 12.88 Roxas Holdings, Inc. (RHI) Philippines 4.71 Great Life Financial Assurance Corporation (GLFAC) Philippines (j) -
Explanatory Notes:
(a) Includes 25.29% and 31% ownership of RCBC IFL in 2009 and 2008, respectively (b) A wholly owned subsidiary of RCBC IFL (c) A wholly owned subsidiary of RCBC Capital (d) In 2009, the Parent Company made a total capital infusion to JPL amounting to P175
million which resulted in its full and irrevocable voting and economic rights for 99% of the JPL’s outstanding shares (see Note 12).
(e) Owned 59.07% by RCBC Capital in 2007. In 2008, the Parent Company’s P1 billion capital infusion by way of conversion of debt to equity was effected (see Note 12). As of December 31, 2009 and 2008, the Parent Company has 66.58% direct ownership and 25.11% indirect ownership through RCBC Capital.
(f) In 2008, the Parent Company acquired 96.38% ownership in Merchants Bank from Finman Capital Corporation.
(g) In 2009, the Parent Company and RSB reclassified its investment in NPHI from investment property to equity investment which resulted into their ownership of 54% and 46%, respectively (see Notes 12 and 14).
(h) In 2009, RSB reclassified its investment with SPCs from Investment Property account to Investments in Subsidiaries and Associates account which resulted into its consolidation with the Parent Company (see Note 14).
(i) A wholly owned subsidiary of GPDC. (j) Sold in 2009 to Great Pacific Life Financial Assurance Corporation (see Note 12)


![Commercial Banking[1]](https://static.fdocuments.net/doc/165x107/577d348f1a28ab3a6b8e528e/commercial-banking1.jpg)