
River Flow 2010 - Dittrich, Koll, Aberle & Geisenhainer (eds) - …€¦ · · 2011-06-07evaluate...
8
1 INTRODUCTION Aquatic plants are fundamental components of a natural water environment in rivers and wetlands. Submerged vegetation generates coherent turbu- lent motions near the vegetation edge and reduces suspended sediment transport because of the local reduction in bed shear stress. It is therefore impor- tant for river management to investigate hydrody- namic characteristics and coherent eddies in open- channel flows with vegetation canopies. In recent years, the measuring techniques of PIV and planar laser induced fluorescence (LIF) are extensively used to investigate the mixing processes. For example, Chen & Jirka (1999) have meas- ured the instantaneous concentration field in shal- low jet flows by LIF. They revealed the overall meandering of the plane jet and the role of large- scale turbulence structure in the mixing processes. Crimaldi & Koseff (2001) measured the spatial and temporal structure of an odor plume in turbu- lent flows by two kinds of LIF techniques, i.e., full-field planar LIF and single-point LIF probe. The results showed a wide range of turbulent structures in detail; the nature of the structure va- ried significantly in the different regions of plume. Rahman & Webster (2005) conducted planar LIF measurements in turbulent open-channel flow and examined the effect of bed roughness on a chemical plume. They revealed that the concentra- tion fluctuation intensity is smaller and decreases faster as the bed roughness increases. On the other hand, turbulence structure and transport mechanism of momentum and mass in the vegetated flows have been investigated in the past decades. Gao et al. (1988) have proposed a ramp-jump structure and humidity within and above a terrestrial canopy by using triaxial sonic anemometers and thermometer. They revealed that coherent structures consisted of a weak ejec- tion from the canopy top followed by a strong sweep into the canopy. Ghisalberti & Nepf (2005) conducted conti- nuous dye injection experiments to characterize vertical mass transport in submerged vegetation flow. Through the absorbance-concentration rela- tionship of the Beer Lambert law, a digital imag- ing was used to provide high-resolution concen- tration profiles of the dye plumes. They suggested that vertical mass transport has the strong peri- odicity and coherent vortices of the shear layer dominate the turbulent diffusion. Reidenbach et al. (2007) have measured fine- scale mixing and mass transport within a coral ca- nopy by using planar LIF. They showed that the action of surface waves, interacting with the struc- Simultaneous Measurements of Concentration and Velocity with Combined PIV and planar LIF in Vegetated Open-Channel Flows Taka-aki Okamoto, Iehisa Nezu & Aki Katayama Department of Civil Engineering, Kyoto University, Kyoto 615-8540, Japan ABSTRACT: Aquatic plants reduce suspended sediment transport because of the local reduction in bed shear stress. Therefore, it is very important for river environment to reveal the mass and momentum ex- changes near the vegetation zone. Turbulent diffusion mechanisms in emergent vegetated flows have re- cently been investigated by many researchers. However, the effect of the submerged vegetation on the scalar flux has not been fully investigated. So, continuous dye injection experiments were conducted to evaluate the vertical mass transport in open-channel flow with rigid vegetation models by changing the vegetation density. In the present study, a combination technique between PIV and planar laser-induced fluorescence (LIF) was developed by using two sets of CMOS cameras, to measure the instantaneous ve- locity and the instantaneous concentration field simultaneously. Keywords: LIF, PIV, Simultaneous measurements, Submerged vegetation, Vertical scalar flux River Flow 2010 - Dittrich, Koll, Aberle & Geisenhainer (eds) - © 2010 Bundesanstalt für Wasserbau ISBN 978-3-939230-00-7 487
Transcript of River Flow 2010 - Dittrich, Koll, Aberle & Geisenhainer (eds) - …€¦ · · 2011-06-07evaluate...

1 INTRODUCTION
Aquatic plants are fundamental components of a natural water environment in rivers and wetlands. Submerged vegetation generates coherent turbu-lent motions near the vegetation edge and reduces suspended sediment transport because of the local reduction in bed shear stress. It is therefore impor-tant for river management to investigate hydrody-namic characteristics and coherent eddies in open-channel flows with vegetation canopies. In recent years, the measuring techniques of PIV and planar laser induced fluorescence (LIF) are extensively used to investigate the mixing processes.
For example, Chen & Jirka (1999) have meas-ured the instantaneous concentration field in shal-low jet flows by LIF. They revealed the overall meandering of the plane jet and the role of large-scale turbulence structure in the mixing processes.
Crimaldi & Koseff (2001) measured the spatial and temporal structure of an odor plume in turbu-lent flows by two kinds of LIF techniques, i.e., full-field planar LIF and single-point LIF probe. The results showed a wide range of turbulent structures in detail; the nature of the structure va-ried significantly in the different regions of plume.
Rahman & Webster (2005) conducted planar LIF measurements in turbulent open-channel flow
and examined the effect of bed roughness on a chemical plume. They revealed that the concentra-tion fluctuation intensity is smaller and decreases faster as the bed roughness increases.
On the other hand, turbulence structure and transport mechanism of momentum and mass in the vegetated flows have been investigated in the past decades. Gao et al. (1988) have proposed a ramp-jump structure and humidity within and above a terrestrial canopy by using triaxial sonic anemometers and thermometer. They revealed that coherent structures consisted of a weak ejec-tion from the canopy top followed by a strong sweep into the canopy.
Ghisalberti & Nepf (2005) conducted conti-nuous dye injection experiments to characterize vertical mass transport in submerged vegetation flow. Through the absorbance-concentration rela-tionship of the Beer Lambert law, a digital imag-ing was used to provide high-resolution concen-tration profiles of the dye plumes. They suggested that vertical mass transport has the strong peri-odicity and coherent vortices of the shear layer dominate the turbulent diffusion.
Reidenbach et al. (2007) have measured fine-scale mixing and mass transport within a coral ca-nopy by using planar LIF. They showed that the action of surface waves, interacting with the struc-
Simultaneous Measurements of Concentration and Velocity with Combined PIV and planar LIF in Vegetated Open-Channel Flows
Taka-aki Okamoto, Iehisa Nezu & Aki Katayama Department of Civil Engineering, Kyoto University, Kyoto 615-8540, Japan
ABSTRACT: Aquatic plants reduce suspended sediment transport because of the local reduction in bed shear stress. Therefore, it is very important for river environment to reveal the mass and momentum ex-changes near the vegetation zone. Turbulent diffusion mechanisms in emergent vegetated flows have re-cently been investigated by many researchers. However, the effect of the submerged vegetation on the scalar flux has not been fully investigated. So, continuous dye injection experiments were conducted to evaluate the vertical mass transport in open-channel flow with rigid vegetation models by changing the vegetation density. In the present study, a combination technique between PIV and planar laser-induced fluorescence (LIF) was developed by using two sets of CMOS cameras, to measure the instantaneous ve-locity and the instantaneous concentration field simultaneously.
Keywords: LIF, PIV, Simultaneous measurements, Submerged vegetation, Vertical scalar flux
River Flow 2010 - Dittrich, Koll, Aberle & Geisenhainer (eds) - © 2010 Bundesanstalt für Wasserbau ISBN 978-3-939230-00-7
487

ture of the reef, could increase instantaneous shear and mixing up to six times compared to that of non-conditional flow.
Jamali et al. (2008) conducted LIF measure-ments to investigate the exchange flow due to the temperature differences between the vegetation and non-vegetation zones. They suggested that the magnitude of the exchange rate decreases as the canopy drag increases.
However, these above-mentioned previous stu-dies do not offer the detailed information of turbu-lent diffusion mechanism, because it has been dif-ficult to measure the velocity and concentration fluctuations simultaneously. In the present study, a combination technique between PIV and LIF was developed by using two sets of high-speed cameras to measure the instantaneous velocity and instantaneous concentration field simultaneously. Of particular significance is that that the synchro-nicity allows the direct computation of scalar flux and velocity. Consequently, effects of coherent vortices on scalar flux were examined in detail.
2 EXPERIMENTAL METHOD
2.1 Experimental setup and vegetation model The experimental setup and the coordinate system are indicated in Figure 1. The present experiments were conducted in a 10m long and 40cm wide tilt-ing flume. ,x y and z are the streamwise, vertical and spanwise coordinates, respectively. H is the
water depth and h is the vegetation height. vB and vL are the neighboring vegetation spac-
ings in the spanwise and streamwise directions, respectively. The elements of vegetation model were made of rigid-strip plates (h=50mm height, b=8mm width and t=1mm thickness) in the same manner as conducted in laboratory experiments by Nezu & Sanjou (2008). The time-averaged veloci-ty components in each direction are defined as
,U V and W , and the corresponding turbulent fluctuations are ,u v and w , respectively. ( ) ( )tcCtc~ +≡ is the instantaneous dye concen-
tration, which is defined in the same manner as velocity components.
In the present study, a combination technique between PIV and laser-induced fluorescence (LIF) was developed by using two sets of CMOS cam-eras (1024×1024 pixels), to measure the instanta-neous velocity components )~,~( vu and the instan-taneous concentration c~ simultaneously. The 2mm thickness laser-light sheet (LLS) was gener-ated by 3W Argon-ion laser. The illuminated flow pictures were taken by two sets of high-speed cameras with 500Hz frame-rate and 60s sampling time. The instantaneous velocity components
)~,~( vu on the x-y plane were analyzed by the PIV algorithm for the whole flow depth region. These PIV methods are the same as used previously by Nezu & Sanjou (2008).
The instantaneous concentration field ( )yxc ,~ was quantified by using the planar LIF
technique. Dye (Rhodamine B) was injected through a 3mm diameter stainless nozzle. The
Table1 Hydraulic condition
R1 0.0 - -R2 0.015R3 0.061
12.0 30000 0.1715.0 5.0 1.0
Case Φ H(cm) FrReH/h U m (cm/s)h (cm)Φ
Control computer
Flow
H vL
Vegetation elements
x
y
zU
V
W
Ar-ion Laser
High-speedCCD camera
for PIV
High-speedCCD camera
for LIF
LLS
Sharp cut-off filter
Nozzle
Pulse generator
Emergent zone
yH
h
ph
logh
Log-law zone
Mixing-layer zone
Vegetation edgeVegetation elements
Coherent vortex
Wake zone
CMOS
CMOS
Figure 1 Experimental set-up Figure 2 Flow zone model in vegetated open-channel flow
488
dye-injection velocity was adjusted to match the local flow velocity U. The dye absorbed the green laser light and reemitted light with the different longer wavelengths. Under appropriate conditions, the light intensity emitted by the dye is directly proportional to the dye concentration and laser light intensity. Consequently, the planar concen-tration field ( )tyxc ,,~ is calculated from the cap-tured images by one CMOS camera (for LIF), us-ing a relevant calibration function.
2.2 Hydraulic condition Table 1 shows the hydraulic condition. The bulk mean velocity mU and the submergence depth H/h were kept constant for all cases, i.e.,
12=mU cm/s and H/h=3.0. Two kinds of experi-ments were conducted by changing the vegetation densityΦ and the vertical position of the nozzle tip 0y . In this study, the vegetation densityΦ is defined as follows:
abhS
bAi
ii
=⋅
=Φ∑
(1)
in which, iA is the frontal area of the vegeta-tion element, bi is the vegetation-element width and S is the referred bed area.
In the present study, the nozzle tip position was changed to examine the turbulent diffusion properties in all three sub-zones of the vegetated open-channel flow, as shown in Figure 2
Nepf & Vivoni (2000) and Poggi et al.(2004) have pointed out that the whole depth region in submerged vegetation flow could be classified in-to several layers on the basis of the vertical pro-files of mean streamwise velocity and Reynolds stress. Nezu & Sanjou (2008) found that the sub-merged rigid canopy flow can be divided into the following three sub-zones on the basis of previous experimental results.
( )( )
( ) ⎪⎭
⎪⎬
⎫
≤≤−
≤≤−
≤≤
HyhzonelawLog
hyhzonelayerMixing
hyzoneWake
p
p
log
log
0
(2)
ph is the penetration depth defined by Nepf & Vivoni (2000) and logh is the lower limit of the log-law zone defined by Nezu & Sanjou (2008). In the Wake zone (0 ≤ y ≤ hp), the vertical turbu-lent momentum transport is negligibly small due to the strong wake effects behind vegetation stems, i.e. the Karman vortex appears predomi-nately. In the Mixing-layer zone (hp ≤ y ≤ hlog), a large-scale coherent vortex is generated near the vegetation edge due to the inflection-point insta-bility and consequently, the vertical turbulent ex-
change contributes largely to the momentum transfer between over- and the within-canopies, as discussed by Raupach et al. (1996) for terrestrial canopy, and by Nezu & Sanjou (2008) for aquatic canopy. hlog is the lower limit position of the Log-law zone, in which turbulence characteristics are analogous to those of boundary layers.
3 RESULTS
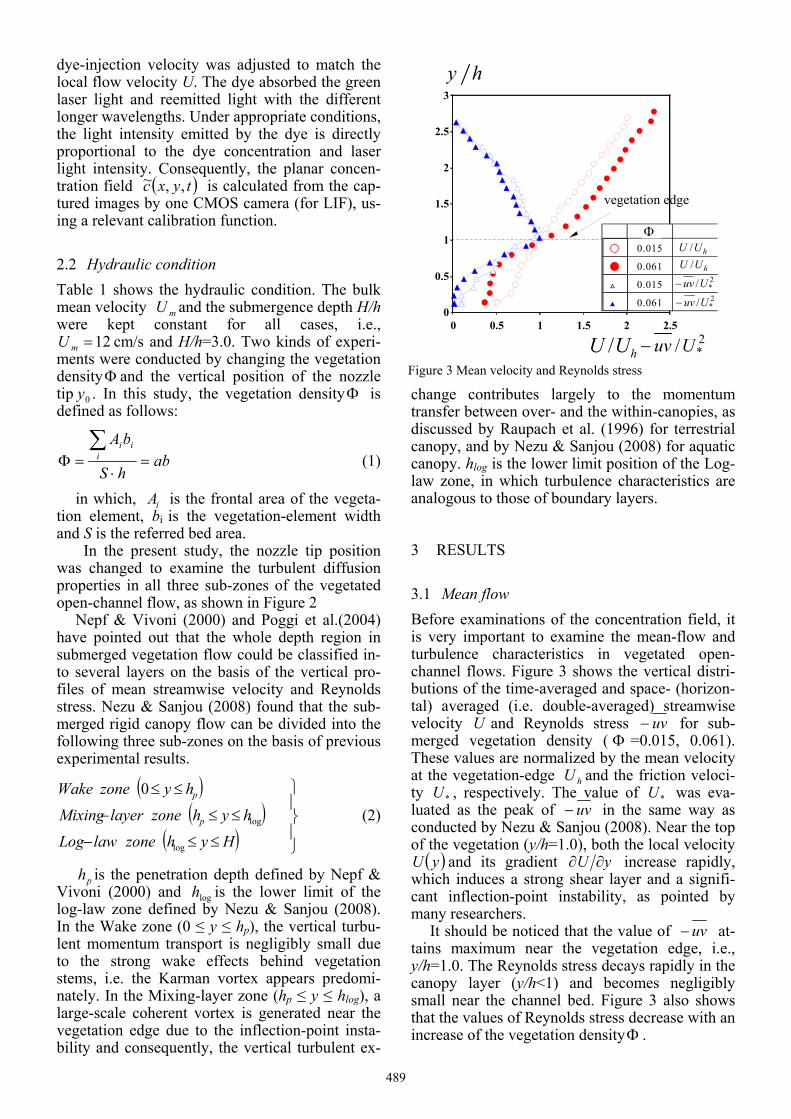
3.1 Mean flow Before examinations of the concentration field, it is very important to examine the mean-flow and turbulence characteristics in vegetated open-channel flows. Figure 3 shows the vertical distri-butions of the time-averaged and space- (horizon-tal) averaged (i.e. double-averaged) streamwise velocity U and Reynolds stress uv− for sub-merged vegetation density ( Φ =0.015, 0.061). These values are normalized by the mean velocity at the vegetation-edge hU and the friction veloci-ty *U , respectively. The value of *U was eva-luated as the peak of uv− in the same way as conducted by Nezu & Sanjou (2008). Near the top of the vegetation (y/h=1.0), both the local velocity ( )yU and its gradient yU ∂∂ increase rapidly,
which induces a strong shear layer and a signifi-cant inflection-point instability, as pointed by many researchers.
It should be noticed that the value of uv− at-tains maximum near the vegetation edge, i.e., y/h=1.0. The Reynolds stress decays rapidly in the canopy layer (y/h<1) and becomes negligibly small near the channel bed. Figure 3 also shows that the values of Reynolds stress decrease with an increase of the vegetation densityΦ .
0
0.5
1
1.5
2
2.5
3
0 0.5 1 1.5 2 2.5
φ
○ 0.015
● 0.061
△ 0.015
▲ 0.061
○
●
△▲
hy
hUU / 2*/Uuv−
vegetation edge
2*/Uuv−
hUU /
hUU /
2*/Uuv−
Φ
Figure 3 Mean velocity and Reynolds stress
489
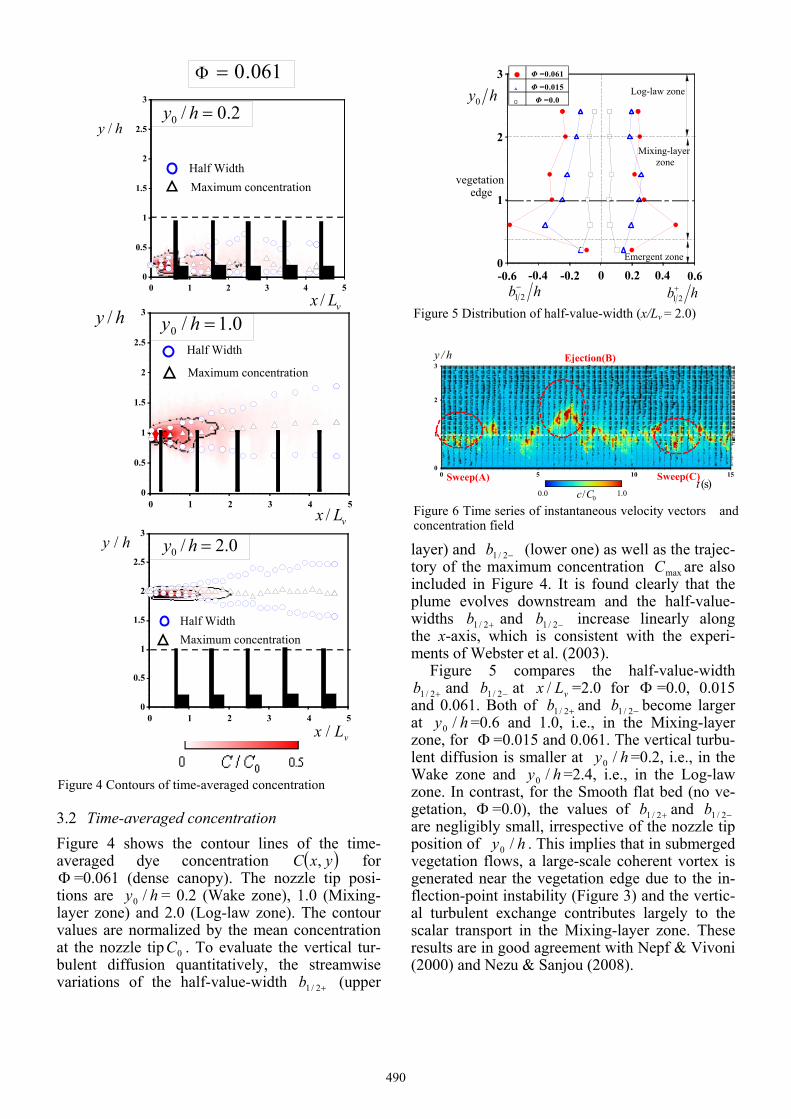
3.2 Time-averaged concentration Figure 4 shows the contour lines of the time-averaged dye concentration ( )yxC , for Φ =0.061 (dense canopy). The nozzle tip posi-tions are hy /0 = 0.2 (Wake zone), 1.0 (Mixing-layer zone) and 2.0 (Log-law zone). The contour values are normalized by the mean concentration at the nozzle tip 0C . To evaluate the vertical tur-bulent diffusion quantitatively, the streamwise variations of the half-value-width +2/1b (upper
layer) and −2/1b (lower one) as well as the trajec-tory of the maximum concentration maxC are also included in Figure 4. It is found clearly that the plume evolves downstream and the half-value-widths +2/1b and −2/1b increase linearly along the x-axis, which is consistent with the experi-ments of Webster et al. (2003).
Figure 5 compares the half-value-width +2/1b and −2/1b at vLx / =2.0 for Φ =0.0, 0.015
and 0.061. Both of +2/1b and −2/1b become larger at hy /0 =0.6 and 1.0, i.e., in the Mixing-layer zone, for Φ =0.015 and 0.061. The vertical turbu-lent diffusion is smaller at hy /0 =0.2, i.e., in the Wake zone and hy /0 =2.4, i.e., in the Log-law zone. In contrast, for the Smooth flat bed (no ve-getation, Φ =0.0), the values of +2/1b and −2/1b are negligibly small, irrespective of the nozzle tip position of hy /0 . This implies that in submerged vegetation flows, a large-scale coherent vortex is generated near the vegetation edge due to the in-flection-point instability (Figure 3) and the vertic-al turbulent exchange contributes largely to the scalar transport in the Mixing-layer zone. These results are in good agreement with Nepf & Vivoni (2000) and Nezu & Sanjou (2008).
061.0=φ
0
0.5
1
1.5
2
2.5
3
0 1 2 3 4 5
0
0.5
1
1.5
2
2.5
3
0 1 2 3 4 5
2.0/0 =hy
0.1/0 =hy
hy /
vLx /
Half WidthMaximum concentration
hy /
Half Width
Maximum concentration
vLx /hy /
0
0.5
1
1.5
2
2.5
3
0 1 2 3 4 5
0.2/0 =hy
vLx /
Maximum concentrationHalf Width
Φ
Figure 4 Contours of time-averaged concentration
0
1
2
3
-0.6 -0.4 -0.21.11022302462516E-160.2 0.4 0.6
● Φ =0.061
△ Φ =0.015
□ Φ =0.0hy0
hb+21hb−
21
Log-law zone
Emergent zone
Mixing-layer zone
vegetation edge
0.4-0.4 0-0.2 0.2
Figure 5 Distribution of half-value-width (x/Lv = 2.0)
0
1
2
3
0 5 10 15
y / h
t (s)
Ejection(B)
Sweep(A) Sweep(C)
0/Cc 1.00.0 Figure 6 Time series of instantaneous velocity vectors and concentration field
490
It is also observed that +2/1b and −2/1b for Φ =0.061 (dense canopy) are greater than those for Φ =0.015 (sparse canopy) and Φ =0.0 (smooth bed). Nezu & Sanjou (2008) pointed out that the strong shear layer appears near the vegeta-tion edge for dense canopies. Ghisalberti & Nepf (2005) also demonstrated that the dense canopies would generate vortices with a greater rotational speed and that the higher rates of rotation would result in a more rapid flushing in the canopy layer. Therefore, it is recognized that the large distribu-tions of the dye concentration are mixed rapidly due to the strong shear layer for Φ =0.061.
3.3 Instantaneous velocity and concentration field
Figure 6 shows the time-series of instantaneous velocity vectors )~,~( vu by PIV and the correspond-ing instantaneous concentration field ( )tyxc ,,~ by LIF. At =t 0.0s, a sweep motion is observed below the canopy top. The dye concentration is transported into the canopy layer. At =t 6.0-7.0s, an ejection motion appears and the high value of concentration is observed above the vegetation edge. At =t 12.0-13.0s, the sweep motion ap-pears again near the vegetation top.
Figure 7 shows some examples of the instanta-neous velocity vectors )~,~( vu , which were ob-
0
1
2
3
0 1 2 3 4 5
t=0.0s
hy /
vLx /
0
1
2
3
0 1 2 3 4 5
t=4.8s
hy /
vLx /8u-8 (cm/s)
0
1
2
3
0 1 2 3 4 5
t=7.5s
hy /
vLx /
Sweep Ejection Sweep Ejection
Figure 7 Instantaneous velocity vectors
0
1
2
3
0 1 2 3 4 50
1
2
3
0 1 2 3 4 5
t=0.0s
hy /
vLx /
hy /
vLx /
0
1
2
3
0 1 2 3 4 5
hy /
vLx /
t=4.8s t=7.5s
50uv−-50 (cm/s) 2
Sweep
SweepEjection
Ejection
Figure 8 Instantaneous Reynolds stress
1.0oCC /0
0
1
2
3
0 1 2 3 4 5
t=0.0s
hy /
vLx /
0
1
2
3
0 1 2 3 4 5
t=4.8s
hy /
vLx /
0
1
2
3
0 1 2 3 4 5
t=7.5s
hy /
vLx /
Sweep
Ejection
Sweep Ejection
Figure 9 Corresponding instantaneous concentration field
491

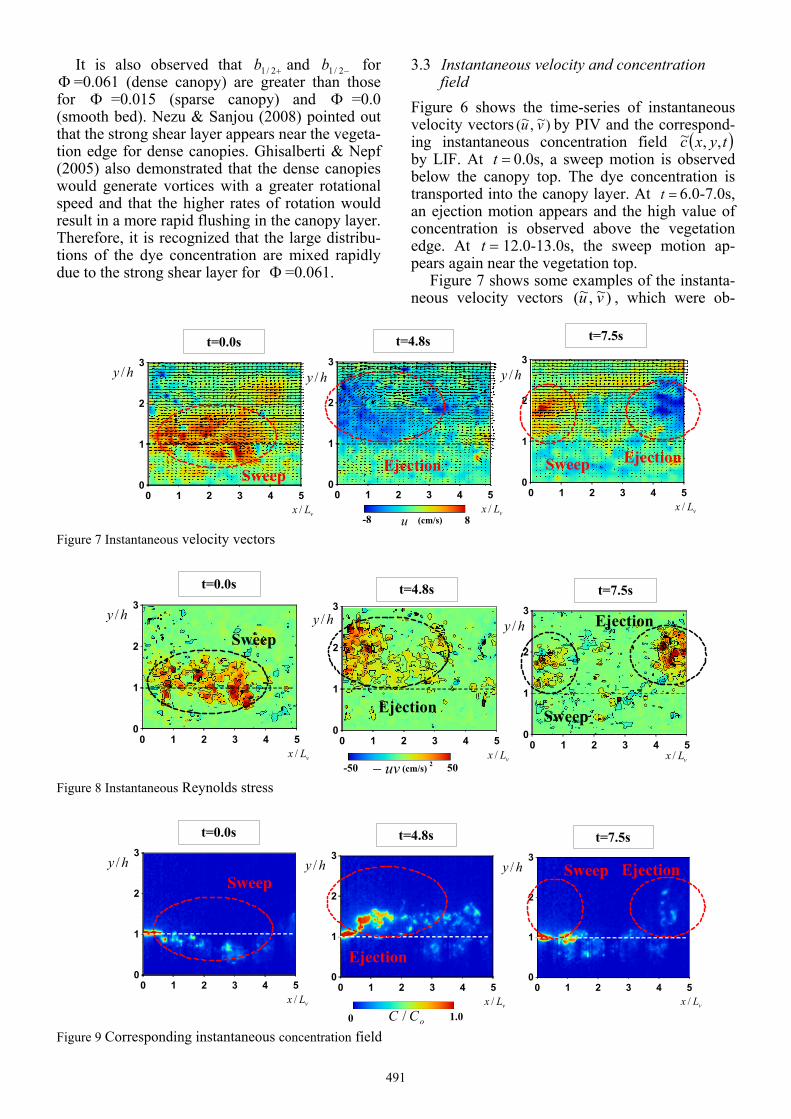
tained by PIV. The contours indicate the magni-tude of turbulent fluctuations u (x,y,t) for the streamwise velocity component. Figure 8 shows the contours of the instantaneous Reynolds stress –u(t)v(t) at the same time. It is recognized that large values of the instantaneous Reynolds stress are located near the vegetation edge and these lo-cally-high distributions of Reynolds stress corres-pond well to ejection and sweep motions of Figure 7. These results imply that the coherent motions govern the momentum transfer near the canopies significantly. These noticeable features for sub-merged canopies are in good agreement with Nezu & Sanjou (2008).
Figure 9 shows the corresponding simultaneous concentration field ( )tyxc ,, measured by LIF. Figure 9 reveals the high spatial variability of the instantaneous concentration field. At t=0.0(s), a sweep motion, i.e., the downward vectors, appears near the vegetation edge. It is observed that the large distribution of the instantaneous concentra-
tion is transported downward ( )0<v by the sweep motion. At t=4.8(s), an ejection motion is observed and causes the local increase of the con-centration above the canopy. At t=7.5(s), the ejec-tion motion is transported downstream and the other sweep motion appears at the upstream side. The individual filaments of the dye concentration are observed clearly and the highly intermittent nature of the plume is exhibited, which is consis-tent with Rahman & Webster (2005). These im-ages also show that the locally-high distributions of dye concentration correspond well to these co-herent structure zones.
These results provide more evidence that the large-scale coherent motions dominate the vertical mass and momentum transport in vegetated flows.
3.4 Conditional analysis To examine the effects of the coherent motions on the vertical turbulent diffusion quantitatively, qu-adrant analyses were performed. Figure 10 (b) and (c) show the contours of the concentration EC and
SC at hy /0 =1.0 for φ =0.061 (dense canopy) by using conditional sampling of the Ejection mo-tion (u<0, v>0) and the Sweep motion (u>0, v<0), respectively. The contour of the time-averaged concentration (non-conditional) C is also included for comparison in Figure 10(a). It is evident from Figure 10 (b) that EC has the peak value above the vegetation edge and the values of EC are larger than C (non-conditional) over the canopy. This implies that the high-value of the dye con-centration is transported to the above-canopy layer by the Ejection motion, which is consistent with Figs.4 and 5. Whereas, SC becomes larger than C below the vegetation edge and the Sweep mo-tion transports the dye concentration into the with-in-canopy layer.
0
0.5
1
1.5
2
2.5
3
0 1 2 3 4 5
Non-conditionalhy /
vLx /
Half widthMaximum concentration
0
0.5
1
1.5
2
2.5
3
0 1 2 3 4 5
hy /
vLx /
Half widthMaximum concentration
Ejection
0
0.5
1
1.5
2
2.5
3
0 1 2 3 4 5
hy /
vLx /
Half widthMaximum concentration
Sweep
0
1.0
max/ CC
Figure 10 Contour of conditional sampling concentration
0
0.5
1
1.5
2
2.5
3
0 0.5 1 1.5
hy /
max/CC
□ Non-conditional△ Ejection(H=0)
▲ Ejection(H=1)○ Sweep(H=0)● Sweep(H=1)
Figure 11 Distribution of conditional sampling concentra-tion
492

Figure 11 shows the vertical distributions of the concentration EC and SC at hy /0 =1.0 for Φ =0.061 by using conditional sampling of the Ejections and Sweeps. To exclude the less-organized motion, a threshold level H, so-called the ‘hole-value’ is used. The values of the concen-tration )1( =HCE and )1( =HCS are greater than those of )0( =HCE and )0( =HCS . This indi-cates that much organized Sweep and Ejection motions would transport larger-values of the dye concentration.
It is also observed that the value of SC de-creases more rapidly than that of EC , which is
consistent with Figure 10. These results reveal that the large distributions of the dye concentra-tion are mixed more rapidly within the canopy due to the stronger wake effects behind vegetation stems, and consequently, the peak value of SC decreases more significantly in the within-canopy layers.
3.5 Turbulent scalar flux Of particular significance in this study is the tur-bulent scalar flux of a passive tracer. The PIV-LIF measurements afford us to calculate the local co-variance between the concentration and velocity fluctuations, uc− and vc− . Figure 12 shows the turbulent scalar flux uc− and vc− for dense (Φ =0.061) and sparse (Φ =0.015) canopies. The RMS values of the streamwise velocity, u’, and the concentration, c’, are used to normalize the flux quantities. The turbulent flux uc− has the positive values and vc− has the negative values above the vegetation edge (y/h>1.0). The large peak values of uc− and vc− are located in the over-canopy region. This indicates that the high distribution of concentration (c>0) is transported upward by the ejection motion (u<0, v>0). In con-trast, uc− have the negative values within the canopy layer, which implies that the sweep mo-tion (u>0, v<0) transports the dye concentration into the canopy layer (c>0).
It should be noticed that the values of the tur-bulent scalar flux uc− and vc− are greater for dense canopy than for sparse canopy, which is
=0.061, =1.0φ hy /0
''/ cuuc−-0.3 0.3 vLx /
=0.015, =1.0φ hy /0
hy /
vLx /0
0.5
1
1.5
2
2.5
3
0 1 2 3 4 5
hy /
0
0.5
1
1.5
2
2.5
3
0 1 2 3 4 5
hy /
0
0.5
1
1.5
2
2.5
3
0 1 2 3 4 5 vLx /
0
0.5
1
1.5
2
2.5
3
0 1 2 3 4 5
vLx /
hy /
''/ cvvc−-0.3 0.3
Φ
Φ
Figure 12 Turbulent scalar flux uc− and vc− (y0/h=1.0)
0
0.5
1
1.5
2
2.5
3
-0.01 -0.005 0 0.005 0.01 0.015 0.02
(0.00001348477134, 2.5481)
(0.00003282031504, 2.5481)
(-0.00000768369411, 2.5481
(-0.00000393585366, 2.5481
(-0 00009275925813 2 5481
□ Non-conditional
△ Ejection (H=1)
▲ Ejection (H=2)
○ Sweep(H=1)
● Sweep(H=2)
hy /
UCuc−
cδcδ (Sweep)
(Non-conditional)
Figure 13 Vertical distribution of conditional sampling turbu-lent scalar flux (φ =0.061)
493

consistent with Figure 5. These results reveal that the strong shear layer near the vegetation edge ge-nerates the large-scale coherent vortices for dense canopy and larger distributions of the dye concen-tration are transported toward the over- and with-in-canopies more significantly.
Figure 13 shows the vertical distribution of turbulent scalar flux uc− at vLx / =2.0 for dense canopy (Φ =0.061) by using conditional sampling of the Ejections and Sweeps. The bulk mean ve-locity Um and the time-averaged concentration C are used to normalize the flux quantities. The tur-bulent scalar flux Sweepuc− has the larger positive values within the canopy layer than the
lconditionaNonuc −− , whereas the values of Ejectionuc− become larger above the vegetation edge (y/h=1.2-2.0).
Vertical penetration of turbulent scalar flux in-to the canopy is a measure of a region within the canopy, which actively exchanges mass. The ex-tent of this region may be defined as the point within the canopy at which the turbulent scalar flux uc− becomes negligibly small. In Figure 13,
cδ is the penetration thickness of turbulent scalar flux. cδ (Sweep) is significantly larger than
cδ (Non-conditional). This implies that the Sweep motions dominate the vertical penetration of sca-lar flux into the canopy. This conclusion is sup-ported by the conditional sampling concentration (Figure 11).
4 CONCLUSIONS
This study conducted PIV & LIF measurements to reveal the effects of the submerged vegetation on scalar flux in open-channel flows with rigid vege-tations. The nozzle tip position was changed to examine the turbulent diffusion properties in all three sub-zones of the vegetated open-channel flow.
The significant results obtained in this study are as follows: 1. The half-value-width becomes larger in the
mixing-layer zone and the vertical diffusion is smaller in the wake zone and in the log-law zone. This implies that a large-scale coherent vortex is generated near the vegetation edge and the vertical turbulent exchange contributes largely to the scalar transport in the mixing-layer zone.
2. On the basis of LIF&PIV data, the effect of the coherent motion on mass transport was ex-amined quantitatively. The conditional analy-sis reveals that the large distributions of dye concentration are transported toward the
above-canopy and the within-canopy regions by ejection and sweep motions, respectively.
3. The PIV-LIF measurements afford us to calcu-late the local covariance between concentra-tion and velocity fluctuations. The values of the turbulent scalar flux are greater for dense canopy than those for sparse canopy. These results reveal that the strong shear layer near the vegetation edge generates the large-scale coherent vortices for dense canopy and larger distributions of the dye concentration are transported toward the over- and within- ca-nopies more significantly.
REFERENCES
Chen, D., and Jirka, G.H. 1999. LIF study of plane jet bounded in shallow water layer. J. Hydraul. Eng., 125, 817-826.
Crimaldi, J. P. and Koseff, J. R. 2001. High-resolution mea-surements of the spatial and temporal scalar structure of a turbulent plume, Experiments in Fluids, 31, 90-102.
Gao, W., Shaw, R.H. and Paw, K.T. 1988. Observation of organized structure in turbulent flow within and above a forest canopy. Boundary-Layer Meteorology, 47, 349-377.
Ghisalberti, M. and Nepf, H. 2005. Mass transfer in the ve-getated shear flows. Environ. Fluid Mech., 5(6), 527-551.
Jamali, M., Zhang, H. and Nepf, H. 2008. Exchange flow between canopy and open water, J. Fluid Mech., 611, 237-254.
Nepf, H., and Vivoni, E. R. 2000. Flow structure in depth-limited vegetated flow, J. of Geophys. Res.105, 28547-28557.
Nezu, I., and Sanjou. M. 2008. Turbulence structure and co-herent motion in vegetated canopy open-channel flows. J. of Hydro-environment Res.. 2, 62-90.
Poggi, D., Porpotato, A. and Ridolfi, L. 2004. The effect of vegetation density on canopy sub-layer turbulence, Boundary-Layer Meteorology, 111, 565-587.
Raupach, M.R., Finnigan, J.J., Brunet, J.J, 1996. Coherent eddies and turbulence in vegetation canopies: the mixing layer analogy, Boundary Layer Meteor., 78, 351-382.
Rahman, S., and Webster, D.R. 2005. The effect of bed roughness on scalar fluctuations in turbulent boundary layers, Experiments in Fluids, 38, 372-384.
Reidenbach, M.A., Koseff, J.R, and Monismith, S.G. 2007: Laboratory experiments of fine-scale mixing and mass transport within a coral canopy, Physics of Fluids, 19, 075107.
Webster, D.R., Rahman, S., and Dasi, L.P. 2003. Laser-induced fluorescene measurements of a turbulent plume, J. Eng. Mech., 129,1130-1137.
494


