Risking Amplitude Prospects
29
AV Learning from 40 Years Experience: Risking Seismic Amplitude Anomaly Prospects* Mike Forrest 1 Search and Discovery Article #110139 (2010) Posted June 28, 2010 *Adapted from presentation at Forum, Discovery Thinking, at AAPG Annual Convention, New Orleans, Louisiana, April 11-14, 2010 1 Shell Oil (retired) and Maxus Energy (retired), currently Associated Consultant, Rose & Associates , Duncanville, TX ([email protected] ) Final Comments Gas or oil replacing water in a reservoir will always cause a change in seismic reflection coefficient and AVO. The change can range from “dramatic” to “subtle” to “unrecognizable.” Factors: o Rock physics o Seismic signal-to-noise ratio o Geology vs. seismic resolution. Review the Seismic and Rock Physics. Can DHI’s be a factor in your prospect risk analysis? Positive impact – use systematic/consistent work process. Negative impact – DHI’s expected but none observed.
-
Upload
moustafa-dahab -
Category
Documents
-
view
23 -
download
1
Transcript of Risking Amplitude Prospects
AV
Learning from 40 Years Experience: Risking Seismic Amplitude Anomaly Prospects*
Mike Forrest1
Search and Discovery Article #110139 (2010)
Posted June 28, 2010 *Adapted from presentation at Forum, Discovery Thinking, at AAPG Annual Convention, New Orleans, Louisiana, April 11-14, 2010 1Shell Oil (retired) and Maxus Energy (retired), currently Associated Consultant, Rose & Associates , Duncanville, TX ([email protected])
Final Comments
Gas or oil replacing water in a reservoir will always cause a change in seismic reflection coefficient and AVO. The change can range from “dramatic” to “subtle” to “unrecognizable.” Factors:
o Rock physics o Seismic signal-to-noise ratio o Geology vs. seismic resolution.
Review the Seismic and Rock Physics. Can DHI’s be a factor in your prospect risk analysis? Positive impact – use systematic/consistent work process. Negative impact – DHI’s expected but none observed.
Learning from 40 Years Experience
Risking Seismic Amplitude Anomaly Prospects
AAPG Convention, April 2010
Mike Forrest
Shell Oil (retired) and Maxus Energy (retired) Associated Consultant, Rose & Associates
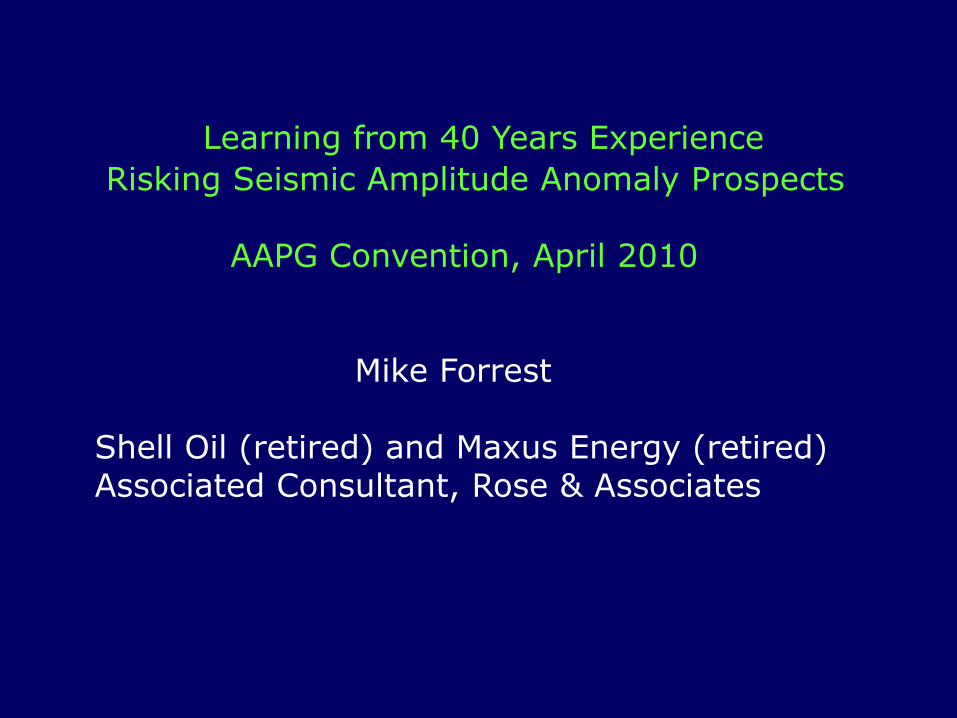
Seismic Amplitude Anomaly Terms
Direct Hydrocarbon Indicator (DHI), Hydrocarbon indicator (HCI): measurement which indicates the possible presence of a hydrocarbon accumulation
Bright spot: local increase in amplitude on a seismic section
Flat Spot: possible hyrocarbon fluid contact
Amplitude variation with offset/angle (AVO, AVA): prestack data, seismic gathers, offset/angle stacks, cross-plots(actually “change in AVO”)
Phase (Polarity) Change: seismic peak on stack data changes to a trough (or trough to a peak)
Dim Spot: local decrease in reflection amplitude
40 Years Timeline
1967 to 1970 – Bright Spot recognition and studies
1970’s – GOM Shelf Discoveries
Mid/late 80’s – deep water exploration
Last 10 years – “lessons learned” in a DHI Consortium

1967: Main Pass 122 - 133 Area
1.5 sec (5000’)
3
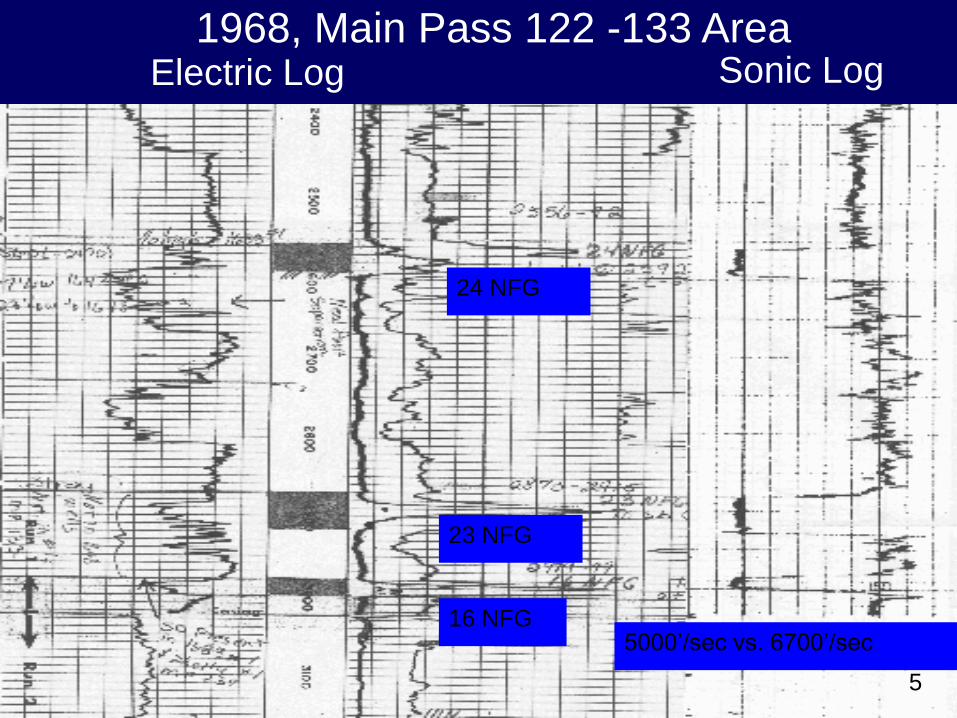
1968, Main Pass 122 -133 AreaSonic LogElectric Log
24 NFG
23 NFG
16 NFG
5000’/sec5000’/sec.5000’/sec vs. 6700’/sec
5
“Bright Spot” recognition and studies
Started with an observation and a map, Main Pass Area, GOM
More observations on undrilled Pleistocene GOM prospects
Reviewed several Pliocene-Miocene fields - seismic and subsurface maps - logs – petrophysics - oil and gas areas and pay thicknesses - relate to seismic data
Lessons: know the data, observations, make maps - measurements/calibration are essential
1969
“Bright Spot” term coined in Shell
Management Review: Operations/Research team formed
“Peak and Valley” days.
“Digital Revolution” was a major factor –preserve relative amplitude of seismic data
8
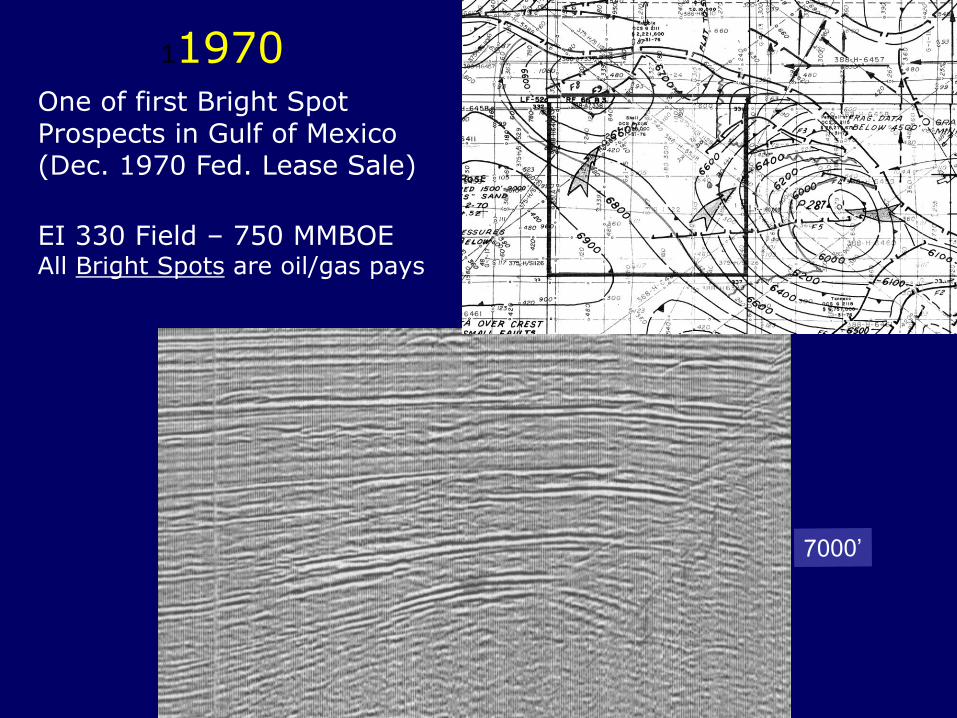
One of first Bright Spot Prospects in Gulf of Mexico(Dec. 1970 Fed. Lease Sale)
EI 330 Field – 750 MMBOEAll Bright Spots are oil/gas pays
11970
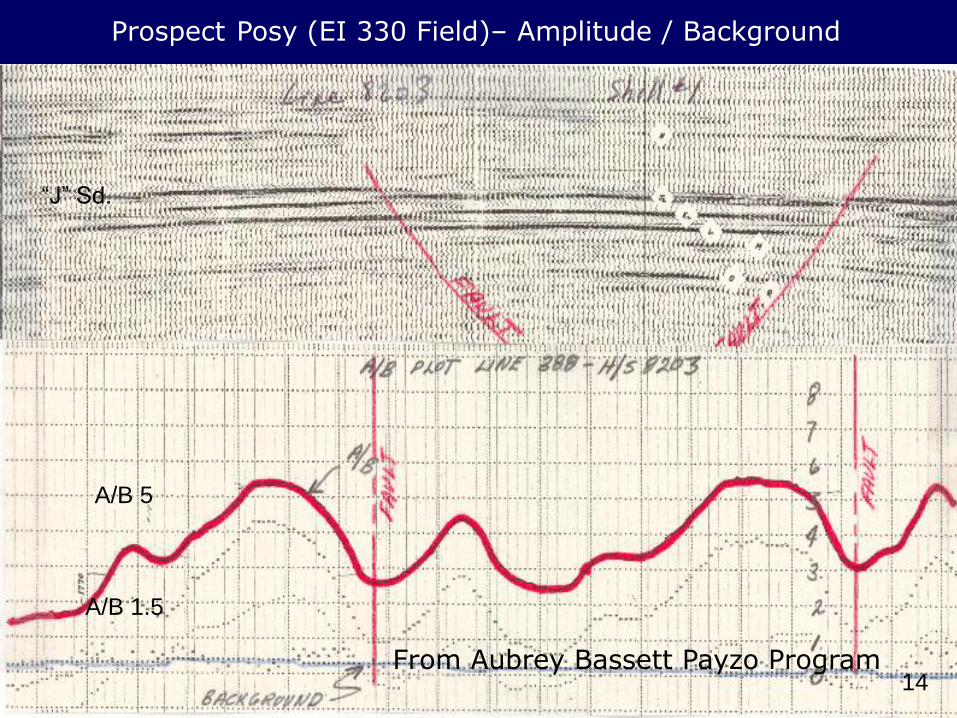
Prospect Posy (EI 330 Field)– Amplitude / Background
A/B 5
A/B 1.5
From Aubrey Bassett Payzo Program
“J” Sd.
14
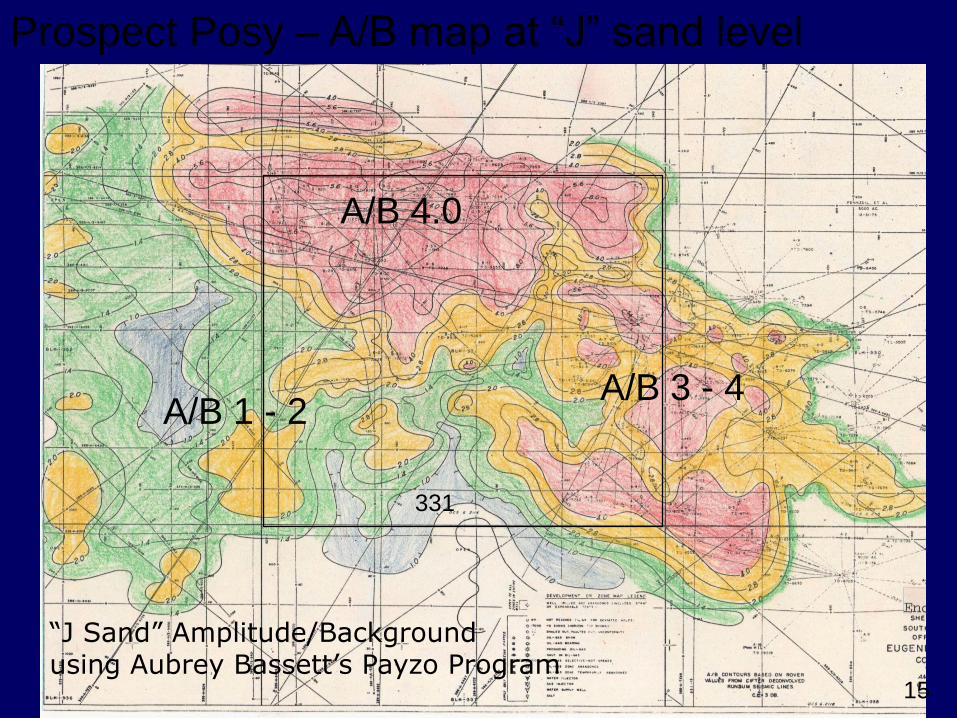
Prospect Posy – A/B map at “J” sand level
“J Sand” Amplitude/Background using Aubrey Bassett’s Payzo Program
A/B 4.0
A/B 1 - 2
331
A/B 3 - 4
15

“J” gross pay sand thickness map
Chuck Roripaugh, 1970.Using Payzo program.
Prospect Posy
150’
0
100’
100’
< 60’
17
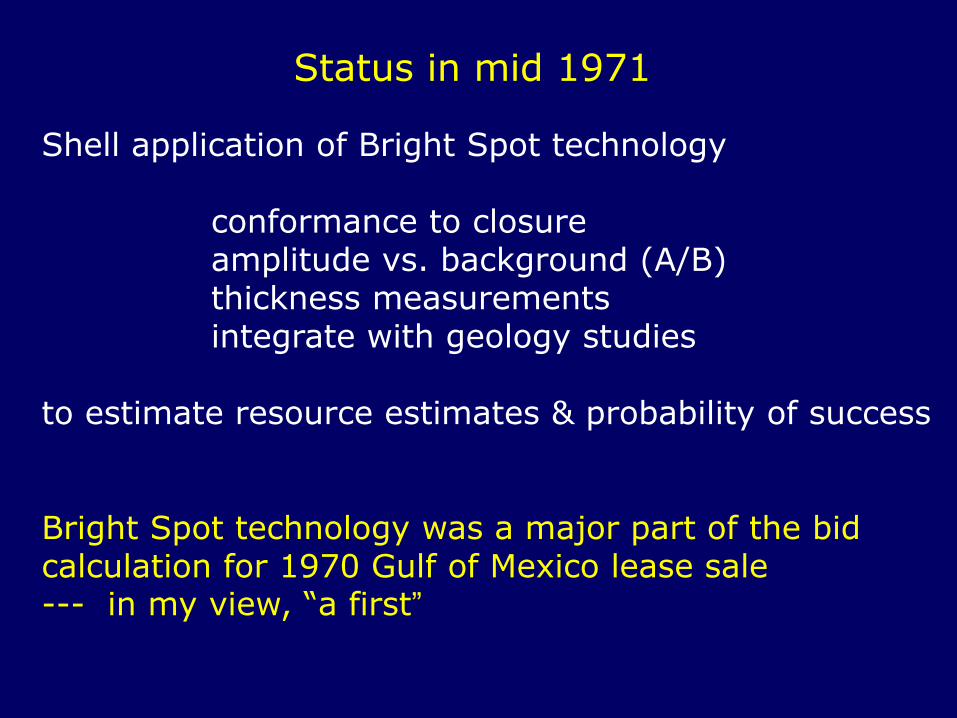
Status in mid 1971
Shell application of Bright Spot technology
conformance to closure amplitude vs. background (A/B)thickness measurementsintegrate with geology studies
to estimate resource estimates & probability of success
Bright Spot technology was a major part of the bid calculation for 1970 Gulf of Mexico lease sale --- in my view, “a first”
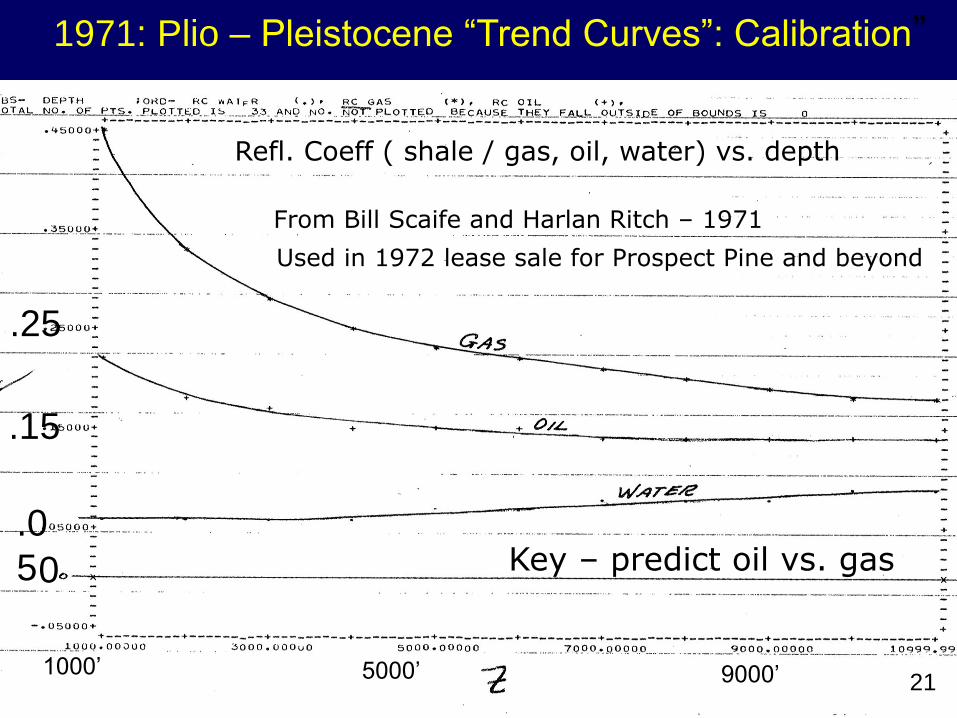
1971: Plio – Pleistocene “Trend Curves”: Calibration”
Refl. Coeff ( shale / gas, oil, water) vs. depth
1000’ 5000’ 9000’
0
.15
.25
.0
5
From Bill Scaife and Harlan Ritch – 1971
Used in 1972 lease sale for Prospect Pine and beyond
21
Key – predict oil vs. gas
P
i
n
e
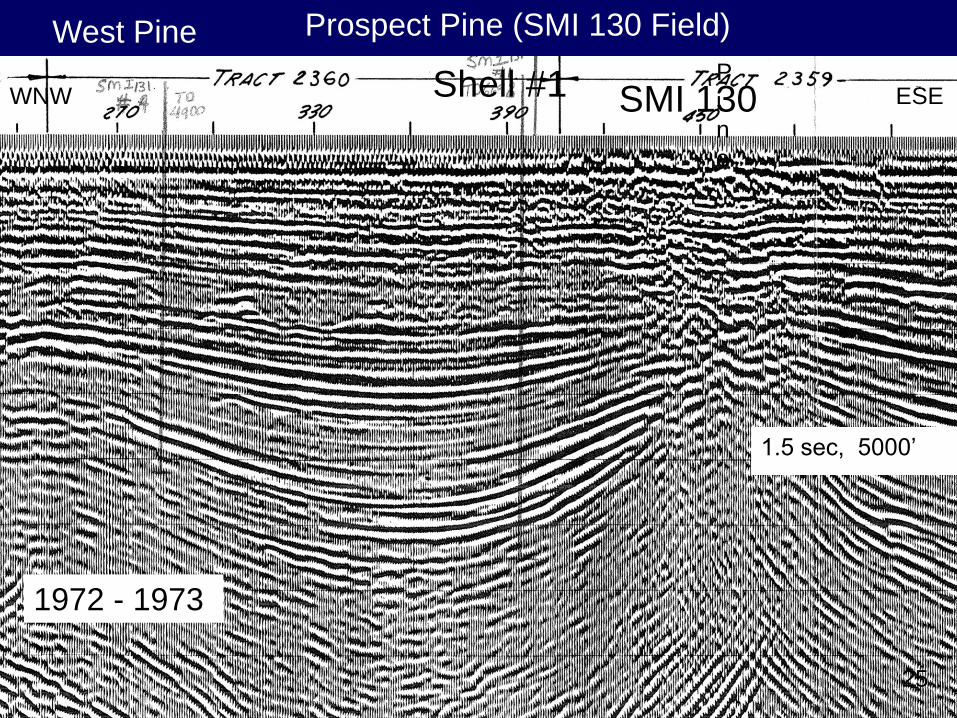
ESEWNW
West Pine Prospect Pine (SMI 130 Field)
1.5 sec, 5000’
Shell #1 SMI 130
25
1972 - 1973
Prospect Pine/West Pine Summary
Related amplitudes to petrophysical “Trend Curves”.
Original estimate of 100 MMBO - high probability “oil calls”.
Ultimate today: 225 MMBOE.
West Pine - first recognition of low saturation gas problem (LSG)
Sand with 10% gas saturation has essentially same reflectivity as sand with 80% gas sat.
Low velocity similar to commercial gas; density effect is minor
29
1970’s – GOM Shelf Discoveries (cont)
Many 20 to 100+ MMBOE Fields Total Ultimate 1.5 to 2.0 BBO
Cognac field in 1000 ft water1974 lease sale - $50 MM to $100 MM bids per block1975 discovery
Resource estimate essentially 100% Bright Spot supportedShell bid on 100 MMBO + 500 BCF
Expected ultimate: 180 MMBO and 750 BCF (300 MMBOE)
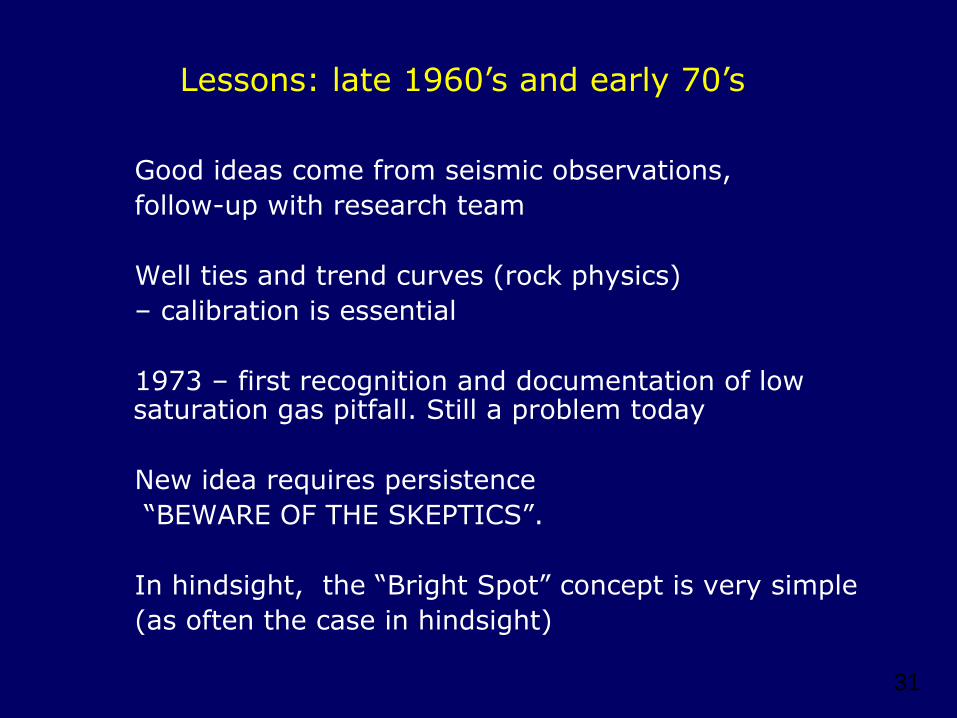
Good ideas come from seismic observations,
follow-up with research team
Well ties and trend curves (rock physics)
– calibration is essential
1973 – first recognition and documentation of low saturation gas pitfall. Still a problem today
New idea requires persistence
“BEWARE OF THE SKEPTICS”.
In hindsight, the “Bright Spot” concept is very simple
(as often the case in hindsight)
Lessons: late 1960’s and early 70’s
31
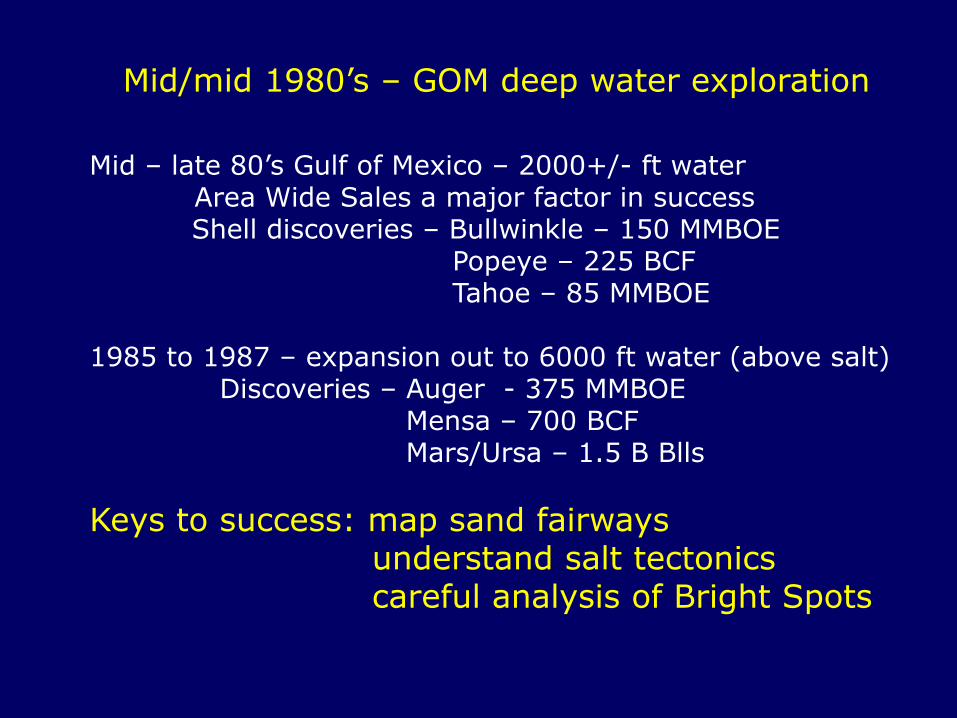
Mid/mid 1980’s – GOM deep water exploration
Mid – late 80’s Gulf of Mexico – 2000+/- ft water Area Wide Sales a major factor in successShell discoveries – Bullwinkle – 150 MMBOE
Popeye – 225 BCFTahoe – 85 MMBOE
1985 to 1987 – expansion out to 6000 ft water (above salt) Discoveries – Auger - 375 MMBOE
Mensa – 700 BCFMars/Ursa – 1.5 B Blls
Keys to success: map sand fairways understand salt tectonics careful analysis of Bright Spots
2001 to today
Many “lessons learned” in a DHI Consortium
,
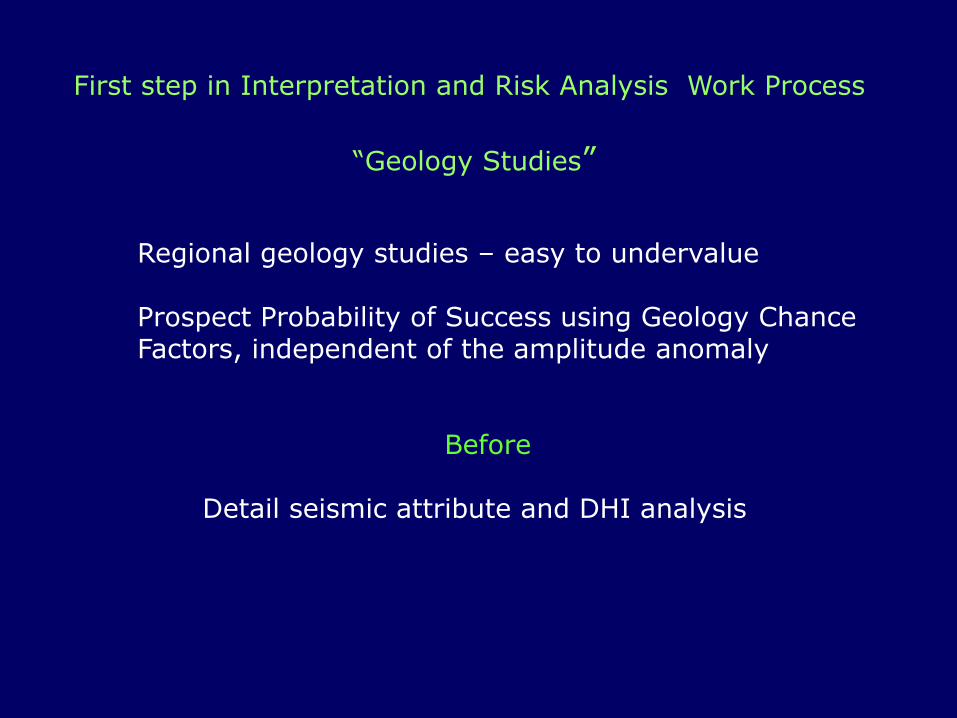
First step in Interpretation and Risk Analysis Work Process
“Geology Studies”
Regional geology studies – easy to undervalue
Prospect Probability of Success using Geology Chance Factors, independent of the amplitude anomaly
Before
Detail seismic attribute and DHI analysis

“ Seismic and Rock Physics Data Quality”
Understand Seismic Acquisition and Processing Parameters“Surprising how often this is not done”
Save the seismic gathers – QC check and AVO
Tie seismic to rock physics data – forward modeling
Seismic and rock physics data quality are key factors in amplitude analysis
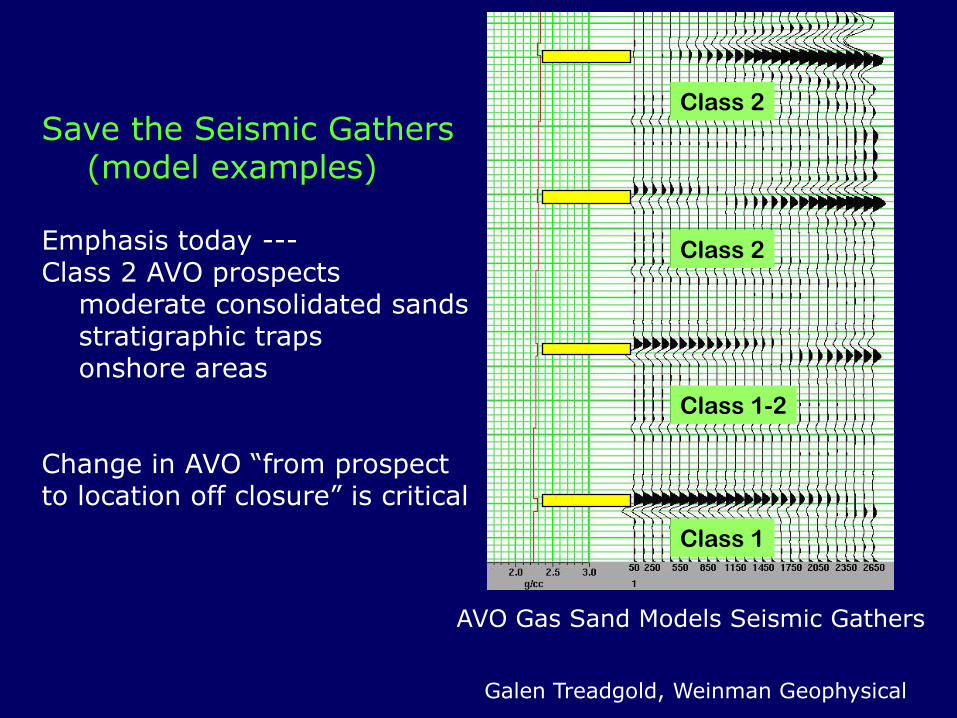
Class 2
Class 2
Class 1-2
Class 1
Galen Treadgold, Weinman Geophysical
AVO Gas Sand Models Seismic Gathers
Save the Seismic Gathers(model examples)
Emphasis today ---Class 2 AVO prospects
moderate consolidated sandsstratigraphic traps onshore areas
Change in AVO “from prospect to location off closure” is critical
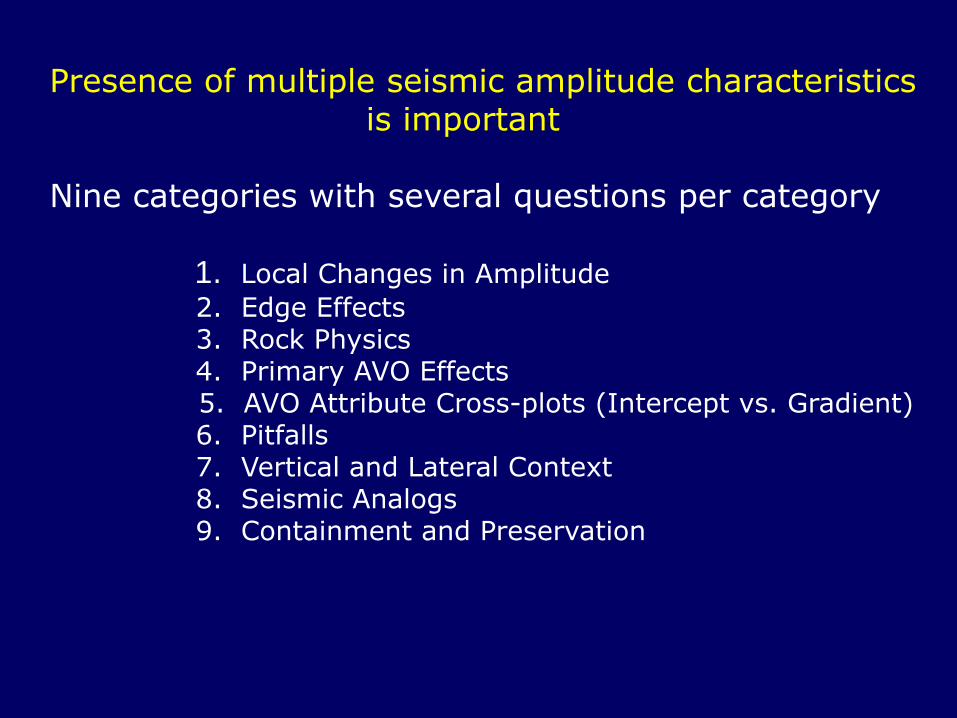
Presence of multiple seismic amplitude characteristicsis important
Nine categories with several questions per category
1. Local Changes in Amplitude
2. Edge Effects3. Rock Physics 4. Primary AVO Effects 5. AVO Attribute Cross-plots (Intercept vs. Gradient)6. Pitfalls7. Vertical and Lateral Context 8. Seismic Analogs9. Containment and Preservation
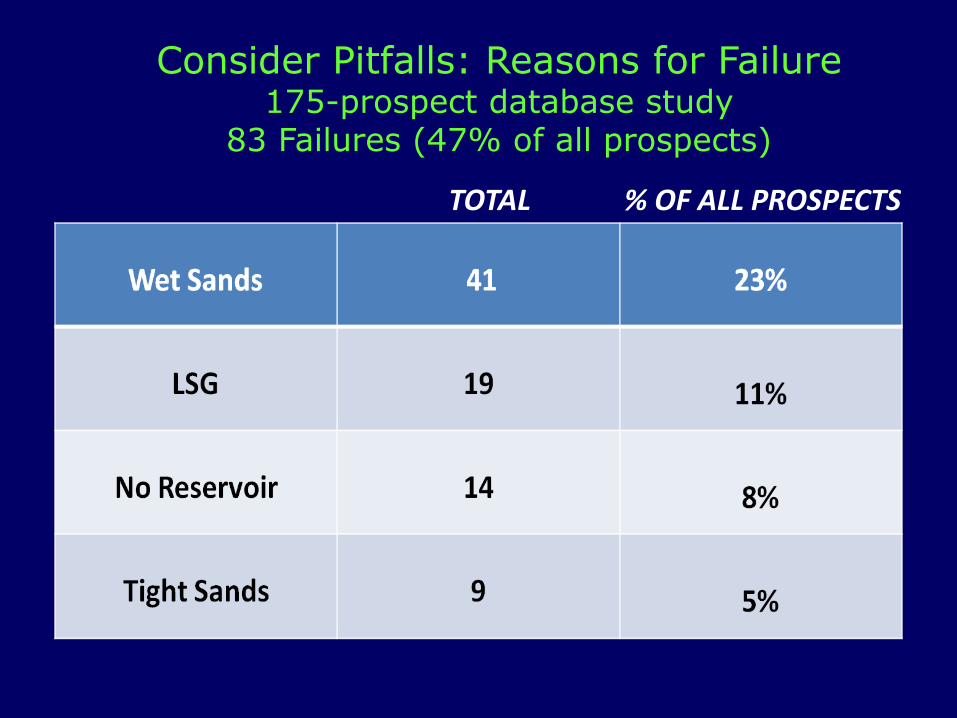
TOTAL % OF ALL PROSPECTS
Consider Pitfalls: Reasons for Failure175-prospect database study
83 Failures (47% of all prospects)
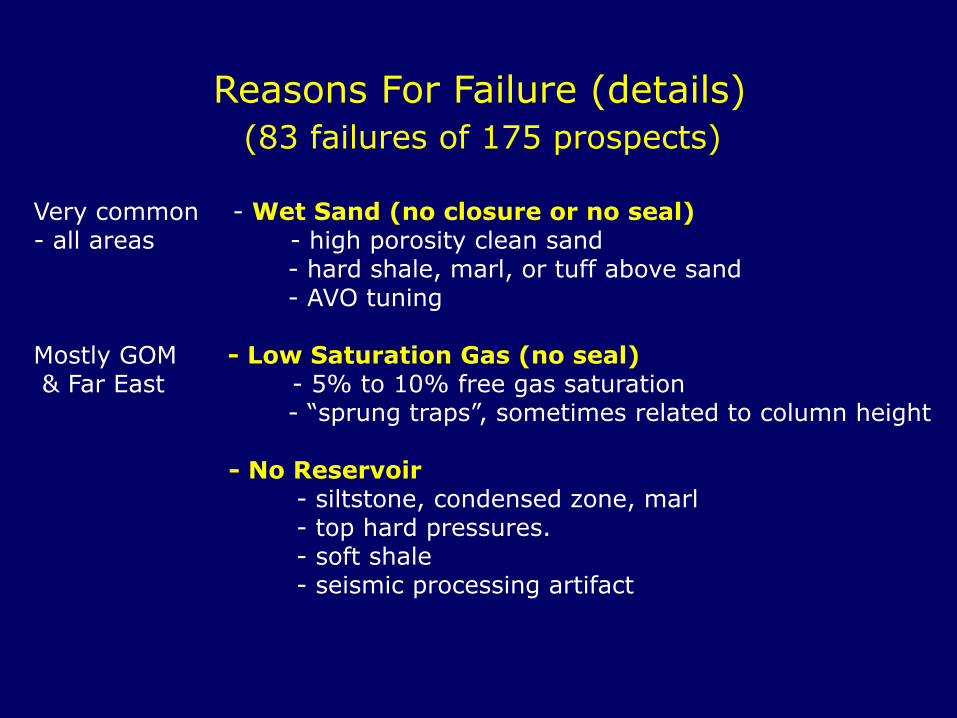
Reasons For Failure (details)
(83 failures of 175 prospects)
Very common - Wet Sand (no closure or no seal)- all areas - high porosity clean sand
- hard shale, marl, or tuff above sand- AVO tuning
Mostly GOM - Low Saturation Gas (no seal) & Far East - 5% to 10% free gas saturation
- “sprung traps”, sometimes related to column height
- No Reservoir- siltstone, condensed zone, marl - top hard pressures. - soft shale- seismic processing artifact
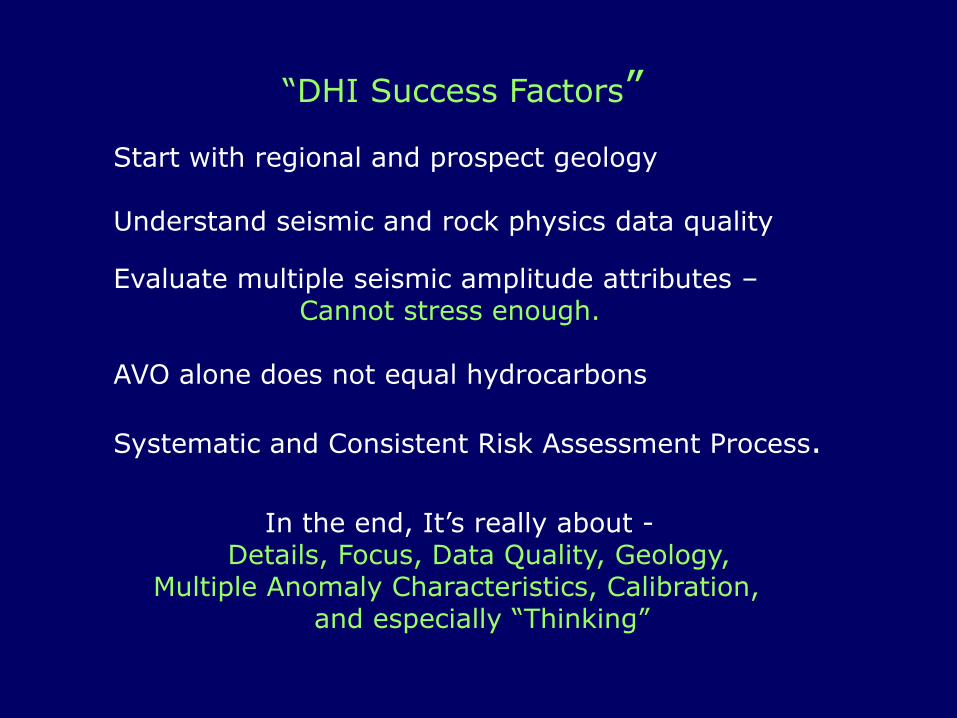
In the end, It’s really about -Details, Focus, Data Quality, Geology,
Multiple Anomaly Characteristics, Calibration, and especially “Thinking”
“DHI Success Factors”
Start with regional and prospect geology
Understand seismic and rock physics data quality
Evaluate multiple seismic amplitude attributes –Cannot stress enough.
AVO alone does not equal hydrocarbons
Systematic and Consistent Risk Assessment Process.
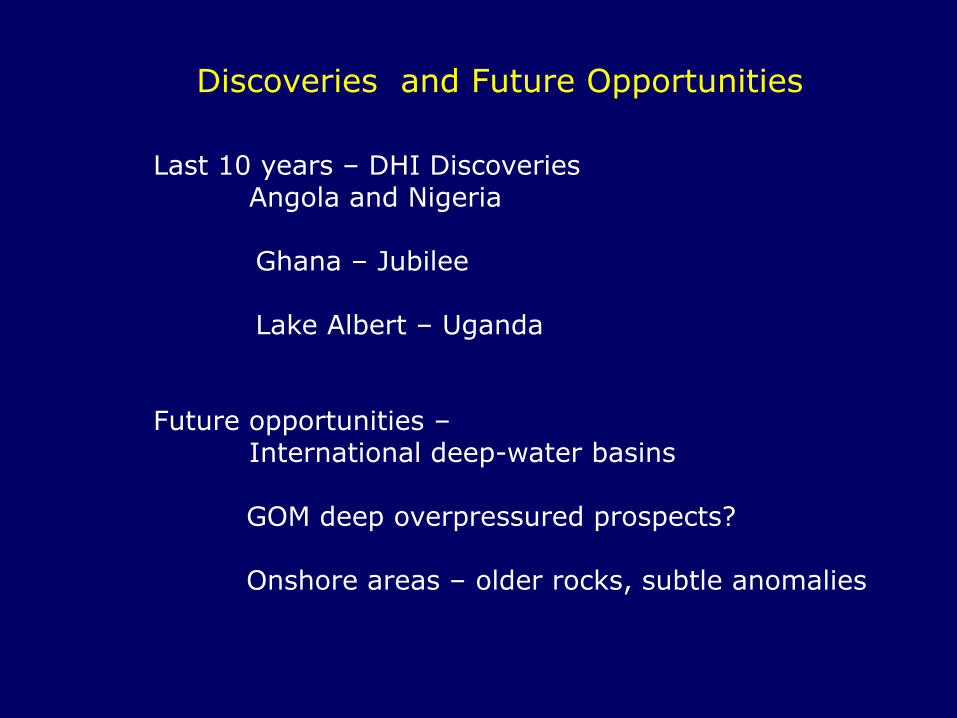
Discoveries and Future Opportunities
Last 10 years – DHI DiscoveriesAngola and Nigeria
Ghana – Jubilee
Lake Albert – Uganda
Future opportunities –International deep-water basins
GOM deep overpressured prospects?
Onshore areas – older rocks, subtle anomalies
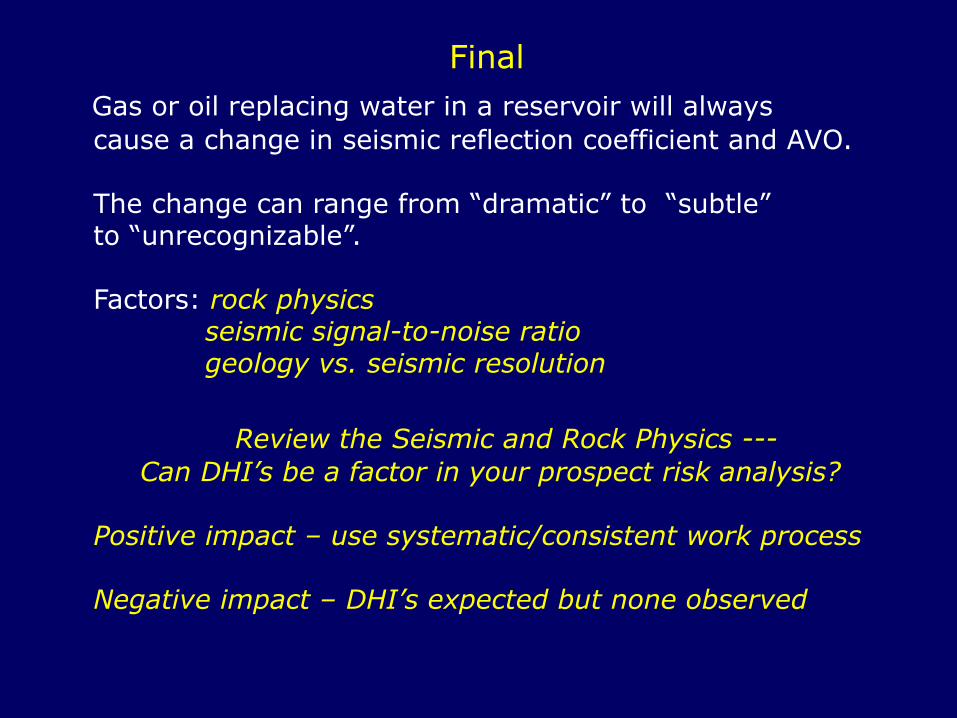
Final
Gas or oil replacing water in a reservoir will always
cause a change in seismic reflection coefficient and AVO.
The change can range from “dramatic” to “subtle” to “unrecognizable”.
Factors: rock physicsseismic signal-to-noise ratio geology vs. seismic resolution
Review the Seismic and Rock Physics ---
Can DHI’s be a factor in your prospect risk analysis?
Positive impact – use systematic/consistent work process
Negative impact – DHI’s expected but none observed