Risk margins industry report - Pages alone risk margins 12 Diversification benefits 13 Appendix A...
21
General Insurance Risk margins industry report 30 June 2007 (issued November 2008) www.apra.gov.au Australian Prudential Regulation Authority
Transcript of Risk margins industry report - Pages alone risk margins 12 Diversification benefits 13 Appendix A...

General InsuranceRisk margins industry report30 June 2007 (issued November 2008)
www.apra.gov.au
Australian Prudential Regulation Authority
Australian Prudential Regulation Authority 2
Copyright
© Commonwealth of Australia
This work is copyright. You may download, display, print and reproduce this material in unaltered form only (retaining this notice) for your personal, non-commercial use or use within your organisation. All other rights are reserved.
Requests and inquiries concerning reproduction and rights should be addressed to:
Commonwealth Copyright Administration Copyright Law Branch Attorney-General’s Department Robert Garran Offices National Circuit Barton ACT 2600 Fax: (02) 6250 5989
or submitted via the copyright request form on the website http://www.ag.gov.au/cca
Disclaimer
While APRA endeavours to ensure the quality of this Publication, APRA does not accept any responsibility for the accuracy, completeness or currency of the material included in this Publication, and will not be liable for any loss or damage arising out of any use of, or reliance on, this Publication.

Australian Prudential Regulation Authority 3
Introduction 4
Summary 5
Key findings 5
Methodology 6
Risk margins analysis 7
Direct business 7
Reinsurance business 10
Premium liabilities 11
Stand alone risk margins 12
Diversification benefits 13
Appendix A — Calculation methodologies 15
Appendix B — Risk margins excluding runoff insurers 16
Appendix C — Ratios between OCL and PL risk margins 18
Glossary of terms 19
Contents

Australian Prudential Regulation Authority 4
The valuation of insurance liabilities is an important aspect of the general insurance regulatory framework. The reserves held as a result of these valuations have a direct impact on the financial soundness of the insurer and its ability to protect the interests of policy holders who have put their trust in the industry. It is therefore important that insurance liabilities, including risk margins and diversification benefits, are valued in a realistic and appropriate manner.
The risk margin is intended to allow for the inherent uncertainty of the central estimate (or mean) of the insurance liabilities. It will usually include an allowance for the variability of claims experience within a class of business (stand alone risk margin) and also a deduction for any diversification between classes of business (diversification benefit). Together the central estimate and the risk margin are intended to produce a reasonable valuation of the insurance liabilities at a 75% probability of sufficiency level as required by APRA.
In the previous risk margins industry report, we noted comments from actuaries and other practitioners surrounding the difficulty of setting reasonable risk margins. Over time, this issue has somewhat subsided with actuaries becoming more comfortable and confident with the determination of risk margins. There remains, however, some uncertainty as to what represents a reasonable and justifiable diversification benefit. Diversification benefits continue to be based on fairly subjective correlation assumptions and further research may well be needed in this area.
As per the previous risk margins industry report of 2005, this report provides a detailed summary of the risk margins adopted by insurers for varying lines of business. For this report, we have extended the scope to include trends and analysis on the diversification benefits adopted by different insurers. We have also included some brief comments on the current methodologies used by actuaries in determining stand alone risk margins and diversification benefits.
The role of the report is not to prescribe particular risk margins or diversification benefits, but rather to give some insight into the risk margins and methods currently adopted by industry. It is hoped that the industry average risk margins and diversification benefits outlined here may provide a useful benchmark and check on the final risk margins adopted by individual insurers.
Introduction

Australian Prudential Regulation Authority 5
Key findings
The results suggest that the relativities between risk margins for different classes of business are reasonable. Risk margins adopted tend to be in line with general expectations, with those adopted for short tail classes being lower than those for long tail classes. Also, risk margins for outstanding claims liabilities tended to be lower than those for premium liabilities.
In general, there appears to be greater reliance on methods based on internal data, particularly in determining stand alone risk margins. The methods and assumptions used to determine diversification benefits continue to be based heavily on judgment and general reasoning.
The actual diversification benefits adopted by companies were broadly reasonable and in line with expectations. While there were some exceptions, we found that in general, larger insurers with many lines of business and lower portfolio concentration tended to adopt higher diversification benefits.
Summary

Australian Prudential Regulation Authority 6
APRA’s statistical analysis of risk margins used June 2007 quarter data extracted from the quarterly data returns GRF210.0 Outstanding Claims liabilities and GRF210.1 Premium Liabilities, which are submitted to APRA by regulated general insurers.
As more recent data became available, we have also assessed risk margin data from the December 2007 quarter. In general, there was very little difference between the two sets of numbers except for the smaller and less significant classes of business. The numbers in this report are based on our initial analyses of data from the June 2007 quarter.
The data has been checked for consistency and identified anomalies have been removed. In particular, we have excluded points with a zero risk margin but a non-zero central estimate. We have also excluded points with very high risk margins that were associated with extremely small portfolios.
All figures presented below are net of reinsurance and non-reinsurance recoveries. This is different to the previous risk margins report, where, due to data constraints, figures were reported gross of all recoveries. It should also be noted that the summary statistics are based on diversified risk margins and not stand alone risk margins, which would invariably be higher.
As diversified risk margins give no indication of the size of the diversification benefit adopted, we have further supplemented the statistical analysis with information from the risk margin section of various insurance liability valuation reports (ILVRs). The ILVRs were sampled from a wide range of insurers of differing sizes and types. The insurers were chosen such that a significant proportion (generally above 80%) of the net insurance liability for each class of business was covered. The review covered the approaches used for determining risk margins and diversification benefits and the discussion surrounding the adopted risk margins and diversification benefits.
Methodology
As part of our review, we have also completed some quantitative analysis on the actual diversification benefits adopted by around 60 insurers. In some cases, this was not explicitly provided and had to be estimated from other information provided in the ILVR. The diversification benefits were then assessed for general trends and broad relativities between different types of companies.
Regression techniques (primarily multiple linear regression) were used to explain the variability in the diversification benefits adopted by different insurers. In this case, the dependent variable was taken as the adopted diversification benefit expressed as a percentage of the undiversified net risk margin. Explanatory variables such as insurer size, lines of business and various measures of portfolio concentration were all tested. Based on actual and fitted diversification benefits, we then estimated ‘industry average’ diversification benefit ranges for insurers of different portfolio concentrations and sizes.

Australian Prudential Regulation Authority 7
This section provides summaries of the average risk margins and the variability of these risk margins across the lines of business in general insurance. Results are separated into direct and reinsurance business, as well as between outstanding claims and premium liabilities. The risk margins presented below are net of reinsurance and non-reinsurance recoveries and net of diversification benefits.
Direct Business
Table 1 Outstanding Claims Liabilities for Direct Business
Class of Business No. of Insurers
Weighted RM Average RM
Mean (%) Standard Deviation (%) Mean (%) Standard
Deviation (%)
Houseowners/Householders 40 5.6% 2.0% 12.0% 15.6%
Domestic motor vehicle 38 5.6% 2.1% 9.1% 6.0%
Commercial motor vehicle 34 7.1% 3.1% 16.7% 19.9%
Travel 15 7.7% 1.9% 16.0% 23.8%
Fire and ISR 44 8.5% 3.7% 17.6% 24.2%
Marine 43 9.5% 9.5% 27.1% 46.1%
Aviation 9 5.8% 4.4% 13.6% 9.4%
Mortgage 10 9.5% 6.2% 30.9% 26.6%
Consumer Credit 17 8.2% 5.9% 16.0% 14.9%
Other Accident 39 8.2% 3.6% 17.0% 20.9%
CTP motor vehicle 13 9.3% 2.0% 9.9% 3.3%
Public and product liability 50 11.2% 6.9% 26.6% 43.3%
Professional indemnity 37 13.7% 7.1% 19.0% 20.4%
Employers liability 25 12.5% 4.6% 25.3% 37.5%
Other 41 12.2% 4.9% 16.1% 11.9%
Risk margin analysis

Australian Prudential Regulation Authority 8
For Direct Business, the general relativities between risk margins for different lines of business appear to be quite reasonable. In general, the weighted average risk margins are somewhat below the arithmetic average risk margins. This is due to larger insurers in a particular line of business adopting lower risk margins than smaller insurers. The magnitude of the differences gives some indication as to the relativities between risk margins adopted by smaller and larger insurers.
Between lines of business, we note that commercial lines tended to have higher and more dispersed risk margins than personal lines. The same is also generally true between long tail classes and short tail business. For outstanding claims liability, the highest risk margins tended to be associated with the liability classes where there is generally a significant delay between claim incidence and claim payment.
While the tables above give some indication of the dispersion of adopted risk margins, it should be noted that the actual observations are, in some cases, highly skewed. That is, the arithmetic average risk margins have been affected by large risk margins adopted by a handful of insurers. From the tables, the skewness of the observations is best seen in the relativities between the weighted and arithmetic standard deviations. A larger difference would generally imply greater skewness in the observations for that particular line of business.
Table 2 Premium Liabilities for Direct Business
Class of Business No. of Insurers
Weighted RM Average RM
Mean (%) Standard Deviation (%) Mean (%) Standard
Deviation (%)
Houseowners/Householders 35 8.8% 3.1% 12.5% 7.2%
Domestic motor vehicle 32 7.0% 3.7% 11.5% 8.4%
Commercial motor vehicle 26 9.1% 4.4% 14.4% 9.9%
Travel 13 6.8% 4.8% 12.6% 4.5%
Fire and ISR 37 13.0% 8.7% 18.8% 11.1%
Marine 36 12.3% 6.7% 17.9% 12.4%
Aviation 4 5.8% 2.0% 14.2% 11.9%
Mortgage 10 18.5% 8.3% 30.7% 17.2%
Consumer Credit 15 14.5% 12.4% 24.1% 18.6%
Other Accident 30 12.3% 5.3% 20.4% 23.5%
CTP motor vehicle 9 12.3% 3.0% 12.5% 4.2%
Public and product liability 39 12.6% 6.7% 18.0% 8.9%
Professional indemnity 27 17.0% 8.7% 23.4% 18.7%
Employers liability 15 11.7% 5.4% 17.4% 15.5%
Other 31 16.5% 8.2% 18.8% 11.5%
Australian Prudential Regulation Authority 9
In comparison, the premium liabilities risk margins for direct business tend to be higher than those adopted for outstanding claims liabilities. The differences between OCL and PL (for liabilities of the same size) are generally most pronounced in short tail personal and commercial lines and less pronounced in the longer tailed liability lines, with the exception of Workers’ Compensation and Public and Product liability. This exception appears to be due to asbestos exposures within these two portfolios.
Further analysis on the observed relativities between OCL and PL risk margins have shown that they are broadly in line with the Bateup and Reed (Tillinghast) and Collings and White (Trowbridge) reports, with the exception of the two classes mentioned above. This is to be expected as almost all insurers rely on these reports for scale up factors in determining PL risk margins. We have included further analysis on the ratio of OCL to PL risk margins in Appendix C.
While the general relativities of risk margins between lines of business are roughly maintained between PL and OCL, there are some notable exceptions. In particular, risk margins for lenders’ mortgage insurance are notably higher for premium liabilities and they have also increased significantly since the previous risk margin industry report. This appears to reflect the increased uncertainty regarding the impact of rising interest rates on future arrears rates and losses.
Comparing the standard deviations of the weighted risk margins, there appears to be greater dispersion in the PL risk margins relative to OCL risk margins. The PL risk margin observations however, tend to be much less skewed than the OCL risk margins. This appears to be due to several factors, one being the different cohort of insurers with outstanding claims and premium liabilities in a particular line of business. Part of this difference in cohorts will be due to runoff insurers who no longer underwrite any business. We have reproduced the same tables with these runoff insurers removed in Appendix B.

Australian Prudential Regulation Authority 10
Reinsurance business
Table 3 Outstanding Claims Liabilities for Reinsurance Business
Class of BusinessNo. of
Insurers
Weighted RM Average RM
Mean (%)Standard
Deviation (%)Mean (%)
Standard Deviation (%)
Casualty
Facultative excess of loss 13 15.7% 3.5% 18.1% 7.7%
Facultative proportional 11 10.9% 2.7% 15.0% 7.4%
Treaty excess of loss 25 16.2% 6.0% 34.5% 51.5%
Treaty proportional 24 12.2% 5.7% 21.5% 14.3%
Marine and aviation
Facultative excess of loss 7 18.4% 5.7% 19.3% 8.0%
Facultative proportional 7 10.6% 3.3% 15.5% 6.7%
Treaty excess of loss 13 17.4% 22.5% 36.6% 57.4%
Treaty proportional 18 14.0% 6.9% 15.5% 8.0%
Property
Facultative excess of loss 8 16.6% 16.1% 19.8% 14.9%
Facultative proportional 11 13.4% 6.0% 21.9% 20.2%
Treaty excess of loss 14 8.8% 6.5% 18.0% 9.8%
Treaty proportional 19 9.3% 16.1% 31.6% 58.1%
Reinsurance non-split 26 7.5% 4.1% 18.8% 13.9%
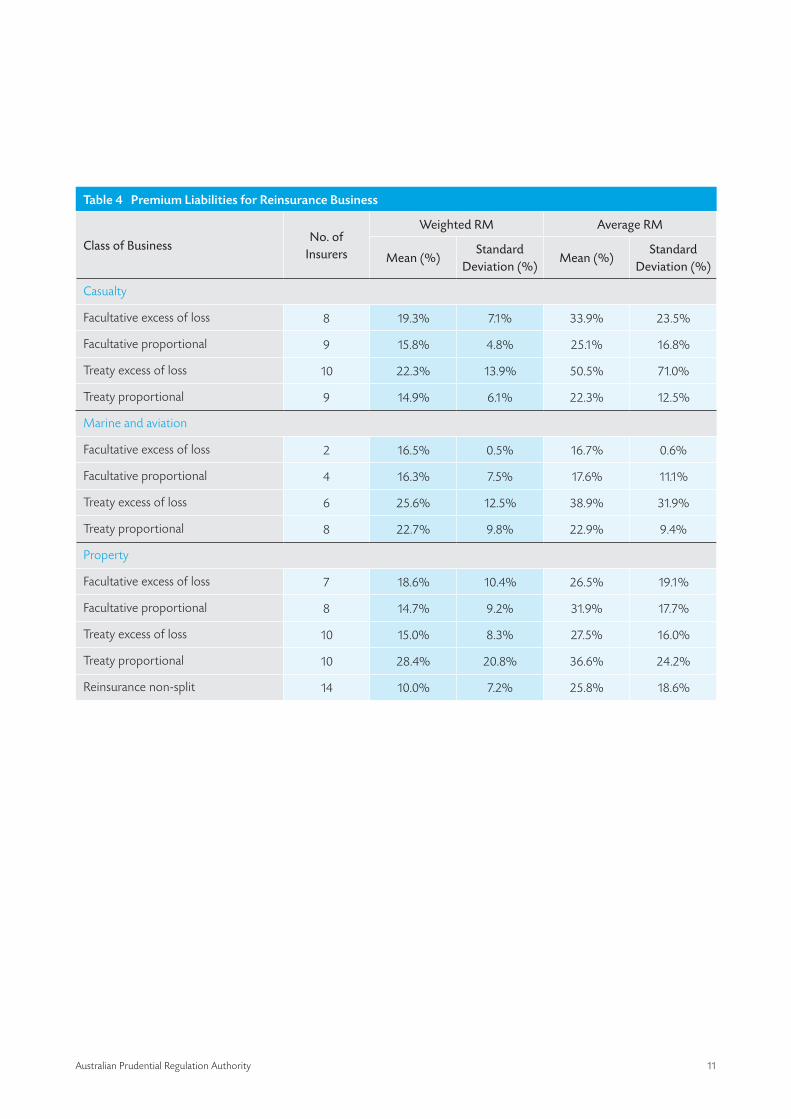
For proportional reinsurance business, adopted risk margins (while not mapping perfectly) tended to be in line with those adopted for direct business. Risk Margins for non-proportional reinsurance tended to be much higher than their direct counterparts, which is in line with general reasoning.
As expected, higher risk margins were adopted for excess of loss reinsurance than for proportional reinsurance. Risk margins adopted for premium liabilities were generally higher than those adopted for outstanding claims liabilities with some quite large differences particularly in the property classes. It is somewhat unclear as to why this may be the case.
Australian Prudential Regulation Authority 11
Table 4 Premium Liabilities for Reinsurance Business
Class of BusinessNo. of
Insurers
Weighted RM Average RM
Mean (%)Standard
Deviation (%)Mean (%)
Standard Deviation (%)
Casualty
Facultative excess of loss 8 19.3% 7.1% 33.9% 23.5%
Facultative proportional 9 15.8% 4.8% 25.1% 16.8%
Treaty excess of loss 10 22.3% 13.9% 50.5% 71.0%
Treaty proportional 9 14.9% 6.1% 22.3% 12.5%
Marine and aviation
Facultative excess of loss 2 16.5% 0.5% 16.7% 0.6%
Facultative proportional 4 16.3% 7.5% 17.6% 11.1%
Treaty excess of loss 6 25.6% 12.5% 38.9% 31.9%
Treaty proportional 8 22.7% 9.8% 22.9% 9.4%
Property
Facultative excess of loss 7 18.6% 10.4% 26.5% 19.1%
Facultative proportional 8 14.7% 9.2% 31.9% 17.7%
Treaty excess of loss 10 15.0% 8.3% 27.5% 16.0%
Treaty proportional 10 28.4% 20.8% 36.6% 24.2%
Reinsurance non-split 14 10.0% 7.2% 25.8% 18.6%

Australian Prudential Regulation Authority 12
The approach taken to estimating undiversified risk margins is driven primarily by the quality and volume of an insurer’s internal data. For most insurers, there remains a heavy reliance on the Bateup and Reed and Collings and White reports. However, from our review of ILVRs, many actuaries are also analysing internal data and seeking to adopt assumptions that better reflect the nature of the insurer’s own experience and portfolio and not merely applying industry benchmarks. This represents a pleasing development.
For medium to large insurers, analysis of internal data is used quite extensively for estimating risk margins for outstanding claims liabilities. From our sample, the most common methodology used was the Stochastic Chain Ladder method. Other common methods used included the Bootstrapping on paid and incurred triangles and the Mack method. In most cases, a number of approaches were used and the results compared by the actuary. The results were generally benchmarked against industry reports. There were also subjective loadings added to allow for sources of error not explicitly considered (e.g. model error and unmodelled sources of uncertainty).
Generally, the PL risk margins were derived using scaling factors on the OCL risk margin or Coefficient of Variation (CoV) as suggested by the two industry reports. A handful of companies estimated PL risk margins using internal analysis of loss ratios or from their DFA model (which would give the diversified risk margin directly).
Stand alone risk margins
Australian Prudential Regulation Authority 13
From our review of ILVRs, there appears to be a range of approaches taken in estimating diversification benefits. Even for the larger insurers, the approaches adopted are generally fairly subjective and the correlation assumptions are primarily driven by judgment and general reasoning. In determining diversification benefits, there appears to widespread reliance on the Bateup and Reed and Collings and White reports throughout the industry. The level of reliance on these reports was higher and more widespread than for the stand-alone risk margin analysis.
The general approach taken by actuaries is to apply a correlation matrix (showing correlations between lines of business) to the total coefficient of variation for each line of business. The lognormal distribution was generally used to estimate the diversified risk margin. In some cases, distinction was made between systematic and independent variability and different correlation matrixes were used for these two portions of the total CoV. Calculated diversification benefits tended to be allocated back to individual lines of business in proportion to the central estimate or in proportion to some measure of its contribution to the total variability of the portfolio.
Selected correlations between lines and between PL and OCL tended to be based on judgment and/or taken directly from either of the two industry reports. As additional input into their selection of correlation assumptions, some actuaries also used internal data to estimate correlations between classes. The techniques used were generally based upon rank correlations or Pearson residuals of loss ratios and changes in incurred estimates. While the results from these approaches were considered, the selected correlations tended to be higher (i.e. more conservative) than those implied by the analysis of internal data. A small number of insurers also stress tested their adopted correlation assumptions.
Diversification benefits
Excluding monoline insurers, the resulting diversification benefits from our sampled companies generally ranged around 10-50%. The arithmetic and weighted average of our sample of over 50 insurers (with monoline insurers removed) was 26% and 33% respectively. It should be noted however, that our sample generally consists of larger and more diversified entities than the broader industry average insurer.
Our regression analysis suggested that the adopted diversification benefits were generally reasonable and in line with our expectations. As was expected, larger insurers with many lines of business and low portfolio concentration tended to adopt higher diversification benefits. Of the three main factors tested, portfolio concentration appeared to have the strongest explanatory power.
As one would expect, the three factors of portfolio concentration, size and number of lines are all correlated. In particular, insurers with many lines of business tended to have much lower portfolio concentration than insurers with fewer lines of business. Due to the high correlation between factors, our final multiple linear regression model only included two explanatory factors corresponding to the portfolio concentration and size of the insurer.
There were however, notable exceptions to these broad general trends with some insurers with apparently diversified portfolios adopting no diversification benefits at all. There were also instances of insurers adopting benefits that appeared high relative to our industry sample. It should be noted however, that our analysis suffers from the same limitations as of any industry wide benchmarking. In particular, our fitted model could not allow for company specific factors or issues, nor could the measures or proxies used perfectly describe the underlying features of the portfolios.
Australian Prudential Regulation Authority 14
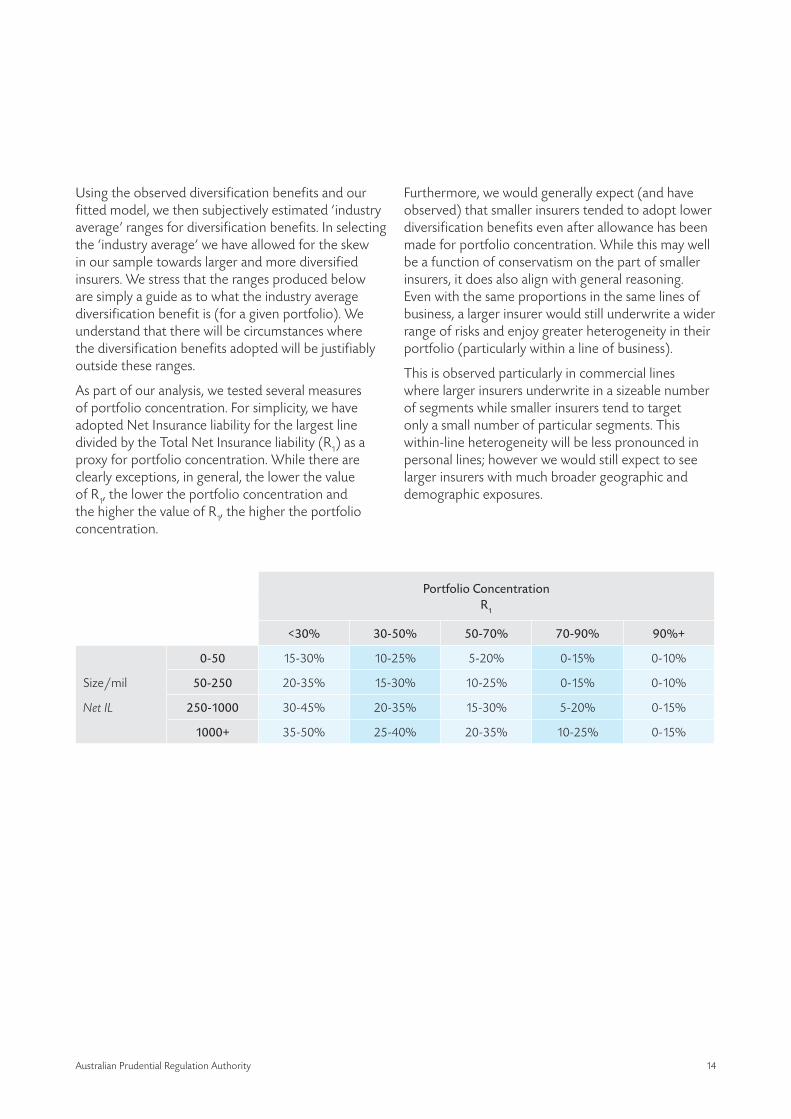
Using the observed diversification benefits and our fitted model, we then subjectively estimated ‘industry average’ ranges for diversification benefits. In selecting the ‘industry average’ we have allowed for the skew in our sample towards larger and more diversified insurers. We stress that the ranges produced below are simply a guide as to what the industry average diversification benefit is (for a given portfolio). We understand that there will be circumstances where the diversification benefits adopted will be justifiably outside these ranges.
As part of our analysis, we tested several measures of portfolio concentration. For simplicity, we have adopted Net Insurance liability for the largest line divided by the Total Net Insurance liability (R
1) as a
proxy for portfolio concentration. While there are clearly exceptions, in general, the lower the value of R
1, the lower the portfolio concentration and
the higher the value of R1, the higher the portfolio
concentration.
Portfolio ConcentrationR
1
<30% 30-50% 50-70% 70-90% 90%+
Size/mil
Net IL
0-50 15-30% 10-25% 5-20% 0-15% 0-10%
50-250 20-35% 15-30% 10-25% 0-15% 0-10%
250-1000 30-45% 20-35% 15-30% 5-20% 0-15%
1000+ 35-50% 25-40% 20-35% 10-25% 0-15%
Furthermore, we would generally expect (and have observed) that smaller insurers tended to adopt lower diversification benefits even after allowance has been made for portfolio concentration. While this may well be a function of conservatism on the part of smaller insurers, it does also align with general reasoning. Even with the same proportions in the same lines of business, a larger insurer would still underwrite a wider range of risks and enjoy greater heterogeneity in their portfolio (particularly within a line of business).
This is observed particularly in commercial lines where larger insurers underwrite in a sizeable number of segments while smaller insurers tend to target only a small number of particular segments. This within-line heterogeneity will be less pronounced in personal lines; however we would still expect to see larger insurers with much broader geographic and demographic exposures.

Australian Prudential Regulation Authority 15
Appendix A – Calculation methodologies
Key
• i=lineofbusinessi1, i
2, i
3…i
m.
• j=participatinginsurerj1, j
2, j
3,…, j
n
• RM=riskmargininabsolutedollaramounts
• %RM=riskmarginasapercentageofcentralestimate
• CE=centralestimateinabsolutedollaramounts
• %WARM=weightedaverageriskmargin
• %AARM=arithmeticaverageriskmargin
For a defined insurance/reinsurance class i:
1. Mean
Weighted average risk margin i=
Arithmetic average risk margin i=
2. Variances
Variance of weighted risk margin i=
Variance of average risk margin i=
RMij
n
j=1
CEij
n
j=1
n
n
j=1
RMij
CEij
n
j=1(%RM
ij – %WARM
i)2
(n–1)
n
1
n
j=1
n
j=1
(%RMij – %AARM
i)2
n–11
CEij
CEij

Australian Prudential Regulation Authority 16
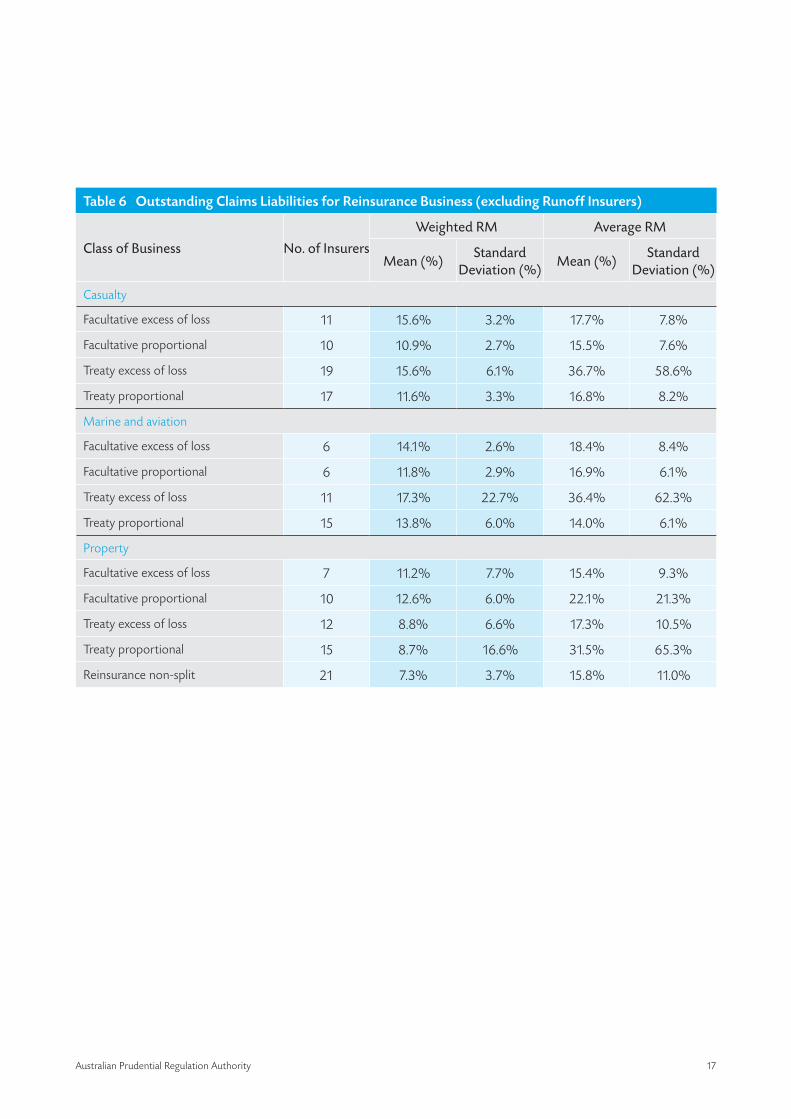
The following tables apply to insurers who are licensed to issue new policies. Run-off insurers are excluded from the overall averages to remove the distortion caused by their respective margins.
Table 5 Outstanding Claims Liabilities for Direct Business (excluding Runoff Insurers)
Class of Business No. of Insurers
Weighted RM Average RM
Mean (%) Standard Deviation (%) Mean (%) Standard
Deviation (%)
Houseowners/Householders 38 5.6% 2.0% 12.1% 15.8%
Domestic motor vehicle 35 5.6% 2.1% 9.2% 6.2%
Commercial motor vehicle 30 7.1% 3.1% 15.0% 19.2%
Travel 14 7.7% 1.9% 17.0% 24.4%
Fire and ISR 38 8.4% 3.1% 13.1% 9.3%
Marine 38 8.8% 4.1% 16.7% 16.8%
Aviation 9 5.8% 4.4% 13.6% 9.4%
Mortgage 10 9.5% 6.2% 30.9% 26.6%
Consumer Credit 16 8.2% 5.9% 15.4% 15.2%
Other Accident 33 8.3% 3.3% 14.9% 16.9%
CTP motor vehicle 12 9.3% 2.0% 10.4% 3.0%
Public and product liability 41 11.1% 5.9% 17.6% 18.8%
Professional indemnity 30 12.5% 4.7% 16.6% 20.3%
Employers liability 20 12.2% 2.9% 14.3% 7.6%
Other 36 11.8% 3.7% 14.4% 9.6%
Appendix B – Risk margins excluding runoff insurers
Australian Prudential Regulation Authority 17
Table 6 Outstanding Claims Liabilities for Reinsurance Business (excluding Runoff Insurers)
Class of Business No. of Insurers
Weighted RM Average RM
Mean (%)Standard
Deviation (%)Mean (%)
Standard Deviation (%)
Casualty
Facultative excess of loss 11 15.6% 3.2% 17.7% 7.8%
Facultative proportional 10 10.9% 2.7% 15.5% 7.6%
Treaty excess of loss 19 15.6% 6.1% 36.7% 58.6%
Treaty proportional 17 11.6% 3.3% 16.8% 8.2%
Marine and aviation
Facultative excess of loss 6 14.1% 2.6% 18.4% 8.4%
Facultative proportional 6 11.8% 2.9% 16.9% 6.1%
Treaty excess of loss 11 17.3% 22.7% 36.4% 62.3%
Treaty proportional 15 13.8% 6.0% 14.0% 6.1%
Property
Facultative excess of loss 7 11.2% 7.7% 15.4% 9.3%
Facultative proportional 10 12.6% 6.0% 22.1% 21.3%
Treaty excess of loss 12 8.8% 6.6% 17.3% 10.5%
Treaty proportional 15 8.7% 16.6% 31.5% 65.3%
Reinsurance non-split 21 7.3% 3.7% 15.8% 11.0%
Australian Prudential Regulation Authority 18
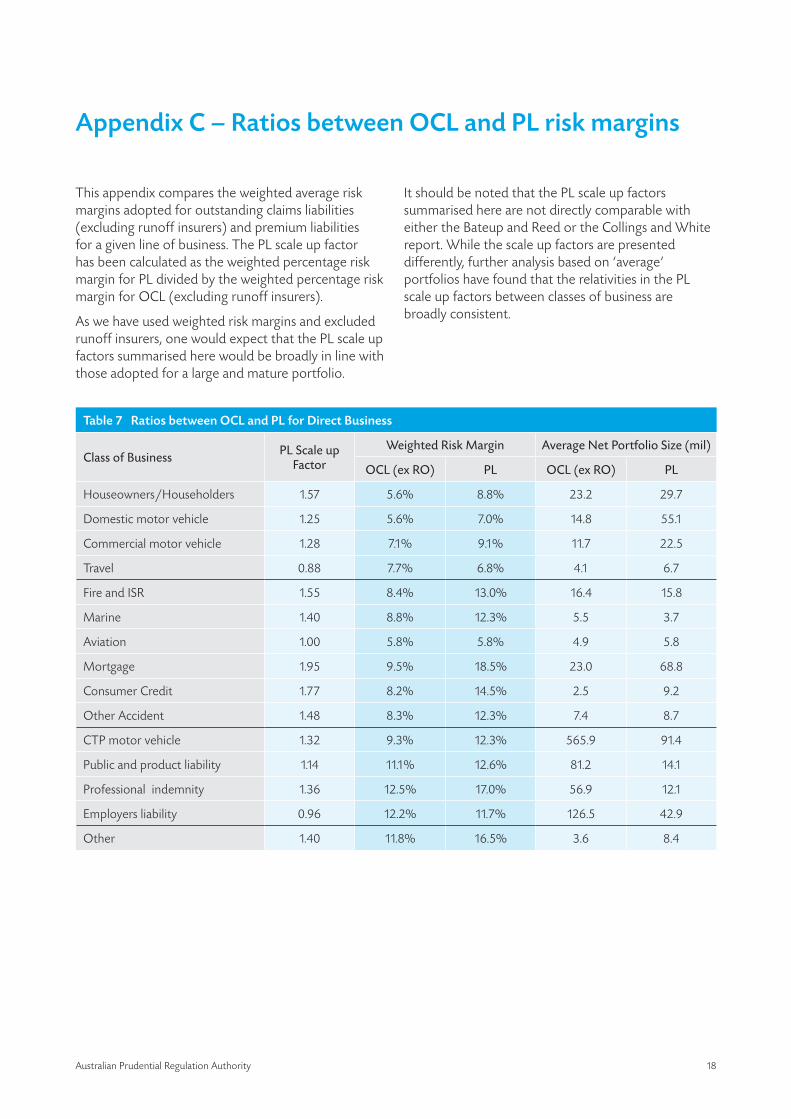
This appendix compares the weighted average risk margins adopted for outstanding claims liabilities (excluding runoff insurers) and premium liabilities for a given line of business. The PL scale up factor has been calculated as the weighted percentage risk margin for PL divided by the weighted percentage risk margin for OCL (excluding runoff insurers).
As we have used weighted risk margins and excluded runoff insurers, one would expect that the PL scale up factors summarised here would be broadly in line with those adopted for a large and mature portfolio.
Appendix C – Ratios between OCL and PL risk margins
It should be noted that the PL scale up factors summarised here are not directly comparable with either the Bateup and Reed or the Collings and White report. While the scale up factors are presented differently, further analysis based on ‘average’ portfolios have found that the relativities in the PL scale up factors between classes of business are broadly consistent.
Table 7 Ratios between OCL and PL for Direct Business
Class of Business PL Scale up Factor
Weighted Risk Margin Average Net Portfolio Size (mil)
OCL (ex RO) PL OCL (ex RO) PL
Houseowners/Householders 1.57 5.6% 8.8% 23.2 29.7
Domestic motor vehicle 1.25 5.6% 7.0% 14.8 55.1
Commercial motor vehicle 1.28 7.1% 9.1% 11.7 22.5
Travel 0.88 7.7% 6.8% 4.1 6.7
Fire and ISR 1.55 8.4% 13.0% 16.4 15.8
Marine 1.40 8.8% 12.3% 5.5 3.7
Aviation 1.00 5.8% 5.8% 4.9 5.8
Mortgage 1.95 9.5% 18.5% 23.0 68.8
Consumer Credit 1.77 8.2% 14.5% 2.5 9.2
Other Accident 1.48 8.3% 12.3% 7.4 8.7
CTP motor vehicle 1.32 9.3% 12.3% 565.9 91.4
Public and product liability 1.14 11.1% 12.6% 81.2 14.1
Professional indemnity 1.36 12.5% 17.0% 56.9 12.1
Employers liability 0.96 12.2% 11.7% 126.5 42.9
Other 1.40 11.8% 16.5% 3.6 8.4
Australian Prudential Regulation Authority 19
Arithmetic average risk margin—provides an arithmetic average of the risk margin percentages adopted by the participating insurers.
Central estimate (CE) band—defines the cut-off rule segmenting each class of business for each insurer. Separating a single class to different bands enables useful comparisons of central estimates levels among smaller or larger insurers. Where no bands are specified the figures reflect the total for the class of business.
Commercial motor vehicle—a type of insurance policy covering motor vehicle insurance (including third party property damage) other than insurance of vehicles defined under domestic motor vehicle below. It includes long and medium haul trucks, cranes and special vehicles and policies covering fleets.
Consumer credit—insurance to protect a consumer’s ability to meet the loan repayments on personal loans and credit card finance in the event of death or loss or income due to injury, illness or unemployment.
CTP motor vehicle—all insurance policies providing compulsory third party motor vehicle (CTP) insurance.
Domestic motor vehicle—a type of insurance policy covering motor vehicle insurance (including third-party property damage) covering private-use motor vehicles including utilities and lorries, motor cycles, private caravans, box and boat trailers and other vehicles not normally covered by business or commercial policies.
Employer’s liability—a type of insurance policy which includes workers’ compensation, seamen’s compensation and domestic workers compensation.
Facultative excess of loss—individual, non-treaty arrangements where the reinsurer agrees to pay the part of a reinsured’s loss that exceeds an agreed deductible.
Facultative proportional—individual, non-treaty arrangements where the reinsurer shares an identical proportion of the losses of the reinsured.
Glossary of terms
Fire and ISR—includes all insurance policies normally classified as ‘fire’ and includes: sprinkler leakage, subsidence, windstorm, hailstone, crop, arson, loss of profits and any extraneous risk normally covered under fire policies e.g. flood. Industrial special risks (ISR) policies are policies which contain a particular standard policy wording or where the wording is substantially similar to that standard wording.
Householders/houseowners—covers the common domestic policies inclusive of contents, personal property, arson, burglary and public liability normally attached to such policies.
Lines of business—the types of insurance products available
‘Long tail’ business—business written by a general insurer where there is a significant delay between the event giving rise to the claim and the notification of the claim to the insurer.
Marine and aviation—include marine hull (including pleasure craft), marine cargo (including sea and inland transit insurance) and aviation (including aircraft hull and aircraft liability) insurance policies.
Mortgage—covers insurance against losses arising from the failure of debtors to meet financial obligations to creditors.
Other—includes all insurance business not specifically mentioned elsewhere. It includes, for example: trade credit: extended warranty (includes insurance by a third party for a period in excess of the manufacturer’s or seller’s normal warranty); legal expense; kidnap and ransom; and contingency.
Other accident— includes the following types of insurance: miscellaneous accident (involving cash in transit, theft, loss of money); all risks (baggage, sporting equipment, guns); engineering (when not part of ISR or fire policy); plate glass; guarantee (insurance bonds); live stock; pluvius; construction: fidelity guarantee; and sickness and accident.
Professional indemnity—covers the liability of professional persons to clients through negligence etc. Includes directors’ and officers’ liability insurance.
Australian Prudential Regulation Authority 20
Public and product liability—covers legal liability to the public in respect of bodily injury or property damage arising out of the operation of the insured’s business. Product liability includes policies that provide compensation for loss or injury caused by, or as a result of, the use of goods. This also include environmental clean-up of pollution spills where not covered by fire and ISR policies.
Risk margin—the component of the value of the insurance liabilities relating to the inherent uncertainty in the central estimate (the mean of the distribution of probable outcomes).
‘Short tail’ business — business written by a general insurer where there is no significant delay between the event giving rise to the claim and the notification of the claim to the insurer.
Travel—covers insurance against losses associated with travel including loss of baggage and personal effects, losses on flight cancellations and overseas medical costs.
Treaty excess of loss—reinsurance arrangements written under a treaty where the reinsurer shares an identical proportion of the losses of the reinsured.
Treaty proportional—reinsurance arrangements written under a treaty where the reinsurer shares an identical proportion of the losses of the reinsured.
Weighted average risk margin—measures the average risk margins per dollar of aggregate central estimates for each class of business. Insurers with relatively larger central estimate provisions will have a greater influence over the average figures.

Telephone 1300 13 10 60
Email [email protected]
Web site www.apra.gov.au
Mail GPO Box 9836 in all capital cities (except Hobart and Darwin) RP
_GI_
RMIR
_09_
ex