Risk Management for Hedge Funds - OptiRisk Systems - carisma.1...Risk Management for Hedge Funds M A...
67
1 © 2008 Cambridge Systems Associates Limited www.cambridge-systems.com 4 4 th th Annual CARISMA Conference Annual CARISMA Conference London 1 London 1 st st July 2008 July 2008 Risk Management for Hedge Funds Risk Management for Hedge Funds M A H Dempster Centre for Financial Research Statistical Laboratory University of Cambridge & Cambridge Systems Associates Limited [email protected] www-cfr.jbs.cam.ac.uk
Transcript of Risk Management for Hedge Funds - OptiRisk Systems - carisma.1...Risk Management for Hedge Funds M A...

1
© 2008 Cambridge Systems Associates Limitedwww.cambridge-systems.com
44thth Annual CARISMA Conference Annual CARISMA Conference London 1London 1stst July 2008July 2008
Risk Management for Hedge FundsRisk Management for Hedge Funds
M A H Dempster
Centre for Financial ResearchStatistical Laboratory
University of Cambridge&
Cambridge Systems Associates Limited
[email protected] www-cfr.jbs.cam.ac.uk
2
© 2008 Cambridge Systems Associates Limitedwww.cambridge-systems.com
OutlineOutline
• Introduction
• Portfolio Performance and Risk Measures
• Robust Portfolio Optimization
• Long Short Equity Strategies for Alpha
• Credit Trading Strategies for Absolute Return
• Conclusions

3
© 2008 Cambridge Systems Associates Limitedwww.cambridge-systems.com
MarkowitzMarkowitz Portfolio ConstructionPortfolio ConstructionClassical mean variance portfolio optimization (MVO) assumes r is distributed multivariate Gaussian (normal) with mean μand n x n covariance matrix Σ to maximize a tradeoff between expected return and portfolio return volatility subject to constraints Markowitz (1952)
( , )N μ Σ
'x xΣ
max . .
x x xs t Ax b
μ λ′ ′− Σ= Ex
pect
ed R
etur
n
Volatility

4
© 2008 Cambridge Systems Associates Limitedwww.cambridge-systems.com
Departures From Classical Distributional Departures From Classical Distributional AssumptionsAssumptions
In practice when Σ is estimated as from historical returns series on individual instruments/strategies the estimate is generally not positive definite and must be ‘corrected’
Moreover extensive modern research on various classes of instruments has shown that approximate normality depends upon• the instrument class• the period over which returns – assumed independent – are
defined (predicted)
Σ̂

5
© 2008 Cambridge Systems Associates Limitedwww.cambridge-systems.com
As a result many alternative distributions for returns have been applied to portfolio construction for stocks, bonds, FX, futures, etc.
Four characteristics are at issue
• Higher moments than the two – mean and variance – which define all moments of the Gaussian distribution
• Tail behaviour
• More general dependency between contemporaneous returns than correlation
• Intertemporal dependencies between returns
μ 2σ

6
© 2008 Cambridge Systems Associates Limitedwww.cambridge-systems.com
Hedge Fund Annual Returns in 2005Hedge Fund Annual Returns in 2005
Source: P. Davis, Hedge funds lose big returns appeal, Financial Times Fund Management, May 1 2006

7
© 2008 Cambridge Systems Associates Limitedwww.cambridge-systems.com
Credit Loss DistributionCredit Loss Distribution
-20
-50
-80
-110
-140
-170
-200
-230
-260
-290
-320
-350
-380
-410
-440
-470
Portfolio Loss ($m)
Catastrophe Loss
Unxexpected Loss
Expected Loss

8
© 2008 Cambridge Systems Associates Limitedwww.cambridge-systems.com
Specification of NonSpecification of Non--NormalityNormalityFor skewed return distributions with non-normally shaped densities at least two more moments are considered
• Skew is the third moment which measures a long –downside – tail and is usually measured relative to as an index ofskewness
• Kurtosis is the fourth moment which gives the shape of the shoulders of the density – usually relative to as an index ofkurtosis or relative to that of the standard normal density whose value is 3
When return density tails are ‘fat’ or ‘long and thin’ no moments may existwhich leads to the use of α-stable or extreme value distributions where density tails decay polynomially for extreme values rather than exponentially as with Gaussian or Student t distributions
3( )i iΕ − Εr r
4( )i iΕ − Εr r
3σ
4σ

9
© 2008 Cambridge Systems Associates Limitedwww.cambridge-systems.com
Portfolio Performance and Risk MeasuresPortfolio Performance and Risk Measures

10
© 2008 Cambridge Systems Associates Limitedwww.cambridge-systems.com
Sharpe RatioSharpe RatioHow do we find the optimal portfolio P ?
P maximises the reward-to-variability ratio
Sharpe Ratio:
A good active manager• maximises the Sharpe Ratio• maximises the slope of his Capital Allocation Line (CAL)• has a steeper CAL than a passive investor who has CML
( )P f PS R σ= ⎡ − ⎤⎣ ⎦rE

11
© 2008 Cambridge Systems Associates Limitedwww.cambridge-systems.com
Portfolio Performance MeasuresPortfolio Performance Measures
Under classical independent returns assumptions portfolio performance over a specified horizon is measured in terms of one or more of portfolio• Return• Sharpe ratio
• Excess return over a suitable ‘risk free’ rate normalised by return volatility
• Sortino ratio• Excess return normalised by downside volatility – the square root of semi-variance
• Information ratio• Excess return relative to a suitable benchmark – usually a market index – normalized
by excess return volatility or tracking error
• Maximum drawdown• Stirling ratio
• Return (or excess return) normalized by maximum drawndown

12
© 2008 Cambridge Systems Associates Limitedwww.cambridge-systems.com
Tail Risk MeasuresTail Risk Measures
Appropriate to such skewed distributions are tail measures of risk (dispersion) such as
• Value at risk (VaR)
• Expected (VaR) shortfall or tail loss
• Regret or expected loss relative to a benchmark (e.g. 0)
α≤ − ={ }iP VaRr
−Ε +( )i VaRr
( )i+Ε r

13
© 2008 Cambridge Systems Associates Limitedwww.cambridge-systems.com
Value at RiskValue at RiskMeasures maximum unexpected loss
• For a given holding period
• For a given confidence level
• Chosen by the portfolio manager
Prob
abili
ty
90%99%
Market Value-v
P{XT < -v} = z
VaR is the quantity v

14
© 2008 Cambridge Systems Associates Limitedwww.cambridge-systems.com
Tail Risk MeasuresTail Risk Measures
Expected shortfall(expected tail loss, conditional VaR)• The average loss conditional on the
losses being greater than VaR
Regret• Expected value of all returns less
than a benchmark return (e.g. 0)
Expected shortfall

15
© 2008 Cambridge Systems Associates Limitedwww.cambridge-systems.com
Expected ShortfallExpected Shortfall
Expected Shortfall (at 99%) is the average of the worst 1% of losses

16
© 2008 Cambridge Systems Associates Limitedwww.cambridge-systems.com
Contemporaneous Return DependencyContemporaneous Return Dependency
Classical return dependency and volatility is given in terms of a correlation matrix
But extreme returns between two instruments tend to be more correlated than returns under normal market conditions – that is tail dependencies of their marginal densities exist which cannot be captured by spherical distributions such as the Gaussian or t distributions
ρ ρ σ σ= Σ =( ) defined by : ( )ij ij i jR

17
© 2008 Cambridge Systems Associates Limitedwww.cambridge-systems.com
CopulasCopulas
Sklar (1959) observed that a general multivariate distribution function F for r can be written in terms of its marginal distribution functions Fi as
where the copula distribution function C with uniform marginalson [0,1] is a pure measure of dependency between the elements ofr
Many alternative copulas have been proposed for different instrument returns
1 1 11( ) : ( ( ), ..., ( ))n
nF r C F r F r− −=

18
© 2008 Cambridge Systems Associates Limitedwww.cambridge-systems.com
IntertemporalIntertemporal DependencyDependency
Intertemporal return dependency must be specified by postulating a stochastic process for returns – in either continuous or discrete time – which exhibits the appropriate path dependent behaviour
Proposed specifications range from volatility clustering in the classical model (e.g. using Garch models) through diffusions, pure jump Levy processes and fractional Brownian motion in continuous time to long range autocorrelated and fractal and multi-fractalprocesses with rapidly increasing complexity of estimation and simulation

19
© 2008 Cambridge Systems Associates Limitedwww.cambridge-systems.com
Stationary Stationary ErgodicErgodic ReturnsReturns
One general specification that encompasses many other specific generalizations is a stationary ergodic specification for the process rwhich means that the joint distribution of returns at a set of times depends only on their relative time intervals so that and the time average along any sample path converges to μ
Another relevant extreme return measure is drawdown defined in terms of a return process path ri at t as
μΕ =tr
0sup { }i it tr rτ τ≤ ≤ −

20
© 2008 Cambridge Systems Associates Limitedwww.cambridge-systems.com
Portfolio Value and DrawdownPortfolio Value and Drawdown
Source: Krokmal et al. (2003)

21
© 2008 Cambridge Systems Associates Limitedwww.cambridge-systems.com
Stirling RatioStirling RatioProfit divided by maximum drawdown over a specified period
Used by traders and hedge fund investors to assess performance of systematic trading funds
Defined in the Pertrac User Manual www.pertrac.com but a trader will be indifferent between strategies that have a drawdown of less than a particular amount
This indifference is reflected in the modified Stirling ratio given by
where modified drawdown := max(drawdown, 2%)and return and drawdown are measured as a percentage of (notional) traded assets
When returns are negative the return alone is used
Provides a continuous sensible ordering for all return/drawdown combinations
returnS : = 1 + modified drawdown

22
© 2008 Cambridge Systems Associates Limitedwww.cambridge-systems.com
Coherent Risk MeasuresCoherent Risk MeasuresIn almost all portfolio construction expected portfolio return is balanced against asuitable risk measure
A financial position (portfolio) is described by a real valued mapping X from a set Ω of scenarios ω to money which we may take to be the random portfolio return(value)
A coherent monetary risk measure ρ satisfies the conditions Artzner et al. (1997)
• Positive homogeneity (position size invariance)
• Monotonicity(more is better)
• Translation invariance (additional capital reduces risk)
• Subadditivity(diversification benefit)
: ' x=X r
ρ λ λρ λ ρ= ∀ ≥ ⇒ =( ) ( ) 0 (0) 0X X
(a.s.) ( ) ( )ρ ρ≤ ⇒ ≥X Y X Y
ρ ρ ρ ρ= − ⇒ + =( ) ( ) ( ( )) 0+ m m X X X X
( ) ( ) ( ) convex+ρ ρ ρ ρ≤ + ⇒X Y X Y

23
© 2008 Cambridge Systems Associates Limitedwww.cambridge-systems.com
Convex Risk MeasuresConvex Risk Measures
Given a family of of probability distributions P on Ω we may represent a CRM as
By positive homogeneity and subadditivity a coherent risk measure is easily seen to be convex i.e.
When risk increases with position size convex risk measures not positively homogeneous are appropriate Foellmer &Schied (2003)
ρ ∈ℑ= Ε −( ) sup [ ]F P PX X
ℑ
[ ]( (1 ) ) ( ) (1 ) ( ) 0,1ρ λ λ λρ λ ρ λ+ − ≤ + − ∀ ∈……X Y X Y

24
© 2008 Cambridge Systems Associates Limitedwww.cambridge-systems.com
CRMsCRMs and Convex Risk Surfacesand Convex Risk SurfacesThe hedging benefit H is nonnegative for a CRM Acerbi (2003)
Moreover the risk surface corresponding to portfolios given by as x varies is convex for a CRM which implies that minimal risk portfolios can be found by convex optimization
However VaR is not a coherent (or convex) risk measure since it failsthe axiom of subadditivity
Indeed examples of portfolios of Gaussian returns dependent through a non-Gaussion copula can be constructed for which the hedging benefit for VaR is negative
( , ) : ( ) ( ) ( )Hρ ρ ρ ρ= + − +X Y X Y X Y
( ' )xρ r
ρ

25
© 2008 Cambridge Systems Associates Limitedwww.cambridge-systems.com
Expected Shortfall is CoherentExpected Shortfall is Coherent
Expected shortfall (tail loss) relative to VaR for an absolutely continuous distribution is coherent and hence yields a convex risksurface although this is not necessarily so for a finite distribution of scenarios (data paths) without a more precise definition

26
© 2008 Cambridge Systems Associates Limitedwww.cambridge-systems.com
1D Risk Surface for 1D Risk Surface for VaRVaR and ESand ES
Source: Acerbi (2003)

27
© 2008 Cambridge Systems Associates Limitedwww.cambridge-systems.com
Risk Surfaces for a 25 Bond PortfolioRisk Surfaces for a 25 Bond Portfolio
Source: Acerbi (2003)
%Quantile

28
© 2008 Cambridge Systems Associates Limitedwww.cambridge-systems.com
Spectral Risk MeasuresSpectral Risk Measures
A risk measure ρ is law invariant if i.e. it depends only on the CDF and hence is estimatable from data
Two portfolios X and Y are comonotonic if they are driven by the same risk factor Z so that for some non-decreasing functions f and g
A risk measure is comonotonically additive if X and Y comonotonic implies it is additive
( ) ( )Fρ ρ= XXo f F X X
= =: ( ) and : ( )f gX Z Y Z
ρ

29
© 2008 Cambridge Systems Associates Limitedwww.cambridge-systems.com
Spectral Risk MeasuresSpectral Risk Measures
A coherent risk measure which is both law invariant and comonotonically additive is called a spectral measure with representation
Alternatively this class of risk measures is given by
Acerbi(2001)
μρ μ μ= Ε∫1
0
( ) ( ) ( ) for a measure on [0,1] pS d p Kusuoka (2001)X X
φρ φ φ= ∫1
0
( ) ( ) (p) dp where is a on [0,1] p F non - increasing probability density-1XX

30
© 2008 Cambridge Systems Associates Limitedwww.cambridge-systems.com
Expected Shortfall and Expected Shortfall and VaRVaR SpectraSpectra
Source: Acerbi (2007)

31
© 2008 Cambridge Systems Associates Limitedwww.cambridge-systems.com
Robust Portfolio EstimationRobust Portfolio Estimation

32
© 2008 Cambridge Systems Associates Limitedwww.cambridge-systems.com
MVO Sensitivity to Input VariationsMVO Sensitivity to Input Variations

33
© 2008 Cambridge Systems Associates Limitedwww.cambridge-systems.com
Portfolio RiskPortfolio RiskFor an n asset portfolio the standard deviation or volatility of the portfolio return
where are the standard deviations of the returns of assets Ai and is the covariance between assets i and j
Estimate portfolio standard deviation using
2 2
1 12
n n
P i i i j i ji i j i
w w wσ σ σ= = <
= +∑ ∑ ∑
iσ
ijσ
2 2
1 1
ˆ ˆ ˆ2n n
P i i i j iji i i j
w w wσ σ σ= = <
= +∑ ∑∑

34
© 2008 Cambridge Systems Associates Limitedwww.cambridge-systems.com
Forecasting Forecasting CovariancesCovariancesRecall the definition of a covariance matrix Σ of a random vectorx as
where σi is the standard deviation (volatility) of the ith element xiand ρij is the correlation between xi and xj
Recall also that the random variable has variance
This implies Σ is nonnegative definite
( )( ) ( ): : i j ijσ σ ρ′Σ = − − =x x x xE E E
1: I
i iiα α
=′ = ∑x x
0α α′Σ ≥

35
© 2008 Cambridge Systems Associates Limitedwww.cambridge-systems.com
Choice of Financial InstrumentsChoice of Financial Instruments
A covariance matrix Σ is positive definite iffwhich occurs when no two elements of x are
perfectly -- positively or negatively -- correlated
This property cannot be guaranteed in sample estimates-- so the number of instruments (or factors) to use is an important decision problem!
0α αΣ >′ for 0α ≠

36
© 2008 Cambridge Systems Associates Limitedwww.cambridge-systems.com
MVO RobustnessMVO RobustnessThe stability of mean variance portfolios with respect to small changes in the problem parameters– expected returns and return covariances – is notoriously bad
In practice this is compounded by estimation error using historical data for expected returns, return covariances for instruments and regression coefficients of factor models
The most important contributor to instability are historical estimates of covariance matrices with low condition numbers – the ratio of the smallest to the largest eigenvalue – often zero for many instruments and (relatively) short time series

37
© 2008 Cambridge Systems Associates Limitedwww.cambridge-systems.com
Correcting Estimation ErrorCorrecting Estimation ErrorFor uncorrelated returns the condition number of the estimated covariance matrix will be near one and the contours of portfolio variance will be near spherical and portfolios stable – unfortunately not usual
Three principal approaches to overcome this practical problem are available• Shrinkage techniques which move the historical covariance estimate toward a
well-behaved covariance matrix
• Bayesian approaches which combine the investor’s prior views with sample estimates using Bayes theorem
• Randomization techniques using bootstrap historical resampling or simulation

38
© 2008 Cambridge Systems Associates Limitedwww.cambridge-systems.com
BayesBayes--Stein Expected Return Shrinkage Stein Expected Return Shrinkage
Techniques for shrinkage estimation are based on a fundamental result of Stein (1955) for expected value – e.g. expected return –which shows that with low sample sizes an optimal trade-off between estimator bias and estimator variation produces a more efficient estimate than the standard unbiased sample mean estimate
For sample expected returns this yields the Bayes-Stein shrinkage estimator for ( , )N μ Σ∼r
λ λμ α μ α αμ μ
λ λ σ−
−= − + =
′− −
Σ = ∑
1
21 1
ˆ1 2ˆ ˆ: (1 ) 1 : ˆ ˆ( 1) ( 1)
1ˆ ˆ ˆwhere is the of and : and 1 is called the
S
nii
NT
nlargest eigenvalue
target vector

39
© 2008 Cambridge Systems Associates Limitedwww.cambridge-systems.com
LedoitLedoit--Wolf Covariance ShrinkageWolf Covariance Shrinkage
A similar shrinkage estimator has been applied by Ledoit & Wolf (2004) to the sample covariance matrix using the well-conditioned target matrix
A full Bayesian approach to expected return estimation mixes the investor’s prior views in the form of a density with the sampling distribution assumed to underly returns to obtain a posterior densityfor returns
The mode of the posterior density for r is the Bayes-Stein shrinkageestimator when the target is the prior expected return vector
λ
α α α =
=
′ − ΣΣ = − Σ + =
Σ −∑ 2
1
ˆ : to o b ta inˆ[( ) ]1ˆ ˆ ˆ: (1 ) : m in { , 1}ˆ ˆ[( ) ]
n
Tt tS t
C I
tr r rC
T tr C
μ̂ S π

40
© 2008 Cambridge Systems Associates Limitedwww.cambridge-systems.com
BlackBlack--LittermanLitterman Equilibrium ModelsEquilibrium Models
Black & Litterman (1992) saw that unreasonable portfolios produced by MVO result from inconsistent risk and return forecasts
Their equilibrium expected (excess) returns correspond to the market portfolio for MVO with a given (excess) return covariance matrix – risk model – produced by solving
Expected (excess) returns R are assumed uncertain with mean π and covariance matrix τΣ for τ a suitable shrinkage factor
λπ π λ
λ
′ ′− Σ = Σmax as 2
where is the producing the
MM M M M M
M M
x x x x
x penalty parameter market portfolio
πMx

41
© 2008 Cambridge Systems Associates Limitedwww.cambridge-systems.com
BlackBlack--LittermanLitterman PortfoliosPortfoliosInvestor’s views have the effect of modifying expected returns Raccording to the uncertainty with which they are held in terms of
−τ expresses a level of confidence in the equilibrium expected returns π- P is a k x n matrix of investor view (long-short) portfolio weights
- g is the corresponding k vector of view portfolio expected returns with var(ε)=Ω
The Bayes solution for expected excess returns is
P g= +R ε
α τ τ πλ λ
− − − − −′ ′= Σ + Ω Σ + Ω′= +
1 1 1 1 1[( ) ] [( ) ] with where is a vector of different
BL
BL M
P P P gx x P kportfolio weights
weights on portfolio views

42
© 2008 Cambridge Systems Associates Limitedwww.cambridge-systems.com
Recent BlackRecent Black--LittermanLitterman ExtensionsExtensions
The Black-Litterman model is extended by Jones et al. (2007) to factor based structured equity portfolios
The basic model is extended in another direction by Giacometti et al. (2007) to consider other return distributions such as student t and alpha stable distributions and other risk measures such as VaRand expected tail risk

43
© 2008 Cambridge Systems Associates Limitedwww.cambridge-systems.com
Michaud Michaud ResamplingResamplingThe first to attempt to control the sampling error effects of covariance and expected return historical estimates on MVO by randomization was by Michaud (1998)
His procedure involves the following steps• Estimate from available historical data• Assuming and resample a large number of
scenarios from this distribution• Compute the efficient frontier corresponding to the estimates
and average to yield the resampled efficient frontier and corresponding MVO portfolios
This procedure has been generalized for other markets and risk measures by Meucci (2005) and Algren & Chriss (2003) have given an alternative randomization in terms of a uniform distribution of returns consistent with a specified ranking of expected returns
ˆˆ and μ Σμ μ μΣ = Σ Σ∼ ˆˆ( , ) set : and :=Nr
ω ∈Ω
ˆˆ( ) and ( ) for all μ ω ω ωΣ ∈Ω

44
© 2008 Cambridge Systems Associates Limitedwww.cambridge-systems.com
Efficiency of Michaud Efficiency of Michaud ResamplingResampling
The performance of Ledoit-Wolf shrinkage and resamplingrandomization was compared by Wolf (2006) who found the former superior to the latter and not significantly different from their combination
Moreover Scherer (2006) pointed out that without short selling restrictions the resampled frontier and the original correspond
Scherer also pointed out that Markowitz&Usman’s empirical finding that resampling is superior to a Bayesian model is ill-posed

45
© 2008 Cambridge Systems Associates Limitedwww.cambridge-systems.com
Scenarios as Randomization TechniquesScenarios as Randomization Techniques
Unlike MVO based on Gaussian return distributions scenario based techniques can allow any multivariate return distributions using scenarios that can be simulated, resampled from historical data or generated by quasi-random sequences
Often such return simulations will involve sampling marginal(individual instrument) returns combined through a specified copula
In general the scenario approach is a natural and intuitive form of randomization which makes the resulting portfolio decisions robustagainst a wide range of realized returns

46
© 2008 Cambridge Systems Associates Limitedwww.cambridge-systems.com
Robust OptimizationRobust Optimization
Following Ben-Tal & Nemirovski (1995, 2001) the robust MVO approach attempts to determine conservative worst-case parameter portfolios directly in terms of the problem
Meucci (2005) and Ceria & Stubbs (2006) give recent results
Pachamanova (2006) describes (limited) market tests which show good performance relative to ordinary MVO
μμ θ θ
μ
λμ
θ θ
Σ∈ Σ∈
Σ
′ ′− Σ
∈
min max2
. . where and are specified for parameter estimates
x x x
s t x Cuncertainty sets
Rx λ

47
© 2008 Cambridge Systems Associates Limitedwww.cambridge-systems.com
Long Short Equity Strategies for AlphaLong Short Equity Strategies for Alpha

48
© 2008 Cambridge Systems Associates Limitedwww.cambridge-systems.com
LongLong--Short Equity PortfoliosShort Equity PortfoliosThe simplest approach to the construction of long-short equity portfolios is to drop the non-negativity condition on portfolio weights in MVO
However the aim of a long-short equity hedging strategy is to have portfolio excess returns uncorrelated with the market (index) in order to generate alpha – or absolute return – in all market conditions
To this end an additional market-neutral constraint in terms of the CAPM is imposed on MVO where estimates of the betas are used in the actual constraint
1ˆ ˆ: 0n
p i iixβ β
== =∑
0x ≥
49
© 2008 Cambridge Systems Associates Limitedwww.cambridge-systems.com
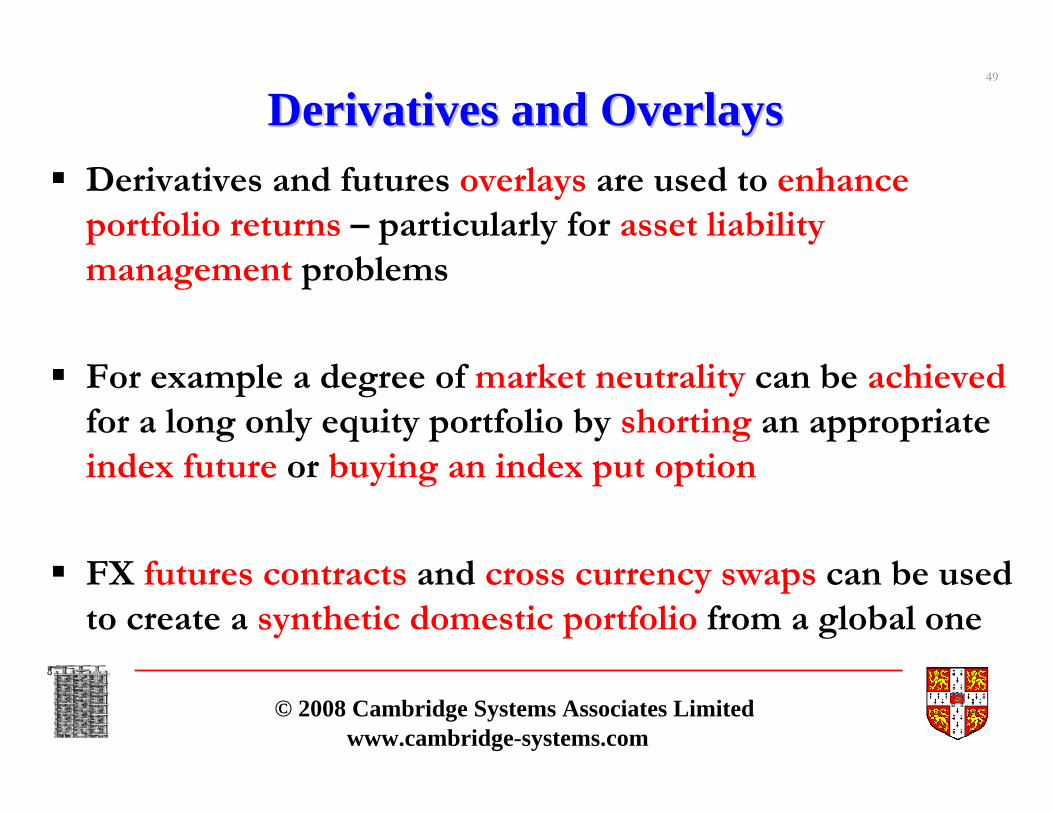
Derivatives and OverlaysDerivatives and OverlaysDerivatives and futures overlays are used to enhance portfolio returns – particularly for asset liabilitymanagement problems
For example a degree of market neutrality can be achievedfor a long only equity portfolio by shorting an appropriate index future or buying an index put option
FX futures contracts and cross currency swaps can be used to create a synthetic domestic portfolio from a global one

50
© 2008 Cambridge Systems Associates Limitedwww.cambridge-systems.com
Hedging RatioHedging RatioAnother important consideration is the desired long-short ratiowhich is decided by optimization in the simple approach taking no account of shorting (stock borrowing) costs
Alternatively long and short nonnegative portfolio weightsand and the budget constraints become
is fully hedged (the maximum short position under Regulation T) and ratios of 1: of 130:30 or 150:50 are often used to ensure approximate market neutrality
, 1L ii Lx
∈=∑ ,S ii S
x φ∈
=∑ [0,1]φ ∈
: 1φ =φ
0Lx ≥0Sx ≥

51
© 2008 Cambridge Systems Associates Limitedwww.cambridge-systems.com
Transactions CostsTransactions CostsIn trading situations particularly transactions costs and portfolio turnover are important features of realized portfolio returns
This is usually handled in MVO by asset position limitsbut can be treated explicitly in a typical situation which sees a portfolio rebalanced daily, weekly, monthly, quarterly, etc.
Relevant to portfolio optimization at each rebalance is the current portfolio xo

52
© 2008 Cambridge Systems Associates Limitedwww.cambridge-systems.com
Scenario Based Dynamic ModelsScenario Based Dynamic Models
By generating scenarios – by simulation, resampling or sampling using quasi-random sequences – for vector valued processes rather than simply for random vectors the same advantages as for tactical –one period – porfolio construction can be enjoyed for multiperiodstrategic portfolio construction
The techniques we will study for this setting involve what the actuaries call dynamic financial analysis (simulation) plus simultaneously optimizing decisions using stochastic optimization

53
© 2008 Cambridge Systems Associates Limitedwww.cambridge-systems.com
Long/Short Equity StrategyLong/Short Equity StrategyLong/short equity fund (hedging ratio as parameter)Select long and short portfolios on weekly basisControl turnoverObey sector constraintsStock selection based on historical data and analyst opinions
Used STOCHASTICSTM to generate and solve this stochastic programming model• StochSim to simulate equity returns• GSPL model(s) formulation (selected by user)• StochGen / StochOpt to create model instance and select optimal portfolios• Proprietary ‘trading’ interface to generate parameters for simulation, to select
model and time windows and display optimization results

54
© 2008 Cambridge Systems Associates Limitedwww.cambridge-systems.com
Dynamic Stochastic Programme ImplementationDynamic Stochastic Programme ImplementationSimulation is crucial in the optimization process but• difficult and complex for any application
• a separate problem to model building
• needs to concentrate only on key processes (others can be derived)
Input GUI
Simulation
Tree construction
Derived assets and processes
Model
GSPL
Solver
StochOpt
Output GUI
= Application specificparameters
key
processes derived processes
scenario treeproblem formulation
results
STOCHASTICSTMStochGen

55
© 2008 Cambridge Systems Associates Limitedwww.cambridge-systems.com
Long/Short Equity Fund SystemLong/Short Equity Fund SystemInput Output
Portfolio Selection
StochGen StochOpt
Optimization
Simulation
StochSim

56
© 2008 Cambridge Systems Associates Limitedwww.cambridge-systems.com
Single Period Model Alpha 2004Single Period Model Alpha 2004--2007 10.13%2007 10.13%
1
1.1
1.2
1.3
1.4
1.5
1.6
1.7
1.8
1.9
02/0
1/20
04
02/0
3/20
04
02/0
5/20
04
02/0
7/20
04
02/0
9/20
04
02/1
1/20
04
02/0
1/20
05
02/0
3/20
05
02/0
5/20
05
02/0
7/20
05
02/0
9/20
05
02/1
1/20
05
02/0
1/20
06
02/0
3/20
06
02/0
5/20
06
02/0
7/20
06
02/0
9/20
06
02/1
1/20
06
02/0
1/20
07
02/0
3/20
07
retu
rn
Without sector constraints
With sector constraints
TOPIX
1.47%1.45%Mean turnover (per week)
4340Mean number of short stocks
6261Mean number of long stocks
0.350.35Beta
1.421.44Sharpe ratio
11.19%11.31%Volatility (p.a.)
15.84%16.31%Return (p.a.)
WithWithout

57
© 2008 Cambridge Systems Associates Limitedwww.cambridge-systems.com
MultiMulti--Period Model Alpha 2004Period Model Alpha 2004--2007 21.18%2007 21.18%
0.00
0.50
1.00
1.50
2.00
2.50
02/0
1/20
04
02/0
3/20
04
02/0
5/20
04
02/0
7/20
04
02/0
9/20
04
02/1
1/20
04
02/0
1/20
05
02/0
3/20
05
02/0
5/20
05
02/0
7/20
05
02/0
9/20
05
02/1
1/20
05
02/0
1/20
06
02/0
3/20
06
02/0
5/20
06
02/0
7/20
06
02/0
9/20
06
02/1
1/20
06
02/0
1/20
07
02/0
3/20
07
Date
Ret
urn
Return Including Transaction Cost
Return Of Topix
7.07%Mean turnover (per week)
40Mean number of short stocks
50Mean number of long stocks
0.09Beta
1.78Sharpe ratio
12.80%Volatility (p.a.)
22.77%Return (p.a.)

58
© 2008 Cambridge Systems Associates Limitedwww.cambridge-systems.com
Credit Trading Strategies for Absolute Credit Trading Strategies for Absolute ReturnReturn

59
© 2008 Cambridge Systems Associates Limitedwww.cambridge-systems.com
Portfolios With Skewed Return DistributionsPortfolios With Skewed Return DistributionsWe have already seen that for portfolios of instruments – such as bonds – with highly skewed return distributions portfolio volatility is inappropriate as a portfolio risk measure
More appropriate is a coherent tail based risk measure such as expected shortfall
However for such risk measures the analytical tractability of the volatility of Gaussian returns is lost and multivariate returndistributions must be discretized to result in a finite number ofscenarios for computational tractability
This results in the problem of controlling discrete sampling error for portfolio decisions and returns by sample size and variance reduction

60
© 2008 Cambridge Systems Associates Limitedwww.cambridge-systems.com
Expected Shortfall Portfolio ConstructionExpected Shortfall Portfolio ConstructionThe minimization of expected shortfall (tail loss) is more appropriate to bond portfolio construction than MVO and for a specified return and also tends to reduce the resulting portfolio volatility and other risk measures as well
Following Pflug, Rockafellar & Uryasev (2000-2001) the optimization problem is based on a set of n historically resampled or simulated scenarios
The solution gives both the optimal α-level VaR , the expected shortfall and the portfolio weights in terms of the problem
αψ α( )VaR
ψ ωψ ψ ω
α∈ +∈Ω′− −∑,
1min [ ( ( ) ) ] where represents the usual x C r x Cn
constraints

61
© 2008 Cambridge Systems Associates Limitedwww.cambridge-systems.com
The Resulting LPThe Resulting LPThis nonlinear problem can be linearized using new variables
Since linear programming is a computationally powerful technique “for the first time risk managers face the problem of finding optimal portfolios with no restriction of size, complexity or distributional assumptions” Acerbi (2007)
Similar approaches can be applied to minimize drawdown-at-risk and spectral risk measures Acerbi (2007)
ω
ω ω ψ ωα
ω ψ ω ω∈Ω
≥ ∈ Ω −
′≥ − ∈ Ω
∑1( ) 0 for the by ( )
and the ( ) ( )
z zn
z r x
replacing objective
adding constraints

62
© 2008 Cambridge Systems Associates Limitedwww.cambridge-systems.com
0% ratings migration correlation maximum return portfolio
Efficiency Analysis Efficiency Analysis
111.1156.21Max Loss
0.69%1.11%Prob of Loss
-2.340.96VaR
12.009.10Std. Dev.
13.5814.70Exp. Shortfall
58.8840.03Exp. Excess Return
MaxReturnFundPortfolio
0%Correlation
Fund

63
© 2008 Cambridge Systems Associates Limitedwww.cambridge-systems.com
Efficiency Analysis Efficiency Analysis
0% ratings migration correlation minimum risk portfolio
97.8156.21Max Loss
0.04%1.11%Prob of Loss
-30.740.96VaR
3.229.10Std. Dev.
-26.3014.70Exp. Shortfall
40.7640.03Exp. Excess Return
MinRiskFundPortfolio
0%Correlation
Fund
64
© 2008 Cambridge Systems Associates Limitedwww.cambridge-systems.com
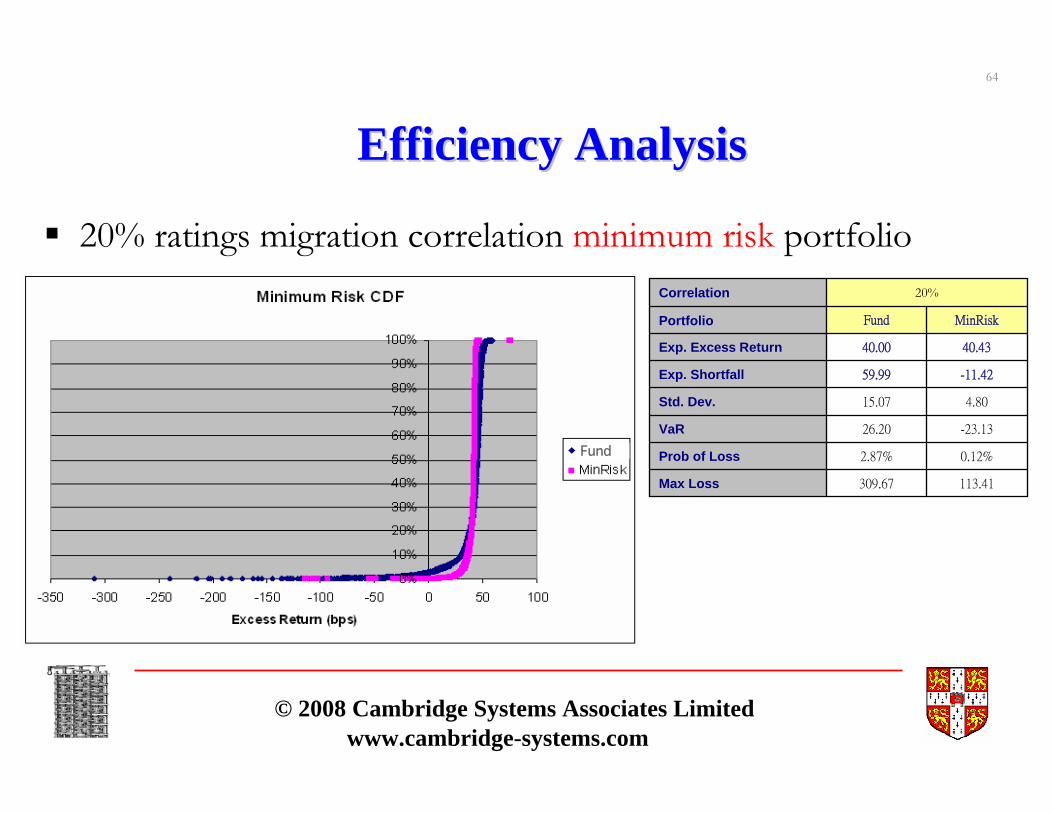
20% ratings migration correlation minimum risk portfolio
Efficiency Analysis Efficiency Analysis
113.41309.67Max Loss
0.12%2.87%Prob of Loss
-23.1326.20VaR
4.8015.07Std. Dev.
-11.4259.99Exp. Shortfall
40.4340.00Exp. Excess Return
MinRiskFundPortfolio
20%Correlation
Fund

65
© 2008 Cambridge Systems Associates Limitedwww.cambridge-systems.com
20% ratings migration correlation maximum return portfolio
Efficiency Analysis Efficiency Analysis
244.47309.67Max Loss
1.85%2.87%Prob of Loss
19.8726.20VaR
16.7415.07Std. Dev.
60.0459.99Exp. Shortfall
60.0040.00Exp. Excess Return
MinRiskFundPortfolio
20%Correlation
Fund

66
© 2008 Cambridge Systems Associates Limitedwww.cambridge-systems.com
Efficiency Analysis: ConstraintsEfficiency Analysis: Constraints
Concentration risk limits for BBB (no ratings migration correlation) Fund vs Minimum Risk Portfolio
Banquo
-0.001
0.001
0.003
0.005
0.007
Obligor
Rat
io o
f tot
al p
ortfo
lio
LeewayPortfolio holdings
Minimum Risk Portfolio
-0.001
0.001
0.003
0.005
0.007
Obligor
Rat
io o
f tot
al p
ortfo
lio
LeewayPortfolio holdings
Fund
67
© 2008 Cambridge Systems Associates Limitedwww.cambridge-systems.com
Summary and ConclusionsSummary and Conclusions
The uses of MVO or other static optimization portfolio construction techniques depends on the tactical or trading application
We have briefly surveyed
• Portfolio performance and risk measures
• Basic MVO and its extensions
We have also outlined scenario based dynamic portfolio constructiontechniques which are applicable to strategic institutional and individual asset liability management
Such scenario based techniques have randomization advantages over alternatives in static tactical or trading applications