Risk Factors for CVD in Type 1 Diabetes - Denver, … Factors for CVD in Type 1 Diabetes ......
43
Risk Factors for CVD in Type 1 Diabetes Marian Rewers, MD, PhD Professor & Clinical Director, BDC
Transcript of Risk Factors for CVD in Type 1 Diabetes - Denver, … Factors for CVD in Type 1 Diabetes ......

Risk Factors for CVD
in Type 1 Diabetes
Marian Rewers, MD, PhD
Professor & Clinical Director, BDC

Duality of Interest DeclarationI have no conflict of interest in the field covered by my lecture
but I’d rather be there today

Type 1 diabetes = a disease of adults1.4 million of adults with T1D in the U.S.
0
25,000
50,000
75,000
100,000
125,000
150,000
5 10 15 20 25 30 35 40 45 50 55 60 65 70 75 80Age [yrs]
Number of patients, 2005

Survival among T1 D patients is improving
Allegheny County IDDM Registry 1965-1999
Nishmura R, et al. Diabetes Care 2001
Duration of diabetes (yrs)
0.5
0.6
0.7
0.8
0.9
1
0 5 10 15 20 25 30 35
1975-79 SMR =235
1970-74 SMR =367
1965-69 SMR =497
Duration of diabetes (yrs)
0.5
0.6
0.7
0.8
0.9
1
0 5 10 15 20 25 30 35
1975-79 SMR =235
1970-74 SMR =367
1965-69 SMR =497
General Population SMR =100

The incidence of microvascular complications in T1D
is decliningSteno Clinic, Denmark, 600 Patients diagnosed 1965-84
Hovind P, et al. Diabetes Care 2003
1961-65
1966-70
1966-70
1971-751971-75
1976-80 1976-80
Diabetic nephropathyProliferative diabetic retinopathy
1965-691965-69
1970-741970-74
1975-791975-79
1980-841980-84
30
20
10
40

0
10
20
30
40
50
60
70
80
90
100
20 yrs` 25 yrs 30 yrs 35 yrs 40 yrs 45 yrs 50 yrs
1950-59
1960-69
1970-80
The incidence of coronary artery disease in T1D
is increasing684 Patients diagnosed 1950-1980
%
Orchard T, Pittsburgh EDC StudyDiabetes duration
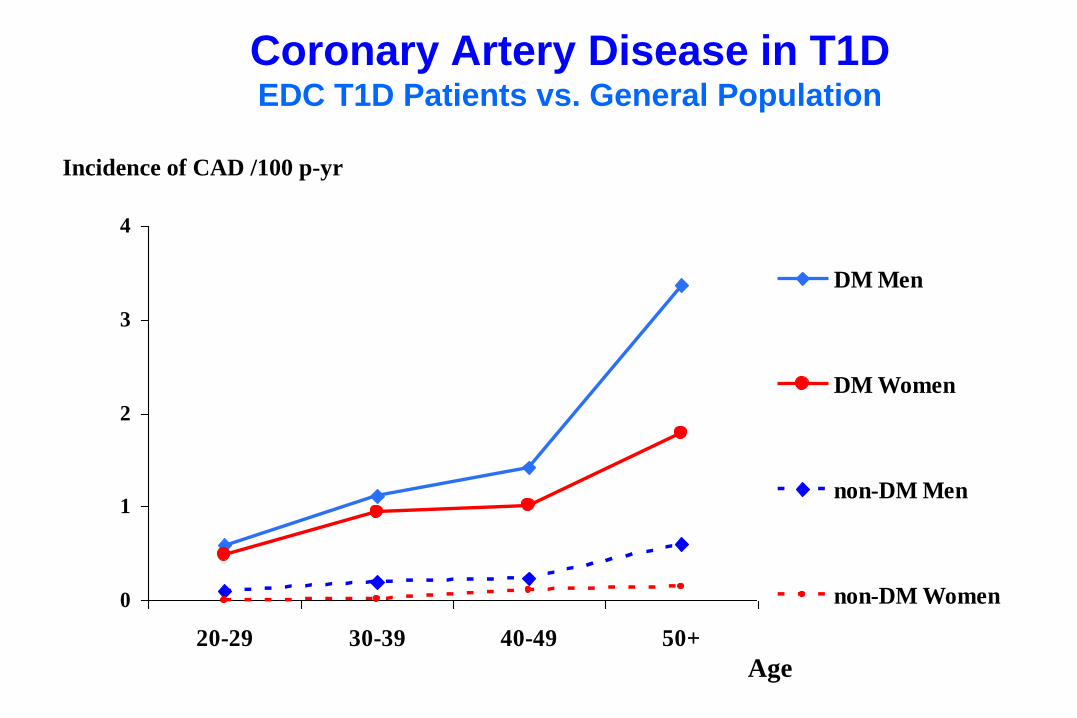
Coronary Artery Disease in T1DEDC T1D Patients vs. General Population
0
1
2
3
4
20-29 30-39 40-49 50+
DM Men
DM Women
non-DM Men
non-DM Women
Incidence of CAD /100 p-yr
Age

• Vast majority of the U.S. T1D patients are middle-aged
• Survival has improved, due to prevention of acute
complications and nephropathy
• CAD is the leading cause of death in people with T1D
and poorly responds to prevention efforts
• Women with T1D have 10-30 times higher risk of CAD,
and men have 4-10 times higher risk, compared to the
general population.
Summary 1

Standards of Medical Care, ADA 2010Non-pregnant adults (T1D and T2D)
• A1c: <7% (eAG <154 mg/dl)
– pre-prandial BG 70-130 mg/dl
– post-prandial peak BG <180 mg/dl
– avoid severe hypoglycemia
• BP: 130/80 mm/Hg
– antihypertensives if micro-/macroalbuminuria
• LDL-Ch: <100 mg/dl (non-HDL-ch<130, apoB<90)
– TG <150 mg/dl, HDL-ch >40(M) >50(F)
• No smoking
• BMI <25• Aspirin M>50, F>60 and high risk CVD

Standards of Medical Care, ADA 2010Adults with T1D
• A1c: <7% (eAG <154 mg/dl)
– pre-prandial BG 70-130 mg/dl
– post-prandial peak BG <180 mg/dl
– avoid severe hypoglycemia
• BP: 130/80 mm/Hg
– antihypertensives if micro-/macroalbuminuria
• LDL-Ch: <100 mg/dl (non-HDL-ch<130, apoB<90)
– TG <150 mg/dl, HDL-ch >40(M) >50(F)
• No smoking
• BMI <25• Aspirin M>50, F>60 and high risk CVD

<10% of T1D patients meet the ‘ABC’ goals:
A1c<7%, LDL<100 mg/dl, BP<130/80CACTI, N=652 age 20-55, duration 23 ± 8 yr
P=0.001
%
Snell-Bergeon J et al 2011

01020
3040506070
8090
100
DN DR PDR Neuropathy
%
Met all goals Met some goals Met no goals
p<0.0001 p=0.008 p=0.032 p=0.009
Meeting the ADA ‘ABC’ goals
helps to prevent microvascular complications:CACTI, N=459 age 20-55, duration 23 ± 8 yr
A1c<7%, LDL<100 mg/dl, BP<130/80
6-yr
cumulative
incidence
[%]
Snell-Bergeon J et al 2011

Figure 2.
Compliance with ADA Goals and CAC Progression in T1DCAC progresses regardless of meeting the ADA goals:
CACTI, N=459 age 20-55, duration 23 ± 8 yr
% CAC
progressed
in 6 yrs
Snell-Bergeon J et al 2011A1c<7%, LDL<100 mg/dl, BP<130/80

EBT CACIncreased calcium
in the LAD and CFX
Angiography & IVUS
Each magnified image demonstrates focal
regions of LAD intimal artery architecture
viewed by IVUS.

CAC strongly predicts future coronary events
in asymptomatic subjects
Pletcher MJ, Arch Intern Med 2004
OR=2.1 (1.6-2.9)
OR=5.4 (2.2-13)
OR=10.0 (3.1-34)

• Few T1D patients meet the ADA ‘ABC’ goals
– those who do, lower their risk of microvascular disease,
– but remain at high risk of CVD
• We need to find additional important risk factors and interventions
• Non-invasive monitoring of progression of subclinical CVD and effects of treatment will help
Summary 2

Risk factors for CVD in T1D

Non-modifiable predictors of CVD
in T1D
• Age
• Duration of diabetes
• Male gender (less than in the general population)
• Lack of residual insulin secretion
• Genetic markers, e.g.:– family history of MI in parents
– apolipoprotein A-IV Gln360His
– hepatic lipase (LIPC-480C>T)
– ACE I/D, angiotensin type 1 receptor (1166A), angiotensinogen (235M>T)
– VDR
– Matrix metalloproteinase-3 (MMP3-5A/6A)

Risk factors for CVD in T1D
• Hypertension
• Renal dysfunction
– tubular markers, MA, GFR

Independent Baseline Predictors of CAD EventsBoth Sexes, Cox PH Model
Orchard TJ. EDC 2004
Type of CAD Variables HR (95% CI) p
Total CAD Duration 2.18 (1.74-2.73) <0.001
Hypertension 2.16 (1.40-3.32) <0.001
WBC 1.35 (1.11-1.59) 0.002
HDLc 0.72 (0.58-0.91) 0.005
non-HDLc 1.33 (1.08-1.59) 0.007
Ever Smoke 1.58 (1.05-2.38) 0.028
HR yes/no or change per standard deviation (SD):WBC=1.92x10³, Duration=7.5 y, HDLc=12.4 mg/dl, non-HDLc=43.0 mg/dl

Baseline DCCT Predictors of CVD in T1DNathan DM et al. DCCT/EDIC 2006
With CVD
N=83
No CVD
N=1358 p-value
Intensive insulinotherapy (%) 37 50 0.02
HbA1c (%) 9.5 9.0 0.014
Current smoking (%) 33 18 <0.001
LDL (mg/dl) 127 109 <0.001
Albuminuria (mg/24h) 19 16 0.02
Triglicerides (mg/dl) 88 81 0.04
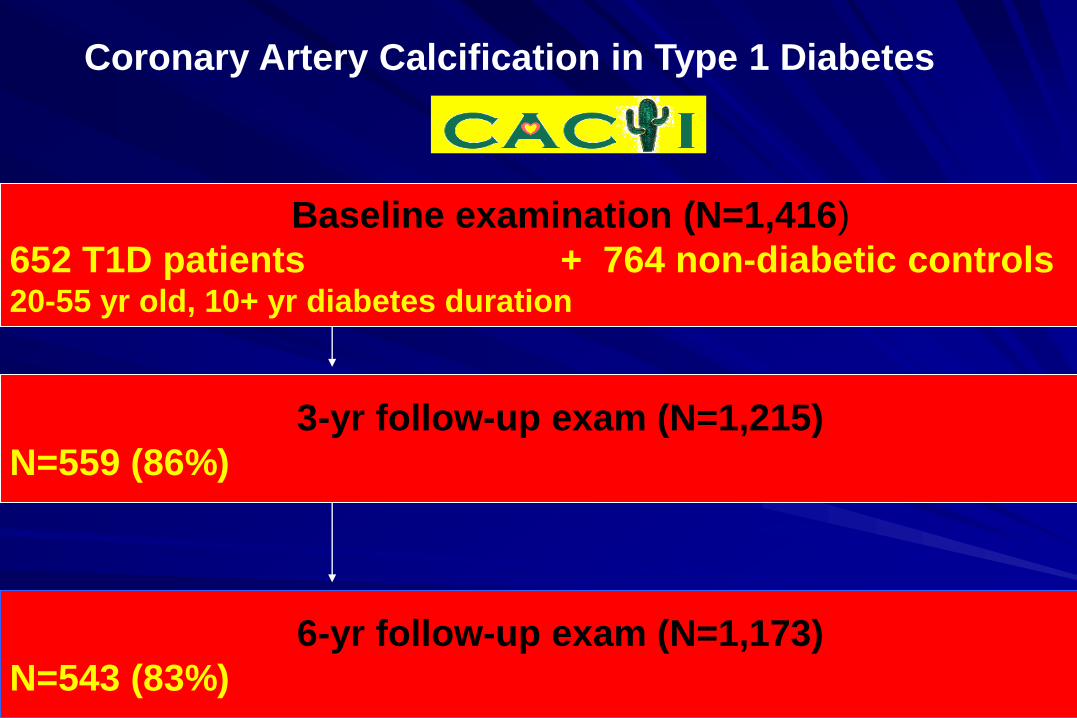
Coronary Artery Calcification in Type 1 Diabetes
6-yr follow-up exam (N=1,173)
N=543 (83%)
3-yr follow-up exam (N=1,215)
N=559 (86%)
Baseline examination (N=1,416)
652 T1D patients + 764 non-diabetic controls 20-55 yr old, 10+ yr diabetes duration

Baseline characteristics of T1D participants
with CAC progression from baseline to 6 years
CACTI 2000-08 Progressors
(n = 192)
Non-Progressors
(n = 249)
Sex (%male) 57.8** 37.8
Age (yrs) 40.6±8.3** 34.3±8.4
Duration of Diabetes (yrs) 26.7±8.8** 20.3±7.9
Hypertension (%) 57.8** 27.42
Systolic Blood Pressure 121±14** 113±12
Diastolic Blood Pressure 78±9* 76±8
Means ± SD, percent, or median. ŧSquare root transformed. *p<0.05, **p<001

Maahs, CACTI. J Diab Comp, 2006
62% lower risk of CAC progression
with
ACE/ARB Tx

Risk factors for CVD in T1D
• Hypertension
• Renal dysfunction
– tubular markers, MA, GFR
• Hyperglycemia and glycemic variability

Conventional
Intensive
Cardiovascular Events
Non-Fatal MI, Stroke or CVD Death
0 1 2 3 4 5 6 7 8 9 10 11 12 13 14 15 16 17 18 19 20 21
Number at Risk
Intensive: 705 686 640 118
Conventional: 721 694 637 96
Years from Study Entry
0.00
0.02
0.04
0.06
0.08
0.10
0.12
Cu
mu
lati
ve I
ncid
en
ce
Risk reduction 57%
95% CI: (12-79%)
Log-rank P = 0.018
DCCT/EDIC

Snell-Bergeon et al. Diabetes Care 20030.0
0.1
1.0
10.0
100.0
< 6.0 6- 6.8 6.8-7.5 >7.5
HbA1c
OR
fo
r p
rog
ressio
n o
f C
AC
A1c predicts progression of coronary calcium
in T1D CACTI participants
Adjusted for age, gender, duration of diabetes and baseline CAC
RR 7.1 p=0.02
<6.0% 6-6.8% 6.8-7.5% >7.5% HbA1c

Mixed-effects models for 6-yr progression of CAC,
best models in T1D patients
Estimate (95% CI) p-value
Age (yrs) 0.97 (0.50 , 1.44 ) .0001
Baseline CAC>0 3.39 (2.53 , 4.25 ) .0000
Diabetes Duration (yrs) 1.10 (0.63 , 1.57 ) .0000
Hypertension 1.74 (0.94 , 2.53 ) .0000
HbA1c 0.54 (0.08 , 1.01 ) .0224
Estimates per SD: age 9 yr, duration 9 yr, HbA1c 1.5%
CACTI 2010

Good glycemic control & low variability
CGM CACTI ID 2013; 3443 observations in 15 days
0
100
200
300
400
12:00 AM 6:00 AM 12:00 PM 6:00 PM 12:00 AM
Time of Day
Glu
cose (
mg/d
L)
Grand mean 117 mg/dl
Overall standard
deviation33 mg/dl
% within 70 – 180 96%
MODD_ave 31 mg/dl
HbA1c 6.4%

Good glycemic control & high variability
CGM CACTI ID 1049; 2805 observations in 15 days
0
100
200
300
400
12:00 AM 6:00 AM 12:00 PM 6:00 PM 12:00 AM
Time of Day
Glu
cose (
mg/d
L)
Grand mean 131 mg/dl
SD 72 mg/dl
% within 70 – 180 78%
MODD_ave 67 mg/dl
HbA1c 5.8%

Glycemic variability is associated with
CAC in men with T1DOdds Ratios (95% CI)
Men
(n=29)
Women
(n=40)
p-value
interaction
by sex
Mean glucose 5.0 (1.1-21.6) 1.2 (0.6-2.2) 0.07
SDT 7.2 (1.6-32.6) 1.2 (0.6-2.4) 0.04
% of time <70 mg/dl 1.3 (0.4-3.7) 0.9 (0.4-1.7) 0.52
% of time >180 mg/dl 9.0 (1.5 – 54.5) 1.1 (0.6 – 2.2) 0.03
Snell-Bergeon J et al Diabet Med 2010

Risk factors for CVD in T1D
• Hypertension
• Renal dysfunction
– tubular markers, MA, GFR
• Hyperglycemia and glycemic variability
• Insulin resistance
– central obesity
– ↓HDL, ↑triglycerides, impaired FFA suppression

T1D Subjects are Insulin ResistantCACTI N=87
Glu
co
se D
isp
osal
mg
/kg
/min
LS Mean ± SE, adjusted for age, BMI, fasting glucose, final clamp glucose and insulin
0
2
4
6
8
10
12
14
16
T1DWomen
ControlWomen
T1D Men ControlMen
p<0.005p<0.0001
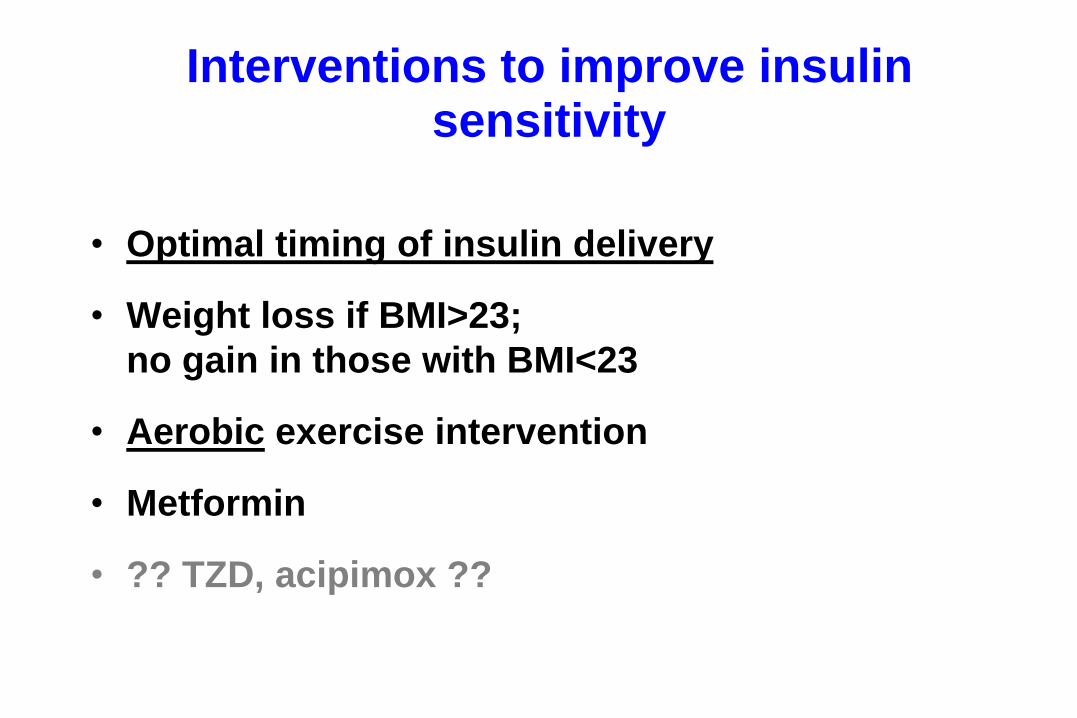
Interventions to improve insulin sensitivity
• Optimal timing of insulin delivery
• Weight loss if BMI>23;
no gain in those with BMI<23
• Aerobic exercise intervention
• Metformin
• ?? TZD, acipimox ??

Estimation of insulin sensitivity using clinical
parameters
Group Equation Mean
eGDR± SD
T1D
Men
23.91 +(adiponectin*0.139) –(triglycerides*0.003)
- (insulin dose/kg/day*4.29) - (waist*0.184)
6.0 ± 2.8
T1D
Women
6.92 + (adiponectin*0.139) - (triglycerides * 0.003)
- (insulin dose/kg/day*4.29)
6.7 ± 1.8
Equations derived from clamp studies in 40 adults with T1D
Validated in CACTI cohort (n=652)
Snell-Bergeon J, CACTI 2010

Risk factors for CVD in T1D
• Hypertension
• Renal dysfunction
– tubular markers, MA, GFR
• Hyperglycemia and glycemic variability
• Insulin resistance
– central obesity
– ↓HDL, ↑triglycerides, impaired FFA suppression
• LDL-cholesterol
• smoking

Baseline characteristics of T1D participants
with CAC progression from baseline to 6 years
CACTI 2000-08 Progressors
(n = 192)
Non-Progressors
(n = 249)
Sex (%male) 57.8** 37.8
Age (yrs) 40.6±8.3** 34.3±8.4
Duration of Diabetes (yrs) 26.7±8.8** 20.3±7.9
LDL Cholesterol 101.8±27.6* 96.1±28.0
HDL Cholesterol 53.9±15.7* 57.7±16.7
Log Triglycerides 4.5±0.5** 4.3±0.5
Means ± SD, percent, or median. ŧSquare root transformed. *p<0.05, **p<001
CACTI 2010

Effects of Simvastatin
on First Major CVD Event in Diabetes
HPS Collaborative Group, Lancet 361:2010, 2003

Practical implications
• Take care of the ABCs:
A1c, Blood pressure, LDL-Cholesterol
• Screen all asymptomatic diabetic patients older than 30 for
increased plaque burden = high or rapidly increasing CAC score
• Patients with high or rapidly increasing CAC score ->
myocardial perfusion tests, angiography, IVUS
•Intensive interventions

Emerging CVD risk factors in T1D
• Dysfunctional (high/normal) HDL
• Inflammation (markers of response to injury?)
– ↓ adiponectin
– ↑ sIL-2r, WBC, hsCRP, IL-1, IL-1ra, IL-6, IL-6r, TNF- TNF-rII, IL18,
ICAM-1, VCAM-1, E-selectin, P-selectin, Lp-PLA2, CD40L
• Hypovitaminosis
– Vitamin E in subjects with haptoglobin 1/1 ?
– Vitamin D in subjects with VDR Fok I T allele ?
– Folate in subjects with MTHFR-677 C>T ?
• Impaired fibrinolysis
– ↑ fibrynogen, PAI-1
Rewers M. 4/2010
University of ColoradoBarbara Davis Center:
Marian Rewers, P.I., Janet Snell-Bergeon
David Maahs, Franziska Bishop
Greg Kinney, Paul Wadwa
Ram Naik, Satish Garg
Nicole Gendelman, Katherine Pratte
Colorado School of Public Health:
John Hokanson, Lorri Ogden
Dana Dabelea, Kim McFann
Medicine: Robert Eckel
Robert Quaife, Marcus Chen
Irene Schauer, Bryan Bergman
Colorado Heart Imaging: James Ehrlich
Roche Molecular Systems:
Suzanne Cheng, Henry Erlich
Univ. Bialystok: Adam Kretowski
Univ. Vermont: Russell Tracy
Wake Forest Univ. Ronald Prineas
Porto Alegre Univ. Ticiana Rodirigues
Univ. de Chile: Rossana Roman
UCLA: Matthew Budoff
Univ. Pittsburgh: Trevor Orchard
Tina Costacou

LDL HDL
ApoB ApoAI
The Bad and the Good Cholesterol
Alan Chait, ADA 2011
Can HDL become dysfunctional
so as not to be atheroprotective or anti-inflammatory?

Altered HDL composition and function
“Inflammatory HDL” bind avidly to vascular proteoglycans
Oxidized HDL functions poorly in reverse cholesterol transport
CE
HDL
INFLAMMATION
CE ↓ HDL level
CE
↓ApoA-I
↓PON1
↑SAA1/2
↓cholesterol efflux
↓anti-oxidant activity
Khovidhunkit J Lipid Res 2004; Navab J Lipid Res 2009; Han ATVB 2006; Shao J Lipid Res2010