RISK BASED METHODOLOGY FOR ASSESSING AVOIDED …...Risk Based Methodology for Assessing Avoided...
14
RISK BASED METHODOLOGY FOR ASSESSING AVOIDED DEFORESTATION WITH APPLICATION IN ICF FOREST PROGRAMMES IN SOUTHERN GHANA FINAL REPORT, June 2015 Authors: Veronique Morel, Ecometrica Karin Viergever, Ecometrica Richard Tipper, Ecometrica Edward Mitchard, The University of Edinburgh Acknowledgements: Ecometrica and The University of Edinburgh would like to acknowledge the input from the following experts, obtained during video conference meetings in February and March 2015, in identifying the main risk parameters: Winston Asante (Kwame Nkrumah University of Science and Technology), Bright Obeng Kankam (CSIR-FORIG), Edward Obiaw (GFC-RMSC), Julia Falconer (DFID). Neil Scotland (DFID) also assisted in our efforts to gather information. Ecometrica acquired all data sources and did the risk mapping analyses based on our interpretation of the expert input. The University of Edinburgh was the main point of contact with in-country experts. This project was funded by the European Space Agency (ESRIN Contract No.4000112345/14/I-NB: Earth Observation Support for Assessing the Performance of UK government’s ICF Forest Projects), with additional support from NERC (Innovation Voucher Scheme).
Transcript of RISK BASED METHODOLOGY FOR ASSESSING AVOIDED …...Risk Based Methodology for Assessing Avoided...

RISK BASED METHODOLOGY FOR ASSESSING
AVOIDED DEFORESTATION WITH APPLICATION IN
ICF FOREST PROGRAMMES IN SOUTHERN GHANA
FINAL REPORT, June 2015
Authors:
Veronique Morel, Ecometrica
Karin Viergever, Ecometrica
Richard Tipper, Ecometrica
Edward Mitchard, The University of Edinburgh
Acknowledgements:
Ecometrica and The University of Edinburgh would like to acknowledge the input from the following
experts, obtained during video conference meetings in February and March 2015, in identifying the
main risk parameters: Winston Asante (Kwame Nkrumah University of Science and Technology), Bright
Obeng Kankam (CSIR-FORIG), Edward Obiaw (GFC-RMSC), Julia Falconer (DFID). Neil Scotland (DFID) also
assisted in our efforts to gather information.
Ecometrica acquired all data sources and did the risk mapping analyses based on our interpretation of
the expert input. The University of Edinburgh was the main point of contact with in-country experts.
This project was funded by the European Space Agency (ESRIN Contract No.4000112345/14/I-NB: Earth
Observation Support for Assessing the Performance of UK government’s ICF Forest Projects), with additional
support from NERC (Innovation Voucher Scheme).

Risk Based Methodology for Assessing Avoided Deforestation with application in ICF Forest Programmes in southern Ghana
Ecometrica | University of Edinburgh
2
TABLE OF CONTENTS
1 Introduction .......................................................................................................................................................... 3
2 Description of study area ...................................................................................................................................... 4
3 Defining Forest Extents ......................................................................................................................................... 5
4 Risk Factors ........................................................................................................................................................... 6
4.1 Accessibility: Risk of deforestation associated with access by road ............................................................ 6
4.2 Accessibility/Cultivability: Risk due to Proximity to Previous Sites of Deforestation .................................. 8
4.3 Accessibility: Proximity to cities and towns ................................................................................................. 9
4.4 Protected Areas .......................................................................................................................................... 11
5 Methods and calculations ................................................................................................................................... 11
6 Note on further work .......................................................................................................................................... 14
Risk Based Methodology for Assessing Avoided Deforestation with application in ICF Forest Programmes in southern Ghana
Ecometrica | University of Edinburgh
3
1 INTRODUCTION
The International Climate Fund (ICF) was set up by the UK government in 2011 with the aim of working
in partnership with developing countries to reduce carbon emissions through promoting low carbon
development, to help the world’s poorest people adapt to climate change and reduce deforestation.
Forest activities funded under ICF should support developing country actions on Reducing Emissions
from Deforestation and forest Degradation (REDD) and contribute to low carbon growth that reduces
poverty. An improved understanding of forest areas at risk as well as historic and ongoing deforestation
likely to occur in the absence of conservation interventions is important in deciding how to target
interventions and how to evaluate the impact of conservation measures in terms of avoided
deforestation.
The following risk-based method takes advantage of earth observation data and geospatial information
products and has been devised to apply to large scale programmes in areas where broadly similar
processes, legal and institutional constraints, play out across forest ecosystems.
The output of the method is an estimate of avoided deforestation derived from the amount of expected
forest loss within an area over a 20 year period versus observed annual forest loss. Expected loss is
estimated by applying an ACEU - type1 risk model which assumes that land areas are at greater risk of
deforestation and degradation if they are easily accessible, are suitable for cultivation, have an
extractable value, and are unprotected. The methodology does not provide a prediction of future forest
loss but assigns relative risk values, based on the ACEU criteria.
Each of the four ACEU parameters are defined and assigned a level of risk based on assessments of
region-specific drivers of forest loss and land use change. The resulting risk map is intended to aid
project developers and conservation organisations wishing to target efforts to areas where they are
most needed.
The method was assessed for feasibility in 3 ICF project areas with markedly different forest types and
drivers of land use change in southern Ghana, Terai and Churia in Nepal and Brazilian cerrado. This
document describes the methodology used to produce a risk of deforestation map in each of these
areas.
An important part of this work was in defining forest extents in each region, identifying drivers of forest
loss in consultation with local experts and assessing the quality and availability of data. It is suggested
1 The ACEU risk model determines an overall level of risk as the product of the risks associated with each of the four ACEU
parameters: A = Accessible – local actors able to reach the area (RA); C = has Cultivable value – land can be used for subsistence or commercial crops (RC) E = Extractable Value – forest biomass has economic value (RE), U = Un/Protection Status – land tenure regime does not prevent extraction or conversion (RU). Risk is calculated as: RISK FACTOR = (RU)* (RC)*( RE)* (RA)
Risk Based Methodology for Assessing Avoided Deforestation with application in ICF Forest Programmes in southern Ghana
Ecometrica | University of Edinburgh
4
that the risk maps may be updated in the future, to take account of new risks and changes to the
understanding of drivers.
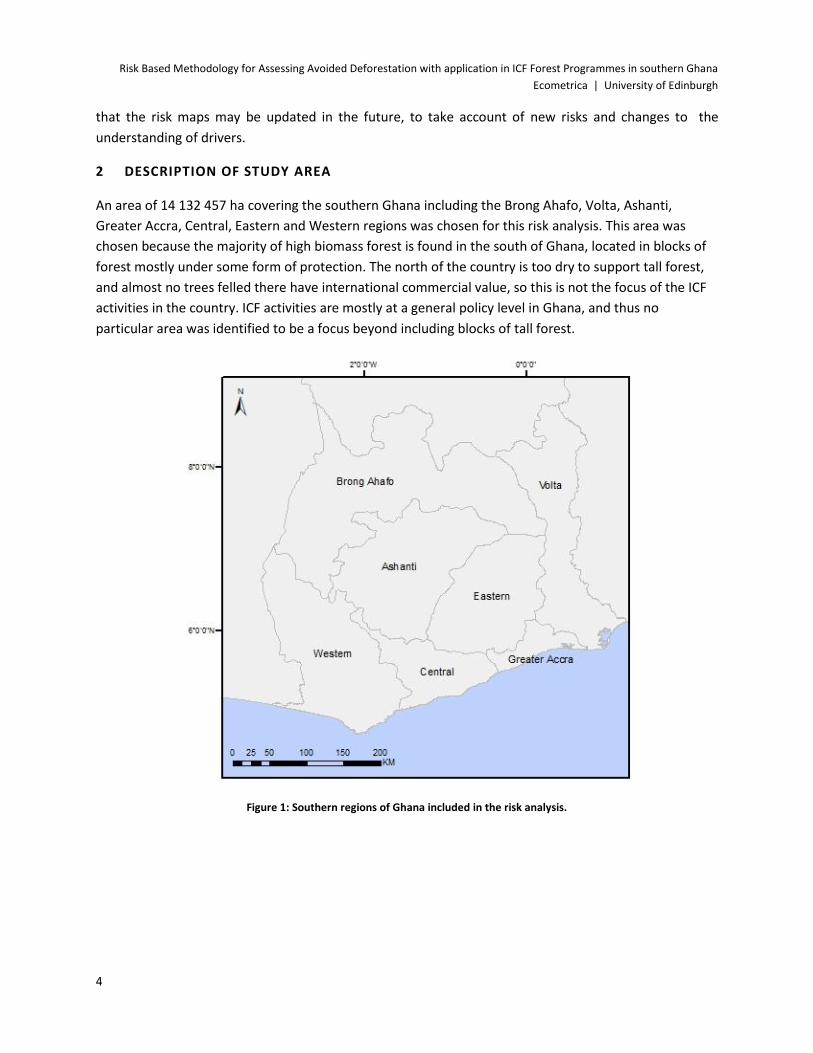
2 DESCRIPTION OF STUDY AREA
An area of 14 132 457 ha covering the southern Ghana including the Brong Ahafo, Volta, Ashanti,
Greater Accra, Central, Eastern and Western regions was chosen for this risk analysis. This area was
chosen because the majority of high biomass forest is found in the south of Ghana, located in blocks of
forest mostly under some form of protection. The north of the country is too dry to support tall forest,
and almost no trees felled there have international commercial value, so this is not the focus of the ICF
activities in the country. ICF activities are mostly at a general policy level in Ghana, and thus no
particular area was identified to be a focus beyond including blocks of tall forest.
Figure 1: Southern regions of Ghana included in the risk analysis.

Risk Based Methodology for Assessing Avoided Deforestation with application in ICF Forest Programmes in southern Ghana
Ecometrica | University of Edinburgh
5
3 DEFINING FOREST EXTENTS
The first step for mapping risk of deforestation, is to identify the forest extent within the study area.
Ghana’s official definition of “forest” is woodland with a minimum canopy cover of 15% and minimum
area of 0.1 ha. Forest extent within the study area was obtained applying the above definition using
Global tree canopy cover for the year 2000, produced by Hansen et al (2013)2 , updated to 2013 using
Global Forest Cover Loss (2000-2012) data 3 (shown in Figure 2).
Figure 2: Forest extent derived from
Hansen et al (2013) Global Tree Canopy
Cover for 2000 dataset and Global Forest
Cover Loss up to 2012 dataset. Areas
over 0.1 hectare and with more than 15%
canopy cover were classed as forest.
2 Hansen, M. C., P. V. Potapov, R. Moore, M. Hancher, S. A. Turubanova, A. Tyukavina, D. Thau, S. V. Stehman, S. J. Goetz, T. R.
Loveland, A. Kommareddy, A. Egorov, L. Chini, C. O. Justice, & J. R. G. Townshend (2013) High-Resolution Global Maps of 21st-Century Forest Cover Change.” Science 342 (15 November): 850–53 http://earthenginepartners.appspot.com/science-2013-global-forest.
3 Hansen, M. C., P. V. Potapov, R. Moore, M. Hancher, S. A. Turubanova, A. Tyukavina, D. Thau, S. V. Stehman, S. J. Goetz, T. R.
Loveland, A. Kommareddy, A. Egorov, L. Chini, C. O. Justice, & J. R. G. Townshend (2013) High-Resolution Global Maps of 21st-Century Forest Cover Change.” Science 342 (15 November): 850–53 http://earthenginepartners.appspot.com/science-2013-global-forest.

Risk Based Methodology for Assessing Avoided Deforestation with application in ICF Forest Programmes in southern Ghana
Ecometrica | University of Edinburgh
6
Due to the very broad definition of forests in Ghana, 79% of land cover within the study area is
considered forest.
4 RISK FACTORS
This study applies the qualitative ACEU risk model, which is based on the hypothesis that forest areas
are at greater risk of deforestation if they are accessible (A), located in areas suitable for cultivation of
staple crops (C), contain timber resources that have an extractable value (E) and are unprotected (U).
The sections below explain how each of these four parameters are defined and assigned a level of risk. It
is important to note that these risk maps are early version first drafts and can be improved over time as
newer data and information becomes available.
4.1 ACCESSIBILITY: RISK OF DEFORESTATION ASSOCIATED WITH ACCESS BY ROAD
Proximity to roads and populated areas was considered to be the most important factor in determining
accessibility. Data for primary roads for Ghana was sourced from the Digital Chart of the World (DCW)
dataset4. Areas closer to roads were assigned higher risk values by defining 5 buffer zones up to a
distance of 2 km away from roads, according to the table below:
Very High Risk up to 250 m from roads
High Risk 250m to 500m from roads
Medium Risk 500m to 1km from roads
Low Risk 1.5km to 2km from roads
Very Low Risk over 2km from roads
Table 1: Risk classes defined according to distance from roads.
Risk of deforestation due to access by rivers and railways were not included in this analysis.
4 DCW (2000) Digital Chart of the World. Available at http://www.diva-gis.org/gdata

Risk Based Methodology for Assessing Avoided Deforestation with application in ICF Forest Programmes in southern Ghana
Ecometrica | University of Edinburgh
7
Figure 3a: Risk of deforestation due
to access by roads to forested areas
in southern Ghana. Red shows high
risk (closer to roads), while green
shows low risk. Risk is calculated for
up to 2 km from a road.
Figure 3b: Zoomed in subset showing
risk of deforestation due to access by
roads to forested areas in southern
Ghana. Red shows high risk (closer to
roads), while green shows low risk.
Risk is calculated for up to 2 km from
a road.

Risk Based Methodology for Assessing Avoided Deforestation with application in ICF Forest Programmes in southern Ghana
Ecometrica | University of Edinburgh
8
4.2 ACCESSIBILITY/CULTIVABILITY: RISK DUE TO PROXIMITY TO PREVIOUS SITES OF
DEFORESTATION
A density map of deforestation events with a minimum area of 0.1 hectare that occurred between 2001
and 2013 was created based on the Hansen et al (2013) Global Forest Cover Loss (2000-2013) data. The
density map was then divided into 5 classes based on a quantile classification of the density values – i.e.
the group of highest density values were given highest risk value (=5) and the group of lowest density
values were given lowest risk value (=1). The density map was created using a radius of 10 km, where
higher than average densities within the radius were classed in high and very high risk categories, and
lower than average densities were classed as very low and low risk, shown in figure 5.
Figure 5: Density map of past deforestation in Ghana. Red areas indicate a high number of deforestation events, while green
shows low density of deforestation events. The density values shown here were classed using a quantile classification, where
areas in red show densities of deforestation above the mean, and green values are below the mean deforestation event
densities across the study area.

Risk Based Methodology for Assessing Avoided Deforestation with application in ICF Forest Programmes in southern Ghana
Ecometrica | University of Edinburgh
9
4.3 ACCESSIBILITY: PROXIMITY TO CITIES AND TOWNS
Spatial data for settlements was obtained from gazetteer data5, and combined with Ghana Statistical
Service population and housing census from the year 20006 to identify approximate population totals for
the largest settlements in Ghana. Risk values were assigned according to settlement population size and
distance from the city, town or settlement, as shown in Table 2.
Very High High Medium Low Very Low
Cities & large towns with a
population of over 50 000
< 10 km 10 km to 20
km
20 km to 50
km
50km to
70km
> 70km
Populated places with a population
of between 20 000 and 50 000
< 1 km 1 km to 2 km 2 km to 3 km 3 km to 4 km 4 km to 5
km
Settlements with a population of
under 20 000
< 0.5 km 0.5 km to 1 km 1 km to 2 km 2 km to 3 km 3 km to 4
km
Table 2: Risk classes defined according to distance from populated places, according to their population size.
The gazetteer data was incomplete and missing a strip of points (shown in figure 6) along the east side
of Ghana, through the region of Volta, Greater Accra and the Eastern region. Although the majority of
this area was non-forested according the Hansen et al (2013) Global Tree Canopy Cover data for 2000
(Fig. 2), the risk map is expected to be less accurate for these areas. We favoured the gazetteer data
despite the strip of missing data (over the coarser resolution 2002 global CIESIN population density data
because it allowed the use of detailed buffers around settlements according to population size.
Overlapping risk values for buffer areas created according to population size of the settlements were
combined and classified into 5 final classes according to their distance from the nearest settlements,
shown in figure 7.
5 NGA GEOnet Names Server (GNS) World Gazetteer, National Imagery and Mapping Agency's (NIMA)
6 Ghana Statistical Service, 2000 population and housing census: special report on urban localities, Accra 2002

Risk Based Methodology for Assessing Avoided Deforestation with application in ICF Forest Programmes in southern Ghana
Ecometrica | University of Edinburgh
10
Figure 6: Gazetteer data for
settlements, showing the
strip of missing data
through Volta, Greater
Accra and the Eastern
Region
Figure 7: Risk classes based on
distance from cities, towns
and smaller populated places

Risk Based Methodology for Assessing Avoided Deforestation with application in ICF Forest Programmes in southern Ghana
Ecometrica | University of Edinburgh
11
4.4 PROTECTED AREAS
The effect of Protected areas was added as a final step, after all risk parameters discussed above were
combined into 1 risk map. For the purposes of this mapping exercise, it is assumed that protected areas
have a very low risk of forest loss, while buffer areas within a buffer zone in a protected area have a
slightly higher risk of forest loss.
Data for protected areas was obtained from the Ministry of Lands and Natural Resources in Ghana (see
figure 9 for an example). An internal boundary buffer of 2 km was created for each protected area. All
protected areas were assigned the lowest risk value of 1, while areas falling within a buffer zone in a
protected area were assigned one risk value lower than previously assigned due to risk from proximity
to roads and settlements as well as past deforestation since these areas were deemed more accessible.
Figure 9: Protected Areas along Ghana’s western border shown with a 2km internal buffer zone.
5 METHODS AND CALCULATIONS
The total risk of deforestation for southern Ghana was calculated using the risk parameters described
above. First, risk values from 1 to 5 were assigned as follows:
● Risks due to proximity to roads were added first, resulting in a map where risk values ranged
from 1 to 5.

Risk Based Methodology for Assessing Avoided Deforestation with application in ICF Forest Programmes in southern Ghana
Ecometrica | University of Edinburgh
12
● Areas denoting risk based on proximity to past deforestation (derived from the density map)
were assigned values 1 to 5.
● Risk values derived from distance from populated areas of different sizes were assigned values 1
to 5.
These layers were added to obtain a map of combined risk values for risk due to accessibility and
cultivability. The resulting map contained risk values of between 3 and 15. The values were then
classified into 5 classes using a quantile classification (see Fig 8).
.
Figure 8: Risk classes derived from combined risk due to past deforestation, roads and populated places.
This combined risk map was then adjusted to take into account the effect of protected areas:
Risk values in areas under protection were re-assigned to lowest risk (i.e. risk value 1), while buffer
zones within protected areas were assigned one risk value lower than their risk due to roads and
past deforestation. As a last step, the final risk map was overlain by the forest extent map to show
the risk categories for forest areas (see Fig. 10).

Risk Based Methodology for Assessing Avoided Deforestation with application in ICF Forest Programmes in southern Ghana
Ecometrica | University of Edinburgh
13
Figure 10: Risk of deforestation map for forested areas in the southern regions of Ghana, based on protection status of lands,
past deforestation, population densities and threat of access to forests by road. High risk areas are represented in red, while
low risk areas are in green. All protected areas were assigned the lowest risk value of 1

Risk Based Methodology for Assessing Avoided Deforestation with application in ICF Forest Programmes in southern Ghana
Ecometrica | University of Edinburgh
14
6 NOTE ON FURTHER WORK
Risk assessment is an inexact science as the drivers of land use change can vary according to economic
trends, new policy developments and environmental changes (droughts, floods, etc).
The ACEU methods of risk classification could incorporate finer scale data as this becomes available for
the area as a whole, and further refined with local inputs and weightings for existing or additional
deforestation drivers. However, there is a danger of attempting to create fine scale risk assessments in
situations that are inherently unpredictable.
Of the 3 case study sites, recent and accurate data for Ghana was least accessible. Data on forest extent,
protection level, and National Inventory layers which include the proportion of economic and non-
economic tree species for each reserve was requested from the Resource Management Support Centre
(RMSC) in Kumasi. It is recommended the forest extent data, protection levels and proportion of
economic and non-economic tree species for each reserve are used to improve the risk mapping and risk
map extent. Areas prone to flooding and proximity to rivers may also be an important risk of forest loss,
and can be included in improvements to the risk map although this would be dependent on the
availability of relevant datasets. It is also suggested that more accurate and finer detail roads data,
either locally sourced or based on a combination of OpenStreetMap and high resolution imagery be
included in subsequent maps.