Risk Assessment of 3D Printers and 3D Printed Products · Environmental Protection Agency / Risk...
90
Risk Assessment of 3D Printers and 3D Printed Products Survey of chemical substances in consumer products No. 161 May 2017
Transcript of Risk Assessment of 3D Printers and 3D Printed Products · Environmental Protection Agency / Risk...
Risk Assessment of 3D Printers and 3D Printed Products
Survey of chemical substances in consumer products No. 161 May 2017
2 Environmental Protection Agency / Risk Assessment of 3D Printers and 3D Printed Products
Publisher: The Danish Environmental Protection Agency Editors: Eva Jacobsen, DTI Inge Bondgaard Nielsen, DTI Jeanette Schjøth-Eskesen, DTI Christian Holst Fischer, DTI Poul Bo Larsen, DHI Denmark Dorthe Nørgaard Andersen, DHI Denmark ISBN: 978-87-93614-00-0 Disclaimer - When the occasion arises, the Danish Environmental Protection Agency will publish reports and papers concerning research and development projects within the environmental sector, financed by study grants provided by the Danish Environmental Protection Agency. It should be noted that such publications do not necessarily reflect the position o opinion of the Danish Environmental Protection Agency. However, publication does indicate that, in the opinion of the Danish Environmental Protection Agency, the content represents an important contribution to the debate surrounding Dani environmental policy. Sources must be acknowledged
Environmental Protection Agency / Risk Assessment of 3D Printers and 3D Printed Products 3
Contents
Preface 5
Summary and Conclusion 6
1. Introduction 11 1.1 Background and objective 11 1.2 Delimitation 11
2. 3D printed products, techniques and materials 13 2.1 3D printed products and files 13 2.2 3D printing techniques 13 2.2.1 Fused Deposition Modeling (FDM) 14 2.2.2 Stereolithography (SLA) 14 2.2.3 Selective Laser Sintering (SLS) 15 2.3 Materials for 3D printing by FDM, SLA and SLS 15
3. Literature review 17 3.1 Literature search concerning emissions from 3D printers 17 3.1.1 Data obtained during the literature search concerning emissions 17 3.1.1.1 Chemical emissions 20 3.1.1.2 Particle emissions 22 3.2 Literature reading concerning migration from 3D printed products 24 3.2.1 Literature search concerning migration 24 3.2.2 Data obtained from literature search on migration 25
4. Exposure scenarios 28 4.1 Exposure scenario for emissions from the printing process 28 4.1.1 Exposure scenario with particles, inhalation 29 4.1.2 Exposure scenario for volatile chemical substances/vapours, inhalation 31 4.2 Exposure scenarios regarding the use of printed products 33
5. Analyses 36 5.1 Choice of 3D printing techniques and 3D printing material 36 5.1.1 Materials for the 3D printing technique called FDM 36 5.1.2 Materials for the 3D printing technique called SLA 37 5.1.3 Materials for the 3D printing technique SLS 37 5.1.4 Documentation of the 3D printing materials 37 5.2 Choice of 3D print files 38 5.3 Choice of analysis programme 38 5.4 Methods for analyses of content 40 5.4.1 Analysis of selected metals by ICP-MS 40 5.4.2 Screening analyses by GC-MS 40 5.5 Results of analyses of content 41 5.5.1 Results of metals 41 5.5.2 Summary of analysis results of metals 45
4 Environmental Protection Agency / Risk Assessment of 3D Printers and 3D Printed Products
5.5.3 Results of screening analyses of volatile and semi-volatile organic substances (VOC and SVOC) 46
5.5.4 Summary of analysis results for VOC and SVOC 54 5.6 Migration tests 56 5.6.1 Selection of samples for migration test 56 5.6.2 Methods for migration testing 57 5.6.3 Analysis methods used for migration liquids 58 5.6.4 Results of the migration tests 59 5.6.5 Summary of results for migration tests 65
6. Exposure assessment 66 6.1 Scenario regarding exposure when printing 66 6.1.1 Exposure to particles 66 6.1.1.1 Particle number, ultrafine particles 66 6.1.1.2 Particle mass 66 6.1.2 Exposure to volatile chemical substances 67 6.2 Exposure scenario resulting from migration from printed item 68
7. Hazard and risk assessment 70 7.1 Hazard assessment 70 7.1.1 Particles 70 7.1.2 Screening of emission relevant substances as regards health 71 7.1.3 Screening of migrating substances as regards health 74 7.2 Risk assessment 75 7.2.1 Inhalation during the 3D printing process 76 7.2.1.1 Assessment of inhalation of particles 76 7.2.1.2 Assessment of inhalation of vapour 76 7.2.1.3 Combination effects from inhalation 79 7.2.1.4 Uncertainties and limitations of the assessment 79 7.2.2 Assessment of the use of a 3D printed item 80 7.2.2.1 Assessment of the use of a 3D printed mug 80 7.2.2.2 Uncertainties and limitation regarding the assessment 80 7.3 Conclusion 81
References 83
Glossary 87
Appendix 1. Literature search for migration from 3D printed products 88
Environmental Protection Agency / Risk Assessment of 3D Printers and 3D Printed Products 5
Preface
The project ”Risk Assessment of 3D Printers and 3D Printed Products” was carried out from March 2016 till December 2016. In 2016, the Danish Environmental Protection Agency published the following Danish report: Kortlægning samt fare- og ressourcevurdering af 3D-printere og 3D-printede artikler (Survey and Risk & Resource Assessment of 3D Printers and 3D Printed Products) (the Danish EPA, 2016c). The report initiated the risk assessment regarding consumer exposure when private consumers use 3D printers and 3D printed products. Danish Technological Institute (DTI) and DHI Denmark carried out the project for the Danish Environmental Protection Agency (the Danish EPA). The project steering committee consisted of the following participants: • Eva Jacobsen, Project Manager, Danish Technological Institute • Inge Bondgaard Nielsen, Danish Technological Institute • Poul Bo Larsen, DHI Denmark • Grete Lottrup Lotus, the Danish Environmental Protection Agency • Shima Dobel, the Danish Environmental Protection Agency The project was funded by the Danish Environmental Protection Agency.
6 Environmental Protection Agency / Risk Assessment of 3D Printers and 3D Printed Products
An increasing number of private consumers buy 3D printers and install them at home. Likewise, private consumers can make 3D printed products at several institutions (e.g., libraries) and shops, or order 3D printed products through homepages. In this project, an assessment has been made of the risk involved when using Fused Deposition Modeling (FDM) 3D printers. The assessment focused on emission and was made on the basis of existing literature. The project also contains an assessment of the risk involved when using 3D printed products. The assessment was made on the basis of a number of chemical analyses of selected materials printed by the 3D printing techniques called FDM, Stereolithography (SLA) and Selective Laser Sintering (SLS). The hazard and risk assessments were based on the results from the migration tests of the investigated 3D printed products. Literature study of emission from 3D printers Existing literature on emissions from FDM 3D printers was reviewed. During the literature review, data was identified about substances that are emitted during printing and the levels that can be obtained in the indoor air. Literature study of migration from 3D printed products A search was also carried out for literature concerning migration from 3D printed products, but no published studies were found that specifically investigate the migration of chemical substances from 3D printed products. Therefore, data was obtained from scientific literature regarding migration of chemical substances from materials that are comparable with the materials used for 3D printing. Special attention was paid to polylactic acid (PLA) and acrylonitrile-butadiene-styrene (ABS), as the main part of the materials used for 3D printing with the FDM technique were made of those types of plastics. Nylon and photoactive resin were also included as they are used for the 3D printing techniques SLS and SLA. Selection of 3D printing materials for chemical analyses When going through the literature and a number of safety data sheets for 3D printing materials it was investigated, which possible problematic constituents can appear in 3D printing materials. On that basis, 24 different 3D printing materials for 3D printing by the three different 3D techniques: FDM, SLA and SLS were selected. The 24 different 3D printing materials are distributed on:
• 9 PLA, 10 ABS and 1 polyethylene terephthalate (PET) for 3D printing by FDM • 3 photo reactive resins for 3D printing by SLA • 1 nylon for 3D printing by SLS
The 3D printing technique called FDM is the most frequently used 3D technique among private consumers as it is reasonably priced, and therefore the main focus in this project is on that 3D printing technique.
Summary and Conclusion
Environmental Protection Agency / Risk Assessment of 3D Printers and 3D Printed Products 7
Analysis programme for constituents Analyses of content were carried out for 15 selected metals on all 24 samples of 3D printing material. Screening analyses for volatile and semi-volatile organic substances (VOC and SVOC) were carried out by GC-MS on all 3D printing materials of resin, the sample of nylon and all samples of ABS, but only on 4 samples of PLA. In the light of the literature review it is not expected that PLA contains critical organic substances. Analysis results for metals In general, the metals that appear most frequently are copper and zinc. In 18 out of the 24 samples, copper was detected with a content of 0.2-110 mg/kg, and zinc was detected in 22 out of the 24 samples with a content of 0.6-25 mg/kg. The highest content of copper appears in the three 3D materials with blue colour, where the content is 15-110 mg/kg. Otherwise, there is no clear trend between the detected metals and the colour of the materials. If focus is on the most critical metals in relation to toxicity, then no sample contains cadmium or mercury in amounts above the detection limit, and for lead the content is between 0.1-0.7 mg/kg. Several of the samples contain chromium and tin, which might indicate a content of hexavalent chromium and organic tin, respectively. For chromium, the highest content of 52 mg/kg appears in the one sample of black PLA. Analysis results for VOC and SVOC 17 of the 24 3D printing materials were analysed for content of volatile and semi-volatile organic substances (VOC and SVOC) by GC-MS. Identification was solely carried out by means of a library with mass spectra, and some of the substances have uncertainty on the identification. Many different volatile and semi-volatile substances were detected in all samples except for the nylon sample of 3D print by SLS where only one single substance (azacyclotridecan-2-one) was detected. Especially in the resin samples and the ABS samples, many substances were detected. The substances typically recur within the groups of the individual types of 3D printing materials. For ABS, the screening analysis was supplemented with a specific analysis for styrene, PAH and selected phthalates, as they are known, possible constituents in ABS. In the samples of ABS, styrene was detected, but PAH and phthalates were not detected. Resin is the only 3D printing material in which a content of phthalate was detected. However, the phthalates were detected at very low levels (0.4-51 mg/kg). PAH was not detected in any of the analysed 3D printing materials. Migration tests of the 3D printed materials A decision was made to use project funding to carry out migration tests as simulation of exposure during the specific use, and therefore additional analyses were not carried out to obtain better identification of the detected constituents. On the basis of the results of the analyses of content and background knowledge about the materials, 17 3D printing materials were chosen for migration testing. The migration tests were carried out according to the methods for migration tests of toys, and the migration liquid was water according to EN 71-10:2006. From the 17 3D printing materials, migration of substances to the migration liquids was only detected in 2 of the samples, and they are the 2 resins based on methacrylated oligomers and monomers. The results show that more substances migrate from a black resin than from a clear resin. Three of the substances are methacrylates that might originate from the polymer. The function of the remaining substances is unknown.
8 Environmental Protection Agency / Risk Assessment of 3D Printers and 3D Printed Products
For the other 15 3D printing materials, no substances could be detected in the migration liquids above the detection limit. None of the detected substances from the analyses of content from the initial screening by GC-MS were detected in the migration liquids except for the substances from the two above-mentioned photo reactive resins. Exposure scenarios based on the literature studies of emission from 3D printers A decision was made to set up exposure scenarios partly for consumers during the 3D printing process where the user is exposed to particles and vapours that are generated during the printing process and emitted to the air, and partly for consumers who use 3D printed products. From the data found in the literature search, the exposure levels during printing were estimated for particle number (dominated by ultrafine particles under 100 nm in diameter), for particle mass, and for a total of 18 volatile components. Maximum average concentrations were estimated for the emitted components during 3D printing for 4 hours in a room of 20m3, and during short-term peak concentrations when staying close to the printer. The exposure scenarios i.a. comprised the following substances that could be identified as volatile main components from 3D printing with different materials:
PLA: lactide (up to 75% of the total emission) and (methyl metacrylate) ABS: styrene (up to 80% of the total emission) Nylon: caprolactam (app. 90% of the total emission)
However, there is uncertainty for the emission of methyl metacrylate, as that substance only has been reported from one reference. Lactide, styrene and caprolactam are all the respective monomers in the polymers. Emission of aldehydes (including formaldehyde) was also found when printing with PLA and ABS (however, only reported in one single reference). Exposure scenarios based on results from migration tests from 3D printed products Two scenarios were prepared regarding the use of a 3D printed product. A scenario where a baby was fed from a 3D printed mug three times a day, and a second scenario where a child under 3 years of age plays with a 3D printed toy and is exposed when sucking on the toy. The first scenario was regarded as most critical due to the much larger surface, from which a possible migration of hazardous substances could occur, and also due to the longer duration of migration (the time the food remained in the mug). On the basis of the analysis results for migration from a number of 3D printing materials, the exposure of the baby was calculated for the four components that were found to migrate in the largest amounts:
1-hydroxycyclohexyl phenyl ketone 2-hydroxyethyl methacrylate 2-hydroxypropyl methacrylate tetra(ethylene glycol) diacrylate
Hazard and risk assessment of emitted substances during 3D printing As a first step, a toxicologic screening was carried out of the components that according to literature were emitted to the air in the largest amounts during the printing process. The hazardous properties of the substances were partly identified from the hazard classification of the substances and also from the hazard assessments that already had been carried out on the substances (e.g., EU assessments in relation to health-based reference values for emission to the indoor climate (LCI values), and assessments carried out in connection with consumer projects of the Danish EPA). On the basis of that data, tolerable exposure levels (DNEL values) were derived for the substances in relation to 4 hours of average exposure and 15 minutes of exposure during peak concentrations, respectively.
Environmental Protection Agency / Risk Assessment of 3D Printers and 3D Printed Products 9
Most of the classified, emitted substances have been classified as either corrosive or skin, eye or respiratory irritants. These effects are the most critical for the calculation of the tolerable concentration in the air to protect against respiratory tract and eye irritation. For the substances where respiratory tract and eye irritation are the most critical effects (i.e., the emission components caprolactam, acetic acid, lactide, methyl metacrylate, formaldehyde, acetaldehyde, isoverladehyde), the tolerable exposure levels stated for the substances should be applied for 4 hours as well as for short-term exposure, as the irritation typically does not depend on the duration of the exposure, but rather on the actual level of exposure. For other substances such as styrene, ethylbenzene, tetrachloroethylene, fluoranthene and pyrene, irritation does not constitute the critical effects. Instead, neurotoxic effects, reproductive/developmental effects or carcinogenic effects were identified as the most critical effects for establishing tolerable exposure levels. For these substances, a tolerable exposure level during 4 hours of exposure is assessed as most relevant, as it is the total daily dose of the substance that is essential inducing the toxic responses. For the risk assessment of the scenario during the printing process, the risk characterisation ratio is calculated (RCR): RCR = exposure (µg/ m3) / DNEL (µg/m3) RCR values above 1 indicate that the exposure is above the tolerable DNEL level, and that the protection level is below the protection indicated by the DNEL. In other words, values above 1 express a potential risk. For values below 1, the exposure is lower than the tolerable DNEL level, and the exposure is regarded as acceptabe/tolerable in relation to a potential risk (i.e., no risk can be identified). From the calculated RCR values, values above 1 were only found for exposure to the substances caprolactam and formaldehyde. For formaldehyde (PLA print) the value of 1 is only exceeded (RCR = 1.9) in connection with short-term peak loads, whereas for caprolactam (nylon print) the level was exceeded during peak concentrations (RCR = 10) and during daily 4 hours of exposure (RCR = 3.7). If the accumulated exposure with the various irritative substances during printing is considered, and if the irritative contribution (meaning the RCR values) from the substances are added up, then there is a risk of respiratory tract and eye irritation from the PLA and ABS printing process, respectively. Unfortunately, it was not possible to carry out a risk assessment of the increased levels with ultrafine particles (measured as number of particles in the air), as the knowledge of the adverse effects from ultrafine particle numbers is too limited to estimate a tolerable exposure level. However, it is assessed that simultaneous exposure with increased levels of particles will intensify the effects related to respiratory tract irritation. For other types of effects and for other emission components, including styrene, the calculated RCR values did not indicate a risk of hazardous effects. Hazard and risk assessment when using 3D printed products For the substances identified in the migration tests, data for calculation of tolerable exposure levels was mainly found in data in the REACH registration of the substances. No information could be found about tolerable exposure levels anywhere else in literature. In the scenario, where a 3D printed mug is used for milk for a baby, RCR values substantially below 1 were obtained.
10 Environmental Protection Agency / Risk Assessment of 3D Printers and 3D Printed Products
Therefore, it is not assessed that a risk is connected with this scenario. Likewise, it is assessed that the scenario in which a child sucks on a 3D printed toy does not involve a risk. It should be emphasized that most 3D printing materials are not approved for use as food contact material, and therefore 3D printed products should in general not be used in connection with food contact. However, some 3D printing materials do have a declaration of conformity regarding use as food contact material. Conclusion of the hazard and risk assessments for emission during 3D printing and use of 3D printed products Based on the assessment it can be concluded that there may be a risk of respiratory tract and eye irritation from the emission of volatile substances and particles from the printing process when 3D printing with PLA, ABS and nylon. That especially applies to printing of a longer duration in small rooms with poor ventilation/airing. It is assessed that the risk is greatest during printing with nylon when caprolactam is emitted. When printing with PLA and ABS, the emission of aldehydes (however, only reported in one study) may increase the risk of respiratory tract and eye irritation. There does not seem to be a risk of other adverse effects due to the emission, including the emission of the main component styrene from ABS printing. For 3D printed products, the migration tests only found a migration of chemical substances from products printed by the SLA printing technique. In an actual consumer scenario where a printed mug was used for milk for a 1-year-old child, it is assessed that migration and exposure of the substances do not appear in levels that can lead to health-related risks. However, it should be emphasized that 3D printing materials, unless they have a declaration of conformity, in general are not regarded as suited for food contact materials, and therefore 3D printed products should not be used for food. The above risk assessment is based on a rather limited amount of data and on a toxicologic screening of the substances that are emitted in the largest amount. In order to give a more precise assessment, better and more systematic knowledge regarding emission and consumer exposure from the individual 3D printer and the individual 3D printing material is needed. An assessment of the durability/migration potential of the materials in different consumer scenarios for the 3D printed products is also needed. 3D printing materials are continuously developed and new material types are constantly marketed, and therefore the risk assessments in this report are limited to the investigated 3D printing materials and the available data.
Environmental Protection Agency / Risk Assessment of 3D Printers and 3D Printed Products 11
1. Introduction
The 3D printing technology is widespread within industry, and today 3D printers are an essential tool for many companies. Within recent years, 3D printers have become inexpensive and easy to use. This has led to an increased use of 3D printers and 3D printed products among private consumers. 1.1 Background and objective In 2015, a Danish report called ”Kortlægning samt fare- og ressourcevurdering af 3D-printere og 3D-printede artikler” (The Danish EPA, 2016) was prepared in a cooperation between the Danish Environmental Protection Agency (the Danish EPA) and Danish Technological Institute (DTI). The report surveyed how often private consumers use the 3D printing technology. The report also comprised a risk assessment that focused on the two basic materials: polylactic acid (PLA) and acrylonitrile-butadiene-styrene (ABS) in filaments for 3D printers that use the technique called Fused Deposition Modeling (FDM). An increasing number of private consumers buy 3D printers and install them at home. There are also several institutions (e.g., educational establishments and libraries) and shops where private consumers can use 3D printers and/or order 3D printed products. Likewise, a number of companies today market 3D printers and material/equipment, and the number of homepages with guidelines and print files for 3D printers and 3D printed products is also increasing. The objective of this current project was to obtain more knowledge about: • the chemical composition of 3D printing material. • the exposure of consumers to substances (via inhalation) that are emitted from 3D printers
during printing. • the exposure of consumers when using printed products. • to what extent consumers are exposed to a risk during printing and when using printed
products. 1.2 Delimitation This project focuses on exposure of private consumers during 3D printing and during use of 3D printed products. A private consumer is defined as a person who uses a 3D printed product for private use. In this project, the risk assessment of 3D printers focuses on the emission from Fused Deposition Modeling (FDM) 3D printers. The above-mentioned report ”Kortlægning samt fare- og ressourcevurdering af 3D-printere og 3D-printede artikler” (the Danish EPA, 2016c) clearly demonstrated that FDM technology is the 3D printing technique that is used most frequently in private homes. Existing literature was used to assess the risk connected with using a FDM 3D printer when focus is on emission. Besides making 3D prints at home, private consumers can order 3D printed products from 3D print suppliers on the internet. The previous survey (the Danish EPA, 2016c) showed that the 3D printing technique called FDM also is the technique that is used most often when private consumers order printed products. However, private consumers can purchase products from 3D print suppliers that are printed with other techniques, e.g., Stereolithography (SLA) and Selective Laser Sintering (SLS).

12 Environmental Protection Agency / Risk Assessment of 3D Printers and 3D Printed Products
The focus of this report is on the risk involved when using printed products made by means of FDM, SLA and SLS. The danger and risk assessments were based on the results from the chemical analysis and migration investigations of finished 3D printed products in selected plastic materials used for the 3D printing techniques FDM, SLA and SLS. Assessment of possible after-treatment of 3D printed products, e.g. colouring, does not form part of this project. In the exposure and risk assessment, focus was on the applications where the highest exposure of chemical substances must be expected.
Environmental Protection Agency / Risk Assessment of 3D Printers and 3D Printed Products 13
2. 3D printed products, techniques and materials
There are several different types of 3D printing techniques and materials, and the development of new techniques and materials is rapidly increasing. There is also a rapid development in the number of print files that are available to private consumers and that are used to make 3D products on the private consumers’ own printers. Likewise, it has become much easier to order products from a print supplier. This chapter presents the 3D printing techniques and 3D printing materials that were investigated in this project. A survey of all existing 3D printing techniques can be found in the report ”Kortlægning samt fare- og ressourcevurdering af 3D-printere og 3D-printede artikler” (the Danish EPA, 2016c). 2.1 3D printed products and files Today, several on-line databases for print files exist, among them Thingiverse (www.thingiverse.com), which is frequently used by 3D printer users. The database contains 3D print files that private consumers are likely to download, e.g. for the following products:
Articles for the bathroom: e.g., holders for toothbrushes, soap Stationary: e.g., writing utensils, card holders Kitchen utensils: e.g., funnels, juice presses, racks and stands, lids, cups Articles for pets: e.g., toys, water and food storage Fashion: e.g., jewellery, costumes, glasses, key rings Toys and games: e.g., figurines, pieces for games, dice, railway tracks Tools: e.g., clothes pegs
The print files can be downloaded for use on your own private printer or be sent to a print supplier. As appears from the above list, the 3D printed articles can be used for many different purposes. 2.2 3D printing techniques There are several different 3D printing techniques and they were studied in the report ”Kortlægning samt fare- og ressourcevurdering af 3D-printere og 3D-printede artikler” (the Danish EPA, 2016c). The report states that 3D printers based on the 3D printing technique FDM currently are the most widespread among private consumers. However, 3D printers based on SLA technology are expected to become more and more widespread among private consumers due to a decline in price and increased user friendliness. Via the internet, private consumers can order products printed with the 3D technologies FDM and SLA, but also other techniques such as SLS are offered when ordering prints. The 3D printing technique called FDM is used for all types of consumer products (e.g., cell phone holders, toys, plates, dog bowls). FDM printed products typically have a rough surface compared to SLA and SLS. SLA is often used if precision and details are requested (e.g., jewellery), whereas SLS is suited for products where good mechanical properties such as strength and flexibility are requested (the Danish EPA, 2016c). Prints of 3D products made by SLA and SLA are much more expensive than prints made by FDM.
14 Environmental Protection Agency / Risk Assessment of 3D Printers and 3D Printed Products
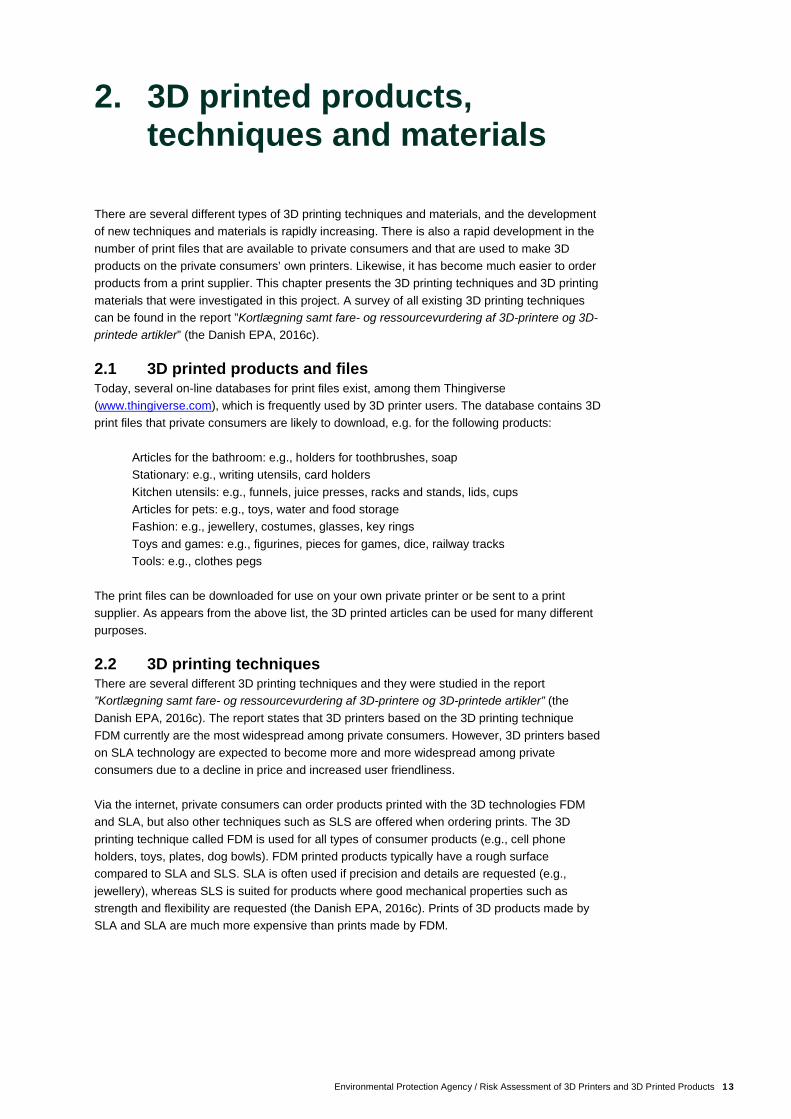
There are 3D printing techniques that are used to make products of metal, gypsum, wax and other material types (the Danish EPA, 2016c). However, it is assessed that mainly companies use such techniques and materials, and therefore this project is limited to comprise the 3D techniques FDM, SLA and SLS where plastic materials are used – with greatest focus on FDM. The three techniques are described in the following chapter. 2.2.1 Fused Deposition Modeling (FDM) FDM is a material extruding technique where the filament is heated in the print head on the 3D printer, which makes the material melt. FDM is also called FFF (Fused Filament Fabrication). The melted filament is deposited with great precision on a build platform. The article is created by depositing a layer on the previous layer, which fuses the layers together. That takes place by lowering the platform between each layer. Immediately after printing, the article can be used and/or receive finishing treatment. The extrusion temperature depends on the type of filament. For most of the materials, the temperature varies between 180 and 230°C (the Danish EPA, 2016c). The main materials for printing are thermoplastics, including PLA and ABS that are used as filaments with different thicknesses. The filaments are often purchased on coils, and the filaments are changed by the user of the printer. The various filaments can be used for all FDM 3D printers. The user of the 3D printer can change the temperature, which could result in the filaments being printed at the wrong temperatures. After-treatment can be mechanical (polishing) or chemical (solvents). Figure 1: Illustration of FDM.
ILLUSTRATION OF FUSED DEPOSITION MODELLING (FDM): THE PRINT HEAD (1) EXTRUDES THE
FILAMENTS (2) THAT ARE DEPOSITED ON THE CONTROLLED MOVABLE TABLE (3). SOURCE: WIKIPEDIA,
MADE BY USER ZUREKS UNDER CC ATTRIBUTION-SHARE ALIKE 4.0 INTERNATIONAL LICENSE.
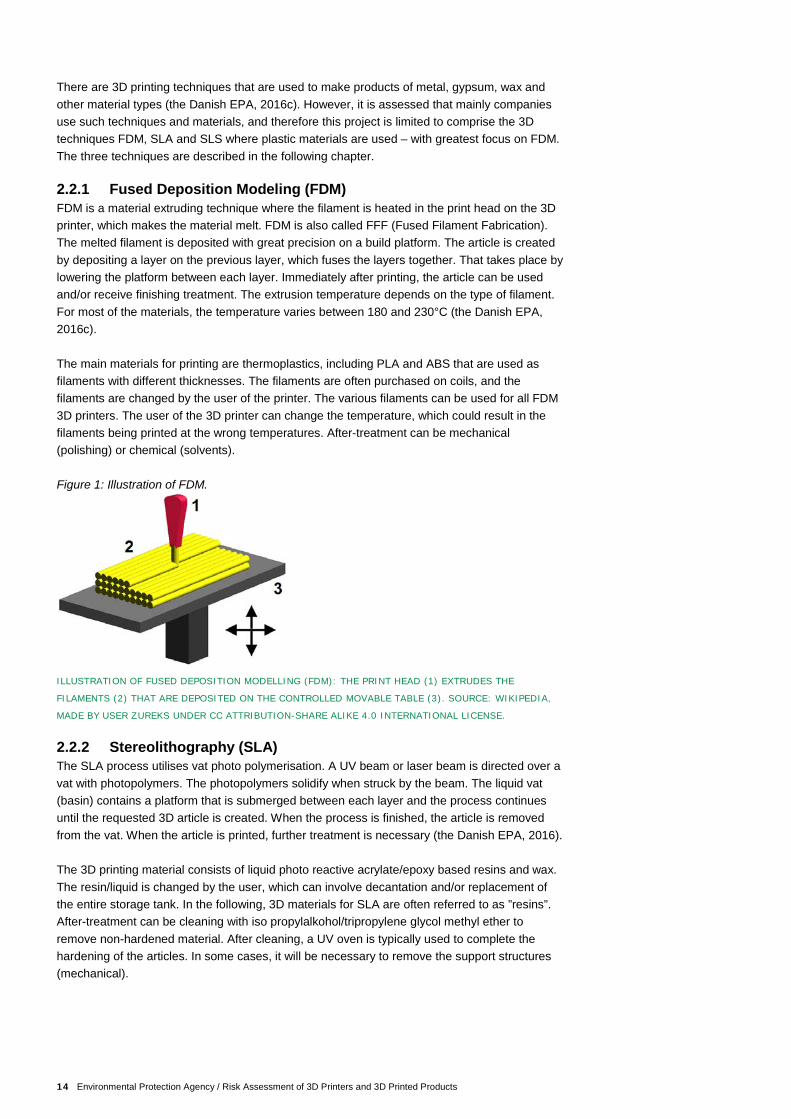
2.2.2 Stereolithography (SLA) The SLA process utilises vat photo polymerisation. A UV beam or laser beam is directed over a vat with photopolymers. The photopolymers solidify when struck by the beam. The liquid vat (basin) contains a platform that is submerged between each layer and the process continues until the requested 3D article is created. When the process is finished, the article is removed from the vat. When the article is printed, further treatment is necessary (the Danish EPA, 2016). The 3D printing material consists of liquid photo reactive acrylate/epoxy based resins and wax. The resin/liquid is changed by the user, which can involve decantation and/or replacement of the entire storage tank. In the following, 3D materials for SLA are often referred to as ”resins”. After-treatment can be cleaning with iso propylalkohol/tripropylene glycol methyl ether to remove non-hardened material. After cleaning, a UV oven is typically used to complete the hardening of the articles. In some cases, it will be necessary to remove the support structures (mechanical).
Environmental Protection Agency / Risk Assessment of 3D Printers and 3D Printed Products 15
Figure 2: Illustration of VAT photo polymerisation.
ILLUSTRATION OF VAT PHOTO POLYMERISATION: LASER BEAM USED TO SOLIDIFY LIQUID PHOTOPOLYMERS (PHOTO RESIN, YELLOW LIQUID). THE PLATFORM (Y PLATFORM) IS SUBMERGED BETWEEN EACH LAYER (WWW.LBORO.AC.UK ).
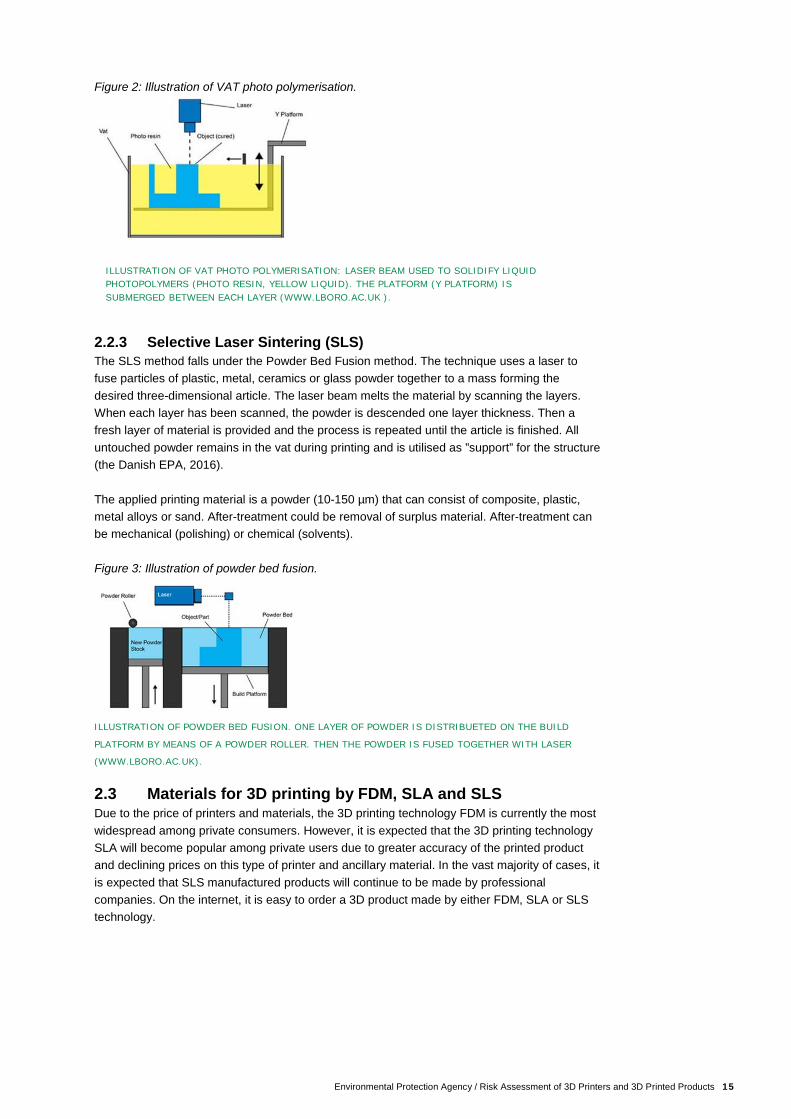
2.2.3 Selective Laser Sintering (SLS) The SLS method falls under the Powder Bed Fusion method. The technique uses a laser to fuse particles of plastic, metal, ceramics or glass powder together to a mass forming the desired three-dimensional article. The laser beam melts the material by scanning the layers. When each layer has been scanned, the powder is descended one layer thickness. Then a fresh layer of material is provided and the process is repeated until the article is finished. All untouched powder remains in the vat during printing and is utilised as ”support” for the structure (the Danish EPA, 2016). The applied printing material is a powder (10-150 µm) that can consist of composite, plastic, metal alloys or sand. After-treatment could be removal of surplus material. After-treatment can be mechanical (polishing) or chemical (solvents). Figure 3: Illustration of powder bed fusion.
ILLUSTRATION OF POWDER BED FUSION. ONE LAYER OF POWDER IS DISTRIBUETED ON THE BUILD
PLATFORM BY MEANS OF A POWDER ROLLER. THEN THE POWDER IS FUSED TOGETHER WITH LASER
(WWW.LBORO.AC.UK).
2.3 Materials for 3D printing by FDM, SLA and SLS Due to the price of printers and materials, the 3D printing technology FDM is currently the most widespread among private consumers. However, it is expected that the 3D printing technology SLA will become popular among private users due to greater accuracy of the printed product and declining prices on this type of printer and ancillary material. In the vast majority of cases, it is expected that SLS manufactured products will continue to be made by professional companies. On the internet, it is easy to order a 3D product made by either FDM, SLA or SLS technology.
16 Environmental Protection Agency / Risk Assessment of 3D Printers and 3D Printed Products
The report ”Kortlægning samt fare- og ressourcevurdering af 3D-printere og 3D-printede artikler” (the Danish EPA, 2016c) states that mainly filaments with PLA or ABS are currently being used as basic material for FDM. However, a number of special filaments that partly consist of other basic materials (i.a., high impact polystyrene, polyethylene terephthalate, nylon) are gaining ground on the market. According to the report, the general knowledge of the chemical composition of the filaments and possible additives is very limited. The safety datasheets for both PLA and ABS based filaments state that additives have been added, but only limited information is available on the chemical identity of the specific additives. In general, the information indicates that the applied additives come within the categories and substances that also are used in more traditional polymer applications (colours, antioxidants, antistatic agents, release and processing agents). Liquid acrylates/epoxy based resins are used for the 3D printing technology called SLA. The safety datasheets for these materials often only contain limited information, and in many cases, neither the individual constituents nor the relations between the constituents have been stated. For SLS 3D printers, this project focuses on the material nylon that most frequently is offered to private consumers when ordering 3D products via the internet. The materials used for 3D printers are made by many different manufacturers, and the materials have different physical-chemical properties, including hardness, flexibility, colour etc., which are of importance to the constituents in the various materials. The exact composition of many of the filaments is confidential, and therefore information about the formulation of the filaments is to a certain degree unknown or not accessible to private consumers. Declarations exist for some materials regarding agreement with application for, e.g., food contact and toys, but not for them all.
Environmental Protection Agency / Risk Assessment of 3D Printers and 3D Printed Products 17
3. Literature review
A review was carried out of existing literature concerning the emission from FDM 3D printers and migration from products printed on FDM, SLA and SLS 3D printers. The objective was to procure data for risk assessment of emissions when using FDM 3D printers, and to identify relevant substances in order to choose an analysis programme for 3D printing materials. The literature was identified by a number of search words on various search machines (Google, Google Scholar) and databases of scientific literature (Science Direct, Springerlink). 3.1 Literature search concerning emissions from 3D printers The overall objective of this part of the project was to go through existing literature concerning emissions from FDM 3D printers. During the literature review, data was identified about substances that are emitted during printing and about the levels that can be obtained in the air. As a starting point in the project, the Danish EPA had from their own data search procured four investigations concerning emission measurements from 3D printers. The investigations are described under the references 1-5 in Table 1, see 3.1.11. In order to investigate if any additional literature exists, a web based search was carried out from the following combination of search words: 3D-printer + exposure 3D-printer + emission 3D-printer + VOC 3D-printer + particles 3D-printer + indoor (air) 3D-printer + the name of the authors of the articles The literature lists in the found literature were also studied. The additional searches unambiguously referred to the four references found by the Danish EPA. That indicates that those articles must be the first articles that have investigated the area of emission. At the same time, it should be noted that the articles have received a lot of attention as many hits refer to the articles. During the search, only one additional reference was found of Afshar-Mohajer et al. (2015) where measurements had been carried out of the emission from a 3D printer (binder jetting technique) (see reference 5 in Table 1). 3.1.1 Data obtained during the literature search concerning emissions Data from the five investigations concerning chemical emissions and particle emissions from 3D printers is listed in Table 1.
18 Environmental Protection Agency / Risk Assessment of 3D Printers and 3D Printed Products
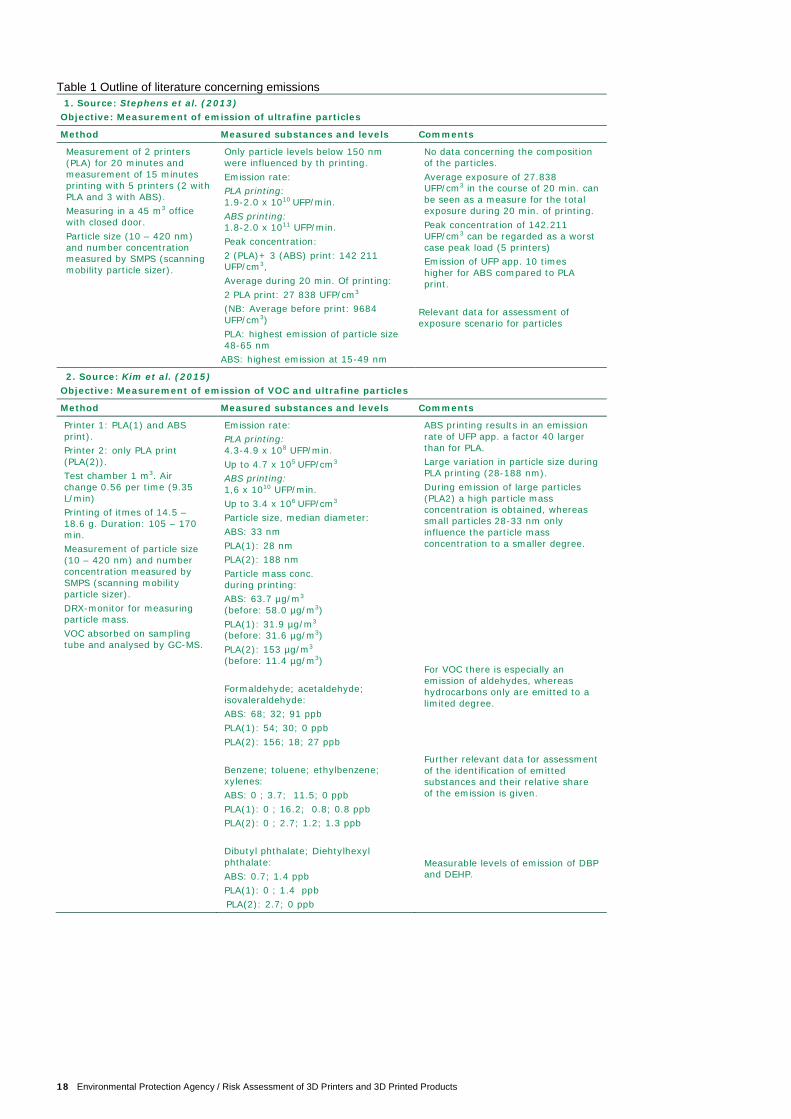
Table 1 Outline of literature concerning emissions
1. Source: Stephens et al. (2013) Objective: Measurement of emission of ultrafine particles
Method Measured substances and levels Comments Measurement of 2 printers (PLA) for 20 minutes and measurement of 15 minutes printing with 5 printers (2 with PLA and 3 with ABS). Measuring in a 45 m3 office with closed door. Particle size (10 – 420 nm) and number concentration measured by SMPS (scanning mobility particle sizer).
Only particle levels below 150 nm were influenced by th printing. Emission rate: PLA printing: 1.9-2.0 x 10¹⁰ UFP/min. ABS printing: 1.8-2.0 x 10¹¹ UFP/min. Peak concentration: 2 (PLA)+ 3 (ABS) print: 142 211 UFP/cm3, Average during 20 min. Of printing: 2 PLA print: 27 838 UFP/cm3 (NB: Average before print: 9684 UFP/cm3) PLA: highest emission of particle size 48-65 nm
ABS: highest emission at 15-49 nm
No data concerning the composition of the particles. Average exposure of 27.838 UFP/cm3 in the course of 20 min. can be seen as a measure for the total exposure during 20 min. of printing. Peak concentration of 142.211 UFP/cm3 can be regarded as a worst case peak load (5 printers) Emission of UFP app. 10 times higher for ABS compared to PLA print.
Relevant data for assessment of exposure scenario for particles
2. Source: Kim et al. (2015) Objective: Measurement of emission of VOC and ultrafine particles Method Measured substances and levels Comments Printer 1: PLA(1) and ABS print). Printer 2: only PLA print (PLA(2)). Test chamber 1 m3. Air change 0.56 per time (9.35 L/min) Printing of itmes of 14.5 – 18.6 g. Duration: 105 – 170 min. Measurement of particle size (10 – 420 nm) and number concentration measured by SMPS (scanning mobility particle sizer). DRX-monitor for measuring particle mass. VOC absorbed on sampling tube and analysed by GC-MS.
Emission rate: PLA printing: 4.3-4.9 x 10⁸ UFP/min. Up to 4.7 x 10⁵ UFP/cm3 ABS printing: 1,6 x 10¹⁰ UFP/min. Up to 3.4 x 10⁶ UFP/cm3 Particle size, median diameter: ABS: 33 nm PLA(1): 28 nm PLA(2): 188 nm Particle mass conc. during printing: ABS: 63.7 µg/m3 (before: 58.0 µg/m3) PLA(1): 31.9 µg/m3 (before: 31.6 µg/m3) PLA(2): 153 µg/m3 (before: 11.4 µg/m3) Formaldehyde; acetaldehyde; isovaleraldehyde: ABS: 68; 32; 91 ppb PLA(1): 54; 30; 0 ppb PLA(2): 156; 18; 27 ppb Benzene; toluene; ethylbenzene; xylenes: ABS: 0 ; 3.7; 11.5; 0 ppb PLA(1): 0 ; 16.2; 0.8; 0.8 ppb PLA(2): 0 ; 2.7; 1.2; 1.3 ppb Dibutyl phthalate; Diehtylhexyl phthalate: ABS: 0.7; 1.4 ppb PLA(1): 0 ; 1.4 ppb PLA(2): 2.7; 0 ppb
ABS printing results in an emission rate of UFP app. a factor 40 larger than for PLA. Large variation in particle size during PLA printing (28-188 nm). During emission of large particles (PLA2) a high particle mass concentration is obtained, whereas small particles 28-33 nm only influence the particle mass concentration to a smaller degree. For VOC there is especially an emission of aldehydes, whereas hydrocarbons only are emitted to a limited degree. Further relevant data for assessment of the identification of emitted substances and their relative share of the emission is given. Measurable levels of emission of DBP and DEHP.
Environmental Protection Agency / Risk Assessment of 3D Printers and 3D Printed Products 19
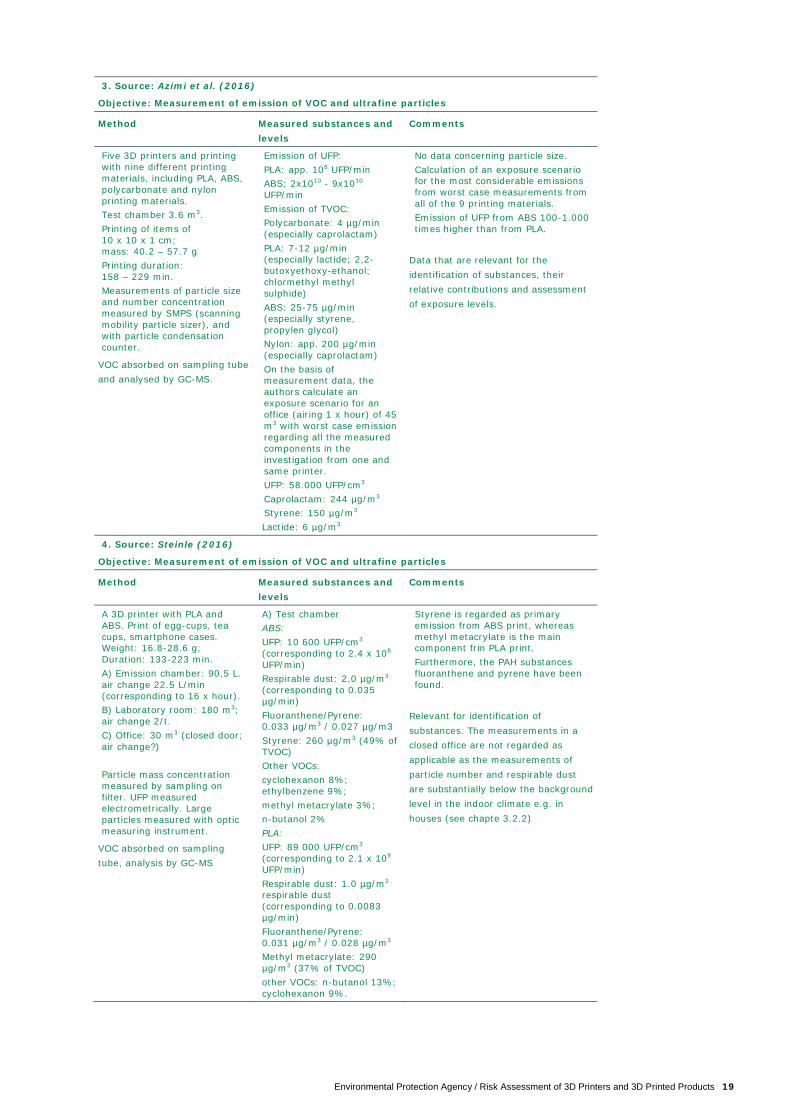
3. Source: Azimi et al. (2016)
Objective: Measurement of emission of VOC and ultrafine particles
Method Measured substances and levels
Comments
Five 3D printers and printing with nine different printing materials, including PLA, ABS, polycarbonate and nylon printing materials. Test chamber 3.6 m3. Printing of items of 10 x 10 x 1 cm; mass: 40.2 – 57.7 g Printing duration: 158 – 229 min. Measurements of particle size and number concentration measured by SMPS (scanning mobility particle sizer), and with particle condensation counter.
VOC absorbed on sampling tube and analysed by GC-MS.
Emission of UFP: PLA: app. 108 UFP/min ABS; 2x10¹⁰ - 9x10¹⁰ UFP/min Emission of TVOC: Polycarbonate: 4 µg/min (especially caprolactam) PLA: 7-12 µg/min (especially lactide; 2,2- butoxyethoxy-ethanol; chlormethyl methyl sulphide) ABS: 25-75 µg/min (especially styrene, propylen glycol) Nylon: app. 200 µg/min (especially caprolactam) On the basis of measurement data, the authors calculate an exposure scenario for an office (airing 1 x hour) of 45 m3 with worst case emission regarding all the measured components in the investigation from one and same printer. UFP: 58.000 UFP/cm3 Caprolactam: 244 µg/m3 Styrene: 150 µg/m3 Lactide: 6 µg/m3
No data concerning particle size. Calculation of an exposure scenario for the most considerable emissions from worst case measurements from all of the 9 printing materials. Emission of UFP from ABS 100-1.000 times higher than from PLA.
Data that are relevant for the identification of substances, their relative contributions and assessment of exposure levels.
4. Source: Steinle (2016)
Objective: Measurement of emission of VOC and ultrafine particles
Method Measured substances and levels
Comments
A 3D printer with PLA and ABS. Print of egg-cups, tea cups, smartphone cases. Weight: 16.8-28.6 g; Duration: 133-223 min. A) Emission chamber: 90.5 L. air change 22.5 L/min (corresponding to 16 x hour). B) Laboratory room: 180 m3; air change 2/t. C) Office: 30 m3 (closed door; air change?) Particle mass concentration measured by sampling on filter. UFP measured electrometrically. Large particles measured with optic measuring instrument.
VOC absorbed on sampling tube, analysis by GC-MS
A) Test chamber ABS: UFP: 10 600 UFP/cm3 (corresponding to 2.4 x 10⁸ UFP/min) Respirable dust: 2,0 µg/m3 (corresponding to 0.035 µg/min) Fluoranthene/Pyrene: 0.033 µg/m3 / 0.027 µg/m3 Styrene: 260 µg/m3 (49% of TVOC) Other VOCs: cyclohexanon 8%; ethylbenzene 9%; methyl metacrylate 3%; n-butanol 2% PLA: UFP: 89 000 UFP/cm3 (corresponding to 2.1 x 10⁹ UFP/min) Respirable dust: 1.0 µg/m3 respirable dust (corresponding to 0.0083 µg/min) Fluoranthene/Pyrene: 0.031 µg/m3 / 0.028 µg/m3 Methyl metacrylate: 290 µg/m3 (37% of TVOC) other VOCs: n-butanol 13%; cyclohexanon 9%.
Styrene is regarded as primary emission from ABS print, whereas methyl metacrylate is the main component frin PLA print. Furthermore, the PAH substances fluoranthene and pyrene have been found.
Relevant for identification of substances. The measurements in a closed office are not regarded as applicable as the measurements of particle number and respirable dust are substantially below the background level in the indoor climate e.g. in houses (see chapte 3.2.2)
20 Environmental Protection Agency / Risk Assessment of 3D Printers and 3D Printed Products
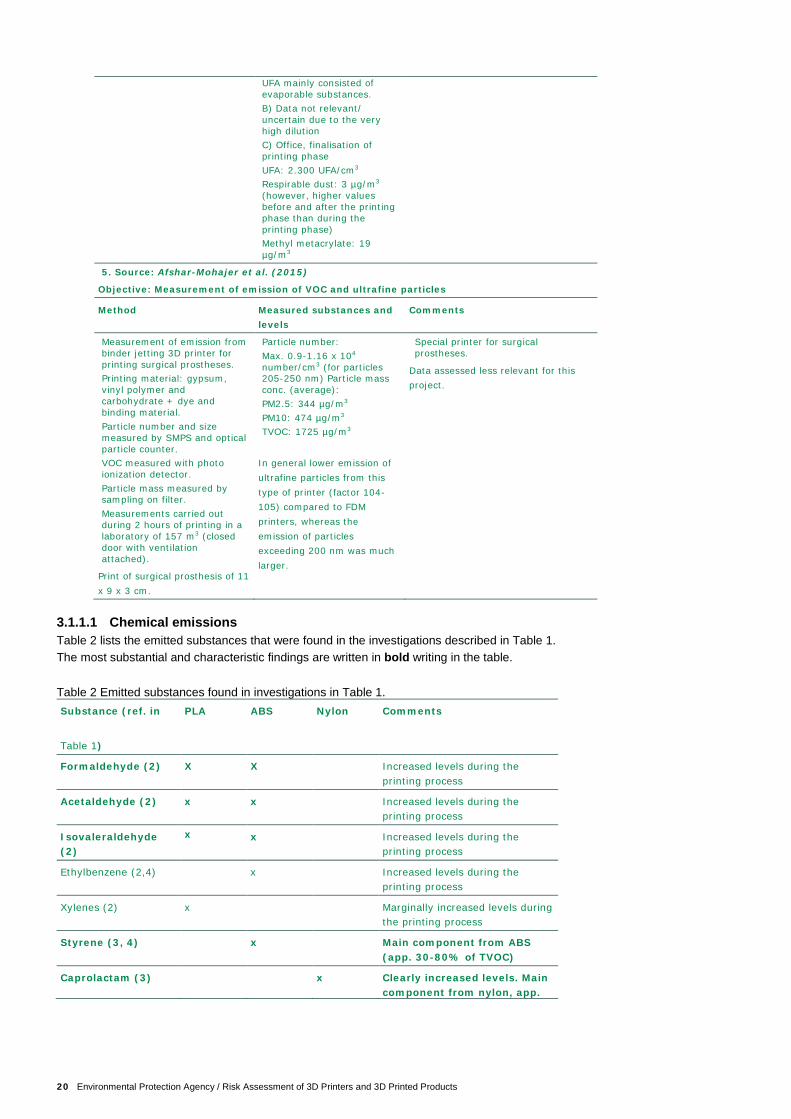
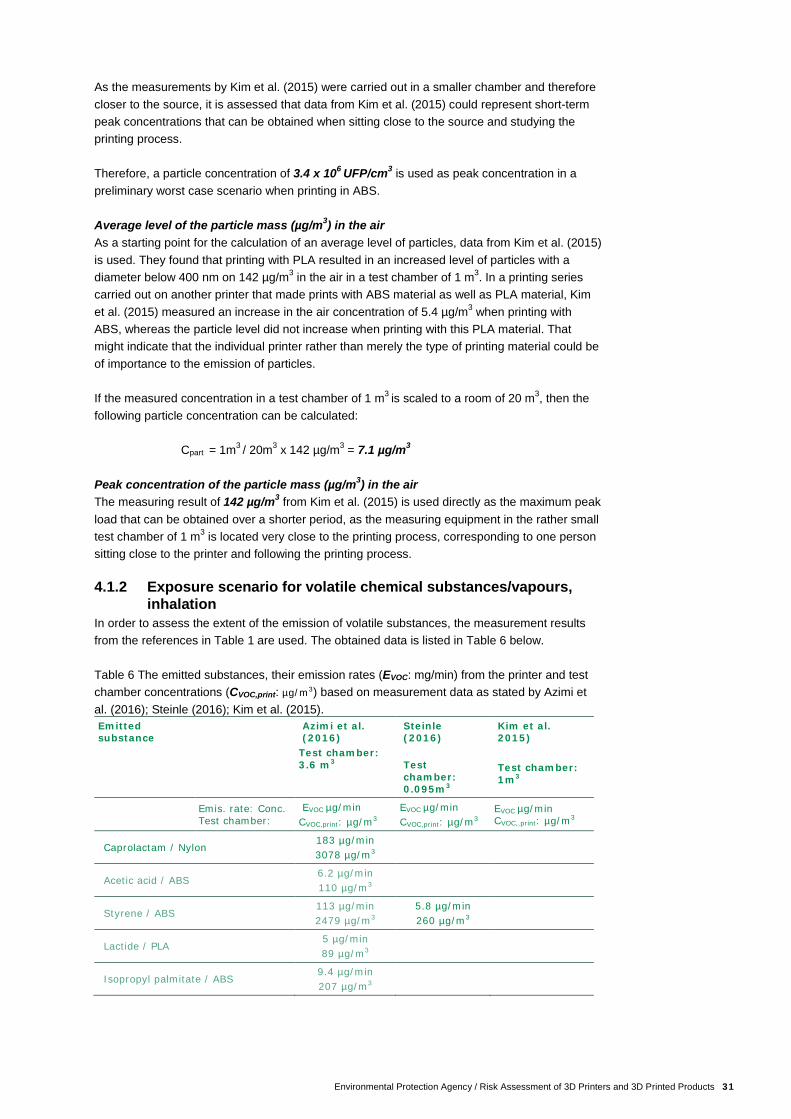
3.1.1.1 Chemical emissions Table 2 lists the emitted substances that were found in the investigations described in Table 1. The most substantial and characteristic findings are written in bold writing in the table. Table 2 Emitted substances found in investigations in Table 1. Substance (ref. in Table 1)
PLA ABS Nylon Comments
Formaldehyde (2) X X Increased levels during the printing process
Acetaldehyde (2) x x Increased levels during the printing process
Isovaleraldehyde (2)
x x Increased levels during the printing process
Ethylbenzene (2,4) x Increased levels during the printing process
Xylenes (2) x Marginally increased levels during the printing process
Styrene (3, 4) x Main component from ABS (app. 30-80% of TVOC)
Caprolactam (3) x Clearly increased levels. Main component from nylon, app.
UFA mainly consisted of evaporable substances. B) Data not relevant/ uncertain due to the very high dilution C) Office, finalisation of printing phase UFA: 2.300 UFA/cm3 Respirable dust: 3 µg/m3
(however, higher values before and after the printing phase than during the printing phase) Methyl metacrylate: 19 µg/m3
5. Source: Afshar-Mohajer et al. (2015)
Objective: Measurement of emission of VOC and ultrafine particles
Method Measured substances and levels
Comments
Measurement of emission from binder jetting 3D printer for printing surgical prostheses. Printing material: gypsum, vinyl polymer and carbohydrate + dye and binding material. Particle number and size measured by SMPS and optical particle counter. VOC measured with photo ionization detector. Particle mass measured by sampling on filter. Measurements carried out during 2 hours of printing in a laboratory of 157 m3 (closed door with ventilation attached).
Print of surgical prosthesis of 11 x 9 x 3 cm.
Particle number: Max. 0.9-1.16 x 10⁴ number/cm3 (for particles 205-250 nm) Particle mass conc. (average): PM2.5: 344 µg/m3 PM10: 474 µg/m3 TVOC: 1725 µg/m3
In general lower emission of ultrafine particles from this type of printer (factor 104-105) compared to FDM printers, whereas the emission of particles exceeding 200 nm was much larger.
Special printer for surgical prostheses.
Data assessed less relevant for this project.
Environmental Protection Agency / Risk Assessment of 3D Printers and 3D Printed Products 21
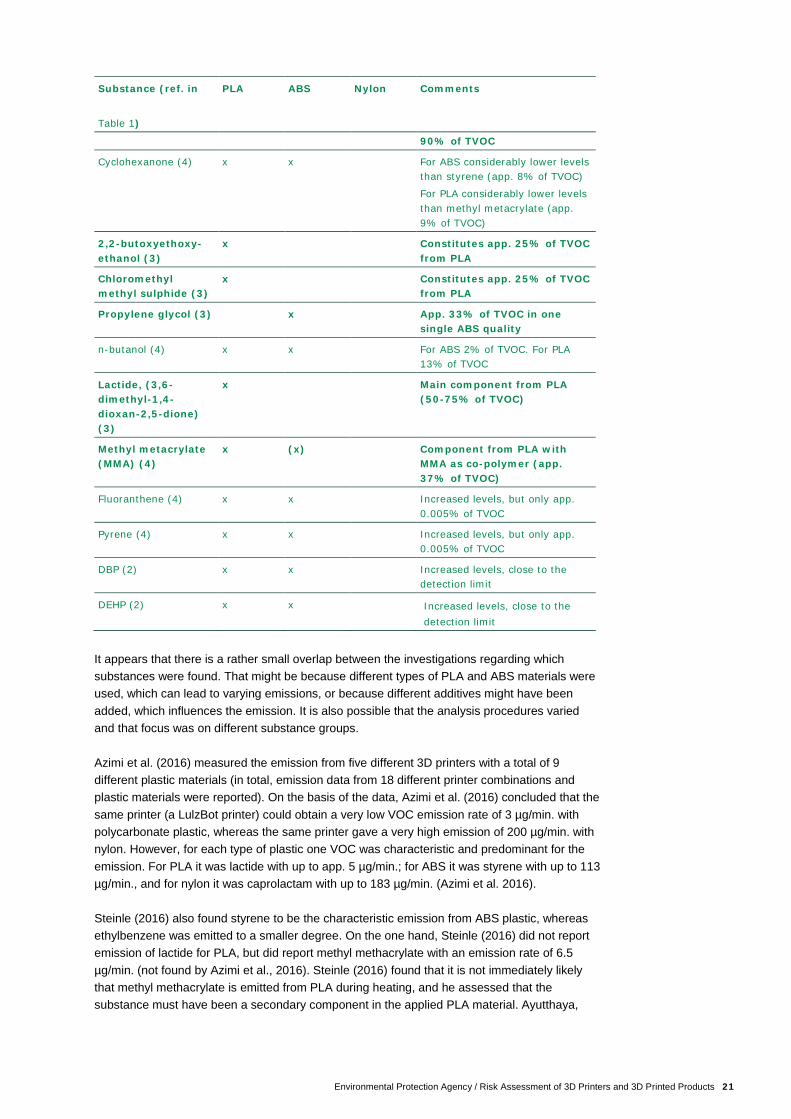
Substance (ref. in Table 1)
PLA ABS Nylon Comments
90% of TVOC
Cyclohexanone (4) x x For ABS considerably lower levels than styrene (app. 8% of TVOC)
For PLA considerably lower levels than methyl metacrylate (app. 9% of TVOC)
2,2-butoxyethoxy-ethanol (3)
x Constitutes app. 25% of TVOC from PLA
Chloromethyl methyl sulphide (3)
x Constitutes app. 25% of TVOC from PLA
Propylene glycol (3) x App. 33% of TVOC in one single ABS quality
n-butanol (4) x x For ABS 2% of TVOC. For PLA 13% of TVOC
Lactide, (3,6-dimethyl-1,4-dioxan-2,5-dione) (3)
x Main component from PLA (50-75% of TVOC)
Methyl metacrylate (MMA) (4)
x (x) Component from PLA with MMA as co-polymer (app. 37% of TVOC)
Fluoranthene (4) x x Increased levels, but only app. 0.005% of TVOC
Pyrene (4) x x Increased levels, but only app. 0.005% of TVOC
DBP (2) x x Increased levels, close to the detection limit
DEHP (2) x x Increased levels, close to the detection limit
It appears that there is a rather small overlap between the investigations regarding which substances were found. That might be because different types of PLA and ABS materials were used, which can lead to varying emissions, or because different additives might have been added, which influences the emission. It is also possible that the analysis procedures varied and that focus was on different substance groups. Azimi et al. (2016) measured the emission from five different 3D printers with a total of 9 different plastic materials (in total, emission data from 18 different printer combinations and plastic materials were reported). On the basis of the data, Azimi et al. (2016) concluded that the same printer (a LulzBot printer) could obtain a very low VOC emission rate of 3 µg/min. with polycarbonate plastic, whereas the same printer gave a very high emission of 200 µg/min. with nylon. However, for each type of plastic one VOC was characteristic and predominant for the emission. For PLA it was lactide with up to app. 5 µg/min.; for ABS it was styrene with up to 113 µg/min., and for nylon it was caprolactam with up to 183 µg/min. (Azimi et al. 2016). Steinle (2016) also found styrene to be the characteristic emission from ABS plastic, whereas ethylbenzene was emitted to a smaller degree. On the one hand, Steinle (2016) did not report emission of lactide for PLA, but did report methyl methacrylate with an emission rate of 6.5 µg/min. (not found by Azimi et al., 2016). Steinle (2016) found that it is not immediately likely that methyl methacrylate is emitted from PLA during heating, and he assessed that the substance must have been a secondary component in the applied PLA material. Ayutthaya,
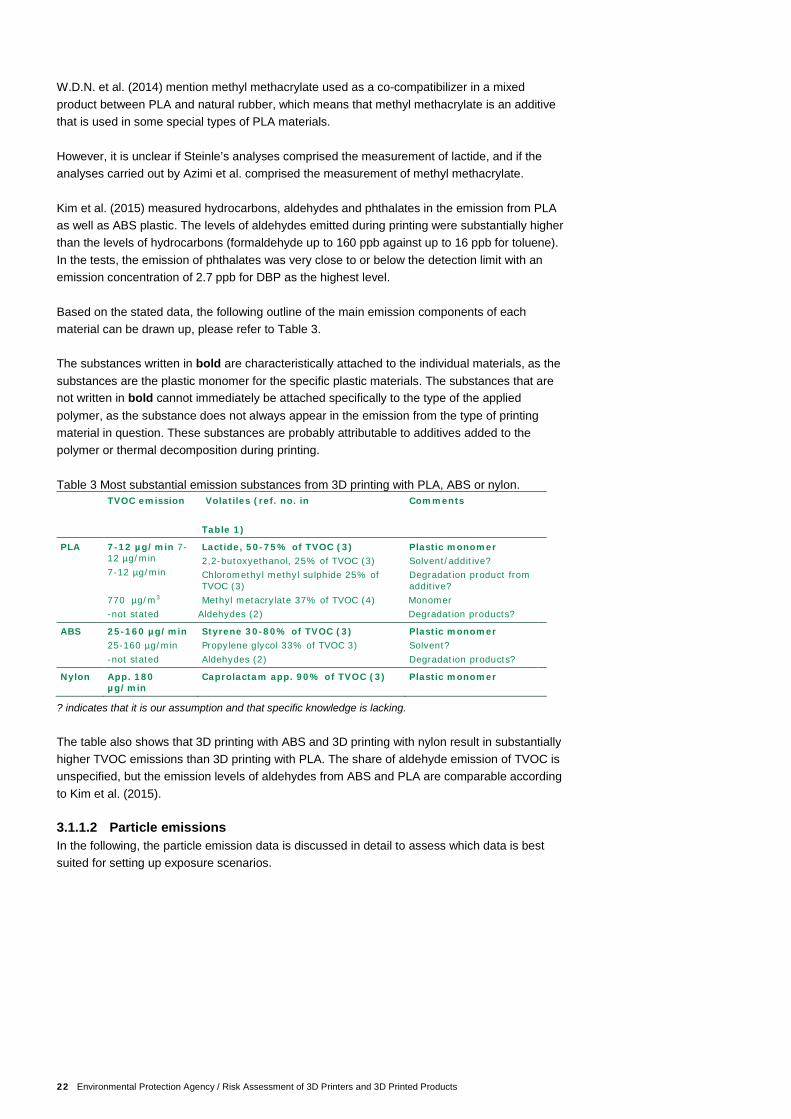
22 Environmental Protection Agency / Risk Assessment of 3D Printers and 3D Printed Products
W.D.N. et al. (2014) mention methyl methacrylate used as a co-compatibilizer in a mixed product between PLA and natural rubber, which means that methyl methacrylate is an additive that is used in some special types of PLA materials. However, it is unclear if Steinle’s analyses comprised the measurement of lactide, and if the analyses carried out by Azimi et al. comprised the measurement of methyl methacrylate. Kim et al. (2015) measured hydrocarbons, aldehydes and phthalates in the emission from PLA as well as ABS plastic. The levels of aldehydes emitted during printing were substantially higher than the levels of hydrocarbons (formaldehyde up to 160 ppb against up to 16 ppb for toluene). In the tests, the emission of phthalates was very close to or below the detection limit with an emission concentration of 2.7 ppb for DBP as the highest level. Based on the stated data, the following outline of the main emission components of each material can be drawn up, please refer to Table 3. The substances written in bold are characteristically attached to the individual materials, as the substances are the plastic monomer for the specific plastic materials. The substances that are not written in bold cannot immediately be attached specifically to the type of the applied polymer, as the substance does not always appear in the emission from the type of printing material in question. These substances are probably attributable to additives added to the polymer or thermal decomposition during printing. Table 3 Most substantial emission substances from 3D printing with PLA, ABS or nylon. TVOC emission Volatiles (ref. no. in
Table 1)
Comments
PLA 7-12 µg/min 7-12 µg/min 7-12 µg/min 770 µg/m3 -not stated
Lactide, 50-75% of TVOC (3) 2,2-butoxyethanol, 25% of TVOC (3) Chloromethyl methyl sulphide 25% of TVOC (3) Methyl metacrylate 37% of TVOC (4)
Aldehydes (2)
Plastic monomer Solvent/additive? Degradation product from additive?
Monomer Degradation products?
ABS 25-160 µg/min 25-160 µg/min -not stated
Styrene 30-80% of TVOC (3) Propylene glycol 33% of TVOC 3) Aldehydes (2)
Plastic monomer Solvent? Degradation products?
Nylon App. 180 µg/min
Caprolactam app. 90% of TVOC (3) Plastic monomer
? indicates that it is our assumption and that specific knowledge is lacking. The table also shows that 3D printing with ABS and 3D printing with nylon result in substantially higher TVOC emissions than 3D printing with PLA. The share of aldehyde emission of TVOC is unspecified, but the emission levels of aldehydes from ABS and PLA are comparable according to Kim et al. (2015). 3.1.1.2 Particle emissions In the following, the particle emission data is discussed in detail to assess which data is best suited for setting up exposure scenarios.
Environmental Protection Agency / Risk Assessment of 3D Printers and 3D Printed Products 23
Particle number concentrations The references in Table 1 show emissions and increased levels of ultrafine particles (that is, particles below 100 nm in diameter) when printing with PLA and ABS. In general, the emissions from ABS printing are substantially higher. Stephens et al. (2013) and Kim et al. (2015) state particle sizes from 15-49 nm for ABS and from 28-65 nm for PLA. However, Kim et al. (2015) state that the PLA particles from one printer had a median diameter of 188 nm. That means that there can be a considerable difference between the size of the particles depending on the applied printer and the applied printing material. In Table 1, the four references for PLA print state UFP emission rates of app. 108 UFP/min. to 2 x 10¹⁰ UFP/min. For ABS print, UFP emission rates are stated from 2.4 x 10⁸ UFP/min. to 2 x 10¹¹ UFP/min. Azimi et al. (2016) measured the greatest difference between the two materials, as emissions for PLA and ABS prints were measured to app. 108 UFP/min. and 9 x 10¹⁰ UFP/min., respectively. In an office of 45 m3, Stephen’s measured a peak concentration of app. 142,000 UFP/cm3 (during simultaneous printing of 2 PLA and 3 ABS items) and an average concentration of app. 28,000 UFP/cm3 when printing 2 PLA articles. Based on a measurement in a test chamber, Azimni et al. (2016) calculated a concentration of 58,000 UFP/cm3 in an office of 45 m3 when printing with ABS, whereas Steinle measured a level of 2,300-2,900 UFP/cm3 (particle size 7-400 nm). The latter is estimated to be very low as it is much lower than what was measured in private homes without a 3D printer. Based on 45 hours of continuous measurements in 56 Danish homes, Bekö et al. (2013) measured an average level of UFP of 15,600 UFP/cm3 for all homes. Therefore, data from Stephens et al. (2013) and Azimi et al. (2016) is considered the best starting point for assessment of the level of ultrafine particles in connection with 3D printing. Particle mass Only a few mass based particle emission measurements have been carried out (Kim et al., 2015 and Steinle, 2016). Kim et al. (2015) found a substantially increased particle mass concentration in connection with the PLA print that emitted a median particle size of 188 nm (printing resulted in an increased level in the test chamber from 11 to 153 µg/m3). PLA prints that emitted particles in the size of 28 nm led to no measurable increase (from 31.6 to 31.9 µg/m3), whereas ABS print resulted in an increase in particle content from 58.3 to 63.7 µg/m3. Steinle (2016) measured respirable dust (upper limit of particle size not stated) and could not detect an increase in the dust level during printing in an enclosed office of 30 m3. Data from Kim et al. (2015) where printing led to an increased particle level of 142 µg/m3 for one of the PLA materials might constitute a worst case estimate of the mass based particle emission. However, calculations based on that will be subject to great uncertainty as it is unknown how representative the data is as the study showed great variation in the particle mass concentration of the comprised 3D printing materials, and as additional data does not exist.
24 Environmental Protection Agency / Risk Assessment of 3D Printers and 3D Printed Products
3.2 Literature reading concerning migration from 3D printed products
The main objective of this part of the project was to review existing literature concerning migration from 3D printed products to identify relevant substances for further analysis. The literature search was limited to the four materials: ABS, PLA, resin and nylon. 3.2.1 Literature search concerning migration The literature search took place on various search machines such as Google and Google Scholar, and databases on scientific literature (Science Direct, Springerlink) by using specific words related to the migration of 3D prints and 3D printing material. That i.a. included the search words:
• PLA • ABS • Nylon • Resin • Migration • 3D printed object • 3D print • Microwave • Oven • Dishwasher
No published studies were found that specifically investigate the migration of chemical substances from 3D printed products. Therefore, data was obtained from scientific literature regarding migration of chemical substances from materials that are assessed to be comparable with the materials that are used for 3D printing. In this project, focus was on PLA and ABS plastics, as the main part of the materials used for 3D printing by FDM technology were made of those types of plastic. Nylon and photoactive resin were also included as they are used for SLS and SLA 3D printing. Appendix 1 outlines the most substantial results of the literature search and conclusions from selected scientific articles. They are also examined below in section 3.2.2. The articles were selected according to their relevance to this project. That means that the articles concern information about constituents or information about substances from different types of migration tests for materials that can be used for the most accessible 3D printing techniques. Articles with information about the content of additives in the materials, including metals and dyes, were also selected. The articles with a content that was relevant to this project (investigating 3D printed products) were chosen. The printing materials that are used for 3D printing with the FDM technique are made of small plastic granulates that have been extruded to long cables/coils. The same type of granulates are used for injection moulding, and therefore it is assessed that articles concerning migration from injection moulded materials might be relevant. However, it has not been possible to procure data regarding the chemical composition of the granulates during the literature search.
Environmental Protection Agency / Risk Assessment of 3D Printers and 3D Printed Products 25
In the course of the literature search, it was also chosen to search for information about how heating affects 3D printed products. During the glass transition temperature, Tg, of the material, a reversible change takes place in amorphous polymers or in amorphous regions in partly crystalline polymers from (or to) a hard and rather brittle condition to (or from) a viscous or rubbery condition (Stevens, 1999). During the glass transition temperature, the polymer properties change from glasslike to rubbery, which alters the plastic material significantly. The glass transition temperature, Tg, is 60 °C and 105 °C for PLA and ABS, respectively. Around these temperatures, the polymeric structure in the plastic materials will start to change. That means that additives and monomer residue can be emitted more easily if the temperature approaches or exceeds Tg, and the structure of the material is changed. These temperatures can for instance be obtained in a dishwasher or microwave oven. With a starting point in Tg it must be expected that emission of additives and monomer residue could take place at a much lower temperature for PLA compared to ABS. However, repeated heating below Tg is also expected to be able to influence changes in the polymer structure, and in that way the migration from ABS can be increased in the course of time. 3.2.2 Data obtained from literature search on migration As already mentioned, the literature search did not identify any investigations that specifically have examined the migration from 3D printing material or 3D printed products. Therefore, literature was procured that concerns migration from plastic materials in general. The literature search confirms that PLA as well as ABS plastics have been carefully investigated as, i.a., food contact materials, and that PLA and ABS plastic (that is not food contact material) can contain and emit other additives. In connection with the literature search, no migration data was found from resins. In the following chapters, the identified literature will be studied, and in Table 4, the possible problematic constituents have been listed with a starting point in the identified literature and in the study of a number of safety datasheets for 3D printing material. Abe et al., 2014, investigated 14 different volatile, organic substances that exist in ABS- produced plastic for kitchen equipment. In that connection, it was investigated, which volatile substances can migrate out of the plastic material. Styrene is often found as residue monomer in ABS plastic, and in the investigation of up to 2 mg/g styrene was detected in ABS plastic. The highest migration of styrene was 76 ng/cm2 where the migration procedure was static with 20% ethanol as food simulant at 60°C for 30 minutes. The article does not mention anything about the additives that are used in ABS plastic. Several books and articles about plastic materials have been published, e.g., PLA for use in food packaging (Cooke et al., 2011, Crompton, T.R., 2007 and Conn et al., 1995). Conn et al., 1995, carried out a safety assessment of PLA used for food packaging. The material itself was tested by looking at worst case extraction scenarios where the polymer was used in household articles and food packaging. The study showed that the migration values of the monomers are very low, and therefore it was concluded that PLA plastic can be used as food contact material. The study did not investigate migration rates of possible additives.
In 2015, the Dutch Consumer Agency for Food and Product Safety (Voedsel en Waren Autoriteit, 2015) monitored plastic toys to investigate the chemical composition and possible health risks of the materials. Out of 113 toys, 23% were made of ABS. The report states which constituents were detected in toys made of ABS, and they could be possible additives in ABS filament for 3D printing. The report states that a great number of substances were detected in the substance groups: alcohols, antioxidants, fatty acids and derivatives, flame-retardants, long-chained hydrocarbons, phenols, softeners, UV stabilizers, vulcanisation agents, other substances and monomers and oligomers. The analyses were carried out by gas chromatographic screening analyses; however, it is not stated how the substances were identified, and therefore the project will only be used for inspiration in this report.
26 Environmental Protection Agency / Risk Assessment of 3D Printers and 3D Printed Products
Stoffers et al., 2004, investigated the migration from nylon food packaging, as nylon is used as artificial skin for sausages. In connection with the study, the migration was investigated in water as well as oil, as nylon often is in contact with both. Stoffers et al., 2004, demonstrated that the monomer laurolactam in nylon 12 (the same material that can be used for 3D printing material) is emitted in the same way in an oil or water phase. The Norwegian Environment Agency (Hansen, E. et al., 2013) made an outline of the most utilized types of plastic, their properties and areas of application, and which dangerous chemicals are used in plastic. ABS is the only relevant plastic material for 3D printing that is mentioned in the report. The report only mentions residue monomers of styrene, UV stabilisers, dyes and flame-retardants, but does not mention specific substances. In 2014, the Danish EPA investigated problematic chemical substances in plastic (the Danish EPA no. 132, 2014) as a further investigation of the above-mentioned report from the Norwegian Environment Agency. The investigation does not describe 3D printed products, but plastic materials in general. As mentioned earlier, the plastic materials for 3D printers originate from the same type of granulates as the ones used to make plastic products in general. The report contains information about problematic substances in plastic, including information about the function and application of the plastic substances, their potential for migration, and destiny when reused. The report mentions problematic substances in ABS that, e.g., include brominated flame-retardants, UV stabilisers and the residue monomers called styrene and acrylonitrile. In addition, flame-retardants and residue monomers as well as aromatic amines are also mentioned as problematic in relation to nylon. The only problematic substances in PLA that are mentioned in the report are dye pigments, stabilisers and catalysts that in general are used in plastic.
In connection with the literature search, a number of discussion fora were identified, for instance quora.com and the homepages of the 3D print suppliers, on which risks involved when using 3D printed items for food packaging are discussed. The general attitude among users of these discussion fora is that 3D printed materials should not be used for food in cases where the material is heated or used to store hot food. Of course, it is recommended that consumers only should use 3D printing materials for contact with food, if a declaration of conformity exists and if occasion should arise only for the intended use.
Environmental Protection Agency / Risk Assessment of 3D Printers and 3D Printed Products 27
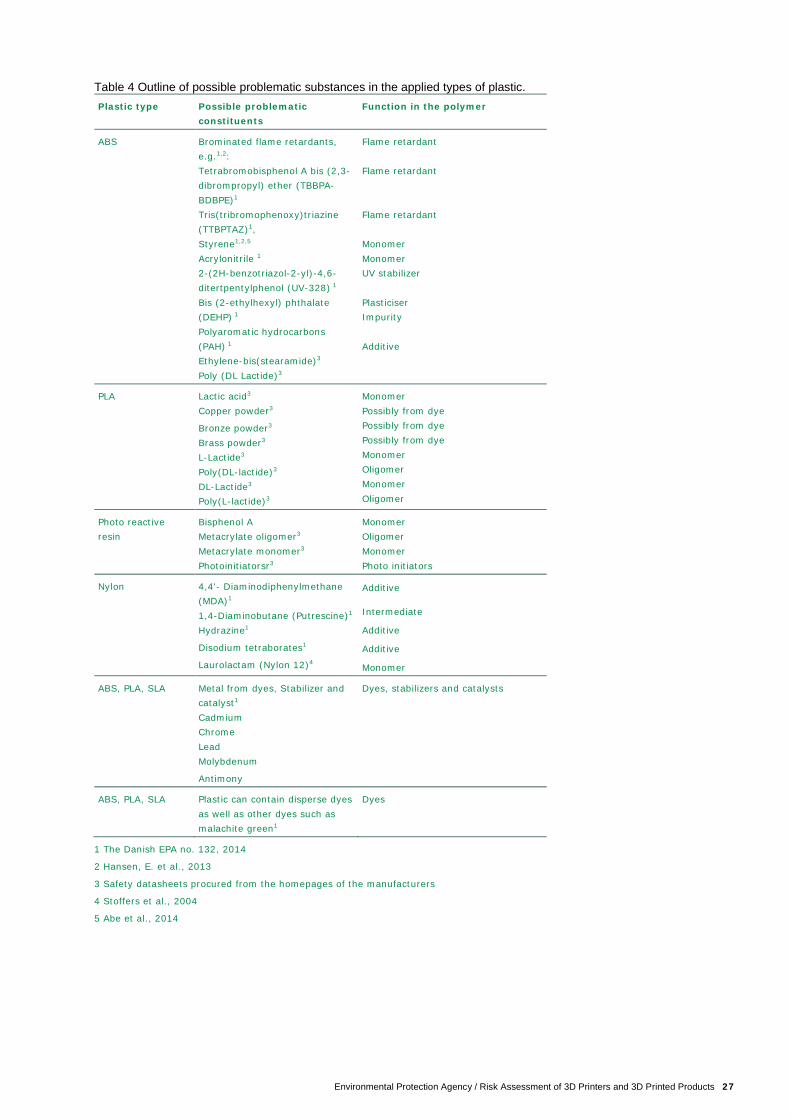
Table 4 Outline of possible problematic substances in the applied types of plastic. Plastic type Possible problematic
constituents Function in the polymer
ABS Brominated flame retardants, e.g.1,2: Tetrabromobisphenol A bis (2,3-dibrompropyl) ether (TBBPA-BDBPE)1 Tris(tribromophenoxy)triazine (TTBPTAZ)1, Styrene1,2,5 Acrylonitrile 1 2-(2H-benzotriazol-2-yl)-4,6-ditertpentylphenol (UV-328) 1 Bis (2-ethylhexyl) phthalate (DEHP) 1 Polyaromatic hydrocarbons (PAH) 1 Ethylene-bis(stearamide)3 Poly (DL Lactide)3
Flame retardant Flame retardant Flame retardant Monomer Monomer UV stabilizer Plasticiser Impurity Additive
PLA Lactic acid3 Copper powder3
Bronze powder3 Brass powder3 L-Lactide3 Poly(DL-lactide)3 DL-Lactide3 Poly(L-lactide)3
Monomer Possibly from dye Possibly from dye Possibly from dye Monomer Oligomer Monomer Oligomer
Photo reactive resin
Bisphenol A Metacrylate oligomer3 Metacrylate monomer3 Photoinitiatorsr3
Monomer Oligomer Monomer Photo initiators
Nylon 4,4'- Diaminodiphenylmethane (MDA)1 1,4-Diaminobutane (Putrescine)1 Hydrazine1
Disodium tetraborates1
Laurolactam (Nylon 12)4
Additive
Intermediate
Additive
Additive
Monomer
ABS, PLA, SLA Metal from dyes, Stabilizer and catalyst1 Cadmium Chrome Lead Molybdenum
Antimony
Dyes, stabilizers and catalysts
ABS, PLA, SLA Plastic can contain disperse dyes as well as other dyes such as malachite green1
Dyes
1 The Danish EPA no. 132, 2014
2 Hansen, E. et al., 2013
3 Safety datasheets procured from the homepages of the manufacturers
4 Stoffers et al., 2004
5 Abe et al., 2014
28 Environmental Protection Agency / Risk Assessment of 3D Printers and 3D Printed Products
4. Exposure scenarios
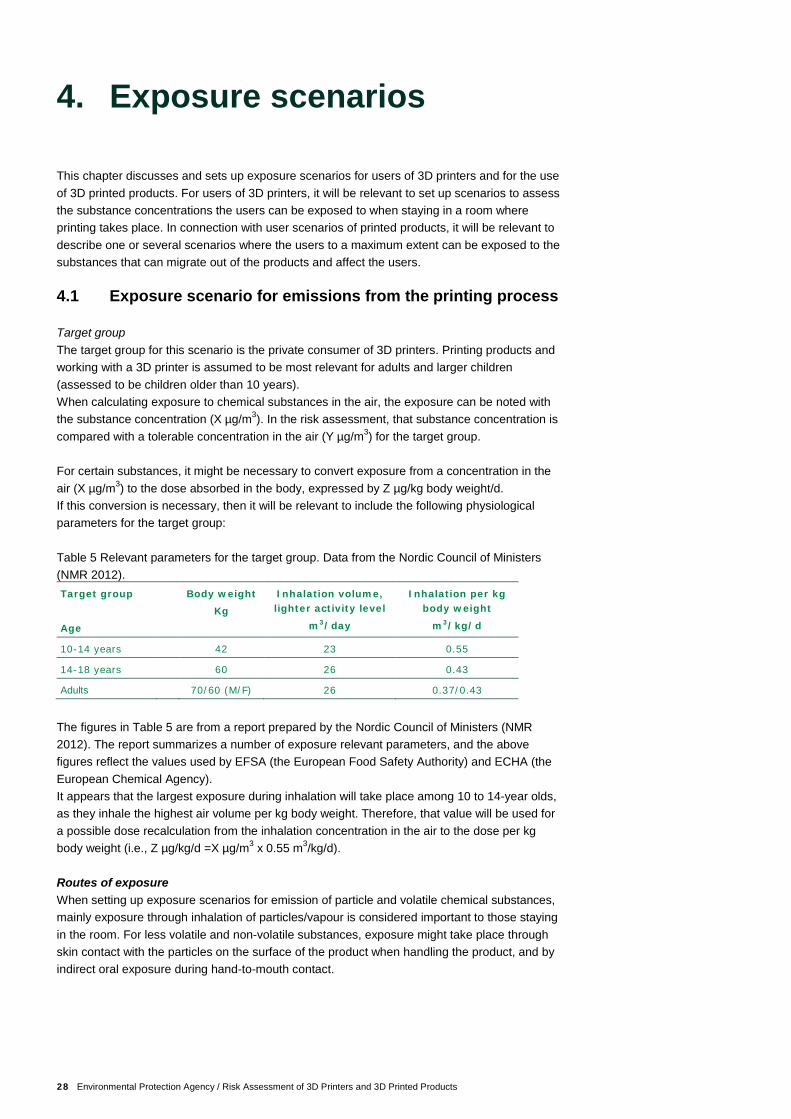
This chapter discusses and sets up exposure scenarios for users of 3D printers and for the use of 3D printed products. For users of 3D printers, it will be relevant to set up scenarios to assess the substance concentrations the users can be exposed to when staying in a room where printing takes place. In connection with user scenarios of printed products, it will be relevant to describe one or several scenarios where the users to a maximum extent can be exposed to the substances that can migrate out of the products and affect the users. 4.1 Exposure scenario for emissions from the printing process Target group The target group for this scenario is the private consumer of 3D printers. Printing products and working with a 3D printer is assumed to be most relevant for adults and larger children (assessed to be children older than 10 years). When calculating exposure to chemical substances in the air, the exposure can be noted with the substance concentration (X µg/m3). In the risk assessment, that substance concentration is compared with a tolerable concentration in the air (Y µg/m3) for the target group. For certain substances, it might be necessary to convert exposure from a concentration in the air (X µg/m3) to the dose absorbed in the body, expressed by Z µg/kg body weight/d. If this conversion is necessary, then it will be relevant to include the following physiological parameters for the target group: Table 5 Relevant parameters for the target group. Data from the Nordic Council of Ministers (NMR 2012). Target group Age
Body weight Kg
Inhalation volume, lighter activity level
m3/day
Inhalation per kg body weight
m3/kg/d
10-14 years 42 23 0.55
14-18 years 60 26 0.43
Adults 70/60 (M/F) 26 0.37/0.43
The figures in Table 5 are from a report prepared by the Nordic Council of Ministers (NMR 2012). The report summarizes a number of exposure relevant parameters, and the above figures reflect the values used by EFSA (the European Food Safety Authority) and ECHA (the European Chemical Agency). It appears that the largest exposure during inhalation will take place among 10 to 14-year olds, as they inhale the highest air volume per kg body weight. Therefore, that value will be used for a possible dose recalculation from the inhalation concentration in the air to the dose per kg body weight (i.e., Z µg/kg/d =X µg/m3 x 0.55 m3/kg/d). Routes of exposure When setting up exposure scenarios for emission of particle and volatile chemical substances, mainly exposure through inhalation of particles/vapour is considered important to those staying in the room. For less volatile and non-volatile substances, exposure might take place through skin contact with the particles on the surface of the product when handling the product, and by indirect oral exposure during hand-to-mouth contact.
Environmental Protection Agency / Risk Assessment of 3D Printers and 3D Printed Products 29
Inhalation In connection with inhalation, it is important to estimate the concentration of the substances the user is exposed to. Partly short peak concentrations and partly longer average concentrations of the substances are relevant for assessment .The calculated exposure levels (estimated in µg/m3) for these scenarios will in the risk assessment be compared to tolerable exposure levels for short- and long-term exposure. Regarding inhalation, it will be relevant to examine the briefly increased peak concentrations, e.g., if the printing process is closely examined for a shorter period (max. 15 min.), and the average concentration that can be obtained in the room during longer periods of printing (3-4 hours). In connection with the risk assessment, the obtained peak concentrations (expressed in µg/m3) can be compared against acute toxic levels of the substances. The average level during printing for 3-4 hours (expressed in µg/m3) can correspondingly be compared to tolerable long-term values of the substances (also expressed in µg/m3). Therefore, it will be relevant to assess/estimate, which peak concentrations of particles and emission components can be obtained during printing, and which average levels can be obtained in the room during the entire printing process. For exposure assessment of a printing scenario for private consumers, a starting point is taken in the use of a 3D printer in a room of 20 m3 (meaning a room of app. 8 m2) with an air exchange in the room of 0.5 times an hour. A room of that size has been used in other projects of the Danish EPA as a standard room in connection with exposure assessments and risk assessments (the Danish EPA, 2006, 2016a and 2016b, respectively). In connection with ordinary stay in the printing room, an exposure time of 4 hours is anticipated, which according to the references in Table 1 is regarded to be the upper limit of the duration of a printing process.
Data in the found literature, stated in Table 1, is studied in detail in chapter 4.1.1 to point out the most relevant data used to set up exposure scenarios.
Skin contact and oral exposure Skin contact and oral exposure during the printing process must be regarded as rather low compared to the use of the product during the user phase where a high degree of dermal or oral contact with the item can occur for certain applications. Oral exposure and exposure through skin contact are therefore regarded as more relevant and more serious when using printed products, see chapter 4.2. 4.1.1 Exposure scenario with particles, inhalation Characterisation of particles Stephens et al. (2013) and Kim et al. (2015) state particle sizes of 15-49 nm when printing with ABS and of 28-65 nm when printing with PLA. However, another study by Kim et al. (2015) states that the particles during printing with PLA had a median diameter of 188 nm. There can be a great difference between the size of the particles depending on which printer and printing material is used. Data for the ultrafine particles indicates that the particles mainly consist of volatile substances as Steinle et al. (2016) found a pronounced reduction in the number of ultrafine particles from before and after the particles had been exposed to heating (measurement after thermal desorption). For several particle sizes in the ultrafine area, the number was reduced to 1/10 - 1/1000 of the level that existed before thermal desorption.
30 Environmental Protection Agency / Risk Assessment of 3D Printers and 3D Printed Products
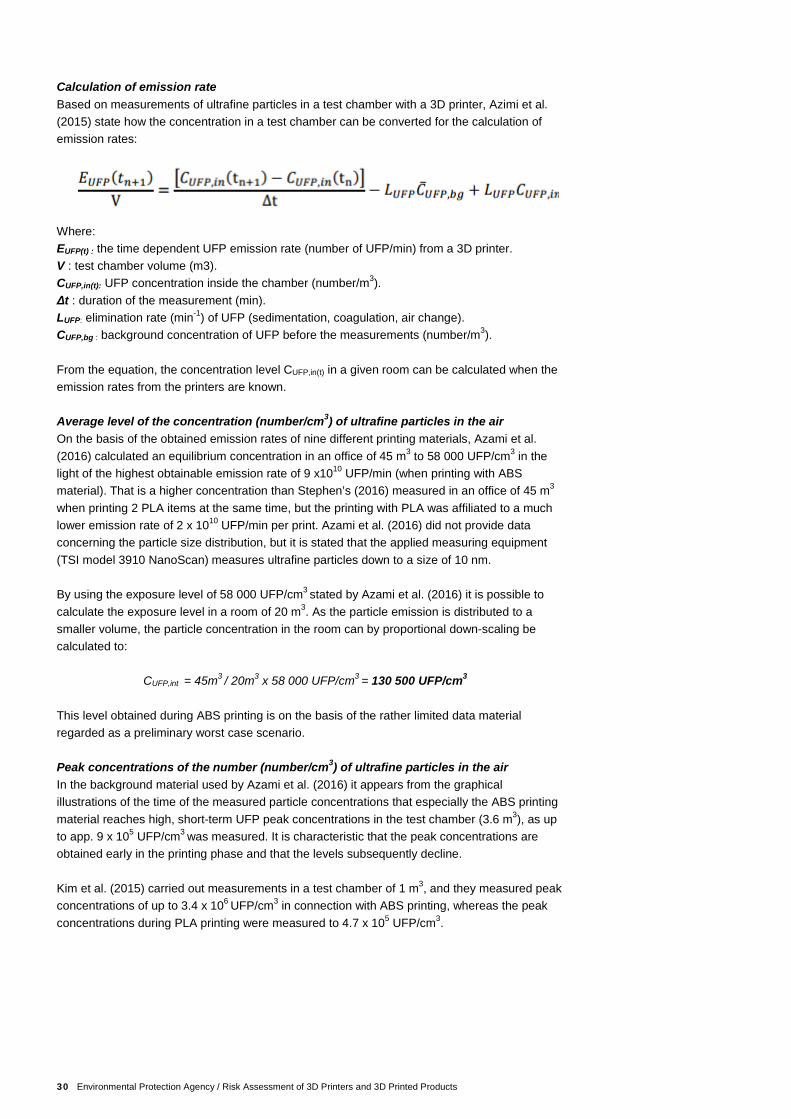
Calculation of emission rate Based on measurements of ultrafine particles in a test chamber with a 3D printer, Azimi et al. (2015) state how the concentration in a test chamber can be converted for the calculation of emission rates:
Where: EUFP(t) : the time dependent UFP emission rate (number of UFP/min) from a 3D printer. V : test chamber volume (m3). CUFP,in(t): UFP concentration inside the chamber (number/m3). Δt : duration of the measurement (min). LUFP: elimination rate (min-1) of UFP (sedimentation, coagulation, air change). CUFP,bg : background concentration of UFP before the measurements (number/m3). From the equation, the concentration level CUFP,in(t) in a given room can be calculated when the emission rates from the printers are known. Average level of the concentration (number/cm3) of ultrafine particles in the air On the basis of the obtained emission rates of nine different printing materials, Azami et al. (2016) calculated an equilibrium concentration in an office of 45 m3 to 58 000 UFP/cm3 in the light of the highest obtainable emission rate of 9 x10¹⁰ UFP/min (when printing with ABS material). That is a higher concentration than Stephen’s (2016) measured in an office of 45 m3 when printing 2 PLA items at the same time, but the printing with PLA was affiliated to a much lower emission rate of 2 x 10¹⁰ UFP/min per print. Azami et al. (2016) did not provide data concerning the particle size distribution, but it is stated that the applied measuring equipment (TSI model 3910 NanoScan) measures ultrafine particles down to a size of 10 nm. By using the exposure level of 58 000 UFP/cm3 stated by Azami et al. (2016) it is possible to calculate the exposure level in a room of 20 m3. As the particle emission is distributed to a smaller volume, the particle concentration in the room can by proportional down-scaling be calculated to:
CUFP,int = 45m3 / 20m3 x 58 000 UFP/cm3 = 130 500 UFP/cm3 This level obtained during ABS printing is on the basis of the rather limited data material regarded as a preliminary worst case scenario. Peak concentrations of the number (number/cm3) of ultrafine particles in the air In the background material used by Azami et al. (2016) it appears from the graphical illustrations of the time of the measured particle concentrations that especially the ABS printing material reaches high, short-term UFP peak concentrations in the test chamber (3.6 m3), as up to app. 9 x 10⁵ UFP/cm3 was measured. It is characteristic that the peak concentrations are obtained early in the printing phase and that the levels subsequently decline. Kim et al. (2015) carried out measurements in a test chamber of 1 m3, and they measured peak concentrations of up to 3.4 x 10⁶ UFP/cm3 in connection with ABS printing, whereas the peak concentrations during PLA printing were measured to 4.7 x 10⁵ UFP/cm3.
Environmental Protection Agency / Risk Assessment of 3D Printers and 3D Printed Products 31
As the measurements by Kim et al. (2015) were carried out in a smaller chamber and therefore closer to the source, it is assessed that data from Kim et al. (2015) could represent short-term peak concentrations that can be obtained when sitting close to the source and studying the printing process. Therefore, a particle concentration of 3.4 x 10⁶ UFP/cm3 is used as peak concentration in a preliminary worst case scenario when printing in ABS. Average level of the particle mass (µg/m3) in the air As a starting point for the calculation of an average level of particles, data from Kim et al. (2015) is used. They found that printing with PLA resulted in an increased level of particles with a diameter below 400 nm on 142 µg/m3 in the air in a test chamber of 1 m3. In a printing series carried out on another printer that made prints with ABS material as well as PLA material, Kim et al. (2015) measured an increase in the air concentration of 5.4 µg/m3 when printing with ABS, whereas the particle level did not increase when printing with this PLA material. That might indicate that the individual printer rather than merely the type of printing material could be of importance to the emission of particles. If the measured concentration in a test chamber of 1 m3 is scaled to a room of 20 m3, then the following particle concentration can be calculated:
Cpart = 1m3 / 20m3 x 142 µg/m3 = 7.1 µg/m3 Peak concentration of the particle mass (µg/m3) in the air The measuring result of 142 µg/m3 from Kim et al. (2015) is used directly as the maximum peak load that can be obtained over a shorter period, as the measuring equipment in the rather small test chamber of 1 m3 is located very close to the printing process, corresponding to one person sitting close to the printer and following the printing process. 4.1.2 Exposure scenario for volatile chemical substances/vapours,
inhalation In order to assess the extent of the emission of volatile substances, the measurement results from the references in Table 1 are used. The obtained data is listed in Table 6 below. Table 6 The emitted substances, their emission rates (EVOC: mg/min) from the printer and test chamber concentrations (CVOC,print: µg/m3) based on measurement data as stated by Azimi et al. (2016); Steinle (2016); Kim et al. (2015). Emitted substance
Azimi et al. (2016)
Test chamber: 3.6 m3
Steinle (2016) Test chamber: 0.095m3
Kim et al. 2015) Test chamber: 1m3
Emis. rate: Conc. Test chamber:
EVOC µg/min CVOC,print: µg/m3
EVOC µg/min CVOC,print: µg/m3
EVOC µg/min CVOC,,print: µg/m3
Caprolactam / Nylon 183 µg/min 3078 µg/m3
Acetic acid / ABS 6.2 µg/min 110 µg/m3
Styrene / ABS 113 µg/min 2479 µg/m3
5.8 µg/min 260 µg/m3
Lactide / PLA 5 µg/min 89 µg/m3
Isopropyl palmitate / ABS 9.4 µg/min 207 µg/m3
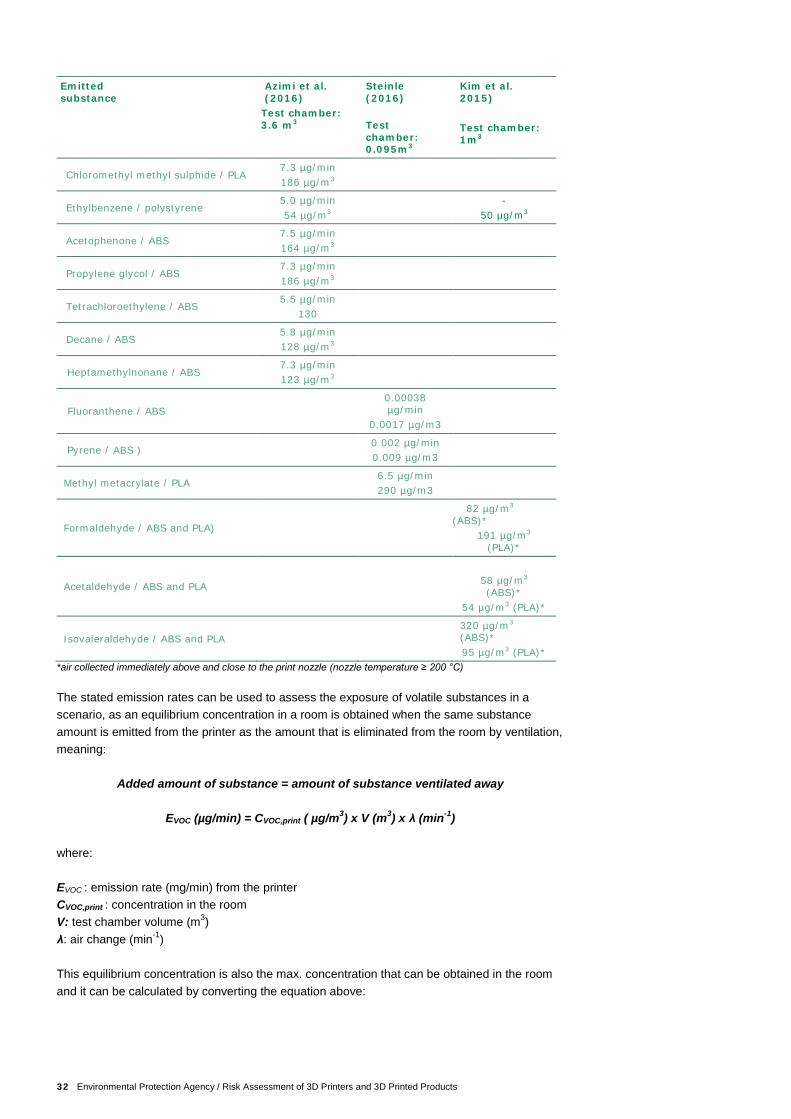
32 Environmental Protection Agency / Risk Assessment of 3D Printers and 3D Printed Products
Emitted substance
Azimi et al. (2016)
Test chamber: 3.6 m3
Steinle (2016) Test chamber: 0.095m3
Kim et al. 2015) Test chamber: 1m3
Chloromethyl methyl sulphide / PLA 7.3 µg/min 186 µg/m3
Ethylbenzene / polystyrene 5.0 µg/min 54 µg/m3
-
50 µg/m3
Acetophenone / ABS 7.5 µg/min 164 µg/m3
Propylene glycol / ABS 7.3 µg/min 186 µg/m3
Tetrachloroethylene / ABS 5.5 µg/min
130
Decane / ABS 5.8 µg/min 128 µg/m3
Heptamethylnonane / ABS 7.3 µg/min 123 µg/m3
Fluoranthene / ABS 0.00038 µg/min
0.0017 µg/m3
Pyrene / ABS ) 0.002 µg/min 0.009 µg/m3
Methyl metacrylate / PLA 6.5 µg/min 290 µg/m3
Formaldehyde / ABS and PLA)
82 µg/m3
(ABS)* 191 µg/m3
(PLA)*
Acetaldehyde / ABS and PLA
58 µg/m3 (ABS)*
54 µg/m3 (PLA)*
Isovaleraldehyde / ABS and PLA 320 µg/m3 (ABS)* 95 µg/m3 (PLA)*
*air collected immediately above and close to the print nozzle (nozzle temperature ≥ 200 °C) The stated emission rates can be used to assess the exposure of volatile substances in a scenario, as an equilibrium concentration in a room is obtained when the same substance amount is emitted from the printer as the amount that is eliminated from the room by ventilation, meaning:
Added amount of substance = amount of substance ventilated away
EVOC (µg/min) = CVOC,print ( µg/m3) x V (m3) x λ (min-1) where: EVOC : emission rate (mg/min) from the printer CVOC,print : concentration in the room V: test chamber volume (m3) λ: air change (min-1) This equilibrium concentration is also the max. concentration that can be obtained in the room and it can be calculated by converting the equation above:
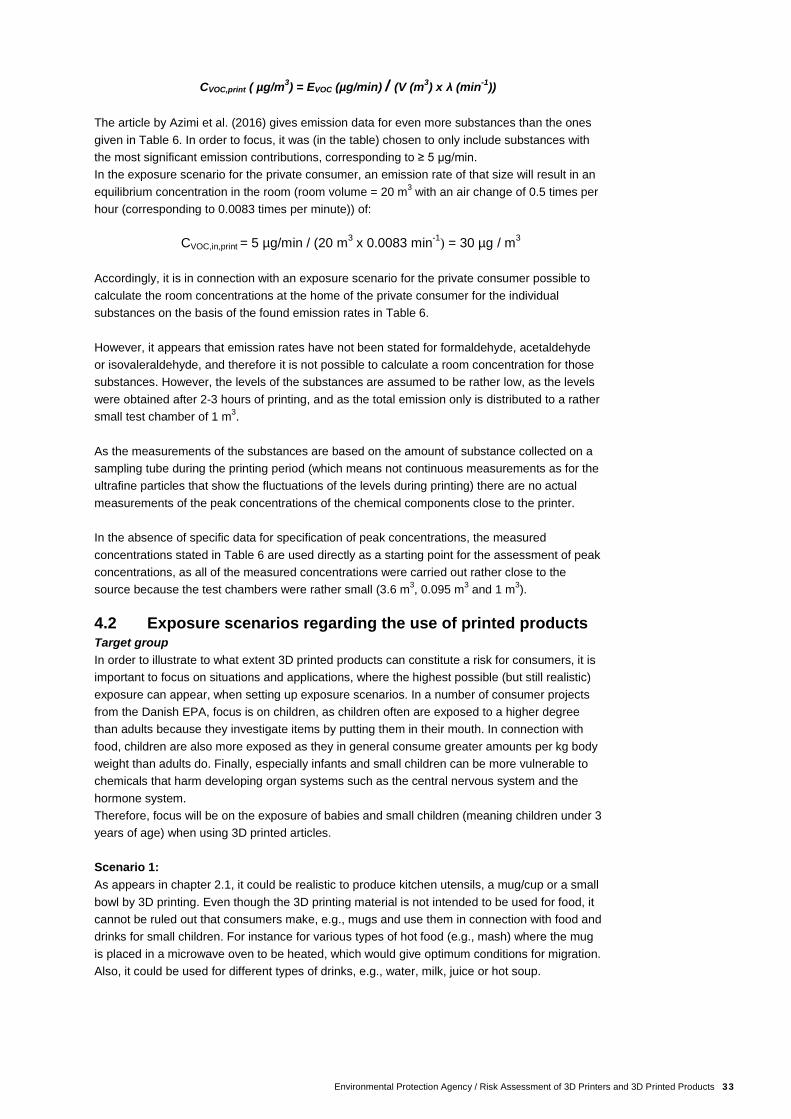
Environmental Protection Agency / Risk Assessment of 3D Printers and 3D Printed Products 33
CVOC,print ( µg/m3) = EVOC (µg/min) / (V (m3) x λ (min-1))
The article by Azimi et al. (2016) gives emission data for even more substances than the ones given in Table 6. In order to focus, it was (in the table) chosen to only include substances with the most significant emission contributions, corresponding to ≥ 5 µg/min. In the exposure scenario for the private consumer, an emission rate of that size will result in an equilibrium concentration in the room (room volume = 20 m3 with an air change of 0.5 times per hour (corresponding to 0.0083 times per minute)) of: CVOC,in,print = 5 µg/min / (20 m3 x 0.0083 min-1) = 30 µg / m3 Accordingly, it is in connection with an exposure scenario for the private consumer possible to calculate the room concentrations at the home of the private consumer for the individual substances on the basis of the found emission rates in Table 6. However, it appears that emission rates have not been stated for formaldehyde, acetaldehyde or isovaleraldehyde, and therefore it is not possible to calculate a room concentration for those substances. However, the levels of the substances are assumed to be rather low, as the levels were obtained after 2-3 hours of printing, and as the total emission only is distributed to a rather small test chamber of 1 m3. As the measurements of the substances are based on the amount of substance collected on a sampling tube during the printing period (which means not continuous measurements as for the ultrafine particles that show the fluctuations of the levels during printing) there are no actual measurements of the peak concentrations of the chemical components close to the printer. In the absence of specific data for specification of peak concentrations, the measured concentrations stated in Table 6 are used directly as a starting point for the assessment of peak concentrations, as all of the measured concentrations were carried out rather close to the source because the test chambers were rather small (3.6 m3, 0.095 m3 and 1 m3). 4.2 Exposure scenarios regarding the use of printed products Target group In order to illustrate to what extent 3D printed products can constitute a risk for consumers, it is important to focus on situations and applications, where the highest possible (but still realistic) exposure can appear, when setting up exposure scenarios. In a number of consumer projects from the Danish EPA, focus is on children, as children often are exposed to a higher degree than adults because they investigate items by putting them in their mouth. In connection with food, children are also more exposed as they in general consume greater amounts per kg body weight than adults do. Finally, especially infants and small children can be more vulnerable to chemicals that harm developing organ systems such as the central nervous system and the hormone system. Therefore, focus will be on the exposure of babies and small children (meaning children under 3 years of age) when using 3D printed articles. Scenario 1: As appears in chapter 2.1, it could be realistic to produce kitchen utensils, a mug/cup or a small bowl by 3D printing. Even though the 3D printing material is not intended to be used for food, it cannot be ruled out that consumers make, e.g., mugs and use them in connection with food and drinks for small children. For instance for various types of hot food (e.g., mash) where the mug is placed in a microwave oven to be heated, which would give optimum conditions for migration. Also, it could be used for different types of drinks, e.g., water, milk, juice or hot soup.
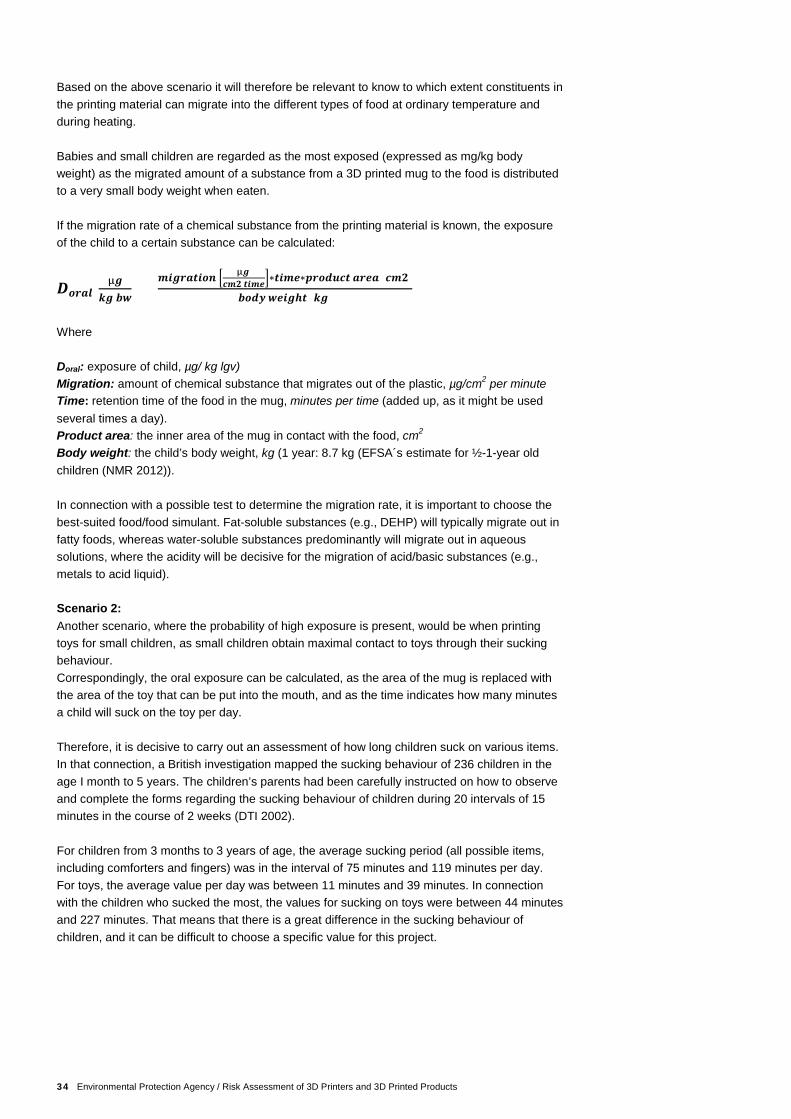
34 Environmental Protection Agency / Risk Assessment of 3D Printers and 3D Printed Products
Based on the above scenario it will therefore be relevant to know to which extent constituents in the printing material can migrate into the different types of food at ordinary temperature and during heating. Babies and small children are regarded as the most exposed (expressed as mg/kg body weight) as the migrated amount of a substance from a 3D printed mug to the food is distributed to a very small body weight when eaten. If the migration rate of a chemical substance from the printing material is known, the exposure of the child to a certain substance can be calculated:
𝑫𝒐𝒐𝒐𝒐[µ𝒈
𝒌𝒈 𝒃𝒃] =
𝒎𝒎𝒈𝒐𝒐𝒎𝒎𝒐𝒎 � µ𝒈 𝒄𝒎𝒄 𝒎𝒎𝒎𝒕�∗𝒎𝒎𝒎𝒕∗𝒑𝒐𝒐𝒑𝒑𝒄𝒎 𝒐𝒐𝒕𝒐 [𝒄𝒎𝒄]
𝒃𝒐𝒑𝒃 𝒃𝒕𝒎𝒈𝒘𝒎 [𝒌𝒈]
Where Doral: exposure of child, µg/ kg lgv) Migration: amount of chemical substance that migrates out of the plastic, µg/cm2 per minute Time: retention time of the food in the mug, minutes per time (added up, as it might be used several times a day). Product area: the inner area of the mug in contact with the food, cm2 Body weight: the child’s body weight, kg (1 year: 8.7 kg (EFSA´s estimate for ½-1-year old children (NMR 2012)). In connection with a possible test to determine the migration rate, it is important to choose the best-suited food/food simulant. Fat-soluble substances (e.g., DEHP) will typically migrate out in fatty foods, whereas water-soluble substances predominantly will migrate out in aqueous solutions, where the acidity will be decisive for the migration of acid/basic substances (e.g., metals to acid liquid). Scenario 2: Another scenario, where the probability of high exposure is present, would be when printing toys for small children, as small children obtain maximal contact to toys through their sucking behaviour. Correspondingly, the oral exposure can be calculated, as the area of the mug is replaced with the area of the toy that can be put into the mouth, and as the time indicates how many minutes a child will suck on the toy per day. Therefore, it is decisive to carry out an assessment of how long children suck on various items. In that connection, a British investigation mapped the sucking behaviour of 236 children in the age I month to 5 years. The children’s parents had been carefully instructed on how to observe and complete the forms regarding the sucking behaviour of children during 20 intervals of 15 minutes in the course of 2 weeks (DTI 2002). For children from 3 months to 3 years of age, the average sucking period (all possible items, including comforters and fingers) was in the interval of 75 minutes and 119 minutes per day. For toys, the average value per day was between 11 minutes and 39 minutes. In connection with the children who sucked the most, the values for sucking on toys were between 44 minutes and 227 minutes. That means that there is a great difference in the sucking behaviour of children, and it can be difficult to choose a specific value for this project.

Environmental Protection Agency / Risk Assessment of 3D Printers and 3D Printed Products 35
When assessing toys for children under the age of three, a sucking period of 3 hours is used in most cases. Therefore, as worst case a sucking period of 3 hours is chosen. Correspondingly, it is custom to use a sucking area of 10 cm2 in the course of the sucking period (the Danish EPA, individual communication). In connection with this scenario, it will be relevant to use/obtain data from migration tests of the relevant chemical substances, where a migration liquid was used corresponding to the saliva of the child. Assessment of the most critical scenario for risk assessment Scenario 1 is regarded as the more serious of the two scenarios, as migration takes place from a larger area of the material (a filled mug) rather than from a smaller part of a toy that is put in the mouth. At the same time, the time the food remains in the mug could be just as long (or even longer) than the period a child would suck on a toy. In connection with the subsequent risk assessment, it will therefore be most relevant to take a starting point in scenario 1, as it is assumed to be the most critical scenario.
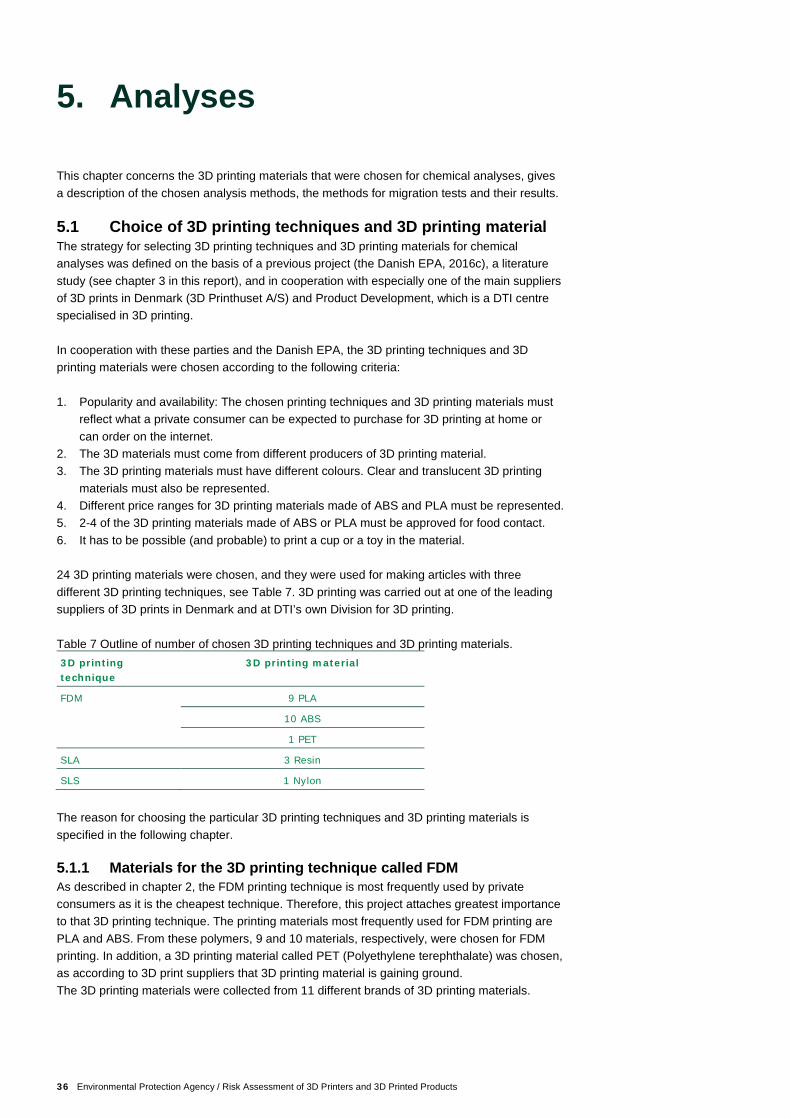
36 Environmental Protection Agency / Risk Assessment of 3D Printers and 3D Printed Products
5. Analyses
This chapter concerns the 3D printing materials that were chosen for chemical analyses, gives a description of the chosen analysis methods, the methods for migration tests and their results. 5.1 Choice of 3D printing techniques and 3D printing material The strategy for selecting 3D printing techniques and 3D printing materials for chemical analyses was defined on the basis of a previous project (the Danish EPA, 2016c), a literature study (see chapter 3 in this report), and in cooperation with especially one of the main suppliers of 3D prints in Denmark (3D Printhuset A/S) and Product Development, which is a DTI centre specialised in 3D printing. In cooperation with these parties and the Danish EPA, the 3D printing techniques and 3D printing materials were chosen according to the following criteria: 1. Popularity and availability: The chosen printing techniques and 3D printing materials must
reflect what a private consumer can be expected to purchase for 3D printing at home or can order on the internet.
2. The 3D materials must come from different producers of 3D printing material. 3. The 3D printing materials must have different colours. Clear and translucent 3D printing
materials must also be represented. 4. Different price ranges for 3D printing materials made of ABS and PLA must be represented. 5. 2-4 of the 3D printing materials made of ABS or PLA must be approved for food contact. 6. It has to be possible (and probable) to print a cup or a toy in the material. 24 3D printing materials were chosen, and they were used for making articles with three different 3D printing techniques, see Table 7. 3D printing was carried out at one of the leading suppliers of 3D prints in Denmark and at DTI’s own Division for 3D printing. Table 7 Outline of number of chosen 3D printing techniques and 3D printing materials. 3D printing technique
3D printing material
FDM
9 PLA
10 ABS
1 PET
SLA 3 Resin
SLS 1 Nylon
The reason for choosing the particular 3D printing techniques and 3D printing materials is specified in the following chapter. 5.1.1 Materials for the 3D printing technique called FDM As described in chapter 2, the FDM printing technique is most frequently used by private consumers as it is the cheapest technique. Therefore, this project attaches greatest importance to that 3D printing technique. The printing materials most frequently used for FDM printing are PLA and ABS. From these polymers, 9 and 10 materials, respectively, were chosen for FDM printing. In addition, a 3D printing material called PET (Polyethylene terephthalate) was chosen, as according to 3D print suppliers that 3D printing material is gaining ground. The 3D printing materials were collected from 11 different brands of 3D printing materials.
Environmental Protection Agency / Risk Assessment of 3D Printers and 3D Printed Products 37
3D printing materials were mainly chosen in dark colours as experience from previous projects with analyses of constituents in products with different colours show that the dark colours often contain critical substances; however, white, clear and translucent printing materials were also chosen in order to include a wide range of colours. The colours of the 3D printed materials appear from the tables with results. A wide range of special composite materials exist for FDM. Various additives have been added to give different properties and looks. That could for instance be chips that would give the 3D printed product a tree-like appearance, or carbon fibres that would give the product greater ultimate stress. These special 3D printing materials were rejected as the composite materials are sold less frequently than more traditional filaments. The price of the composite materials is higher and the materials will often quickly wear down the print head in the 3D printer. 5.1.2 Materials for the 3D printing technique called SLA The 3D printing technique called SLA is often utilised among 3D print suppliers, for instance if a private consumer orders a 3D print of a product with a greater degree of detail (precision) and a nicer surface than what is possible with the FDM 3D technique (see chapter 2). In this project, only 3 different 3D resin printing materials were chosen for 3D prints by SLA, as it is assumed that SLA will not be the primary choice among private consumers as it will be more expensive to order a 3D print by SLA than by FDM. It was chosen to use 3D printing materials from two different suppliers for printing by SLA. The 3D printing materials differ as the main components in the 3D printing materials are one hydrogenated bisphenol A epoxy polymer and 2 resins based on methacrylates (methacrylated oligomers and monomers), respectively. Two colours were chosen in connection with the two 3D printing materials containing methacrylate (black and clear, respectively). 5.1.3 Materials for the 3D printing technique SLS For the 3D printing technique SLS, nylon is i.a. used. 3D printing by SLS is not carried out by private consumers, but ordered from 3D print suppliers. The questioned 3D print suppliers stated that they use Nylon 12. Ordering 3D printing by SLS is more expensive than printing by FDM. Therefore, only one single product was printed by SLS in the material Nylon 12. 5.1.4 Documentation of the 3D printing materials As mentioned in chapter 2 and 3, limited information is available about the composition of 3D materials. When choosing 3D printing material, an attempt was made to procure technical data sheets and MSDS (Material Safety Data Sheets), but for most of the 3D printing materials, it was not possible to get the manufacturers to send them until after the materials had been ordered and printed. Technical data sheets mainly contain information about the physical and technical properties of the materials. MSDS i.a. contains information about content of classified substances according to the CLP regulation1, persistent, bio accumulated and toxic substances and SVHC according to the REACH regulation2.
1 Regulation (EU) no. 1272/2008 of the European Parliament and of the Council of 16 December 2008 on classification, labelling and packaging of substances and mixtures etc.
2 Regulation (EU) no. 1907/2006 of the European Parliament and of the Council of 18 December 2006 on Registration, Evaluation, Authorisation and Restriction of Chemicals (REACH).
38 Environmental Protection Agency / Risk Assessment of 3D Printers and 3D Printed Products
It was possible to procure technical data sheets for six out of the 24 3D printing materials, and for an additional eight of the 3D printing materials it was possible to procure MSDS as well as technical data sheets. For two of the 3D printing materials, the MSDS were only available in Russian. Some 3D printing materials do have a declaration of conformity with legislation or other criteria for consumer products. When choosing 3D materials for this project, it was a deliberate strategy not to ask the 3D print suppliers for 3D printing materials with a declaration of conformity as that probably could have influenced the choice of 3D printing materials. Subsequently, an inquiry was made for existing documentation and declarations of conformity for each type of 3D printing material. From one supplier of 3D printing material, documents exist for 4 of the 3D printing materials in which it is documented that the products comply with certain regulations/legislation and criteria. Two of the documents are for PLA, sample 15 and 16, and the third is for PET (sample 24). For these three 3D printing materials, the documentation states that the materials comply with the requirements under: 10/20113, FDA4, BfR5, 2011/656 and EN 71-37 with accompanying footnotes. The fourth document is for one ABS (sample 5), where it is documented that the material complies with the requirements under 2011/656 and EN 71-37. For the remaining 3D printing materials, it was not possible to document that the materials comply with specific regulations/legislation or other criteria. 5.2 Choice of 3D print files Similar printed products were used for the analyses in the form of plates with the dimensions: 3 cm x 3 cm x 0.5 cm and 4 cm x 4 cm x 0.5 cm. It was assessed that it would not be of importance to the results of the analyses of contents and the migration tests if different types of drawing files and products were not chosen. On the contrary, it would become easier to compare the results of the 3D materials. When preparing the exposure scenarios and subsequent danger and risk assessments, conversion was carried out from the plates to the types of products that will become part of the scenarios. 5.3 Choice of analysis programme The literature study disclosed some possible constituents in the various 3D printing materials (see chapter 3, Table 4), but it was not possible to procure additional information about the constituents in the 3D printing materials in addition to the polymer (and only the possible monomers) for most of the materials. Therefore, screening analyses by gas chromatography with mass spectrometry (GC-MS) were carried out as that method is the most suitable to uncover the possible content of volatile and semi-volatile organic substances in 3D printing material. Screening analyses by GC-MS were carried out on all 3D materials of resin, the sample of Nylon and all samples of ABS, but only on four PLA samples, as according to the literature survey it is not expected that PLA samples contain critical organic substances. The most inexpensive PLA qualities were chosen for the screening analysis. The sample of 3D print in 3 EU regulation No. 10/2011 on plastic materials and articles intended to come into contact with food
4 Food and Drug administration approval (USA)
5 No migration of substances with a health risk occurs from the contact materials to the foods (Germany)
6 The restriction of the use of certain hazardous substances in electrical and electronic equipment
7 DS/EN 71-3:2013+A1:2014, Safety of toys – Part 3: Migration of certain elements
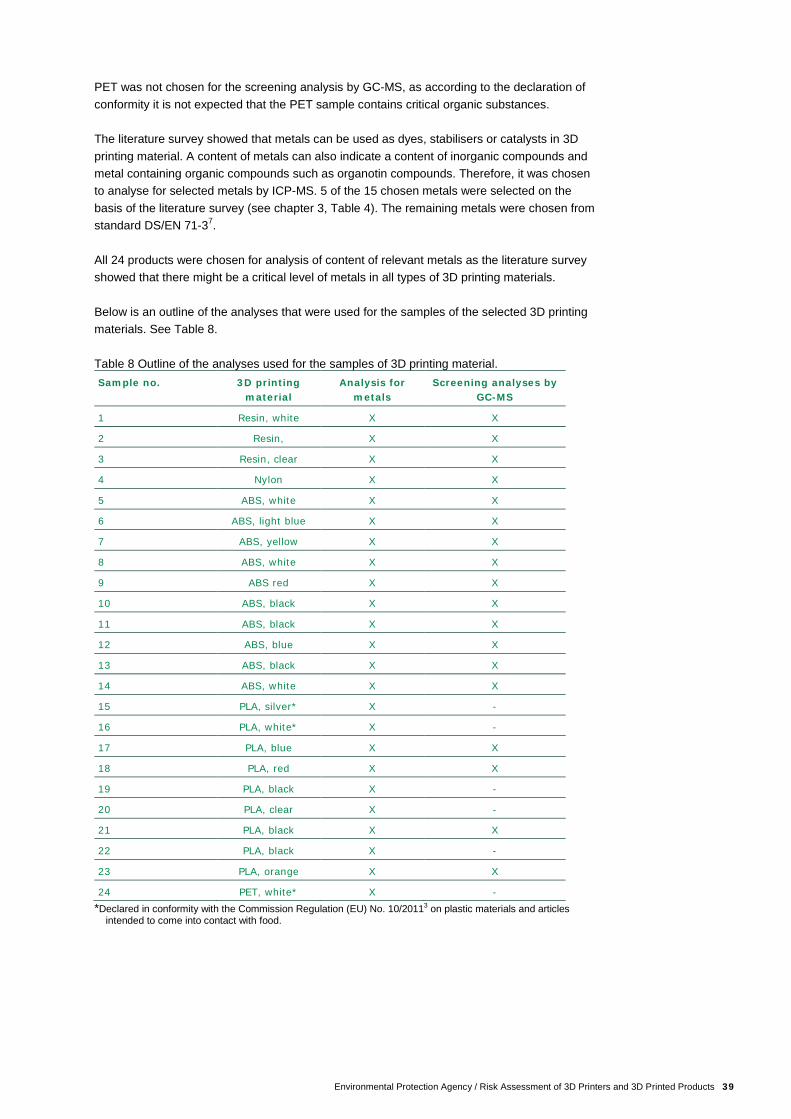
Environmental Protection Agency / Risk Assessment of 3D Printers and 3D Printed Products 39
PET was not chosen for the screening analysis by GC-MS, as according to the declaration of conformity it is not expected that the PET sample contains critical organic substances. The literature survey showed that metals can be used as dyes, stabilisers or catalysts in 3D printing material. A content of metals can also indicate a content of inorganic compounds and metal containing organic compounds such as organotin compounds. Therefore, it was chosen to analyse for selected metals by ICP-MS. 5 of the 15 chosen metals were selected on the basis of the literature survey (see chapter 3, Table 4). The remaining metals were chosen from standard DS/EN 71-37. All 24 products were chosen for analysis of content of relevant metals as the literature survey showed that there might be a critical level of metals in all types of 3D printing materials. Below is an outline of the analyses that were used for the samples of the selected 3D printing materials. See Table 8. Table 8 Outline of the analyses used for the samples of 3D printing material. Sample no. 3D printing
material Analysis for
metals Screening analyses by
GC-MS
1 Resin, white X X
2 Resin, X X
3 Resin, clear X X
4 Nylon X X
5 ABS, white X X
6 ABS, light blue X X
7 ABS, yellow X X
8 ABS, white X X
9 ABS red X X
10 ABS, black X X
11 ABS, black X X
12 ABS, blue X X
13 ABS, black X X
14 ABS, white X X
15 PLA, silver* X -
16 PLA, white* X -
17 PLA, blue X X
18 PLA, red X X
19 PLA, black X -
20 PLA, clear X -
21 PLA, black X X
22 PLA, black X -
23 PLA, orange X X
24 PET, white* X - *Declared in conformity with the Commission Regulation (EU) No. 10/20113 on plastic materials and articles
intended to come into contact with food.
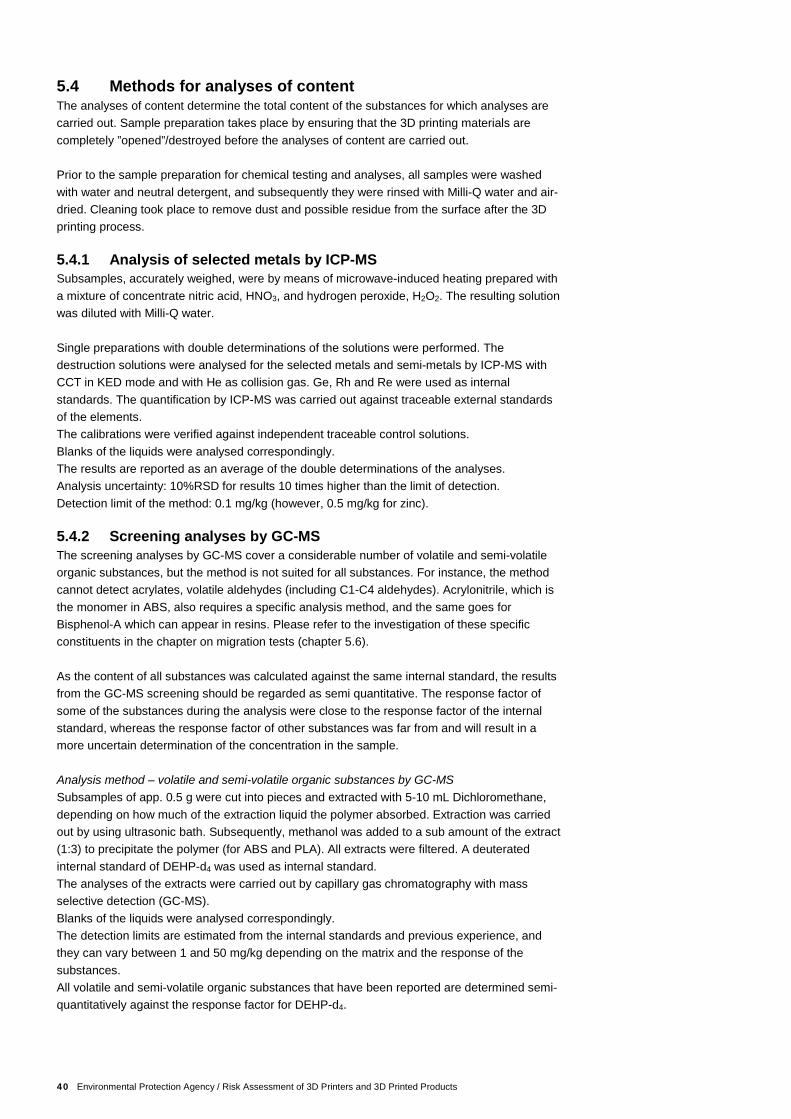
40 Environmental Protection Agency / Risk Assessment of 3D Printers and 3D Printed Products
5.4 Methods for analyses of content The analyses of content determine the total content of the substances for which analyses are carried out. Sample preparation takes place by ensuring that the 3D printing materials are completely ”opened”/destroyed before the analyses of content are carried out. Prior to the sample preparation for chemical testing and analyses, all samples were washed with water and neutral detergent, and subsequently they were rinsed with Milli-Q water and air-dried. Cleaning took place to remove dust and possible residue from the surface after the 3D printing process. 5.4.1 Analysis of selected metals by ICP-MS Subsamples, accurately weighed, were by means of microwave-induced heating prepared with a mixture of concentrate nitric acid, HNO3, and hydrogen peroxide, H2O2. The resulting solution was diluted with Milli-Q water. Single preparations with double determinations of the solutions were performed. The destruction solutions were analysed for the selected metals and semi-metals by ICP-MS with CCT in KED mode and with He as collision gas. Ge, Rh and Re were used as internal standards. The quantification by ICP-MS was carried out against traceable external standards of the elements. The calibrations were verified against independent traceable control solutions. Blanks of the liquids were analysed correspondingly. The results are reported as an average of the double determinations of the analyses. Analysis uncertainty: 10%RSD for results 10 times higher than the limit of detection. Detection limit of the method: 0.1 mg/kg (however, 0.5 mg/kg for zinc). 5.4.2 Screening analyses by GC-MS The screening analyses by GC-MS cover a considerable number of volatile and semi-volatile organic substances, but the method is not suited for all substances. For instance, the method cannot detect acrylates, volatile aldehydes (including C1-C4 aldehydes). Acrylonitrile, which is the monomer in ABS, also requires a specific analysis method, and the same goes for Bisphenol-A which can appear in resins. Please refer to the investigation of these specific constituents in the chapter on migration tests (chapter 5.6). As the content of all substances was calculated against the same internal standard, the results from the GC-MS screening should be regarded as semi quantitative. The response factor of some of the substances during the analysis were close to the response factor of the internal standard, whereas the response factor of other substances was far from and will result in a more uncertain determination of the concentration in the sample. Analysis method – volatile and semi-volatile organic substances by GC-MS Subsamples of app. 0.5 g were cut into pieces and extracted with 5-10 mL Dichloromethane, depending on how much of the extraction liquid the polymer absorbed. Extraction was carried out by using ultrasonic bath. Subsequently, methanol was added to a sub amount of the extract (1:3) to precipitate the polymer (for ABS and PLA). All extracts were filtered. A deuterated internal standard of DEHP-d4 was used as internal standard. The analyses of the extracts were carried out by capillary gas chromatography with mass selective detection (GC-MS). Blanks of the liquids were analysed correspondingly. The detection limits are estimated from the internal standards and previous experience, and they can vary between 1 and 50 mg/kg depending on the matrix and the response of the substances. All volatile and semi-volatile organic substances that have been reported are determined semi-quantitatively against the response factor for DEHP-d4.
Environmental Protection Agency / Risk Assessment of 3D Printers and 3D Printed Products 41
Naphthalene-d8 and Anthracene-d10 were also added as internal standards, but it was not possible to use them to calculate a semi-quantitative content for all samples as there was interference on several of the samples. Therefore, DEHP-d4 was chosen for calculation of the semi-quantitative content. A reporting limit of 10 mg/kg was chosen. An investigation was also carried out for content of the 16 EPA PAHs and selected phthalates when going through the chromatograms for the respective target-ions (phthalates against m/z 149). For these constituents, all results above the estimated detection limit have been reported. The individual substances were identified by comparing the mass spectra in question with the mass spectra from the NIST library8. The NIST library is a database with mass spectra for more than 500,000 chemical compounds. A hit rate in per cent is given for all substances, and it indicates how certain the identifications are. For certain substances, the hit rate can be too low and therefore misleading. That is because the set-up of a screening programme by GC-MS was not optimal for all constituents. All identifications from the NIST library were reported; also substances with a low hit rate. The identifications from the NIST library are only intended as a guide and should be used as a basis for decision of whether additional verification of the constituents against relevant reference substances should be carried out, and if it is relevant to continue with migration testing for volatile and semi-volatile organic substances. 5.5 Results of analyses of content The results of the analyses of content of metals analysed by ICP-MS and volatile and semi-volatile organic substances (VOC and SVOC) by GC-MS are presented below in Table 9 to Table 13, respectively. 5.5.1 Results of metals Table 9 RESIN printed by SLA, metals Unit: mg(kg Sample number and colour
Metal 1, White 2, Black 3, Clear
Chromium, Cr 0.7 - -
Manganese, Mn - - -
Cobalt, Co - - -
Nickel, Ni - - -
Copper, Cu 0.2 - -
Zinc, Zn 2.7 - 0.6
Arsenic, As 0.2 - -
Selenium, Se - - -
Strontium, Sr - - -
Molybdenum, Mo - - -
Cadmium, Cd - - -
Tin, Sn 3.6 78 61
Antimony, Sb 69 - -
Mercury, Hg - - -
Lead, Pb - - -
- Means less than the detection limit of 0.1 mg/kg (however, 0.5 mg/kg for zinc).
8 National Institute of Standards and Technology (NIST), USA.
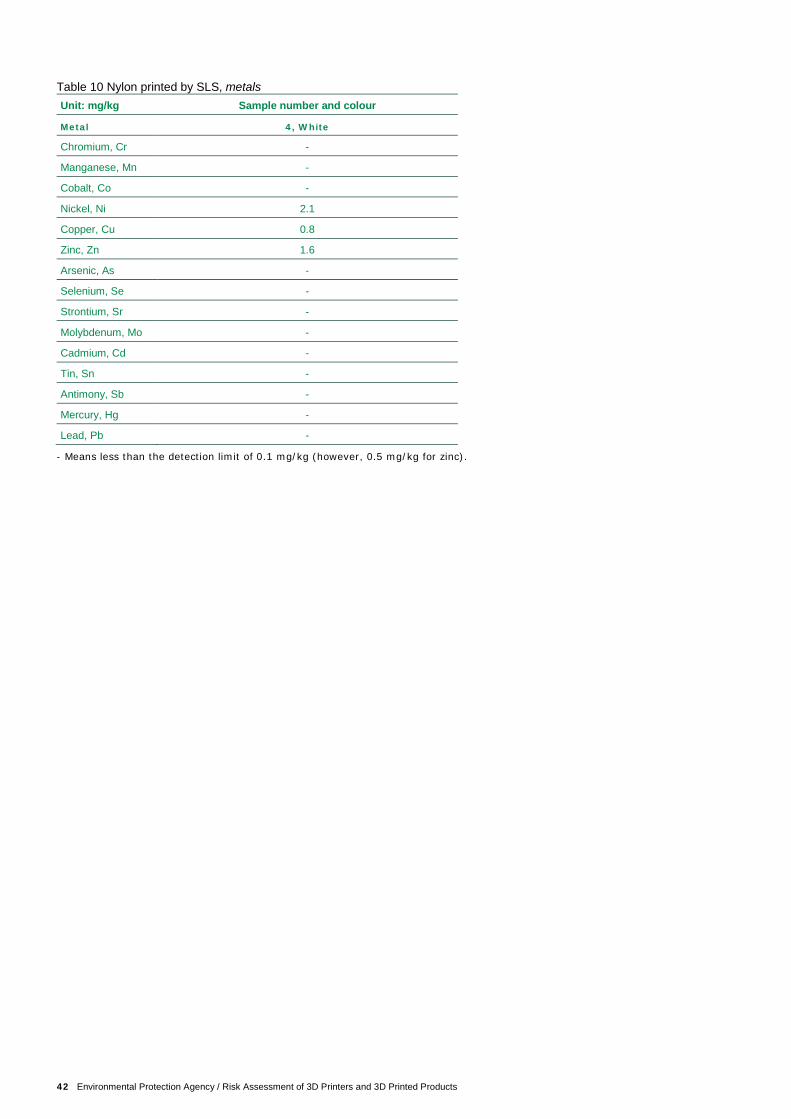
42 Environmental Protection Agency / Risk Assessment of 3D Printers and 3D Printed Products
Table 10 Nylon printed by SLS, metals Unit: mg/kg Sample number and colour
Metal 4, White
Chromium, Cr -
Manganese, Mn -
Cobalt, Co -
Nickel, Ni 2.1
Copper, Cu 0.8
Zinc, Zn 1.6
Arsenic, As -
Selenium, Se -
Strontium, Sr -
Molybdenum, Mo -
Cadmium, Cd -
Tin, Sn -
Antimony, Sb -
Mercury, Hg -
Lead, Pb -
- Means less than the detection limit of 0.1 mg/kg (however, 0.5 mg/kg for zinc).
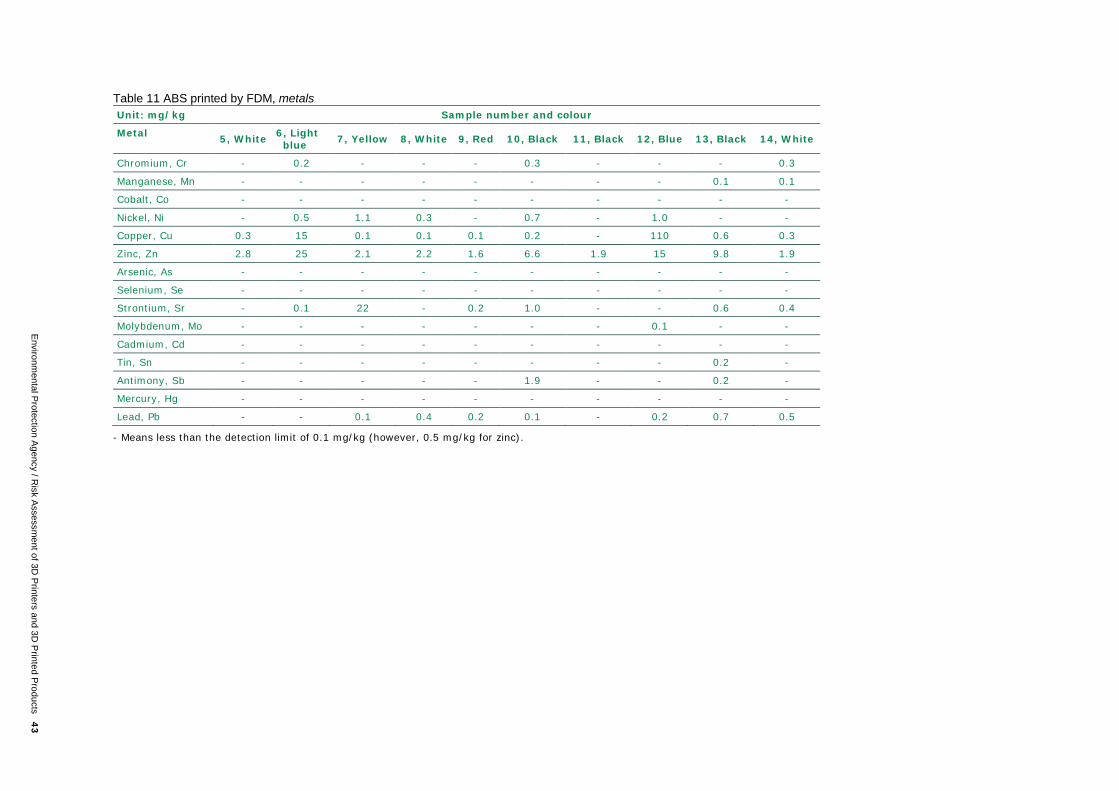
Environm
ental Protection A
gency / Risk A
ssessment of 3D
Printers and 3D
Printed P
roducts 43
Table 11 ABS printed by FDM, metals Unit: mg/kg Sample number and colour
Metal 5, White 6, Light blue 7, Yellow 8, White 9, Red 10, Black 11, Black 12, Blue 13, Black 14, White
Chromium, Cr - 0.2 - - - 0.3 - - - 0.3
Manganese, Mn - - - - - - - - 0.1 0.1
Cobalt, Co - - - - - - - - - -
Nickel, Ni - 0.5 1.1 0.3 - 0.7 - 1.0 - -
Copper, Cu 0.3 15 0.1 0.1 0.1 0.2 - 110 0.6 0.3
Zinc, Zn 2.8 25 2.1 2.2 1.6 6.6 1.9 15 9.8 1.9
Arsenic, As - - - - - - - - - -
Selenium, Se - - - - - - - - - -
Strontium, Sr - 0.1 22 - 0.2 1.0 - - 0.6 0.4
Molybdenum, Mo - - - - - - - 0.1 - -
Cadmium, Cd - - - - - - - - - -
Tin, Sn - - - - - - - - 0.2 -
Antimony, Sb - - - - - 1.9 - - 0.2 -
Mercury, Hg - - - - - - - - - -
Lead, Pb - - 0.1 0.4 0.2 0.1 - 0.2 0.7 0.5
- Means less than the detection limit of 0.1 mg/kg (however, 0.5 mg/kg for zinc).
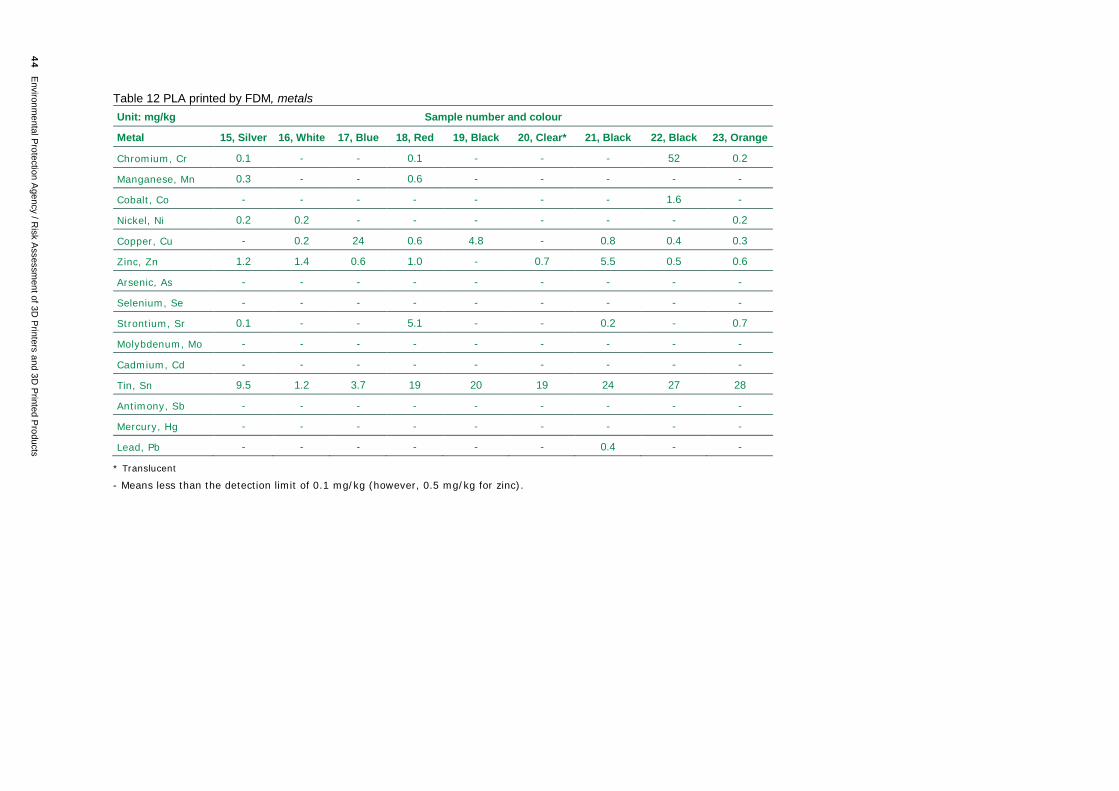
44 E
nvironmental P
rotection Agency / R
isk Assessm
ent of 3D P
rinters and 3D P
rinted Products
Table 12 PLA printed by FDM, metals Unit: mg/kg Sample number and colour
Metal 15, Silver 16, White 17, Blue 18, Red 19, Black 20, Clear* 21, Black 22, Black 23, Orange
Chromium, Cr 0.1 - - 0.1 - - - 52 0.2
Manganese, Mn 0.3 - - 0.6 - - - - -
Cobalt, Co - - - - - - - 1.6 -
Nickel, Ni 0.2 0.2 - - - - - - 0.2
Copper, Cu - 0.2 24 0.6 4.8 - 0.8 0.4 0.3
Zinc, Zn 1.2 1.4 0.6 1.0 - 0.7 5.5 0.5 0.6
Arsenic, As - - - - - - - - -
Selenium, Se - - - - - - - - -
Strontium, Sr 0.1 - - 5.1 - - 0.2 - 0.7
Molybdenum, Mo - - - - - - - - -
Cadmium, Cd - - - - - - - - -
Tin, Sn 9.5 1.2 3.7 19 20 19 24 27 28
Antimony, Sb - - - - - - - - -
Mercury, Hg - - - - - - - - -
Lead, Pb - - - - - - 0.4 - -
* Translucent
- Means less than the detection limit of 0.1 mg/kg (however, 0.5 mg/kg for zinc).
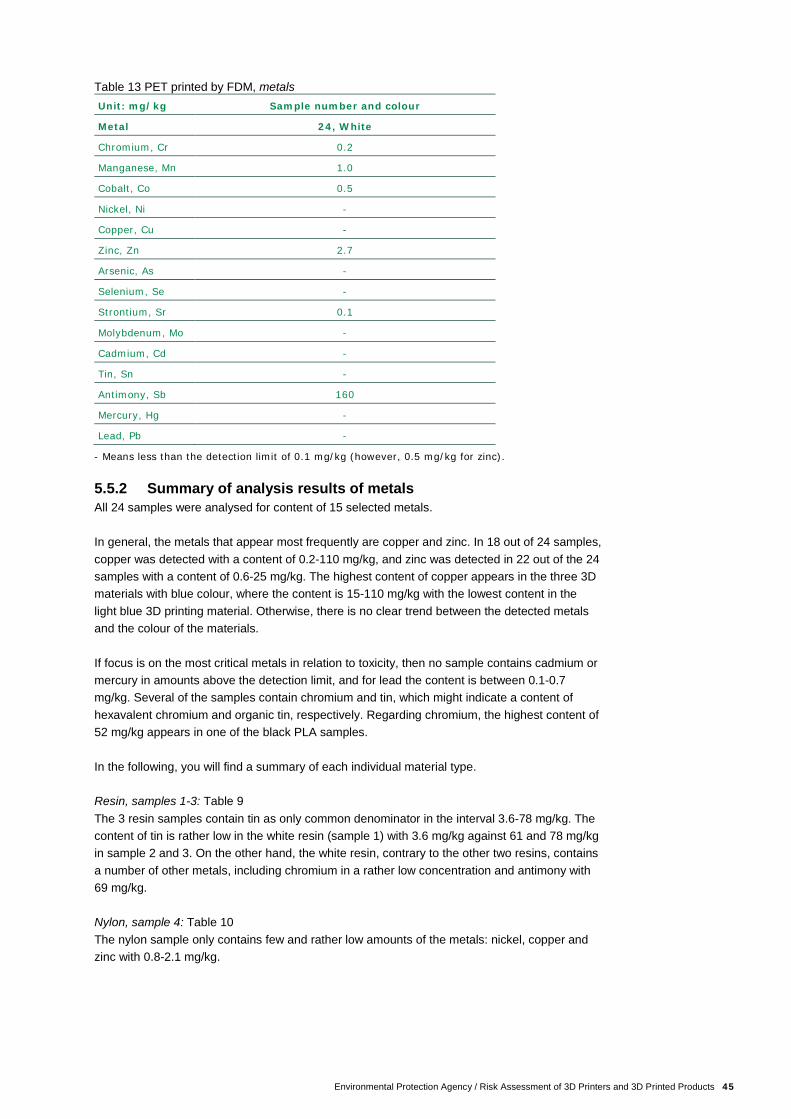
Environmental Protection Agency / Risk Assessment of 3D Printers and 3D Printed Products 45
Table 13 PET printed by FDM, metals Unit: mg/kg Sample number and colour
Metal 24, White
Chromium, Cr 0.2
Manganese, Mn 1.0
Cobalt, Co 0.5
Nickel, Ni -
Copper, Cu -
Zinc, Zn 2.7
Arsenic, As -
Selenium, Se -
Strontium, Sr 0.1
Molybdenum, Mo -
Cadmium, Cd -
Tin, Sn -
Antimony, Sb 160
Mercury, Hg -
Lead, Pb -
- Means less than the detection limit of 0.1 mg/kg (however, 0.5 mg/kg for zinc). 5.5.2 Summary of analysis results of metals All 24 samples were analysed for content of 15 selected metals. In general, the metals that appear most frequently are copper and zinc. In 18 out of 24 samples, copper was detected with a content of 0.2-110 mg/kg, and zinc was detected in 22 out of the 24 samples with a content of 0.6-25 mg/kg. The highest content of copper appears in the three 3D materials with blue colour, where the content is 15-110 mg/kg with the lowest content in the light blue 3D printing material. Otherwise, there is no clear trend between the detected metals and the colour of the materials. If focus is on the most critical metals in relation to toxicity, then no sample contains cadmium or mercury in amounts above the detection limit, and for lead the content is between 0.1-0.7 mg/kg. Several of the samples contain chromium and tin, which might indicate a content of hexavalent chromium and organic tin, respectively. Regarding chromium, the highest content of 52 mg/kg appears in one of the black PLA samples. In the following, you will find a summary of each individual material type. Resin, samples 1-3: Table 9 The 3 resin samples contain tin as only common denominator in the interval 3.6-78 mg/kg. The content of tin is rather low in the white resin (sample 1) with 3.6 mg/kg against 61 and 78 mg/kg in sample 2 and 3. On the other hand, the white resin, contrary to the other two resins, contains a number of other metals, including chromium in a rather low concentration and antimony with 69 mg/kg. Nylon, sample 4: Table 10 The nylon sample only contains few and rather low amounts of the metals: nickel, copper and zinc with 0.8-2.1 mg/kg.
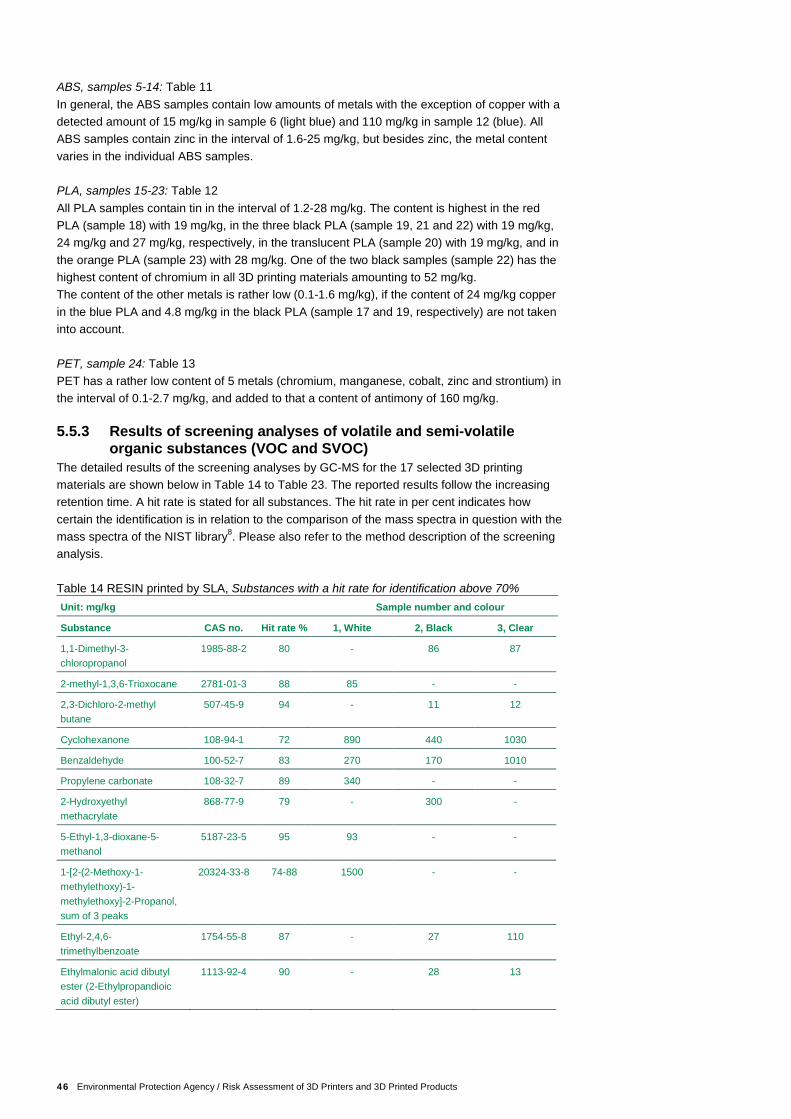
46 Environmental Protection Agency / Risk Assessment of 3D Printers and 3D Printed Products
ABS, samples 5-14: Table 11 In general, the ABS samples contain low amounts of metals with the exception of copper with a detected amount of 15 mg/kg in sample 6 (light blue) and 110 mg/kg in sample 12 (blue). All ABS samples contain zinc in the interval of 1.6-25 mg/kg, but besides zinc, the metal content varies in the individual ABS samples. PLA, samples 15-23: Table 12 All PLA samples contain tin in the interval of 1.2-28 mg/kg. The content is highest in the red PLA (sample 18) with 19 mg/kg, in the three black PLA (sample 19, 21 and 22) with 19 mg/kg, 24 mg/kg and 27 mg/kg, respectively, in the translucent PLA (sample 20) with 19 mg/kg, and in the orange PLA (sample 23) with 28 mg/kg. One of the two black samples (sample 22) has the highest content of chromium in all 3D printing materials amounting to 52 mg/kg. The content of the other metals is rather low (0.1-1.6 mg/kg), if the content of 24 mg/kg copper in the blue PLA and 4.8 mg/kg in the black PLA (sample 17 and 19, respectively) are not taken into account. PET, sample 24: Table 13 PET has a rather low content of 5 metals (chromium, manganese, cobalt, zinc and strontium) in the interval of 0.1-2.7 mg/kg, and added to that a content of antimony of 160 mg/kg. 5.5.3 Results of screening analyses of volatile and semi-volatile
organic substances (VOC and SVOC) The detailed results of the screening analyses by GC-MS for the 17 selected 3D printing materials are shown below in Table 14 to Table 23. The reported results follow the increasing retention time. A hit rate is stated for all substances. The hit rate in per cent indicates how certain the identification is in relation to the comparison of the mass spectra in question with the mass spectra of the NIST library8. Please also refer to the method description of the screening analysis. Table 14 RESIN printed by SLA, Substances with a hit rate for identification above 70% Unit: mg/kg Sample number and colour
Substance CAS no. Hit rate % 1, White 2, Black 3, Clear
1,1-Dimethyl-3-chloropropanol
1985-88-2 80 - 86 87
2-methyl-1,3,6-Trioxocane 2781-01-3 88 85 - -
2,3-Dichloro-2-methyl butane
507-45-9 94 - 11 12
Cyclohexanone 108-94-1 72 890 440 1030
Benzaldehyde 100-52-7 83 270 170 1010
Propylene carbonate 108-32-7 89 340 - -
2-Hydroxyethyl methacrylate
868-77-9 79 - 300 -
5-Ethyl-1,3-dioxane-5-methanol
5187-23-5 95 93 - -
1-[2-(2-Methoxy-1-methylethoxy)-1-methylethoxy]-2-Propanol, sum of 3 peaks
20324-33-8 74-88 1500 - -
Ethyl-2,4,6-trimethylbenzoate
1754-55-8 87 - 27 110
Ethylmalonic acid dibutyl ester (2-Ethylpropandioic acid dibutyl ester)
1113-92-4 90 - 28 13
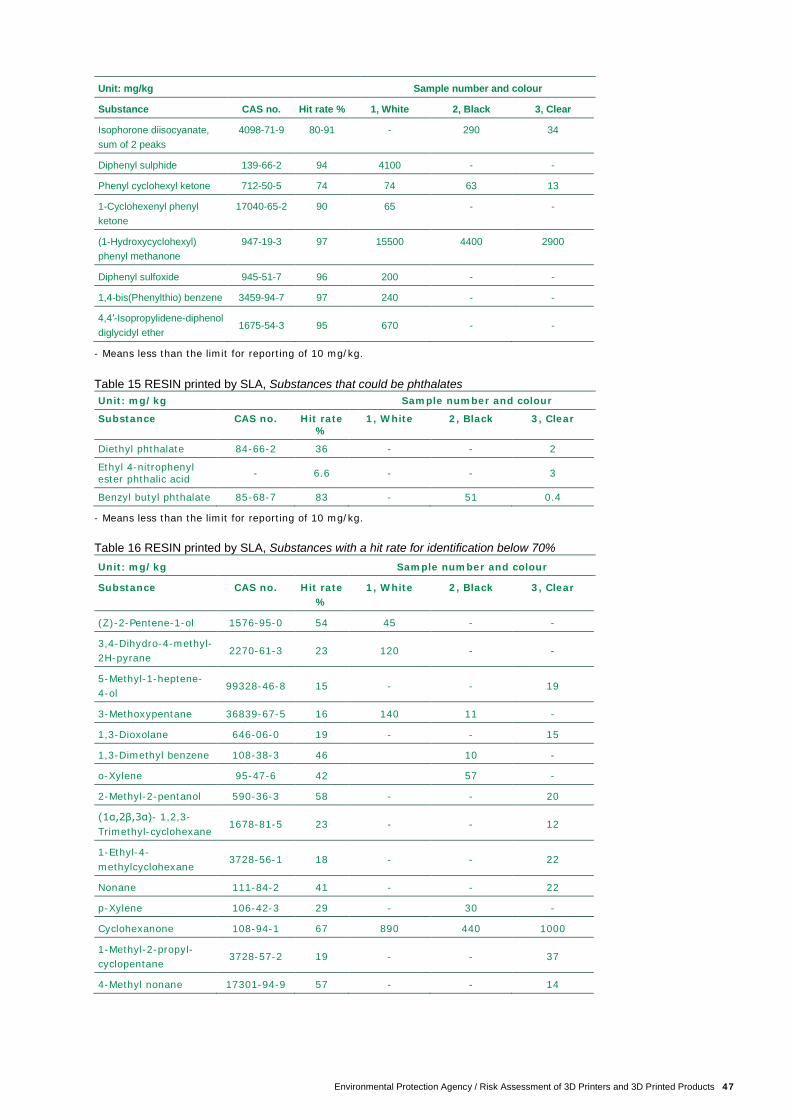
Environmental Protection Agency / Risk Assessment of 3D Printers and 3D Printed Products 47
Unit: mg/kg Sample number and colour
Substance CAS no. Hit rate % 1, White 2, Black 3, Clear
Isophorone diisocyanate, sum of 2 peaks
4098-71-9 80-91 - 290 34
Diphenyl sulphide 139-66-2 94 4100 - -
Phenyl cyclohexyl ketone 712-50-5 74 74 63 13
1-Cyclohexenyl phenyl ketone
17040-65-2 90 65 - -
(1-Hydroxycyclohexyl) phenyl methanone
947-19-3 97 15500 4400 2900
Diphenyl sulfoxide 945-51-7 96 200 - -
1,4-bis(Phenylthio) benzene 3459-94-7 97 240 - -
4,4′-Isopropylidene-diphenol diglycidyl ether
1675-54-3 95 670 - -
- Means less than the limit for reporting of 10 mg/kg. Table 15 RESIN printed by SLA, Substances that could be phthalates Unit: mg/kg Sample number and colour
Substance CAS no. Hit rate %
1, White 2, Black 3, Clear
Diethyl phthalate 84-66-2 36 - - 2
Ethyl 4-nitrophenyl ester phthalic acid - 6.6 - - 3
Benzyl butyl phthalate 85-68-7 83 - 51 0.4
- Means less than the limit for reporting of 10 mg/kg. Table 16 RESIN printed by SLA, Substances with a hit rate for identification below 70% Unit: mg/kg Sample number and colour
Substance CAS no. Hit rate %
1, White 2, Black 3, Clear
(Z)-2-Pentene-1-ol 1576-95-0 54 45 - -
3,4-Dihydro-4-methyl-2H-pyrane
2270-61-3 23 120 - -
5-Methyl-1-heptene-4-ol
99328-46-8 15 - - 19
3-Methoxypentane 36839-67-5 16 140 11 -
1,3-Dioxolane 646-06-0 19 - - 15
1,3-Dimethyl benzene 108-38-3 46 10 -
o-Xylene 95-47-6 42 57 -
2-Methyl-2-pentanol 590-36-3 58 - - 20
(1α,2β,3α)- 1,2,3-Trimethyl-cyclohexane
1678-81-5 23 - - 12
1-Ethyl-4-methylcyclohexane
3728-56-1 18 - - 22
Nonane 111-84-2 41 - - 22
p-Xylene 106-42-3 29 - 30 -
Cyclohexanone 108-94-1 67 890 440 1000
1-Methyl-2-propyl- cyclopentane
3728-57-2 19 - - 37
4-Methyl nonane 17301-94-9 57 - - 14

48 Environmental Protection Agency / Risk Assessment of 3D Printers and 3D Printed Products
Unit: mg/kg Sample number and colour
Substance CAS no. Hit rate %
1, White 2, Black 3, Clear
1,2,3-Trimethyl benzene
526-73-8 26 - 230 -
Decane 124-18-5 44 - - 110
2-Ethyl-1-hexanol - 59 - 82 -
Butyl cyclohexane 1678-93-9 53 - - 110
2-Hydroxypropyl-methacrylate
923-26-2 48 - 1100 -
3-Hydroxypropyl-methacrylate
2761-09-3 43 - 590 -
4-Ethyl heptane 2216-32-2 51 - - 21
(Z)-2-Pentene-1-ol 1576-95-0 53 880 - -
trans-Decahydro-naphthalene
493-02-7 18 - - 210
Cyclohexanon-trimethylene acetal
180-93-8 58 72 - 290
Dodecane 112-40-3 14 - 20 170
Tridecane 629-50-5 16 - - 34
Tri(1,2-propyleneglycol), monomethyl ether
- 55 13000 - -
1-[2-(2-Methoxy-1-methylethoxy)-1-methylethoxy]-2-propanol
20324-33-8 45 1800 - -
2,4,5-Trimethyl-benzaldehyde
5779-72-6 51 - 78 140
Methyl 2,4,6-trimethylbenzoate
2282-84-0 69 - 15 -
1-Phenyl cyclohexene 771-98-2 55 54 - -
2,4,6-Trimethyl-1,3-cyclohexanedione
20990-16-3 10 - 110 -
4,6-di-tert-Butyl-m-cresol
497-39-2 37 52 - -
2-Ethyl cycloheptanone
3183-41-3 6.8 - 220 -
4,5-Dimethyl-3H-isobenzofuran-1-one
- 40 - 18 -
1,1'-(1-Methylethyliden)bis-cyclohexane
54934-90-6 50 72 - -
1,3-dicyclohexylpropene
- 17 2200 - -
1-Cyclohexene-1-yl phenyl ketone
17040-65-2 69 - 26
5-Chloro-3-phenyl-4-isothiazolcarbonitril
19363-60-1 42 610 - -
4,4'-Isopropylidene-dicyclohexanol, sum of 4 peaks
80-04-6 28-57 690 - -
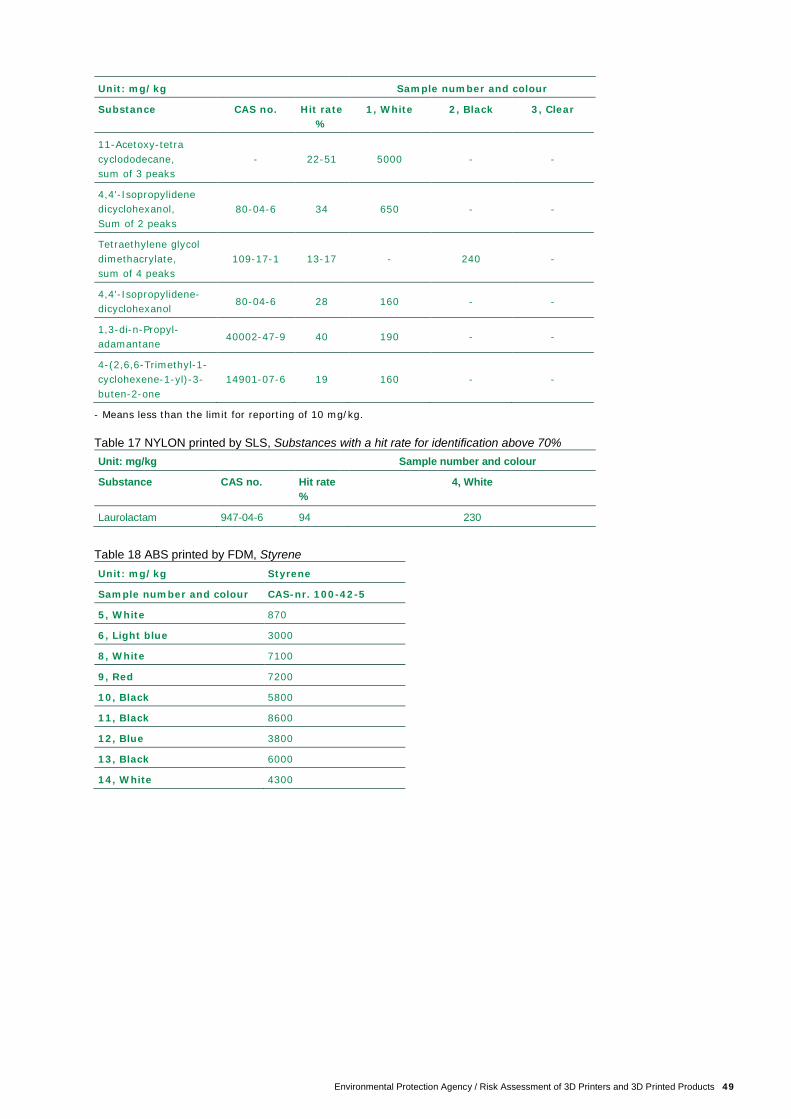
Environmental Protection Agency / Risk Assessment of 3D Printers and 3D Printed Products 49
Unit: mg/kg Sample number and colour
Substance CAS no. Hit rate %
1, White 2, Black 3, Clear
11-Acetoxy-tetra cyclododecane, sum of 3 peaks
- 22-51 5000 - -
4,4'-Isopropylidene dicyclohexanol, Sum of 2 peaks
80-04-6 34 650 - -
Tetraethylene glycol dimethacrylate, sum of 4 peaks
109-17-1 13-17 - 240 -
4,4'-Isopropylidene-dicyclohexanol
80-04-6 28 160 - -
1,3-di-n-Propyl-adamantane
40002-47-9 40 190 - -
4-(2,6,6-Trimethyl-1-cyclohexene-1-yl)-3-buten-2-one
14901-07-6 19 160 - -
- Means less than the limit for reporting of 10 mg/kg. Table 17 NYLON printed by SLS, Substances with a hit rate for identification above 70% Unit: mg/kg Sample number and colour
Substance CAS no. Hit rate %
4, White
Laurolactam 947-04-6 94 230
Table 18 ABS printed by FDM, Styrene Unit: mg/kg Styrene
Sample number and colour CAS-nr. 100-42-5
5, White 870
6, Light blue 3000
8, White 7100
9, Red 7200
10, Black 5800
11, Black 8600
12, Blue 3800
13, Black 6000
14, White 4300
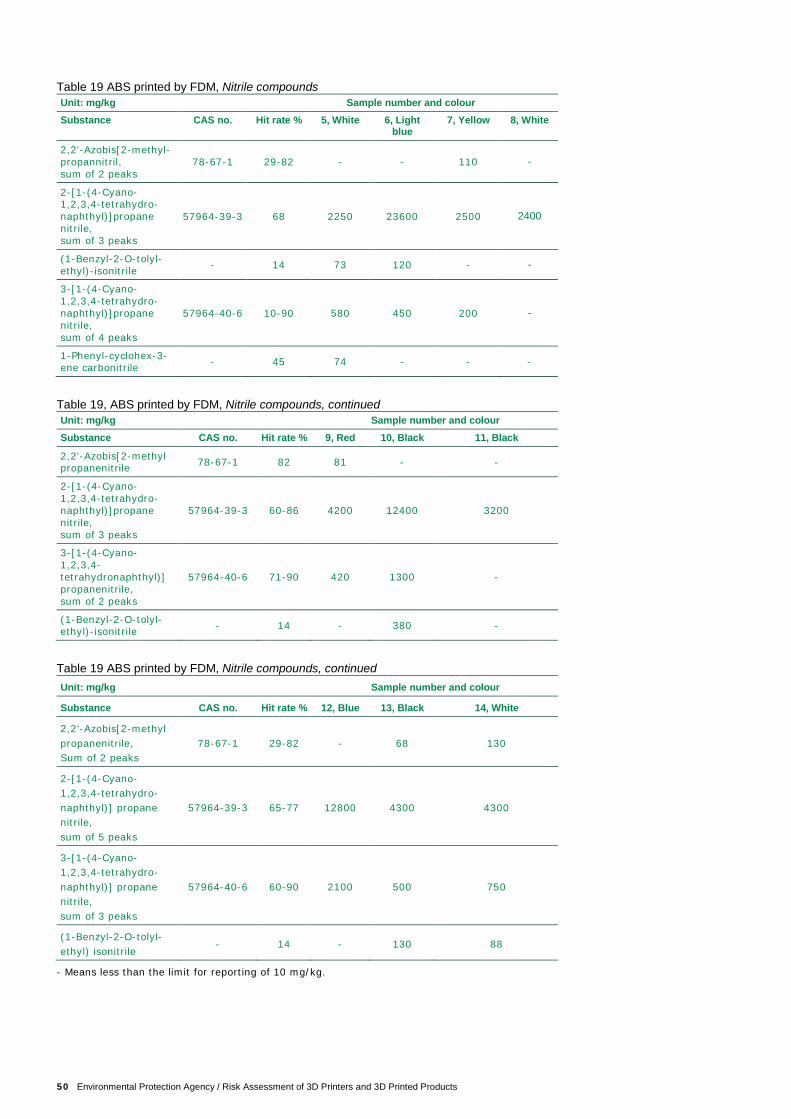
50 Environmental Protection Agency / Risk Assessment of 3D Printers and 3D Printed Products
Table 19 ABS printed by FDM, Nitrile compounds Unit: mg/kg Sample number and colour Substance CAS no. Hit rate % 5, White 6, Light
blue 7, Yellow 8, White
2,2'-Azobis[2-methyl-propannitril, sum of 2 peaks
78-67-1 29-82 - - 110 -
2-[1-(4-Cyano-1,2,3,4-tetrahydro-naphthyl)]propane nitrile, sum of 3 peaks
57964-39-3 68 2250 23600 2500 2400
(1-Benzyl-2-O-tolyl-ethyl)-isonitrile - 14 73 120 - -
3-[1-(4-Cyano-1,2,3,4-tetrahydro-naphthyl)]propane nitrile, sum of 4 peaks
57964-40-6 10-90 580 450 200 -
1-Phenyl-cyclohex-3-ene carbonitrile - 45 74 - - -
Table 19, ABS printed by FDM, Nitrile compounds, continued Unit: mg/kg Sample number and colour Substance CAS no. Hit rate % 9, Red 10, Black 11, Black
2,2'-Azobis[2-methyl propanenitrile 78-67-1 82 81 - -
2-[1-(4-Cyano-1,2,3,4-tetrahydro-naphthyl)]propane nitrile, sum of 3 peaks
57964-39-3 60-86 4200 12400 3200
3-[1-(4-Cyano-1,2,3,4-tetrahydronaphthyl)] propanenitrile, sum of 2 peaks
57964-40-6 71-90 420 1300 -
(1-Benzyl-2-O-tolyl-ethyl)-isonitrile - 14 - 380 -
Table 19 ABS printed by FDM, Nitrile compounds, continued Unit: mg/kg Sample number and colour
Substance CAS no. Hit rate % 12, Blue 13, Black 14, White
2,2'-Azobis[2-methyl propanenitrile, Sum of 2 peaks
78-67-1 29-82 - 68 130
2-[1-(4-Cyano-1,2,3,4-tetrahydro-naphthyl)] propane nitrile, sum of 5 peaks
57964-39-3 65-77 12800 4300 4300
3-[1-(4-Cyano-1,2,3,4-tetrahydro-naphthyl)] propane nitrile, sum of 3 peaks
57964-40-6 60-90 2100 500 750
(1-Benzyl-2-O-tolyl-ethyl) isonitrile
- 14 - 130 88
- Means less than the limit for reporting of 10 mg/kg.
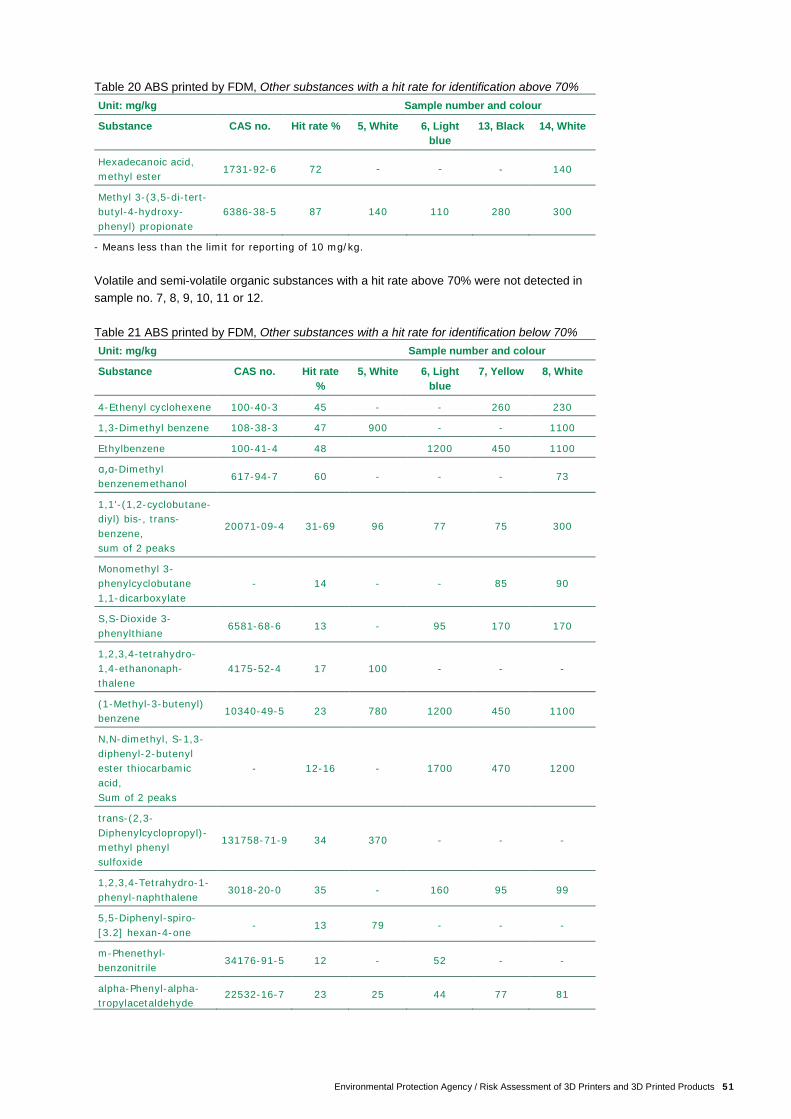
Environmental Protection Agency / Risk Assessment of 3D Printers and 3D Printed Products 51
Table 20 ABS printed by FDM, Other substances with a hit rate for identification above 70% Unit: mg/kg Sample number and colour
Substance CAS no. Hit rate % 5, White 6, Light blue
13, Black 14, White
Hexadecanoic acid, methyl ester
1731-92-6 72 - - - 140
Methyl 3-(3,5-di-tert-butyl-4-hydroxy-phenyl) propionate
6386-38-5 87 140 110 280 300
- Means less than the limit for reporting of 10 mg/kg.
Volatile and semi-volatile organic substances with a hit rate above 70% were not detected in sample no. 7, 8, 9, 10, 11 or 12. Table 21 ABS printed by FDM, Other substances with a hit rate for identification below 70% Unit: mg/kg Sample number and colour
Substance CAS no. Hit rate %
5, White 6, Light blue
7, Yellow 8, White
4-Ethenyl cyclohexene 100-40-3 45 - - 260 230
1,3-Dimethyl benzene 108-38-3 47 900 - - 1100
Ethylbenzene 100-41-4 48 1200 450 1100
α,α-Dimethyl benzenemethanol
617-94-7 60 - - - 73
1,1'-(1,2-cyclobutane-diyl) bis-, trans-benzene, sum of 2 peaks
20071-09-4 31-69 96 77 75 300
Monomethyl 3-phenylcyclobutane 1,1-dicarboxylate
- 14 - - 85 90
S,S-Dioxide 3-phenylthiane
6581-68-6 13 - 95 170 170
1,2,3,4-tetrahydro-1,4-ethanonaph-thalene
4175-52-4 17 100 - - -
(1-Methyl-3-butenyl) benzene
10340-49-5 23 780 1200 450 1100
N,N-dimethyl, S-1,3-diphenyl-2-butenyl ester thiocarbamic acid, Sum of 2 peaks
- 12-16 - 1700 470 1200
trans-(2,3-Diphenylcyclopropyl)-methyl phenyl sulfoxide
131758-71-9 34 370 - - -
1,2,3,4-Tetrahydro-1-phenyl-naphthalene
3018-20-0 35 - 160 95 99
5,5-Diphenyl-spiro-[3.2] hexan-4-one
- 13 79 - - -
m-Phenethyl-benzonitrile
34176-91-5 12 - 52 - -
alpha-Phenyl-alpha-tropylacetaldehyde
22532-16-7 23 25 44 77 81
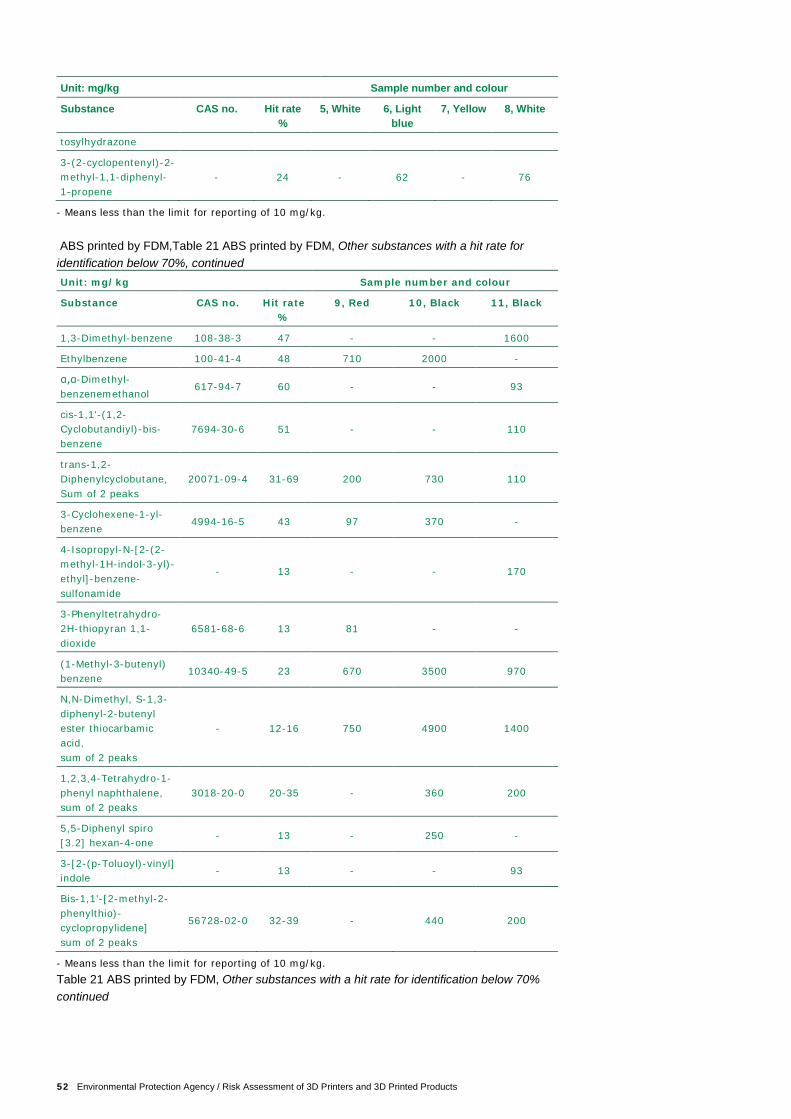
52 Environmental Protection Agency / Risk Assessment of 3D Printers and 3D Printed Products
Unit: mg/kg Sample number and colour
Substance CAS no. Hit rate %
5, White 6, Light blue
7, Yellow 8, White
tosylhydrazone
3-(2-cyclopentenyl)-2-methyl-1,1-diphenyl-1-propene
- 24 - 62 - 76
- Means less than the limit for reporting of 10 mg/kg.
ABS printed by FDM,Table 21 ABS printed by FDM, Other substances with a hit rate for identification below 70%, continued Unit: mg/kg Sample number and colour
Substance CAS no. Hit rate %
9, Red 10, Black 11, Black
1,3-Dimethyl-benzene 108-38-3 47 - - 1600
Ethylbenzene 100-41-4 48 710 2000 -
α,α-Dimethyl-benzenemethanol
617-94-7 60 - - 93
cis-1,1'-(1,2-Cyclobutandiyl)-bis-benzene
7694-30-6 51 - - 110
trans-1,2-Diphenylcyclobutane, Sum of 2 peaks
20071-09-4 31-69 200 730 110
3-Cyclohexene-1-yl-benzene
4994-16-5 43 97 370 -
4-Isopropyl-N-[2-(2-methyl-1H-indol-3-yl)-ethyl]-benzene-sulfonamide
- 13 - - 170
3-Phenyltetrahydro-2H-thiopyran 1,1-dioxide
6581-68-6 13 81 - -
(1-Methyl-3-butenyl) benzene
10340-49-5 23 670 3500 970
N,N-Dimethyl, S-1,3-diphenyl-2-butenyl ester thiocarbamic acid, sum of 2 peaks
- 12-16 750 4900 1400
1,2,3,4-Tetrahydro-1-phenyl naphthalene, sum of 2 peaks
3018-20-0 20-35 - 360 200
5,5-Diphenyl spiro [3.2] hexan-4-one
- 13 - 250 -
3-[2-(p-Toluoyl)-vinyl] indole
- 13 - - 93
Bis-1,1'-[2-methyl-2-phenylthio)-cyclopropylidene] sum of 2 peaks
56728-02-0 32-39 - 440 200
- Means less than the limit for reporting of 10 mg/kg. Table 21 ABS printed by FDM, Other substances with a hit rate for identification below 70% continued
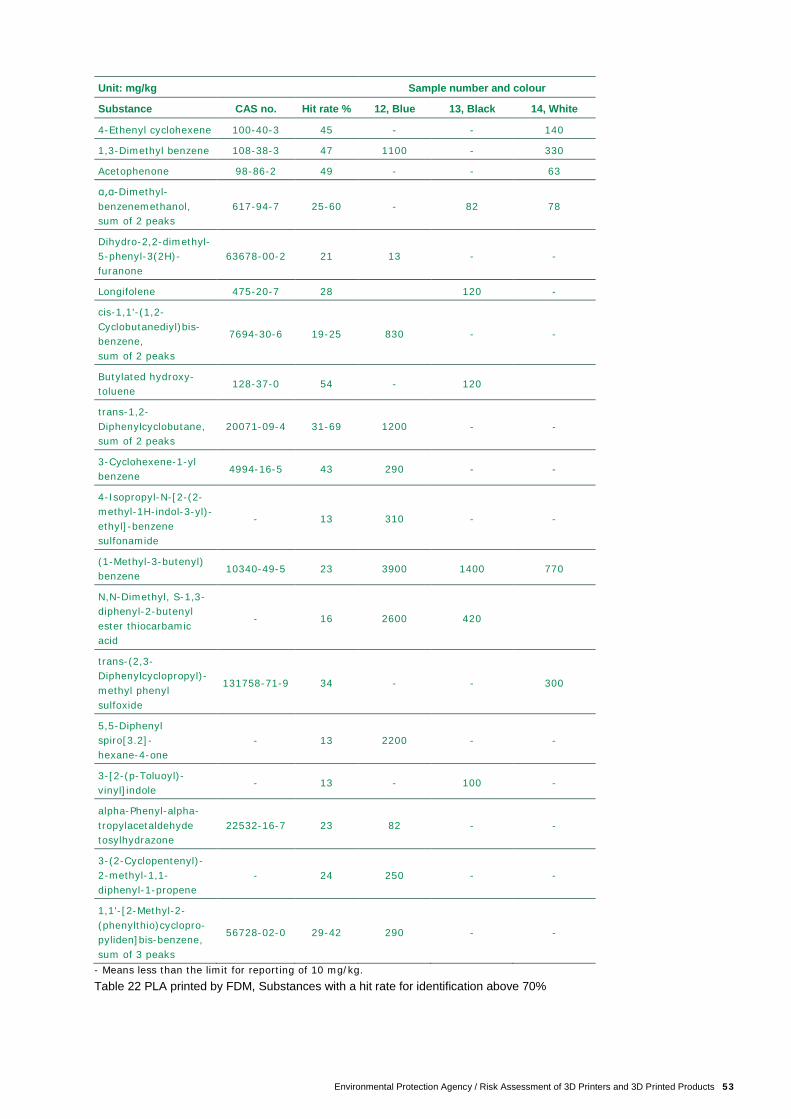
Environmental Protection Agency / Risk Assessment of 3D Printers and 3D Printed Products 53
Unit: mg/kg Sample number and colour
Substance CAS no. Hit rate % 12, Blue 13, Black 14, White
4-Ethenyl cyclohexene 100-40-3 45 - - 140
1,3-Dimethyl benzene 108-38-3 47 1100 - 330
Acetophenone 98-86-2 49 - - 63
α,α-Dimethyl-benzenemethanol, sum of 2 peaks
617-94-7 25-60 - 82 78
Dihydro-2,2-dimethyl-5-phenyl-3(2H)-furanone
63678-00-2 21 13 - -
Longifolene 475-20-7 28 120 -
cis-1,1'-(1,2-Cyclobutanediyl)bis-benzene, sum of 2 peaks
7694-30-6 19-25 830 - -
Butylated hydroxy-toluene
128-37-0 54 - 120
trans-1,2-Diphenylcyclobutane, sum of 2 peaks
20071-09-4 31-69 1200 - -
3-Cyclohexene-1-yl benzene
4994-16-5 43 290 - -
4-Isopropyl-N-[2-(2-methyl-1H-indol-3-yl)-ethyl]-benzene sulfonamide
- 13 310 - -
(1-Methyl-3-butenyl) benzene
10340-49-5 23 3900 1400 770
N,N-Dimethyl, S-1,3-diphenyl-2-butenyl ester thiocarbamic acid
- 16 2600 420
trans-(2,3-Diphenylcyclopropyl)-methyl phenyl sulfoxide
131758-71-9 34 - - 300
5,5-Diphenyl spiro[3.2]- hexane-4-one
- 13 2200 - -
3-[2-(p-Toluoyl)-vinyl]indole
- 13 - 100 -
alpha-Phenyl-alpha-tropylacetaldehyde tosylhydrazone
22532-16-7 23 82 - -
3-(2-Cyclopentenyl)-2-methyl-1,1-diphenyl-1-propene
- 24 250 - -
1,1'-[2-Methyl-2-(phenylthio)cyclopro-pyliden]bis-benzene, sum of 3 peaks
56728-02-0 29-42 290 - -
- Means less than the limit for reporting of 10 mg/kg. Table 22 PLA printed by FDM, Substances with a hit rate for identification above 70%
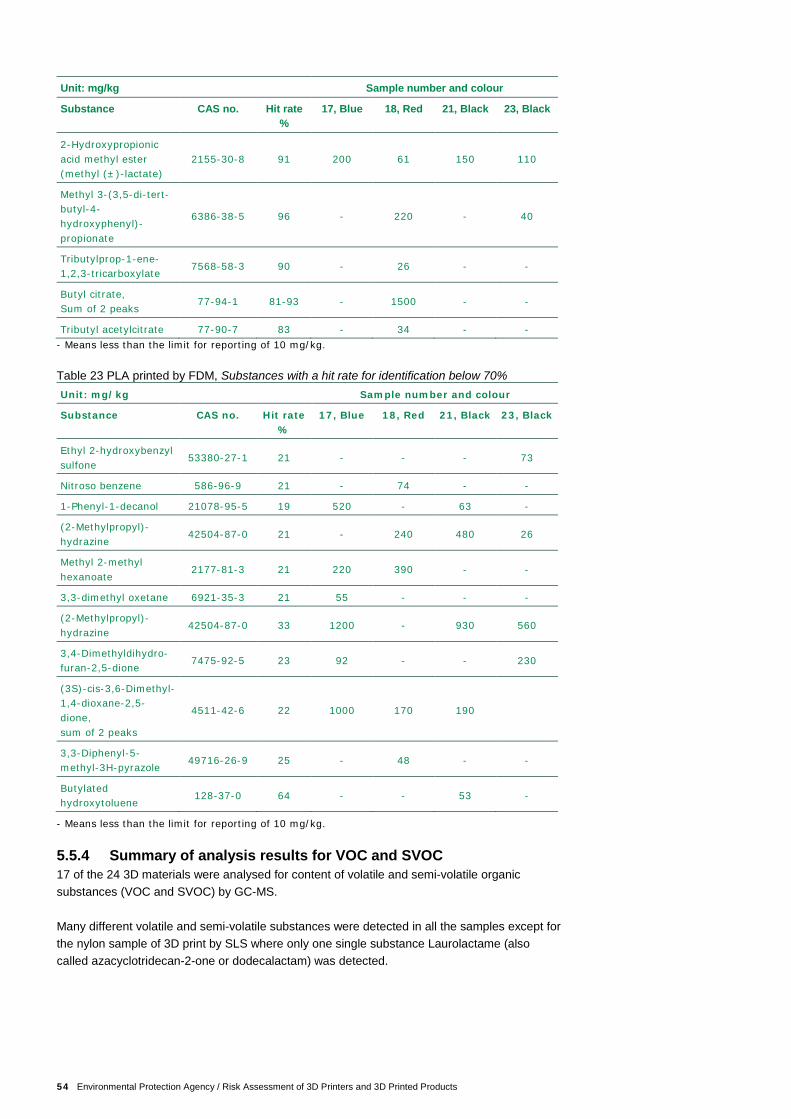
54 Environmental Protection Agency / Risk Assessment of 3D Printers and 3D Printed Products
Unit: mg/kg Sample number and colour
Substance CAS no. Hit rate %
17, Blue 18, Red 21, Black 23, Black
2-Hydroxypropionic acid methyl ester (methyl (±)-lactate)
2155-30-8 91 200 61 150 110
Methyl 3-(3,5-di-tert-butyl-4-hydroxyphenyl)-propionate
6386-38-5 96 - 220 - 40
Tributylprop-1-ene-1,2,3-tricarboxylate
7568-58-3 90 - 26 - -
Butyl citrate, Sum of 2 peaks
77-94-1 81-93 - 1500 - -
Tributyl acetylcitrate 77-90-7 83 - 34 - - - Means less than the limit for reporting of 10 mg/kg. Table 23 PLA printed by FDM, Substances with a hit rate for identification below 70% Unit: mg/kg Sample number and colour
Substance CAS no. Hit rate %
17, Blue 18, Red 21, Black 23, Black
Ethyl 2-hydroxybenzyl sulfone
53380-27-1 21 - - - 73
Nitroso benzene 586-96-9 21 - 74 - -
1-Phenyl-1-decanol 21078-95-5 19 520 - 63 -
(2-Methylpropyl)-hydrazine
42504-87-0 21 - 240 480 26
Methyl 2-methyl hexanoate
2177-81-3 21 220 390 - -
3,3-dimethyl oxetane 6921-35-3 21 55 - - -
(2-Methylpropyl)-hydrazine
42504-87-0 33 1200 - 930 560
3,4-Dimethyldihydro-furan-2,5-dione
7475-92-5 23 92 - - 230
(3S)-cis-3,6-Dimethyl-1,4-dioxane-2,5-dione, sum of 2 peaks
4511-42-6 22 1000 170 190
3,3-Diphenyl-5-methyl-3H-pyrazole
49716-26-9 25 - 48 - -
Butylated hydroxytoluene
128-37-0 64 - - 53 -
- Means less than the limit for reporting of 10 mg/kg.
5.5.4 Summary of analysis results for VOC and SVOC 17 of the 24 3D materials were analysed for content of volatile and semi-volatile organic substances (VOC and SVOC) by GC-MS. Many different volatile and semi-volatile substances were detected in all the samples except for the nylon sample of 3D print by SLS where only one single substance Laurolactame (also called azacyclotridecan-2-one or dodecalactam) was detected.
Environmental Protection Agency / Risk Assessment of 3D Printers and 3D Printed Products 55
Especially in the resin samples (samples 1-3) and ABS samples (samples 5-14) many substances were detected. The stated hit rates for identification show that great uncertainty on identification is related to certain substances (see description of hit rate in 5.4.2). The substances typically recur within the groups of the individual types of 3D printing materials. For ABS, analyses were carried out especially for styrene, PAH and selected phthalates as they are known, possible substances. In the samples of ABS, styrene was detected, but not PAH or phthalates. Resin is the only 3D printing material, in which a content of phthalates was detected. However, they were detected at very low levels (0.4-51 mg/kg). PAH was not detected in any of the analysed 3D printing materials. In the following, you will find a summary of each individual material type. Resin, samples 1-3: Resin is the 3D printing material, in which most different substances were detected compared with the other 3D printing materials. Most substances have concentrations below 1000 mg/kg, but there are also 7 cases of substances with concentrations above 1000 mg/kg. The substance with the highest concentration is 1-hydroxycyclohexylphenyl-methanon (1-Hydroxycyclohexylphenylketon) of between 2900 mg/kg and up to 15000 mg/kg. The 15000 mg/kg were detected in the white resin (sample 1). See Table 14 and Table 16. A very low content of phthalates was detected in the resins with a content of max. 51 mg/kg for benzylbutyl phthalate in sample 2 (black). See Table 15. Sample 1 differs from sample 2 and 3. They are from the same supplier, and they differ as the resins basically are different. Resin 1 is based on a hydrogenated Bisphenol A, Epoxy resin, whereas resin 2 and 3 both consist of methacrylated oligomers and monomers with various additives. There are several common features for the constituents in sample 2 and 3, but there are also differences. Nylon, sample 4: Only one single substance was detected during the analysis in a concentration of 230 mg/kg and that was Laurolactame (also called Azacyclotridecan-2-one or Dodecalactame), see Table 10. It is the monomer from Nylon 12 (Polyamide). In 2004, the migration of Laurolactame was studied by Stoffers et al. in connection with migration of nylon food packaging (see chapter 3.2.2.). ABS, samples 5-14: A content of Styrene and nitrile compounds was detected in rather high concentrations in all ABS samples, see Table 18 and Table 19. Styrene is one of the monomers in Acrylonitrile-butadiene-styrene. The different nitrile compounds are created from monomers of the material, but it is not possible to determine whether the substances are present, or if they have been created during the analysis by GC-MS from monomers of Acrylonitrile, Butadiene or Styrene. The detected amounts of styrene vary from 870 mg/kg to 8600 mg/kg. The content of nitrile compounds is in the interval from 62 to 22000 mg/kg. 22000 mg/kg was detected in sample 6. In addition, many other substances have been detected, and some of them appear in rather high amounts. In connection with the 10 ABS samples, substances above 1000 mg/kg were found 43 times. Fewer constituents or smaller concentrations of constituents were not detected in the white materials compared with the coloured materials, see Table 20 and Table 21. PLA, samples 17, 18, 21 and 23: Fewer substances were detected in the 4 investigated samples of PLA than in the resin and ABS samples. In general, the concentration of substances in PLA is low with only 2 substances in concentrations just exceeding 1000 mg/kg. see Table 22 and Table 23.
56 Environmental Protection Agency / Risk Assessment of 3D Printers and 3D Printed Products
5.6 Migration tests As an alternative to carrying out further analyses of content and assessments of the detected constituents, it was decided to use project funding to carry out migration tests as simulation of exposure during the specific use. As the project’s main focus is on children, it was – as in the case of toys - decided to focus on the substances that have problematic health effects, e.g., endocrine disruptive effects and CMR substances. The migration tests were carried out according to the methods for migration testing of toys. No migration tests were carried out according to the standards for food contact materials. If the manufacturer states that the material is suited for contact with food, then all constituents have to be assessed. Monomers and other basic substances have to be on the positive list. Some substances, e.g., reaction products, degradation substances, dyes and solvents do not have to be on the positive list. Nevertheless, the manufacturer has to make a decision about them and document that they do not migrate to food in harmful amounts. 5.6.1 Selection of samples for migration test In the following, reasons are given for selecting individual 3D materials for specific analyses of migration liquids. 3D printing materials analysed for migration of acrylates As mentioned earlier, residue monomers of the resins cannot be detected by the screening analysis by GC-MS, and therefore it is relevant to investigate if they can be detected in the migration liquids. The two resin samples based on methacrylated oligomers and monomers (sample 2 and 3) were chosen for specific analysis for the typical residue monomers from acrylate-based resins: acrylic acid, methyl methacrylate, methacrylic acid, n-Butyl acrylate, 2-Ethylhexyl acrylate and n-Butyl methacrylate. 3D printing materials analysed for migration of Acrylonitrile Likewise, the monomer in ABS, Acrylonitrile, cannot be detected by a screening analysis by GC-MS and was therefore chosen for specific analysis. Five samples of ABS that had the highest content of nitriles were selected (sample 6, 10, 12, 13 and 14). Styrene is also a relevant monomer from ABS, but it is comprised by the substances according to EN 71-9 + A1:2007. 3D printing materials analysed for migration of VOC and SVOC The samples selected for migration with subsequent screening analysis for VOC and SVOC with focus on toxic substances were: the 3 resins as a large number of constituents (sample 1, 2 and 3) were detected, and 5 ABS samples identified by DHI, generally in high levels (sample 6, 10, 12, 13, 14). Added to that comes 4 samples of PLA (sample 17, 18, 22 and 23) - no. 23 is the cheapest PLA, and no. 22 has another colour than the three others. 3D printing materials for testing and analysis according to EN 71-9 9 samples were selected for migration of the substances in EN 71-9 + A1:2007 in the materials resin, ABS and PLA. For polymers, EN 71-9 states testing according to tables 2D, 2E and 2I in the standard, but it was agreed only to carry out tests for the substances in tables 2D and 2E, as it is estimated that the substances in 2I are not used in the polymers. Not all of the substances comprised by EN 71-9, tables 2D and 2E, are comprised by the screening analysis by GC-MS, and therefore analyses were carried out on substances from selected 3D printing materials.
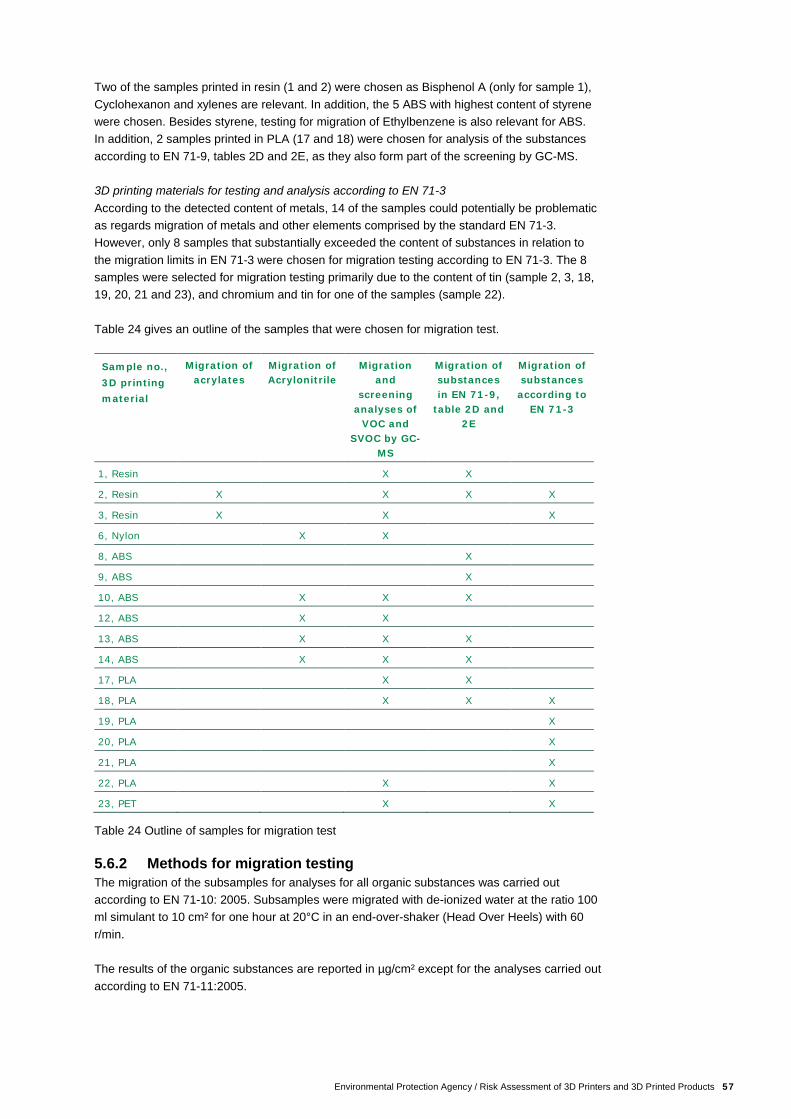
Environmental Protection Agency / Risk Assessment of 3D Printers and 3D Printed Products 57
Two of the samples printed in resin (1 and 2) were chosen as Bisphenol A (only for sample 1), Cyclohexanon and xylenes are relevant. In addition, the 5 ABS with highest content of styrene were chosen. Besides styrene, testing for migration of Ethylbenzene is also relevant for ABS. In addition, 2 samples printed in PLA (17 and 18) were chosen for analysis of the substances according to EN 71-9, tables 2D and 2E, as they also form part of the screening by GC-MS. 3D printing materials for testing and analysis according to EN 71-3 According to the detected content of metals, 14 of the samples could potentially be problematic as regards migration of metals and other elements comprised by the standard EN 71-3. However, only 8 samples that substantially exceeded the content of substances in relation to the migration limits in EN 71-3 were chosen for migration testing according to EN 71-3. The 8 samples were selected for migration testing primarily due to the content of tin (sample 2, 3, 18, 19, 20, 21 and 23), and chromium and tin for one of the samples (sample 22). Table 24 gives an outline of the samples that were chosen for migration test.
Table 24 Outline of samples for migration test 5.6.2 Methods for migration testing The migration of the subsamples for analyses for all organic substances was carried out according to EN 71-10: 2005. Subsamples were migrated with de-ionized water at the ratio 100 ml simulant to 10 cm² for one hour at 20°C in an end-over-shaker (Head Over Heels) with 60 r/min. The results of the organic substances are reported in µg/cm² except for the analyses carried out according to EN 71-11:2005.
Sample no., 3D printing material
Migration of acrylates
Migration of Acrylonitrile
Migration and
screening analyses of
VOC and SVOC by GC-
MS
Migration of substances in EN 71-9,
table 2D and 2E
Migration of substances according to
EN 71-3
1, Resin X X
2, Resin X X X X
3, Resin X X X
6, Nylon X X
8, ABS X
9, ABS X
10, ABS X X X
12, ABS X X
13, ABS X X X
14, ABS X X X
17, PLA X X
18, PLA X X X
19, PLA X
20, PLA X
21, PLA X
22, PLA X X
23, PET X X
58 Environmental Protection Agency / Risk Assessment of 3D Printers and 3D Printed Products
The reason for choosing that method for migration testing and for choosing the specific migration liquid was that the Danish EPA in 2015 made an outline of the migration tests that had been carried out over the past years regarding migration of five specific phthalates in soft PVC (the Danish EPA, 2015). In the report, it was pointed out that static tests gave lower migration values than dynamic tests. The report mentions the Dutch method called Head Over Heels9 for use in migration analyses. By comparing the different analysis methods and parameters it appears that the Head Over Heels method is the migration method that gives the most realistic migration rates, and that using water can replace sweat and saliva simulant. In this project, the migration tests for the organic substances were therefore carried out with the Head Over Heels method, and water was used as alternative to traditional sweat and saliva simulants according to standard DS/EN 71-10: 2006. 5.6.3 Analysis methods used for migration liquids In the following chapters, information is given about the applied methods for analysis of migration liquids from the migration tests that were carried out. Substances according to EN 71-9 + A1:2007, tables 2D and 2E The specific substances in EN 71-9 + A1:2007, table 2D and 3E, were analysed according to EN 71-11:2005. The results are reported in µg/L migration liquid according to the standard. Acrylic acid and acrylates The migration liquids of de-ionized water were analysed directly by HPLC with UV detection (HPLC/UV), and quantifications were carried out on the basis of the calibration curves. Blanks of the liquids were analysed correspondingly. Limit of detection of the method: 2.5 µg/cm² The limit of detection was determined from the lowest calibration point. Acrylonitrile Subsamples of app. 5 ml of the migration liquids were added internal standard and analysed directly by SPME with subsequent detection by capillary gas chromatography with mass selective detection (GC-MS). The quantifications were carried out from the calibration curves prepared in the migration liquid. Blanks of the liquids were analysed correspondingly. Limit of detection of the method: 0.005 µg/cm² The limit of detection was determined from the lowest calibration point. Selected extractable elements according to EN 71-3:2013+A1:2014 For the elements, migration from the samples was carried out with migration liquid consisting of a solution of hydrochloric acid. The analyses for the relevant migrated elements according to EN 71-3:2013+A1:2014 were analysed by ICP-MS. Extracted chromium(III) and chromium(VI) are analysed by HPLC-ICP-MS if a content is detected of the total content of chromium above the limit values of Cr(III) and Cr(VI) according to EN 71-3:2013+A1:2014. Extracted organic tin is analysed by GC-MS if a content is detected of the total content of tin above the limit value for organic tin compounds according to EN 71-3:2013+A1:2014. Screening analyses by GC-MS As described earlier, the screening analyses by GC-MS cover a large number of volatile and semi-volatile substances (see further information in chapter 6.4.2.1).
9 (Developed by the Nutrition Research Institute, TNO, The Netherlands)
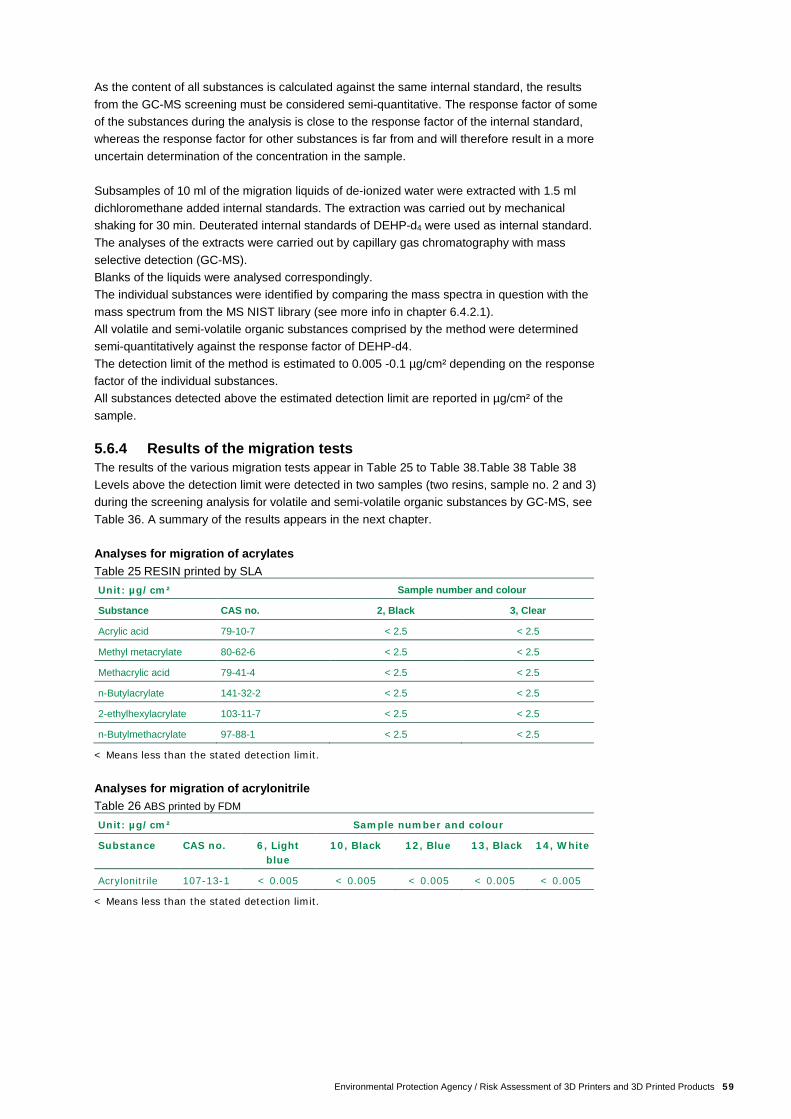
Environmental Protection Agency / Risk Assessment of 3D Printers and 3D Printed Products 59
As the content of all substances is calculated against the same internal standard, the results from the GC-MS screening must be considered semi-quantitative. The response factor of some of the substances during the analysis is close to the response factor of the internal standard, whereas the response factor for other substances is far from and will therefore result in a more uncertain determination of the concentration in the sample. Subsamples of 10 ml of the migration liquids of de-ionized water were extracted with 1.5 ml dichloromethane added internal standards. The extraction was carried out by mechanical shaking for 30 min. Deuterated internal standards of DEHP-d4 were used as internal standard. The analyses of the extracts were carried out by capillary gas chromatography with mass selective detection (GC-MS). Blanks of the liquids were analysed correspondingly. The individual substances were identified by comparing the mass spectra in question with the mass spectrum from the MS NIST library (see more info in chapter 6.4.2.1). All volatile and semi-volatile organic substances comprised by the method were determined semi-quantitatively against the response factor of DEHP-d4. The detection limit of the method is estimated to 0.005 -0.1 µg/cm² depending on the response factor of the individual substances. All substances detected above the estimated detection limit are reported in µg/cm² of the sample. 5.6.4 Results of the migration tests The results of the various migration tests appear in Table 25 to Table 38.Table 38 Table 38 Levels above the detection limit were detected in two samples (two resins, sample no. 2 and 3) during the screening analysis for volatile and semi-volatile organic substances by GC-MS, see Table 36. A summary of the results appears in the next chapter. Analyses for migration of acrylates Table 25 RESIN printed by SLA Unit: µg/cm² Sample number and colour
Substance CAS no. 2, Black 3, Clear
Acrylic acid 79-10-7 < 2.5 < 2.5
Methyl metacrylate 80-62-6 < 2.5 < 2.5
Methacrylic acid 79-41-4 < 2.5 < 2.5
n-Butylacrylate 141-32-2 < 2.5 < 2.5
2-ethylhexylacrylate 103-11-7 < 2.5 < 2.5
n-Butylmethacrylate 97-88-1 < 2.5 < 2.5
< Means less than the stated detection limit.
Analyses for migration of acrylonitrile Table 26 ABS printed by FDM
Unit: µg/cm² Sample number and colour
Substance CAS no. 6, Light blue
10, Black 12, Blue 13, Black 14, White
Acrylonitrile 107-13-1 < 0.005 < 0.005 < 0.005 < 0.005 < 0.005
< Means less than the stated detection limit.
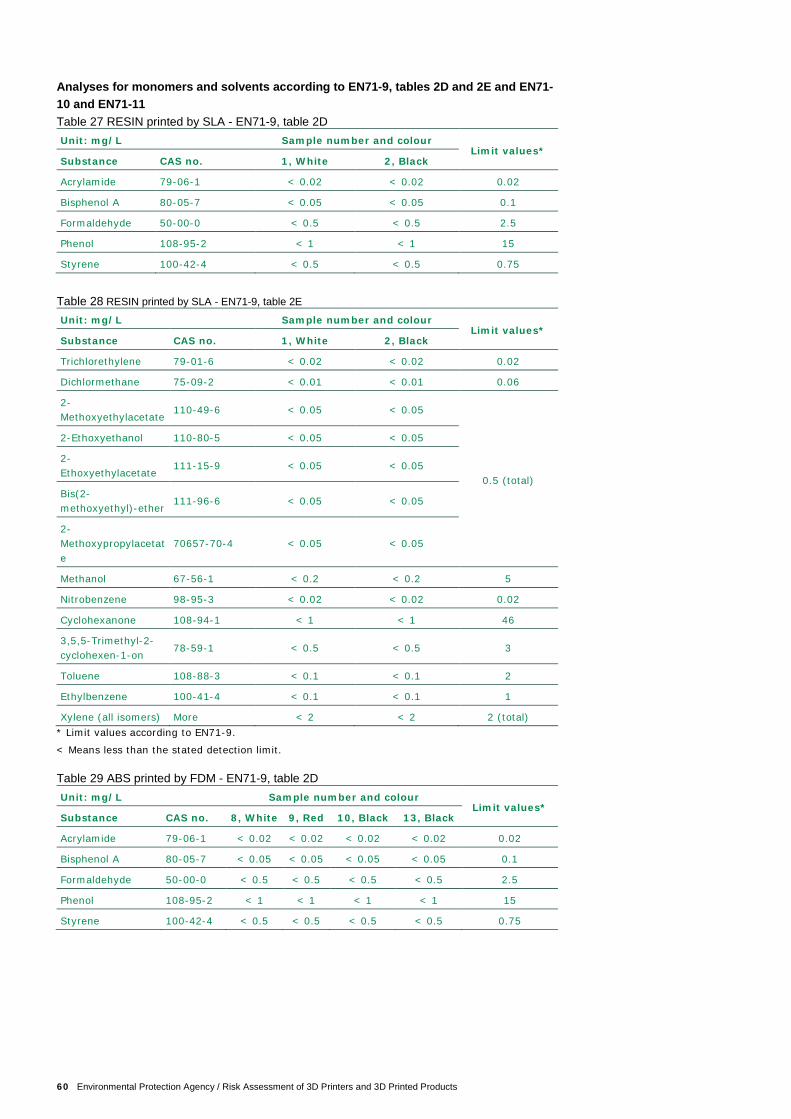
60 Environmental Protection Agency / Risk Assessment of 3D Printers and 3D Printed Products
Analyses for monomers and solvents according to EN71-9, tables 2D and 2E and EN71-10 and EN71-11 Table 27 RESIN printed by SLA - EN71-9, table 2D Unit: mg/L Sample number and colour
Limit values* Substance CAS no. 1, White 2, Black
Acrylamide 79-06-1 < 0.02 < 0.02 0.02
Bisphenol A 80-05-7 < 0.05 < 0.05 0.1
Formaldehyde 50-00-0 < 0.5 < 0.5 2.5
Phenol 108-95-2 < 1 < 1 15
Styrene 100-42-4 < 0.5 < 0.5 0.75
Table 28 RESIN printed by SLA - EN71-9, table 2E
Unit: mg/L Sample number and colour Limit values*
Substance CAS no. 1, White 2, Black
Trichlorethylene 79-01-6 < 0.02 < 0.02 0.02
Dichlormethane 75-09-2 < 0.01 < 0.01 0.06
2-Methoxyethylacetate
110-49-6 < 0.05 < 0.05
0.5 (total)
2-Ethoxyethanol 110-80-5 < 0.05 < 0.05
2-Ethoxyethylacetate
111-15-9 < 0.05 < 0.05
Bis(2-methoxyethyl)-ether
111-96-6 < 0.05 < 0.05
2-Methoxypropylacetate
70657-70-4 < 0.05 < 0.05
Methanol 67-56-1 < 0.2 < 0.2 5
Nitrobenzene 98-95-3 < 0.02 < 0.02 0.02
Cyclohexanone 108-94-1 < 1 < 1 46
3,5,5-Trimethyl-2-cyclohexen-1-on
78-59-1 < 0.5 < 0.5 3
Toluene 108-88-3 < 0.1 < 0.1 2
Ethylbenzene 100-41-4 < 0.1 < 0.1 1
Xylene (all isomers) More < 2 < 2 2 (total) * Limit values according to EN71-9.
< Means less than the stated detection limit. Table 29 ABS printed by FDM - EN71-9, table 2D Unit: mg/L Sample number and colour
Limit values* Substance CAS no. 8, White 9, Red 10, Black 13, Black
Acrylamide 79-06-1 < 0.02 < 0.02 < 0.02 < 0.02 0.02
Bisphenol A 80-05-7 < 0.05 < 0.05 < 0.05 < 0.05 0.1
Formaldehyde 50-00-0 < 0.5 < 0.5 < 0.5 < 0.5 2.5
Phenol 108-95-2 < 1 < 1 < 1 < 1 15
Styrene 100-42-4 < 0.5 < 0.5 < 0.5 < 0.5 0.75
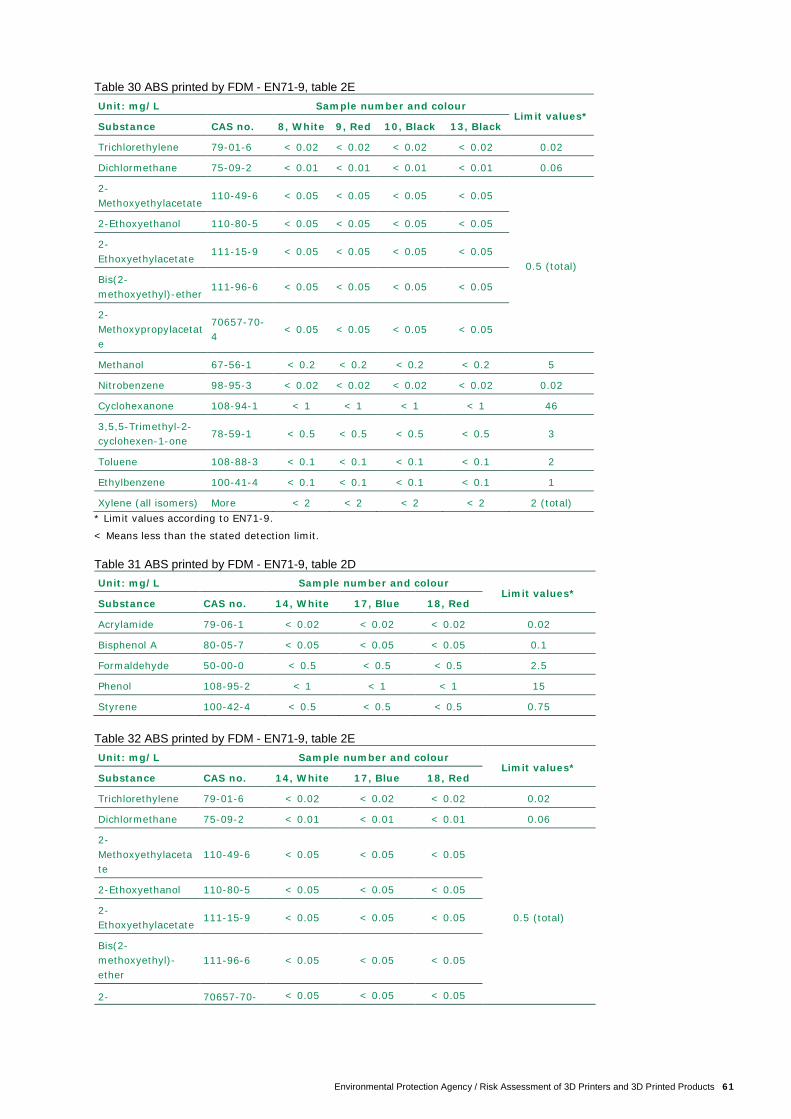
Environmental Protection Agency / Risk Assessment of 3D Printers and 3D Printed Products 61
Table 30 ABS printed by FDM - EN71-9, table 2E Unit: mg/L Sample number and colour
Limit values* Substance CAS no. 8, White 9, Red 10, Black 13, Black
Trichlorethylene 79-01-6 < 0.02 < 0.02 < 0.02 < 0.02 0.02
Dichlormethane 75-09-2 < 0.01 < 0.01 < 0.01 < 0.01 0.06
2-Methoxyethylacetate
110-49-6 < 0.05 < 0.05 < 0.05 < 0.05
0.5 (total)
2-Ethoxyethanol 110-80-5 < 0.05 < 0.05 < 0.05 < 0.05
2-Ethoxyethylacetate
111-15-9 < 0.05 < 0.05 < 0.05 < 0.05
Bis(2-methoxyethyl)-ether
111-96-6 < 0.05 < 0.05 < 0.05 < 0.05
2-Methoxypropylacetate
70657-70-4
< 0.05 < 0.05 < 0.05 < 0.05
Methanol 67-56-1 < 0.2 < 0.2 < 0.2 < 0.2 5
Nitrobenzene 98-95-3 < 0.02 < 0.02 < 0.02 < 0.02 0.02
Cyclohexanone 108-94-1 < 1 < 1 < 1 < 1 46
3,5,5-Trimethyl-2-cyclohexen-1-one
78-59-1 < 0.5 < 0.5 < 0.5 < 0.5 3
Toluene 108-88-3 < 0.1 < 0.1 < 0.1 < 0.1 2
Ethylbenzene 100-41-4 < 0.1 < 0.1 < 0.1 < 0.1 1
Xylene (all isomers) More < 2 < 2 < 2 < 2 2 (total) * Limit values according to EN71-9.
< Means less than the stated detection limit. Table 31 ABS printed by FDM - EN71-9, table 2D Unit: mg/L Sample number and colour
Limit values* Substance CAS no. 14, White 17, Blue 18, Red
Acrylamide 79-06-1 < 0.02 < 0.02 < 0.02 0.02
Bisphenol A 80-05-7 < 0.05 < 0.05 < 0.05 0.1
Formaldehyde 50-00-0 < 0.5 < 0.5 < 0.5 2.5
Phenol 108-95-2 < 1 < 1 < 1 15
Styrene 100-42-4 < 0.5 < 0.5 < 0.5 0.75 Table 32 ABS printed by FDM - EN71-9, table 2E Unit: mg/L Sample number and colour
Limit values* Substance CAS no. 14, White 17, Blue 18, Red
Trichlorethylene 79-01-6 < 0.02 < 0.02 < 0.02 0.02
Dichlormethane 75-09-2 < 0.01 < 0.01 < 0.01 0.06
2-Methoxyethylacetate
110-49-6 < 0.05 < 0.05 < 0.05
0.5 (total)
2-Ethoxyethanol 110-80-5 < 0.05 < 0.05 < 0.05
2-Ethoxyethylacetate
111-15-9 < 0.05 < 0.05 < 0.05
Bis(2-methoxyethyl)-ether
111-96-6 < 0.05 < 0.05 < 0.05
2- 70657-70- < 0.05 < 0.05 < 0.05
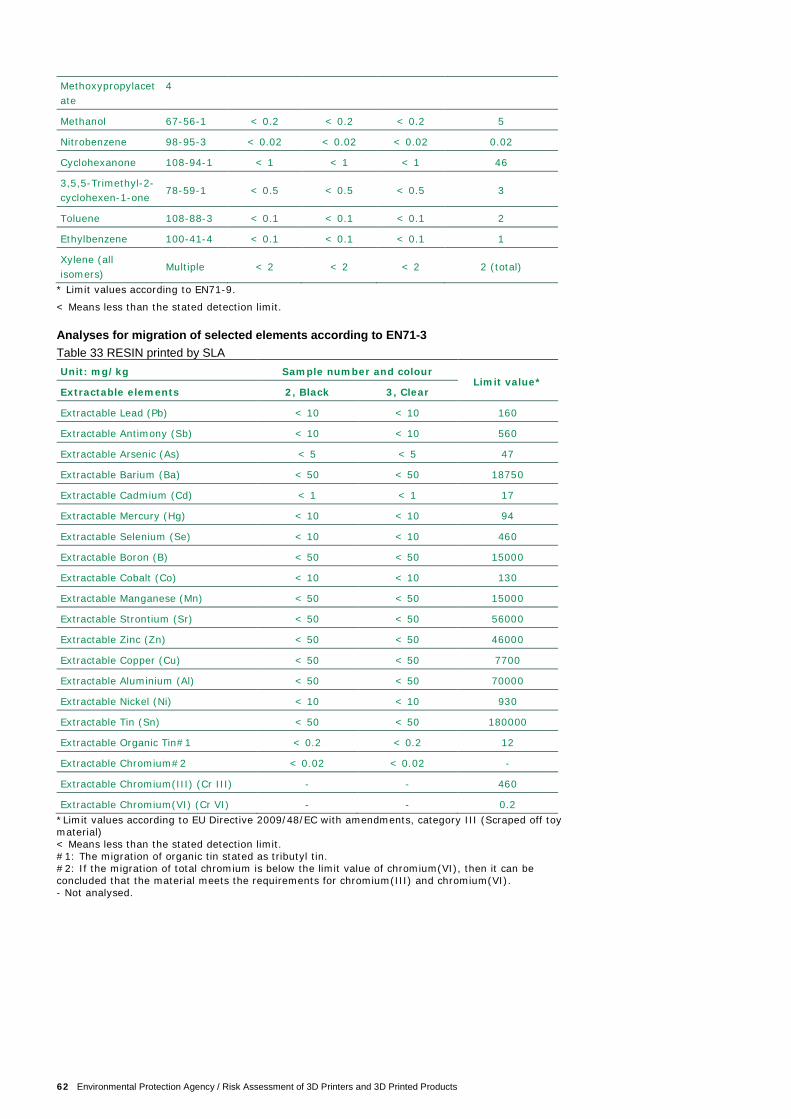
62 Environmental Protection Agency / Risk Assessment of 3D Printers and 3D Printed Products
Methoxypropylacetate
4
Methanol 67-56-1 < 0.2 < 0.2 < 0.2 5
Nitrobenzene 98-95-3 < 0.02 < 0.02 < 0.02 0.02
Cyclohexanone 108-94-1 < 1 < 1 < 1 46
3,5,5-Trimethyl-2-cyclohexen-1-one
78-59-1 < 0.5 < 0.5 < 0.5 3
Toluene 108-88-3 < 0.1 < 0.1 < 0.1 2
Ethylbenzene 100-41-4 < 0.1 < 0.1 < 0.1 1
Xylene (all isomers)
Multiple < 2 < 2 < 2 2 (total)
* Limit values according to EN71-9.
< Means less than the stated detection limit. Analyses for migration of selected elements according to EN71-3 Table 33 RESIN printed by SLA Unit: mg/kg Sample number and colour
Limit value* Extractable elements 2, Black 3, Clear
Extractable Lead (Pb) < 10 < 10 160
Extractable Antimony (Sb) < 10 < 10 560
Extractable Arsenic (As) < 5 < 5 47
Extractable Barium (Ba) < 50 < 50 18750
Extractable Cadmium (Cd) < 1 < 1 17
Extractable Mercury (Hg) < 10 < 10 94
Extractable Selenium (Se) < 10 < 10 460
Extractable Boron (B) < 50 < 50 15000
Extractable Cobalt (Co) < 10 < 10 130
Extractable Manganese (Mn) < 50 < 50 15000
Extractable Strontium (Sr) < 50 < 50 56000
Extractable Zinc (Zn) < 50 < 50 46000
Extractable Copper (Cu) < 50 < 50 7700
Extractable Aluminium (Al) < 50 < 50 70000
Extractable Nickel (Ni) < 10 < 10 930
Extractable Tin (Sn) < 50 < 50 180000
Extractable Organic Tin#1 < 0.2 < 0.2 12
Extractable Chromium#2 < 0.02 < 0.02 -
Extractable Chromium(III) (Cr III) - - 460
Extractable Chromium(VI) (Cr VI) - - 0.2 *Limit values according to EU Directive 2009/48/EC with amendments, category III (Scraped off toy material) < Means less than the stated detection limit. #1: The migration of organic tin stated as tributyl tin. #2: If the migration of total chromium is below the limit value of chromium(VI), then it can be concluded that the material meets the requirements for chromium(III) and chromium(VI). - Not analysed.
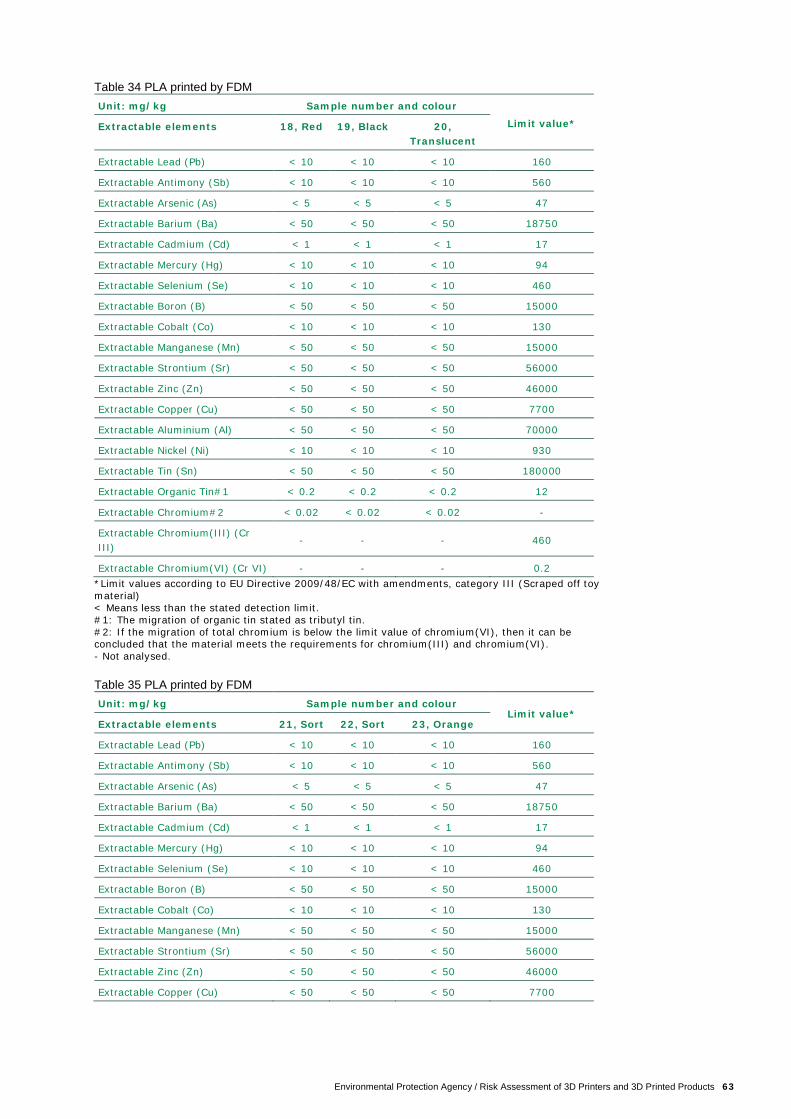
Environmental Protection Agency / Risk Assessment of 3D Printers and 3D Printed Products 63
Table 34 PLA printed by FDM Unit: mg/kg Sample number and colour
Limit value* Extractable elements 18, Red 19, Black 20, Translucent
Extractable Lead (Pb) < 10 < 10 < 10 160
Extractable Antimony (Sb) < 10 < 10 < 10 560
Extractable Arsenic (As) < 5 < 5 < 5 47
Extractable Barium (Ba) < 50 < 50 < 50 18750
Extractable Cadmium (Cd) < 1 < 1 < 1 17
Extractable Mercury (Hg) < 10 < 10 < 10 94
Extractable Selenium (Se) < 10 < 10 < 10 460
Extractable Boron (B) < 50 < 50 < 50 15000
Extractable Cobalt (Co) < 10 < 10 < 10 130
Extractable Manganese (Mn) < 50 < 50 < 50 15000
Extractable Strontium (Sr) < 50 < 50 < 50 56000
Extractable Zinc (Zn) < 50 < 50 < 50 46000
Extractable Copper (Cu) < 50 < 50 < 50 7700
Extractable Aluminium (Al) < 50 < 50 < 50 70000
Extractable Nickel (Ni) < 10 < 10 < 10 930
Extractable Tin (Sn) < 50 < 50 < 50 180000
Extractable Organic Tin#1 < 0.2 < 0.2 < 0.2 12
Extractable Chromium#2 < 0.02 < 0.02 < 0.02 -
Extractable Chromium(III) (Cr III)
- - - 460
Extractable Chromium(VI) (Cr VI) - - - 0.2 *Limit values according to EU Directive 2009/48/EC with amendments, category III (Scraped off toy material) < Means less than the stated detection limit. #1: The migration of organic tin stated as tributyl tin. #2: If the migration of total chromium is below the limit value of chromium(VI), then it can be concluded that the material meets the requirements for chromium(III) and chromium(VI). - Not analysed. Table 35 PLA printed by FDM Unit: mg/kg Sample number and colour
Limit value* Extractable elements 21, Sort 22, Sort 23, Orange
Extractable Lead (Pb) < 10 < 10 < 10 160
Extractable Antimony (Sb) < 10 < 10 < 10 560
Extractable Arsenic (As) < 5 < 5 < 5 47
Extractable Barium (Ba) < 50 < 50 < 50 18750
Extractable Cadmium (Cd) < 1 < 1 < 1 17
Extractable Mercury (Hg) < 10 < 10 < 10 94
Extractable Selenium (Se) < 10 < 10 < 10 460
Extractable Boron (B) < 50 < 50 < 50 15000
Extractable Cobalt (Co) < 10 < 10 < 10 130
Extractable Manganese (Mn) < 50 < 50 < 50 15000
Extractable Strontium (Sr) < 50 < 50 < 50 56000
Extractable Zinc (Zn) < 50 < 50 < 50 46000
Extractable Copper (Cu) < 50 < 50 < 50 7700
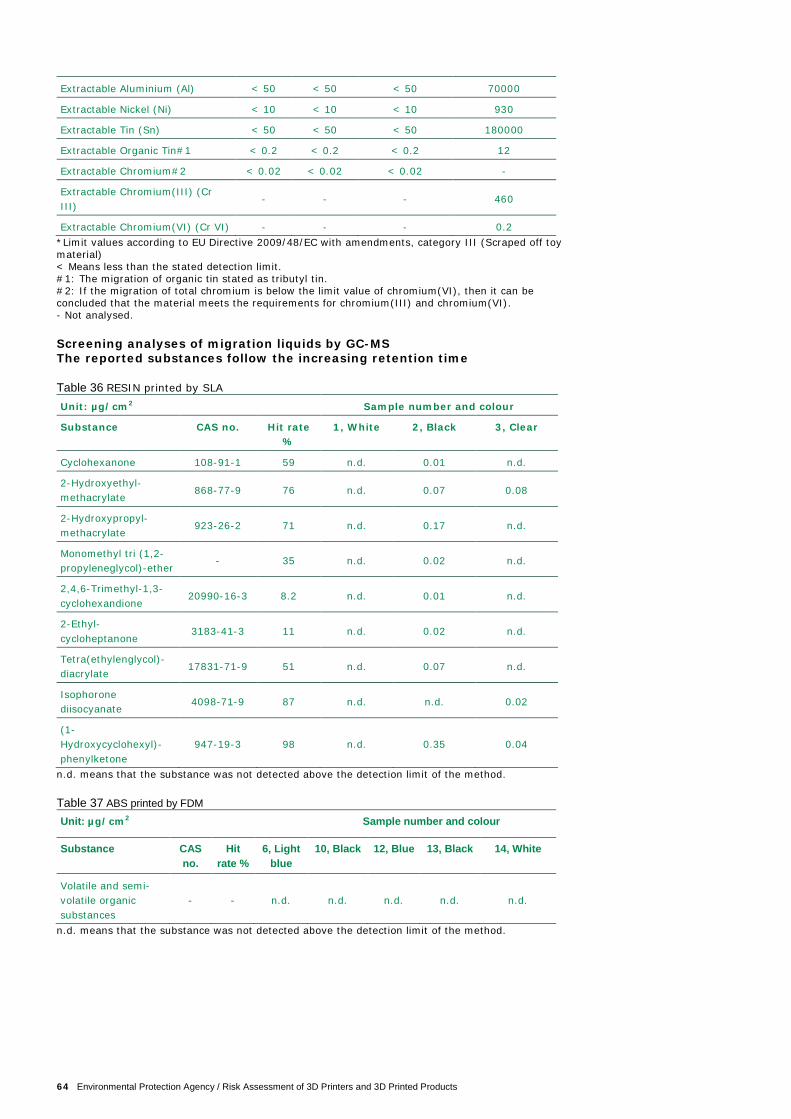
64 Environmental Protection Agency / Risk Assessment of 3D Printers and 3D Printed Products
Extractable Aluminium (Al) < 50 < 50 < 50 70000
Extractable Nickel (Ni) < 10 < 10 < 10 930
Extractable Tin (Sn) < 50 < 50 < 50 180000
Extractable Organic Tin#1 < 0.2 < 0.2 < 0.2 12
Extractable Chromium#2 < 0.02 < 0.02 < 0.02 -
Extractable Chromium(III) (Cr III)
- - - 460
Extractable Chromium(VI) (Cr VI) - - - 0.2 *Limit values according to EU Directive 2009/48/EC with amendments, category III (Scraped off toy material) < Means less than the stated detection limit. #1: The migration of organic tin stated as tributyl tin. #2: If the migration of total chromium is below the limit value of chromium(VI), then it can be concluded that the material meets the requirements for chromium(III) and chromium(VI). - Not analysed.
Screening analyses of migration liquids by GC-MS The reported substances follow the increasing retention time Table 36 RESIN printed by SLA
Unit: µg/cm2 Sample number and colour
Substance CAS no. Hit rate %
1, White 2, Black 3, Clear
Cyclohexanone 108-91-1 59 n.d. 0.01 n.d.
2-Hydroxyethyl-methacrylate
868-77-9 76 n.d. 0.07 0.08
2-Hydroxypropyl-methacrylate
923-26-2 71 n.d. 0.17 n.d.
Monomethyl tri (1,2-propyleneglycol)-ether
- 35 n.d. 0.02 n.d.
2,4,6-Trimethyl-1,3-cyclohexandione
20990-16-3 8.2 n.d. 0.01 n.d.
2-Ethyl-cycloheptanone
3183-41-3 11 n.d. 0.02 n.d.
Tetra(ethylenglycol)-diacrylate
17831-71-9 51 n.d. 0.07 n.d.
Isophorone diisocyanate
4098-71-9 87 n.d. n.d. 0.02
(1-Hydroxycyclohexyl)-phenylketone
947-19-3 98 n.d. 0.35 0.04
n.d. means that the substance was not detected above the detection limit of the method. Table 37 ABS printed by FDM
Unit: µg/cm2 Sample number and colour
Substance CAS no.
Hit rate %
6, Light blue
10, Black 12, Blue 13, Black 14, White
Volatile and semi-volatile organic substances
- - n.d. n.d. n.d. n.d. n.d.
n.d. means that the substance was not detected above the detection limit of the method.
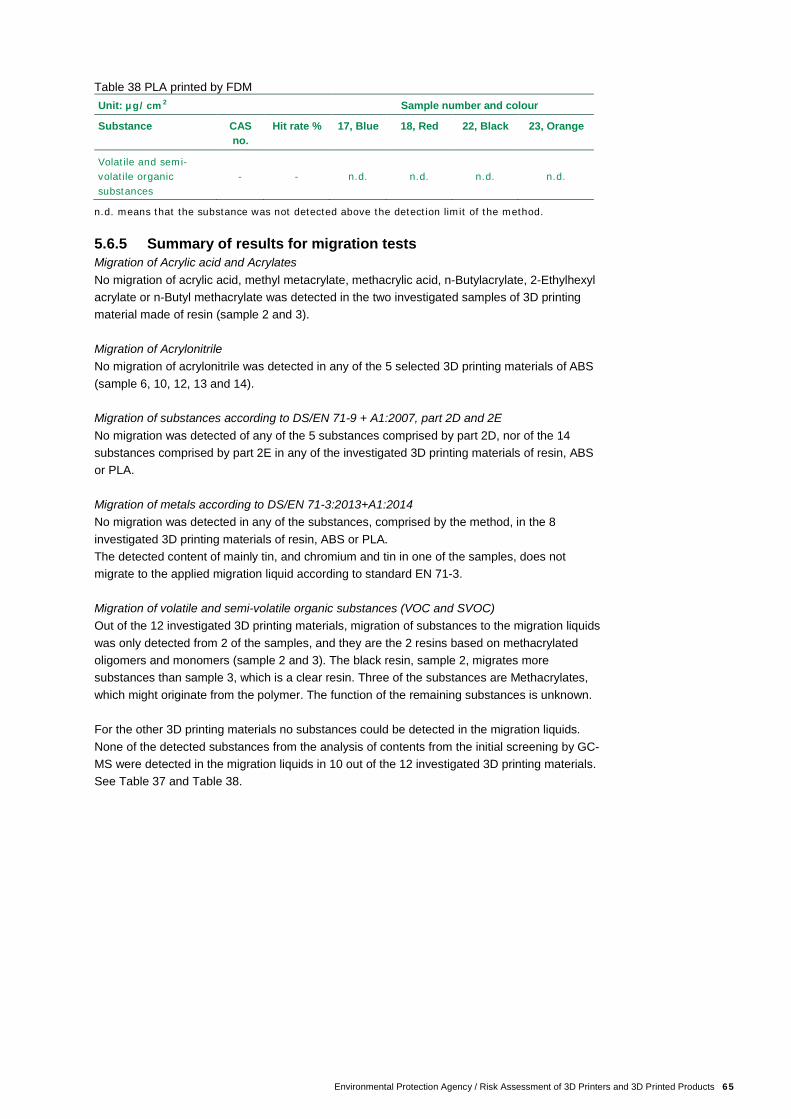
Environmental Protection Agency / Risk Assessment of 3D Printers and 3D Printed Products 65
Table 38 PLA printed by FDM Unit: µg/cm2 Sample number and colour
Substance CAS no.
Hit rate % 17, Blue 18, Red 22, Black 23, Orange
Volatile and semi-volatile organic substances
- - n.d. n.d. n.d. n.d.
n.d. means that the substance was not detected above the detection limit of the method. 5.6.5 Summary of results for migration tests Migration of Acrylic acid and Acrylates No migration of acrylic acid, methyl metacrylate, methacrylic acid, n-Butylacrylate, 2-Ethylhexyl acrylate or n-Butyl methacrylate was detected in the two investigated samples of 3D printing material made of resin (sample 2 and 3). Migration of Acrylonitrile No migration of acrylonitrile was detected in any of the 5 selected 3D printing materials of ABS (sample 6, 10, 12, 13 and 14). Migration of substances according to DS/EN 71-9 + A1:2007, part 2D and 2E No migration was detected of any of the 5 substances comprised by part 2D, nor of the 14 substances comprised by part 2E in any of the investigated 3D printing materials of resin, ABS or PLA. Migration of metals according to DS/EN 71-3:2013+A1:2014 No migration was detected in any of the substances, comprised by the method, in the 8 investigated 3D printing materials of resin, ABS or PLA. The detected content of mainly tin, and chromium and tin in one of the samples, does not migrate to the applied migration liquid according to standard EN 71-3. Migration of volatile and semi-volatile organic substances (VOC and SVOC) Out of the 12 investigated 3D printing materials, migration of substances to the migration liquids was only detected from 2 of the samples, and they are the 2 resins based on methacrylated oligomers and monomers (sample 2 and 3). The black resin, sample 2, migrates more substances than sample 3, which is a clear resin. Three of the substances are Methacrylates, which might originate from the polymer. The function of the remaining substances is unknown. For the other 3D printing materials no substances could be detected in the migration liquids. None of the detected substances from the analysis of contents from the initial screening by GC-MS were detected in the migration liquids in 10 out of the 12 investigated 3D printing materials. See Table 37 and Table 38.
66 Environmental Protection Agency / Risk Assessment of 3D Printers and 3D Printed Products
6. Exposure assessment
6.1 Scenario regarding exposure when printing As stated in chapter 4.1, an exposure assessment of a printing scenario for private consumers will take a starting point in the use of a 3D printer in a room of 20 m3 (i.e., a room of app. 8 m2) with airing 0.5 times per hour. A ”standard room” of that size has been used in connection with exposure assessments and risk assessments in other projects of the Danish EPA (the Danish EPA, 2006, 2016a, 2016b, respectively). In connection with ordinary stay in the printing room, an exposure time of 4 hours is anticipated, which according to the references in Table 1 is regarded as the upper limit for the duration of a printing process. For short-term exposure with peak concentrations when staying close to the printing process an exposure time of 15 minutes is anticipated. When assessing exposure levels of particles and volatile substances for this scenario, a starting point is taken in data that was discussed in chapter 4. In order to obtain worst case scenarios for exposure, data will be used from the type of printing that has led to the highest emission of the actual substances. 6.1.1 Exposure to particles 6.1.1.1 Particle number, ultrafine particles When going through the data in Table 1, with special focus on data from Azami et al. (2016) and Stephens et al. (2013), it was in chapter 4.1.1. assessed that an average exposure level of 130,500 ultrafine particles/cm3 can be obtained in a room of 20 m3 in connection with ABS printing. That level is used as a worst case exposure level for 4 hours. Data from Kim et al. (2015) is used as short-term peak concentrations close to the printing process. In connection with ABS printing, they measured a particle level of up to 3.4 x 10⁶ ultrafine particles/cm3 (continuous measuring result, i.e., ongoing reading of the concentration in the air). That value is used as worst case for a short-term 15-minute exposure. 6.1.1.2 Particle mass As discussed in chapter 4.1.1, the mass based particle levels measured by Kim et al. (2015) give a 4-hour worst case scenario of exposure of 7.1 µg particle mass/m3 (measured as particles less than 420 nm in diameter), when printing with ABS. The level was calculated by upscaling the measured level of 142 µg/m3 in 1 m3 to a room of 20 m3. Data from Kim et al. (2015) is also used for short-term (15 minutes) peak concentrations close to the printing process. In connection with PLA printing they measured a particle level of 142 µg particle mass/m3 (measured as particles less than 420 nm in diameter). The measurement of 142 µg/m3 is used directly for a short-term scenario (15 minutes) where the user stays close to the printer and follows the printing process.
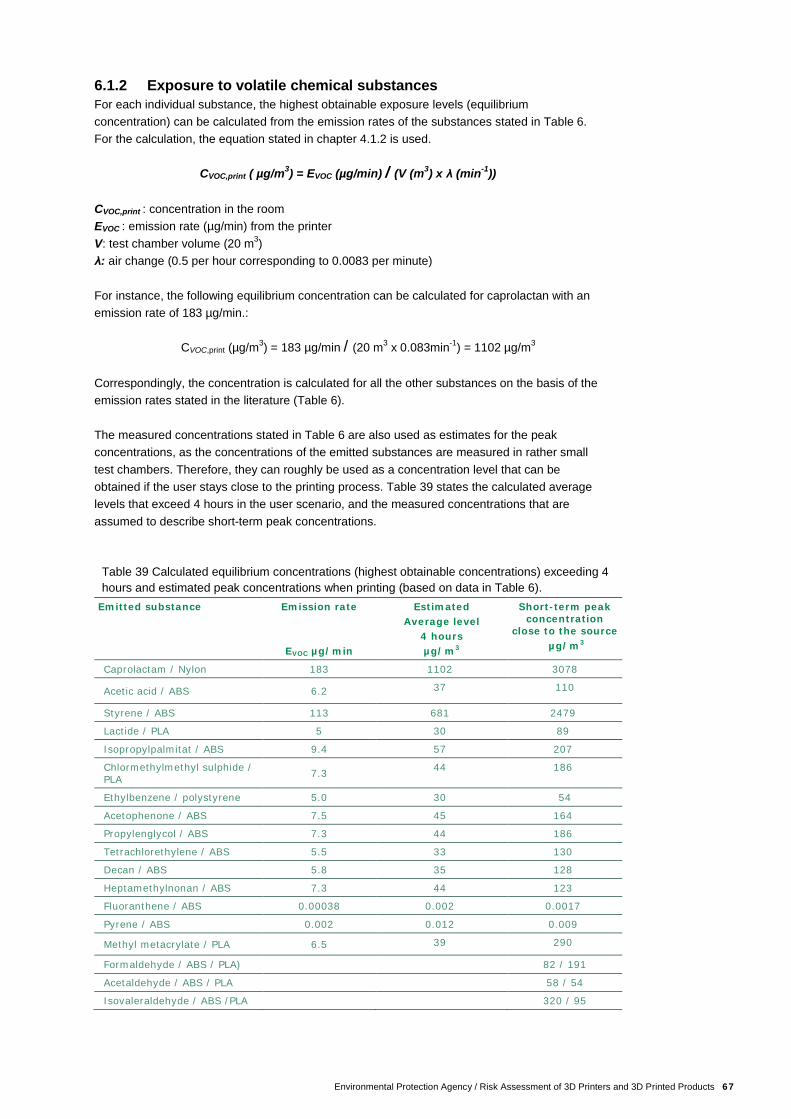
Environmental Protection Agency / Risk Assessment of 3D Printers and 3D Printed Products 67
6.1.2 Exposure to volatile chemical substances For each individual substance, the highest obtainable exposure levels (equilibrium concentration) can be calculated from the emission rates of the substances stated in Table 6. For the calculation, the equation stated in chapter 4.1.2 is used.
CVOC,print ( µg/m3) = EVOC (µg/min) / (V (m3) x λ (min-1)) CVOC,print : concentration in the room EVOC : emission rate (µg/min) from the printer V: test chamber volume (20 m3) λ: air change (0.5 per hour corresponding to 0.0083 per minute) For instance, the following equilibrium concentration can be calculated for caprolactan with an emission rate of 183 µg/min.: CVOC,print (µg/m3) = 183 µg/min / (20 m3 x 0.083min-1) = 1102 µg/m3 Correspondingly, the concentration is calculated for all the other substances on the basis of the emission rates stated in the literature (Table 6). The measured concentrations stated in Table 6 are also used as estimates for the peak concentrations, as the concentrations of the emitted substances are measured in rather small test chambers. Therefore, they can roughly be used as a concentration level that can be obtained if the user stays close to the printing process. Table 39 states the calculated average levels that exceed 4 hours in the user scenario, and the measured concentrations that are assumed to describe short-term peak concentrations.
Table 39 Calculated equilibrium concentrations (highest obtainable concentrations) exceeding 4 hours and estimated peak concentrations when printing (based on data in Table 6).
Emitted substance Emission rate
EVOC µg/min
Estimated Average level
4 hours µg/m3
Short-term peak concentration
close to the source µg/m3
Caprolactam / Nylon 183 1102 3078
Acetic acid / ABS 6.2 37 110
Styrene / ABS 113 681 2479
Lactide / PLA 5 30 89
Isopropylpalmitat / ABS 9.4 57 207
Chlormethylmethyl sulphide / PLA 7.3 44 186
Ethylbenzene / polystyrene 5.0 30 54
Acetophenone / ABS 7.5 45 164
Propylenglycol / ABS 7.3 44 186
Tetrachlorethylene / ABS 5.5 33 130
Decan / ABS 5.8 35 128
Heptamethylnonan / ABS 7.3 44 123
Fluoranthene / ABS 0.00038 0.002 0.0017
Pyrene / ABS 0.002 0.012 0.009
Methyl metacrylate / PLA 6.5 39 290
Formaldehyde / ABS / PLA) 82 / 191
Acetaldehyde / ABS / PLA 58 / 54
Isovaleraldehyde / ABS /PLA 320 / 95

68 Environmental Protection Agency / Risk Assessment of 3D Printers and 3D Printed Products
6.2 Exposure scenario resulting from migration from printed item
When assessing the exposure of the migrated substances it will be most conservative to take a starting point in scenario 1 as described in chapter 4.2, as the scenario with a mug will result in the largest exposure. In order to transfer data from the migration tests that were carried out with water at 20°C with a duration of 1 hour, a scenario was chosen where a one-year-old child drinks milk from the mug. According to the Danish Health and Medicines Authority, a one-year-old child should max. drink 500 ml milk per day (the Danish Health and Medicines Authority 2016). It is assumed that the daily amount of milk is distributed on 3 portions of 170 ml, and that the milk will remain in the mug 1 hour before drinking. There will probably be some uncertainty when using migration data based on water against low-fat milk that contains 1.5% fat, and it must be expected that the migration of organic substances from the mug can be a bit larger in low-fat milk than in 100% water. As stated in chapter 4.2, the oral exposure can be calculated on the basis of the following:
𝑫𝒐𝒐𝒐𝒐[µ𝒈
𝒌𝒈 𝒃𝒃] =𝒎𝒎𝒈𝒐𝒐𝒎𝒎𝒐𝒎 � µ𝒈
𝒄𝒎𝒄 𝒎𝒎𝒎𝒕� ∗ 𝒎𝒎𝒎𝒕 ∗ 𝒑𝒐𝒐𝒑𝒑𝒄𝒎 𝒐𝒐𝒕𝒐 [𝒄𝒎𝒄]
𝒃𝒐𝒑𝒃 𝒃𝒕𝒎𝒈𝒘𝒎 [𝒌𝒈]
Where Doral: exposure of a child (µg/ kg bw) Migration: amount of chemical substance that migrates out of the plastic (µg/cm2 /hour). Product area: If a cylindrical mug has a diameter of 7.5 cm, then it has to be filled 4.2 cm to hold 170 ml. The area from which substances can migrate can be calculated to: bottom: 44 cm2, sides: 99 cm2 (meaning 143 cm2 in total). Time: the time the food remains in the mug. It is set to 3 x1 hours as it is assumed that the three portions of food will remain in the mug 1 hour before being consumed (migration in chapter 5 was measured in the course of 1 hour). Body weight: 1-year-old child: 8.7 kg (NMR 2012). In connection with analyses of the migration of chemical substances from the printed items (chapter 5) no migration was found in the metals that were analysed for, in amounts that could be detected. Semi-volatile and volatile organic chemicals were only detected in 2 out of 12 samples. In the sample with largest migration (seeTable 40) it was found that migration of the chemical substances took place in the interval from 0.01 to 0.35 µg/cm2. Table 40 Migration from resin printed by SLA Substance CAS no. Black resin
Cyclohexanon 108-91-1 0.01
2-Hydroxyethyl methacrylate 868-77-9 0.07
2-Hydroxypropyl methacrylate 923-26-2 0.17
Monomethyl tri (1,2-propyleneglycol)-ether
- 0.02
2,4,6-Trimethyl-1,3-cyclohexandion 20990-16-3 0.01
2-Ethyl-cycloheptanon 3183-41-3 0.02
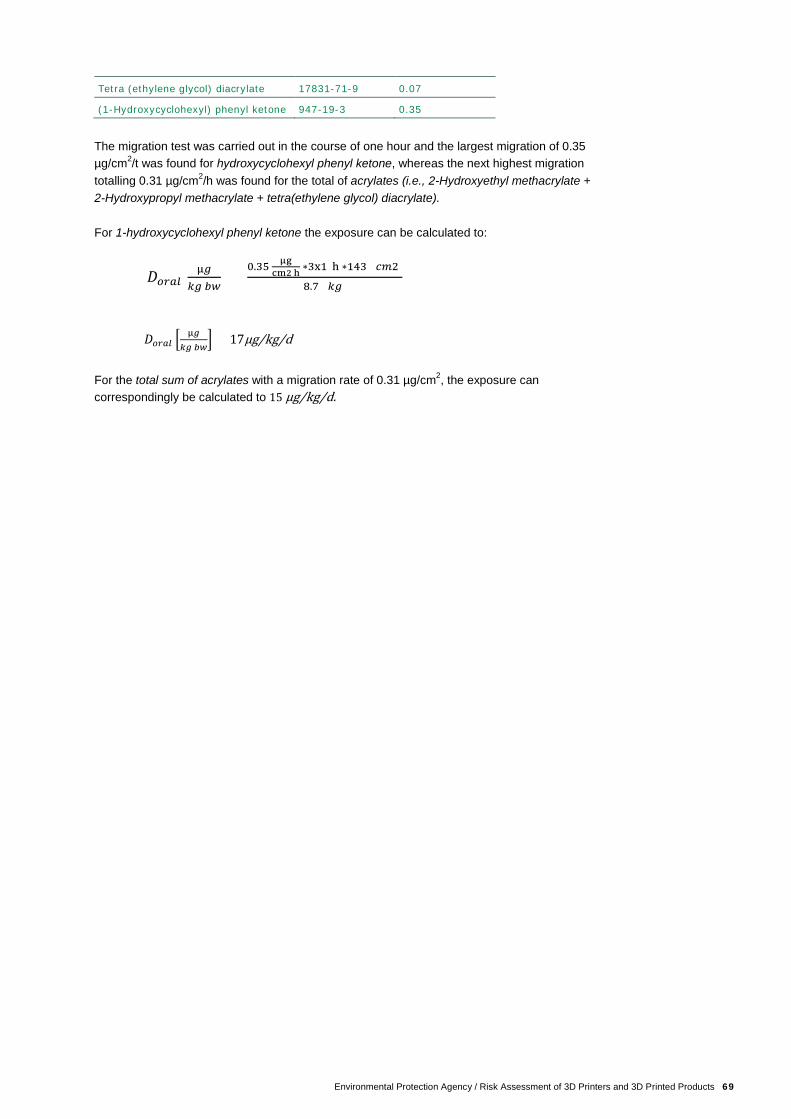
Environmental Protection Agency / Risk Assessment of 3D Printers and 3D Printed Products 69
Tetra (ethylene glycol) diacrylate 17831-71-9 0.07
(1-Hydroxycyclohexyl) phenyl ketone 947-19-3 0.35
The migration test was carried out in the course of one hour and the largest migration of 0.35 µg/cm2/t was found for hydroxycyclohexyl phenyl ketone, whereas the next highest migration totalling 0.31 µg/cm2/h was found for the total of acrylates (i.e., 2- ydroxyethyl methacrylateH + 2-Hydroxypropyl methacrylate e ra(ethylene glycol) diacrylate . + t t ) For 1-hydroxycyclohexyl phenyl ketone the exposure can be calculated to:
𝐷𝑜𝑜𝑜𝑜[ µ𝑔𝑘𝑔 𝑏𝑏
] =0.35 µg
cm2 h ∗3x1 h ∗143 [𝑐𝑐2]
8.7 [𝑘𝑔]
𝐷𝑜𝑜𝑜𝑜 � µ𝑔
𝑘𝑔 𝑏𝑏� = 17µg/kg/d
For the total sum of acrylates with a migration rate of 0.31 µg/cm2, the exposure can correspondingly be calculated to 15 µg/kg/d.
70 Environmental Protection Agency / Risk Assessment of 3D Printers and 3D Printed Products
7. Hazard and risk assessment
7.1 Hazard assessment As a starting point for the hazard assessment, relevant data was collected for each substance in relation to:
o Substance name and CAS no. o CLP classification o Candidate substance under REACH o Collection of knowledge about possible limit values in indoor/outdoor air or other
relevant limit values, e.g., DNEL values (e.g., WHO limit values in indoor air and outdoor air), DNEL values assessed by ECHA´s Risk Assessment Committee or other relevant values from other expert assessments (e.g., EU scientific committees or the US EPA´s IRIS assessments)
o Relevant data from possible REACH registrations o Possible knowledge of other relevant sources regarding the substances
On the basis of the collected data, the substances are assessed and a tolerable exposure level (DNEL value) is stated for the substances.
7.1.1 Particles At the moment there is no data that illustrates the health effects from inhaling particles created by the 3D printing process. As appears from the analyses in chapter 5, the printing material consists of insoluble materials, which is supported by the fact that only very limited amounts of the substances migrate into the migration liquid. The particles from these printing materials can be regarded as chemically stabile and inert. Therefore, the assessment of the particles can take a starting point in the increased knowledge that in recent years has appeared in connection with inhalation of chemically stabile and bio-persistant nanoparticles. As regards a tolerably mass based exposure level, limit values have been assessed in the working environment for chemically inactive and bio-persistent nanoparticles (i.e., particles below 100 nm in diameter) (BAuA 2015). The first sign of adverse effects from inhaling chemical inactive particles is inflammation in the lung tissue. The inhalation of smaller particles including nanoparticles is assessed to be more potent than the inhalation of larger particles (due to their rather large surface area that can come into contact with the lung mucous membrane compared to larger particles). Based on an overall analysis of a number of experiments on animals with bio-persistent nanoparticles, BAuA (2015) has suggested a limit value in the working environment of 75 µg/m3. The limit value of 75 µg/m3 in the working environment was proposed on the basis of the total amount of particles deposited in the lungs in the course of an 8-hour working day. After 4 hours of exposure, which is the scenario for 3D printing, the value would be 150 µg/m3. However, BAuA (2015) did not apply an uncertainty factor regarding the sensitivity differences of the population. In order to protect the consumers, an uncertainty factor of 10 is usually applied. By using an uncertainty factor of 10, a preliminary estimate is obtained for a tolerable exposure value of 15 µg/m3 for bio-persistent nanoparticles during 3D printing in the course of 4 hours. Such a starting point is subject to uncertainty as it has not been demonstated to which extent this also applies to ultrafine particles/nanoparticles from 3D printing processes, but nevertheless it can be used in connection with a preliminary risk assessment.
Environmental Protection Agency / Risk Assessment of 3D Printers and 3D Printed Products 71
As knowledge about the health effects of the particle number, meaning the number of ultrafine particles in the air, still is limited, no organisation or expert committee has proposed limit values in the air in realtion to a number concentration (the Danish EPA, 2016e). Therefore, it is not possible to state an actual tolerable exposure level for the particle number in the air. 7.1.2 Screening of emission relevant substances as regards health In connection with a health screening for the most hazardous emission substances, importance is placed on the substances stated in Table 39 and on knowledge about the health-based classification of the substances, and to which extent tolerable exposure levels of the substances have been established, e.g., in connection with content in the outdoor and indoor environment. A search was carried out on ECHA’s homepage http://echa.europa.eu/ for data concerning EU harmonised hazard classification. Data concerning tolerable emission concentrations to the indoor climate (EU determined LCI levels, Lowest Concentration of Interest) was found on http://www.eu-lci.org/EU-LCI_Website/EU-LCI_Values.html. A number of individual substances regarding LDI vlaues was carried out in the report ”Harmonisation framework for health based evaluation of indoor emissions from construction products in the European Union using the EU-LCI concept” from the Joint Research Centre/ EU-Kommissionen (JRC/EU-Commission 2013). A LCI value states the upper levels for emission of a chemical substance to the indoor climate that are not believed to lead to any health risk. As the LCI values are calculated in the same way as the DNEL values for the general population/ consumers under REACH, it is assessed relevant to use the numerical values of the LCI values as tolerable exposure levels (DNEL) for the general population. In addition, data and assessments from the Danish EPA projects ”Kortlægning og risikovurdering af toluen og andre neurotoksiske stoffer i børneværelset” (the Danish EPA, 2016a) and ”Kortlægning og risikovurdering af kemiske stoffer i gulvtæpper” (the Danish EPA, 2016b) that has evalauted several of the substances that are included in Table 39. In connection with the REACH Regulation, the database of the European Chemical Agency provide for substances on the candidate list for authorisation (i.e. Substances of Very High Concern, SVHC substances). However, none of the substances listed in connection with emission Table 39 and migration from 3D printing material (Table 40) have been identified as candidate list substances. Therefore, Table 41 below indicates the hazard classification of the substances (i.e., the adverse health effects of the substances) and the identified tolerable exposure levels found for the substances.
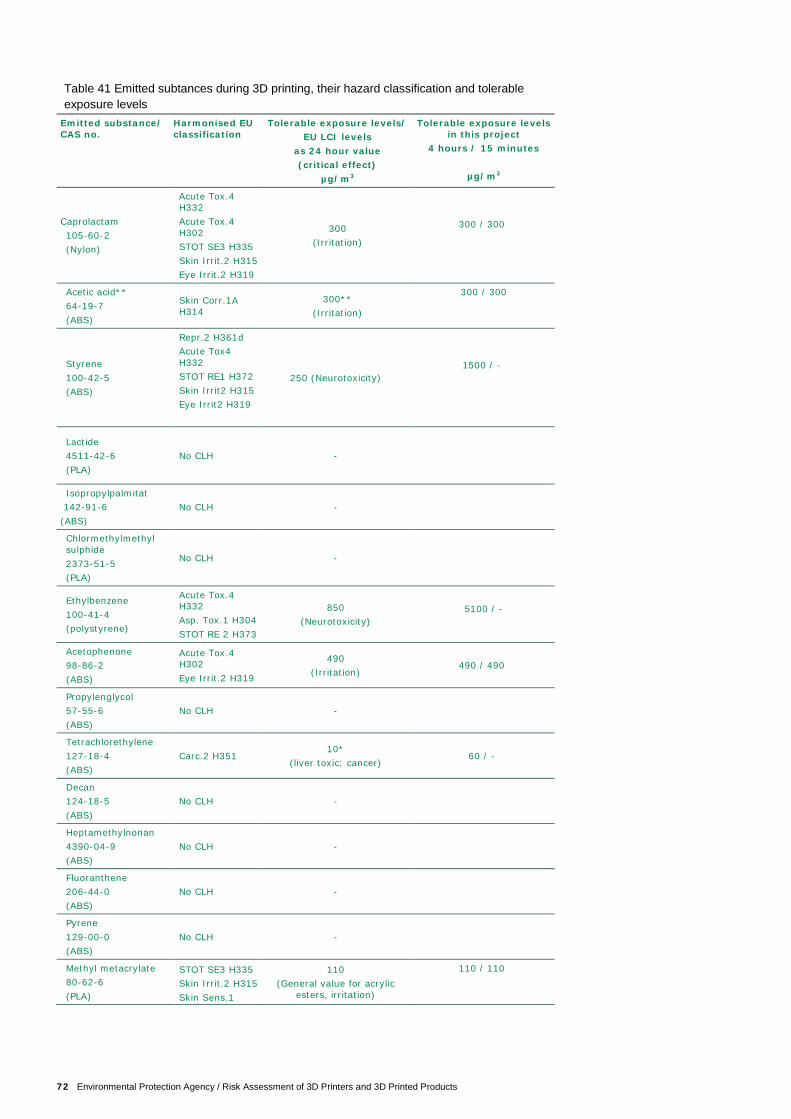
72 Environmental Protection Agency / Risk Assessment of 3D Printers and 3D Printed Products
Table 41 Emitted subtances during 3D printing, their hazard classification and tolerable exposure levels
Emitted substance/ CAS no.
Harmonised EU classification
Tolerable exposure levels/ EU LCI levels
as 24 hour value (critical effect)
µg/m3
Tolerable exposure levels in this project
4 hours / 15 minutes
µg/m3
Caprolactam 105-60-2 (Nylon)
Acute Tox.4 H332 Acute Tox.4 H302 STOT SE3 H335 Skin Irrit.2 H315 Eye Irrit.2 H319
300 (Irritation)
300 / 300
Acetic acid** 64-19-7 (ABS)
Skin Corr.1A H314
300** (Irritation)
300 / 300
Styrene 100-42-5 (ABS)
Repr.2 H361d Acute Tox4 H332 STOT RE1 H372 Skin Irrit2 H315 Eye Irrit2 H319
250 (Neurotoxicity)
1500 / -
Lactide 4511-42-6 (PLA)
No CLH -
Isopropylpalmitat 142-91-6 (ABS)
No CLH -
Chlormethylmethyl sulphide 2373-51-5 (PLA)
No CLH -
Ethylbenzene 100-41-4 (polystyrene)
Acute Tox.4 H332 Asp. Tox.1 H304 STOT RE 2 H373
850 (Neurotoxicity)
5100 / -
Acetophenone 98-86-2 (ABS)
Acute Tox.4 H302 Eye Irrit.2 H319
490 (Irritation)
490 / 490
Propylenglycol 57-55-6 (ABS)
No CLH -
Tetrachlorethylene 127-18-4 (ABS)
Carc.2 H351 10*
(liver toxic; cancer)
60 / -
Decan 124-18-5 (ABS)
No CLH -
Heptamethylnonan 4390-04-9 (ABS)
No CLH -
Fluoranthene 206-44-0 (ABS)
No CLH -
Pyrene 129-00-0 (ABS)
No CLH -
Methyl metacrylate 80-62-6 (PLA)
STOT SE3 H335 Skin Irrit.2 H315 Skin Sens.1
110 (General value for acrylic
esters, irritation)
110 / 110
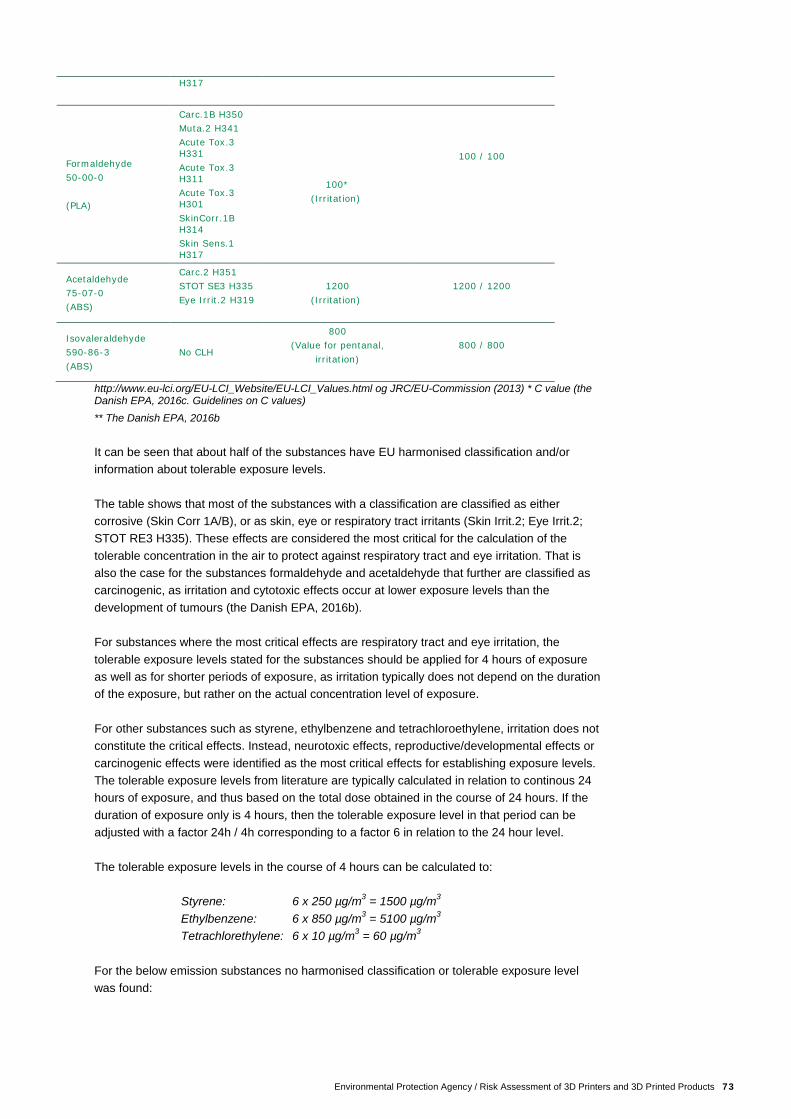
Environmental Protection Agency / Risk Assessment of 3D Printers and 3D Printed Products 73
http://www.eu-lci.org/EU-LCI_Website/EU-LCI_Values.html og JRC/EU-Commission (2013) * C value (the Danish EPA, 2016c. Guidelines on C values) ** The Danish EPA, 2016b It can be seen that about half of the substances have EU harmonised classification and/or information about tolerable exposure levels. The table shows that most of the substances with a classification are classified as either corrosive (Skin Corr 1A/B), or as skin, eye or respiratory tract irritants (Skin Irrit.2; Eye Irrit.2; STOT RE3 H335). These effects are considered the most critical for the calculation of the tolerable concentration in the air to protect against respiratory tract and eye irritation. That is also the case for the substances formaldehyde and acetaldehyde that further are classified as carcinogenic, as irritation and cytotoxic effects occur at lower exposure levels than the development of tumours (the Danish EPA, 2016b). For substances where the most critical effects are respiratory tract and eye irritation, the tolerable exposure levels stated for the substances should be applied for 4 hours of exposure as well as for shorter periods of exposure, as irritation typically does not depend on the duration of the exposure, but rather on the actual concentration level of exposure. For other substances such as styrene, ethylbenzene and tetrachloroethylene, irritation does not constitute the critical effects. Instead, neurotoxic effects, reproductive/developmental effects or carcinogenic effects were identified as the most critical effects for establishing exposure levels. The tolerable exposure levels from literature are typically calculated in relation to continous 24 hours of exposure, and thus based on the total dose obtained in the course of 24 hours. If the duration of exposure only is 4 hours, then the tolerable exposure level in that period can be adjusted with a factor 24h / 4h corresponding to a factor 6 in relation to the 24 hour level. The tolerable exposure levels in the course of 4 hours can be calculated to:
Styrene: 6 x 250 µg/m3 = 1500 µg/m3 Ethylbenzene: 6 x 850 µg/m3 = 5100 µg/m3 Tetrachlorethylene: 6 x 10 µg/m3 = 60 µg/m3
For the below emission substances no harmonised classification or tolerable exposure level was found:
H317
Formaldehyde 50-00-0 (PLA)
Carc.1B H350 Muta.2 H341 Acute Tox.3 H331 Acute Tox.3 H311 Acute Tox.3 H301 SkinCorr.1B H314 Skin Sens.1 H317
100*
(Irritation)
100 / 100
Acetaldehyde 75-07-0 (ABS)
Carc.2 H351 STOT SE3 H335 Eye Irrit.2 H319
1200 (Irritation)
1200 / 1200
Isovaleraldehyde 590-86-3 (ABS)
No CLH
800 (Value for pentanal,
irritation)
800 / 800
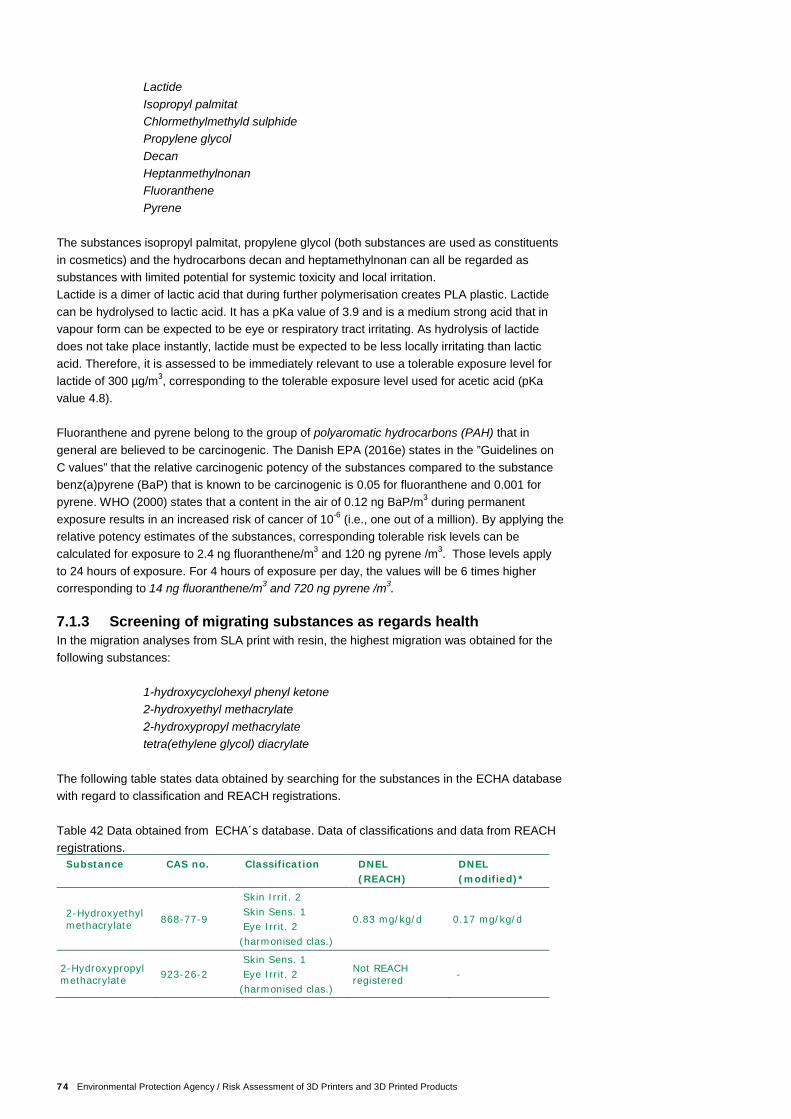
74 Environmental Protection Agency / Risk Assessment of 3D Printers and 3D Printed Products
Lactide Isopropyl palmitat Chlormethylmethyld sulphide Propylene glycol Decan Heptanmethylnonan Fluoranthene Pyrene
The substances isopropyl palmitat, propylene glycol (both substances are used as constituents in cosmetics) and the hydrocarbons decan and heptamethylnonan can all be regarded as substances with limited potential for systemic toxicity and local irritation. Lactide is a dimer of lactic acid that during further polymerisation creates PLA plastic. Lactide can be hydrolysed to lactic acid. It has a pKa value of 3.9 and is a medium strong acid that in vapour form can be expected to be eye or respiratory tract irritating. As hydrolysis of lactide does not take place instantly, lactide must be expected to be less locally irritating than lactic acid. Therefore, it is assessed to be immediately relevant to use a tolerable exposure level for lactide of 300 µg/m3, corresponding to the tolerable exposure level used for acetic acid (pKa value 4.8). Fluoranthene and pyrene belong to the group of polyaromatic hydrocarbons (PAH) that in general are believed to be carcinogenic. The Danish EPA (2016e) states in the ”Guidelines on C values” that the relative carcinogenic potency of the substances compared to the substance benz(a)pyrene (BaP) that is known to be carcinogenic is 0.05 for fluoranthene and 0.001 for pyrene. WHO (2000) states that a content in the air of 0.12 ng BaP/m3 during permanent exposure results in an increased risk of cancer of 10-6 (i.e., one out of a million). By applying the relative potency estimates of the substances, corresponding tolerable risk levels can be calculated for exposure to 2.4 ng fluoranthene/m3 and 120 ng pyrene /m3. Those levels apply to 24 hours of exposure. For 4 hours of exposure per day, the values will be 6 times higher corresponding to 14 ng fluoranthene/m3 and 720 ng pyrene /m3. 7.1.3 Screening of migrating substances as regards health In the migration analyses from SLA print with resin, the highest migration was obtained for the following substances:
1-hydroxycyclohexyl phenyl ketone 2-hydroxyethyl methacrylate 2-hydroxypropyl methacrylate tetra(ethylene glycol) diacrylate
The following table states data obtained by searching for the substances in the ECHA database with regard to classification and REACH registrations. Table 42 Data obtained from ECHA´s database. Data of classifications and data from REACH registrations.
Substance CAS no. Classification DNEL (REACH)
DNEL (modified)*
2-Hydroxyethyl methacrylate 868-77-9
Skin Irrit. 2 Skin Sens. 1 Eye Irrit. 2
(harmonised clas.)
0.83 mg/kg/d 0.17 mg/kg/d
2-Hydroxypropyl methacrylate 923-26-2
Skin Sens. 1 Eye Irrit. 2
(harmonised clas.)
Not REACH registered -
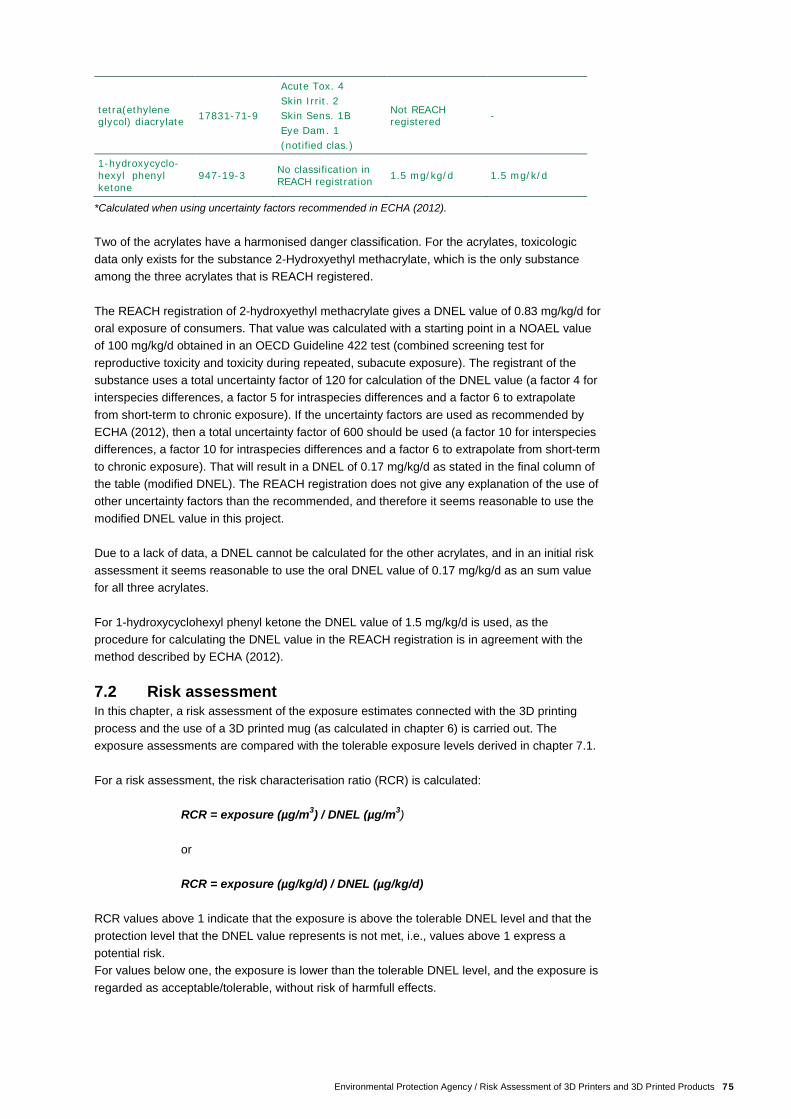
Environmental Protection Agency / Risk Assessment of 3D Printers and 3D Printed Products 75
tetra(ethylene glycol) diacrylate 17831-71-9
Acute Tox. 4 Skin Irrit. 2 Skin Sens. 1B Eye Dam. 1 (notified clas.)
Not REACH registered -
1-hydroxycyclo-hexyl phenyl ketone
947-19-3 No classification in REACH registration 1.5 mg/kg/d 1.5 mg/k/d
*Calculated when using uncertainty factors recommended in ECHA (2012). Two of the acrylates have a harmonised danger classification. For the acrylates, toxicologic data only exists for the substance 2-Hydroxyethyl methacrylate, which is the only substance among the three acrylates that is REACH registered. The REACH registration of 2-hydroxyethyl methacrylate gives a DNEL value of 0.83 mg/kg/d for oral exposure of consumers. That value was calculated with a starting point in a NOAEL value of 100 mg/kg/d obtained in an OECD Guideline 422 test (combined screening test for reproductive toxicity and toxicity during repeated, subacute exposure). The registrant of the substance uses a total uncertainty factor of 120 for calculation of the DNEL value (a factor 4 for interspecies differences, a factor 5 for intraspecies differences and a factor 6 to extrapolate from short-term to chronic exposure). If the uncertainty factors are used as recommended by ECHA (2012), then a total uncertainty factor of 600 should be used (a factor 10 for interspecies differences, a factor 10 for intraspecies differences and a factor 6 to extrapolate from short-term to chronic exposure). That will result in a DNEL of 0.17 mg/kg/d as stated in the final column of the table (modified DNEL). The REACH registration does not give any explanation of the use of other uncertainty factors than the recommended, and therefore it seems reasonable to use the modified DNEL value in this project. Due to a lack of data, a DNEL cannot be calculated for the other acrylates, and in an initial risk assessment it seems reasonable to use the oral DNEL value of 0.17 mg/kg/d as an sum value for all three acrylates. For 1-hydroxycyclohexyl phenyl ketone the DNEL value of 1.5 mg/kg/d is used, as the procedure for calculating the DNEL value in the REACH registration is in agreement with the method described by ECHA (2012). 7.2 Risk assessment In this chapter, a risk assessment of the exposure estimates connected with the 3D printing process and the use of a 3D printed mug (as calculated in chapter 6) is carried out. The exposure assessments are compared with the tolerable exposure levels derived in chapter 7.1. For a risk assessment, the risk characterisation ratio (RCR) is calculated:
RCR = exposure (µg/m3) / DNEL (µg/m3) or RCR = exposure (µg/kg/d) / DNEL (µg/kg/d)
RCR values above 1 indicate that the exposure is above the tolerable DNEL level and that the protection level that the DNEL value represents is not met, i.e., values above 1 express a potential risk. For values below one, the exposure is lower than the tolerable DNEL level, and the exposure is regarded as acceptable/tolerable, without risk of harmfull effects.
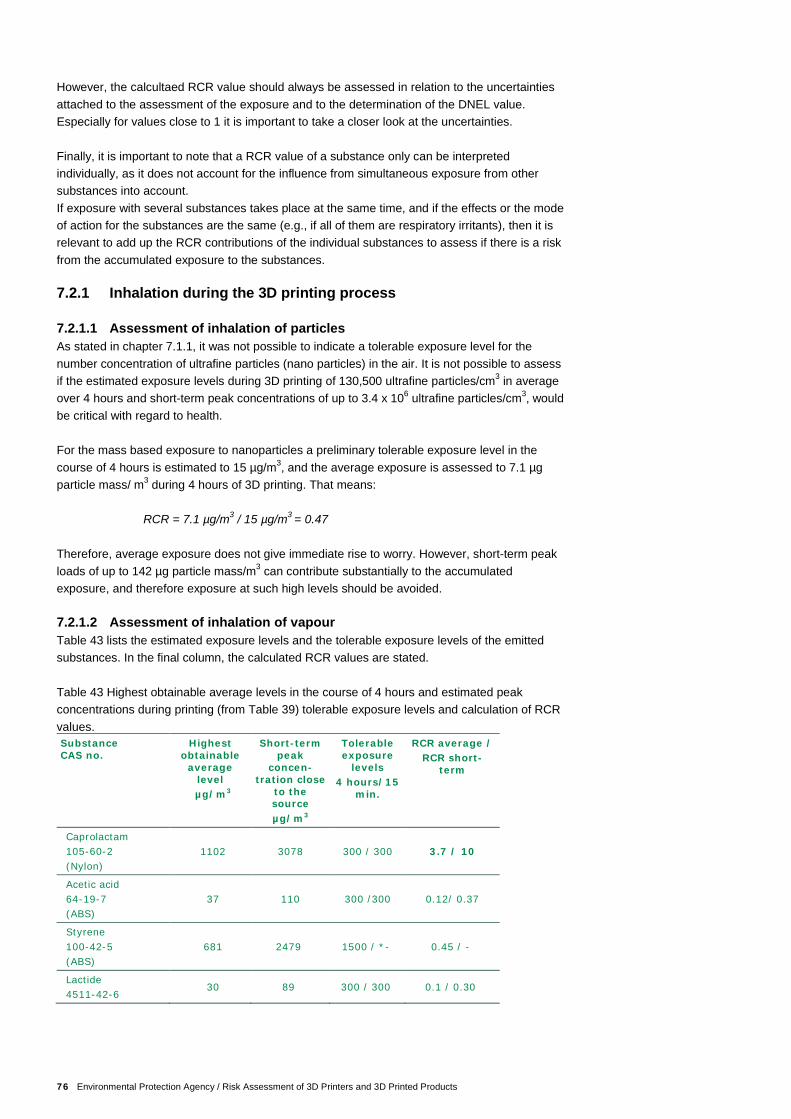
76 Environmental Protection Agency / Risk Assessment of 3D Printers and 3D Printed Products
However, the calcultaed RCR value should always be assessed in relation to the uncertainties attached to the assessment of the exposure and to the determination of the DNEL value. Especially for values close to 1 it is important to take a closer look at the uncertainties. Finally, it is important to note that a RCR value of a substance only can be interpreted individually, as it does not account for the influence from simultaneous exposure from other substances into account. If exposure with several substances takes place at the same time, and if the effects or the mode of action for the substances are the same (e.g., if all of them are respiratory irritants), then it is relevant to add up the RCR contributions of the individual substances to assess if there is a risk from the accumulated exposure to the substances. 7.2.1 Inhalation during the 3D printing process 7.2.1.1 Assessment of inhalation of particles As stated in chapter 7.1.1, it was not possible to indicate a tolerable exposure level for the number concentration of ultrafine particles (nano particles) in the air. It is not possible to assess if the estimated exposure levels during 3D printing of 130,500 ultrafine particles/cm3 in average over 4 hours and short-term peak concentrations of up to 3.4 x 10⁶ ultrafine particles/cm3, would be critical with regard to health. For the mass based exposure to nanoparticles a preliminary tolerable exposure level in the course of 4 hours is estimated to 15 µg/m3, and the average exposure is assessed to 7.1 µg particle mass/ m3 during 4 hours of 3D printing. That means:
RCR = 7.1 µg/m3 / 15 µg/m3 = 0.47 Therefore, average exposure does not give immediate rise to worry. However, short-term peak loads of up to 142 µg particle mass/m3 can contribute substantially to the accumulated exposure, and therefore exposure at such high levels should be avoided. 7.2.1.2 Assessment of inhalation of vapour Table 43 lists the estimated exposure levels and the tolerable exposure levels of the emitted substances. In the final column, the calculated RCR values are stated. Table 43 Highest obtainable average levels in the course of 4 hours and estimated peak concentrations during printing (from Table 39) tolerable exposure levels and calculation of RCR values. Substance CAS no.
Highest obtainable
average level µg/m3
Short-term peak
concen-tration close
to the source µg/m3
Tolerable exposure
levels 4 hours/15
min.
RCR average / RCR short-
term
Caprolactam 105-60-2 (Nylon)
1102 3078 300 / 300 3.7 / 10
Acetic acid 64-19-7 (ABS)
37 110 300 /300 0.12/ 0.37
Styrene 100-42-5 (ABS)
681 2479 1500 / *- 0.45 / -
Lactide 4511-42-6
30 89 300 / 300 0.1 / 0.30
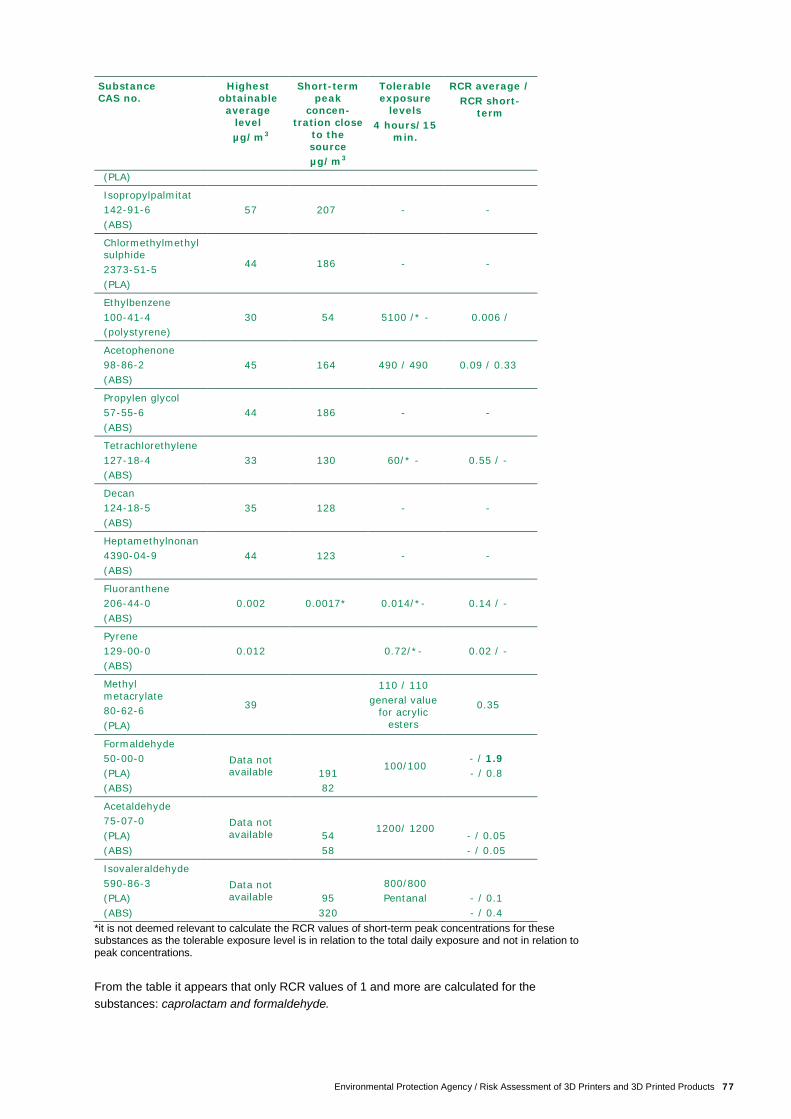
Environmental Protection Agency / Risk Assessment of 3D Printers and 3D Printed Products 77
Substance CAS no.
Highest obtainable
average level µg/m3
Short-term peak
concen-tration close
to the source µg/m3
Tolerable exposure
levels 4 hours/15
min.
RCR average / RCR short-
term
(PLA)
Isopropylpalmitat 142-91-6 (ABS)
57 207 - -
Chlormethylmethyl sulphide 2373-51-5 (PLA)
44 186 - -
Ethylbenzene 100-41-4 (polystyrene)
30 54 5100 /* - 0.006 /
Acetophenone 98-86-2 (ABS)
45 164 490 / 490 0.09 / 0.33
Propylen glycol 57-55-6 (ABS)
44 186 - -
Tetrachlorethylene 127-18-4 (ABS)
33 130 60/* - 0.55 / -
Decan 124-18-5 (ABS)
35 128 - -
Heptamethylnonan 4390-04-9 (ABS)
44 123 - -
Fluoranthene 206-44-0 (ABS)
0.002 0.0017* 0.014/*- 0.14 / -
Pyrene 129-00-0 (ABS)
0.012 0.72/*- 0.02 / -
Methyl metacrylate 80-62-6 (PLA)
39
110 / 110 general value
for acrylic esters
0.35
Formaldehyde 50-00-0 (PLA) (ABS)
Data not available
191 82
100/100 - / 1.9 - / 0.8
Acetaldehyde 75-07-0 (PLA) (ABS)
Data not available
54 58
1200/ 1200
- / 0.05 - / 0.05
Isovaleraldehyde 590-86-3 (PLA) (ABS)
Data not available
95 320
800/800 Pentanal
- / 0.1 - / 0.4
*it is not deemed relevant to calculate the RCR values of short-term peak concentrations for these substances as the tolerable exposure level is in relation to the total daily exposure and not in relation to peak concentrations. From the table it appears that only RCR values of 1 and more are calculated for the substances: caprolactam and formaldehyde.
78 Environmental Protection Agency / Risk Assessment of 3D Printers and 3D Printed Products
For formaldehyde (PLA printing) the level is only exceeded with regard to short-term peak loads, whereas caprolactam (nylon printing) is exceeded during peak concentrations as well as daily 4-hour exposure. If the accumulated exposure is considered during printing with PLA and ABS, respectively, it might be relevant to add up the RCR values of the substances that give respiratory tract and eye irritation in the cases where the DNEL value is based on those effects. Within the same substance group, e.g., aldehydes, it is regarded as relevant to make such an addition as the mode of action of the respiratory tract and eye irritating aldehydes must be expected to be the same. When adding up RCR for several substance groups, this method is more uncertain as knowledge is limited about the biological effects and combination effects during simultaneous exposure to many different substances. 3D printing with PLA For PLA, the RCR values for 15-minute and 4-hour exposure, respectively, to lactide, methyl methacrylate, formaldehyde, acetaldehyde and isovaleraldehyde maybe added: RCR (PLA, 15 min) with regard to irritating effects: RCR (PLA, 15 min) = RCRlactide + RCRmethyl acrylate + RCRformaldehyde + RCRacetaldehyde + RCRisovaleraldehyd
RCR (PLA, 15 min) = 0.30 + (0.35?) + 1.9 + 0.05 + 0.1 = 2.70 As no estimate is available for the 15-minute value of methyl metacrylate, the 4-hour value is applied (stated as 0.35?), which, however, will underestimate the irritation contribution. RCR (PLA, 4 hours) with regard to irritating effects: RCR (PLA, 4 hours) = RCRlactide + RCRmethyl acrylate + RCRformaldehyde + RCRacetaldehyde + RCRisovaleraldehyde
RCR (PLA, 4 hours) = 0.10 + 0.35 + ? + ? + ? = 0.45 + ? With regard to 4 hours of exposure, the accumulated RCR is assessed to be close to 1 as the unknown RCR contribution from formaldehyde (marked ?) is assessed to be higher than for lactide and methyl methacrylate (as appears from the 15-minute exposure). Furthermore, the contributions from acetaldehyde and isovaleraldehyde during 4 hours of exposure are unknown (marked ?). That means that the accumulated concentrations of the irritating substances in the course of a 4-hour period might result in respiratory tract and eye irritation. It should be noted that exposure to methyl metacrylate only is relevant if special types of PLA-MMA copolymers are used during 3D printing as they may contain the monomer methyl metacrylate. 3D printing with ABS For ABS printing, the RCR values for irritating effects after 15-minute and 4-hour exposure, respectively, to acetic acid, acetophenone, formaldehyde, acetaldehyde and isovaleraldehyde have to be added up: RCR (ABS, 15 min) with regard to irritating effects RCR (ABS, 15 min) = RCRacetic acid + RCRacetophenone+ RCRformaldehyde + RCRacetaldehyde +
RCRisovaleraldehyde

Environmental Protection Agency / Risk Assessment of 3D Printers and 3D Printed Products 79
RCR (ABS, 15 min) = 0.37 + 0.33 + 0.8 + 0.05 + 0.4= 1.95 In addition to the mentioned substances, there can be an irritation potential from other substances, including particles, and therefore it is likely that there is a risk of respiratory tract and eye irritation when staying close to the printing process for short periods of time. RCR (ABS, 4 hours) with regard to irritating effects RCR (ABS, 4 hours) = RCRacetic acid + RCRacetophenone+ RCRformaldehyde + RCRacetaldehyde
+
RCRisovaleraldehyde
RCR (ABS, 4 hours) = 0.12 + 0.09 + ? + ? + ? = 0.21 + ? The irritation contribution (RCR value) for formaldehyde after 15 minutes of exposure is about twice as high as for acetic acid, and that is also regarded to be the case after 4 hours of exposure. For acetaldehyde and isovaleraldehyde the irritation contribution is substantially lower than for acetic acid and acetophenone after 15 minutes of exposure and will also be so after 4 hours of exposure. Therefore, it is not assessed that the average concentrations in the room in the course of 4 hours will give rise to respiratory tract or eye irritation, as the RCR values are assessed to remain under 1. 7.2.1.3 Combination effects from inhalation It is well-known, that simultaneous inhalation of particles and vapours that are irritating to the respiratory tract will intensify the respiratory tract irritation effects. It is uncertain, how much the effects will be intensified during simultaneous appearance of particles; however, the resulting and possible extra contribution, supports the above conclusions regarding the risk of respiratory tract irritation. 7.2.1.4 Uncertainties and limitations of the assessment The above assessment is subject to uncertainties. The data amount concerning emission of particles and volatile substances is still very limited. Therefore, it is difficult to assess how representative the findings regarding the various 3D printing materials are. At the same time, no systematic measurements have been carried out of the exposure levels of volatile substances and particles in connection with realistic everyday use by the private user in a room that more precisely could illustrate, which exposure levels the user is exposed to. Uncertainties are associated to the available exposure assessments, where the levels measured in a small test chamber have been scaled up to a much larger room. Especially the estimates of the peak exposures are regarded as uncertain, as measurements of user related short-term peak levels are missing. In connection with particle emission, there is great uncertainty with regard to human health effects in relation to the increased particle number concentrations as knowledge is missing in that area. It is possible that volatile respiratory tract irritants can be absorbed to the rather large surface of the small particles and in that way result in a more concentrated exposure of the tissue in the respiratory tracts where the particle is deposited in the respiratory passages. That means that the ultrafine particles (to a yet unknown extent) can intensify the irritating effects of the other substances. In connection with the emission of aldehydes (here especially formaldehyde is of concern), only one set of measurements exists from the printing of one ABS material and two PLA materials. Therefore, the basis for risk assessment of aldehydes is very limited.
80 Environmental Protection Agency / Risk Assessment of 3D Printers and 3D Printed Products
7.2.2 Assessment of the use of a 3D printed item In chapter 4.2 it was assessed that the most critical scenario regarding risk assessment is the scenario where a 3D printed mug is used for food. If that scenario involves a risk it will also be relevant to assess the scenario with regard to a child sucking on a 3D printed toy where, however, the exposure is assessed to be much lower than for a mug. 7.2.2.1 Assessment of the use of a 3D printed mug In a migration test with a SLA printed item of resin the following exposure was calculated of a 1-year-old child who drinks milk from the mug 3 times a day:
Exposure (hydroxycyclohexyl phenyl ketone): 17 µg/kg/d Exposure (acrylates): 15 µg/kg/d
These exposures can be assessed against the following DNEL values:
DNEL (hydroxycyclohexyl phenyl ketone): 1500 µg/kg/d DNEL (acrylates): 170 µg/kg/d
Subsequently, the following risk characterisation ratios (RCR) can be estimated:
RCR (hydroxycyclohexyl phenyl ketone) = 17 µg/kg/d / 1500 µg/kg/d = 0.013 RCR (acrylates) = 15 µg/kg/d / 170 µg/kg/d = 0.088
On that basis, no risk is assessed to be connected with the scenario that is set up. It should be emphasized that most 3D printing materials are not approved as food contact materials, and therefore 3D printed items should in general not be used in connection with food contact, unless they have a declaration of conformity regarding use as food contact material. Exposure from sucking on a 3D printed toy is assessed to be much smaller than exposure from a mug. Therefore, it is not relevant to carry out further analysis of that scenario, as the RCR values will be much smaller. 7.2.2.2 Uncertainties and limitation regarding the assessment Relevant migration tests were carried out on the 3D printing material with water as migration medium. The test results of the investigated materials resulted in very low/no measurable migration. Therefore, it is assessed that the risk assessment in relation to migrated substances is rather valid. The scenario regards migration from a very large surface in connection with the printing material being used as a mug for milk. At the same time, migration data was used for water where the fat content in low-fat milk (1.5%) might result in a somewhat larger migration of the organic substances. It is easy to imagine scenarios with a mug with a larger potential for migration and exposure that could give rise to higher RCR values. If the mug, e.g., is used for fatty food, and if the food is heated in a microwave oven before it is given to the child. However, a closer assessment of such a scenario would require further migration analyses. Finally, it has not been possible to carry out an actual assessment of the significance of possible migration of especially health hazardous metals such as, e.g., lead as migration (- if any) of lead and the other metals was less than the applied detection limits.
Environmental Protection Agency / Risk Assessment of 3D Printers and 3D Printed Products 81
7.3 Conclusion In connection with FDM 3D printing, an emission of particles (including ultrafine particles, which are particles below 100 nm in diameter) as well as of volatile components occurs. Data indicates that the type of FDM 3D printer can influence the magnitude of the particle emission. Also, the general impression is that print with ABS results in larger particle emission than print with PLA - especially with regard to the emission of ultrafine particles. Taking the results from literature into account, it is assessed that substantially increased levels of the number of ultrafine particles can be obtained – especially close to the printing process. However, no data exists that can clarify the possible health effects. With regard to volatile components from 3D prints with different materials, the following substances can be identified as main components for the different 3D printing materials:
PLA: lactide (and methyl metacrylate) ABS: styrene Nylon: caprolactam
Lactide, styrene and caprolactam are the respective monomers in the polymers. However, there is uncertainty for PLA regarding methyl metacrylate, as that substance only has been reported from one single reference. Methyl metacrylate is a monomer that forms part of special PLA-MMA copolymers. When estimating exposure levels for substances emitted from 3D printing and considering the hazards of these substances and their dose-effect relationship, respiratory tract and eye irritating properties of the substances are regarded as the most critical effects of the emission. Based on the assessment it can be concluded that there may be a risk due to respiratory tract and eye irritation from the emission of volatile substances and particles from the printing process when 3D printing with PLA, ABS and nylon. That especially applies to printing for a longer duration in a small room with poor ventilation/airing. It is assessed that the risk is greatest during printing with nylon when caprolactam is emitted. When printing with PLA and ABS, the emission of aldehydes (however, only reported in one study) may increase the risk of respiratory tract and eye irritation. There does not seem to be a risk of other adverse health effects due to the emission, including the emission of the main component styrene from ABS printing. For 3D printed products, the migration tests only found a migration of chemical substances from SLA printing. In an actual consumer scenario where a printed mug was assumed to be used for milk for a 1-year-old child, it is assessed that migration and exposure of the substances do not lead to health-related risks. However, it should be emphasized that 3D printing materials, unless they have a declaration of conformity, in general are not regarded as suited for food contact materials, and therefore products from 3D prints should not be used for food. The above risk assessment is based on a rather limited amount of data and on a toxicological screening of the substances that are emitted in the largest amount. This assessment should be considered as preliminary as the area of 3D printing is continuously developing. A more precise assessment requires better and more systematic knowledge regarding emission and consumer exposure from the individual 3D printers and the individual 3D printing material. An assessment of the durability/migration potential of the materials in different consumer scenarios regarding the 3D printed products is also needed.

82 Environmental Protection Agency / Risk Assessment of 3D Printers and 3D Printed Products
3D printing materials are continuously developed and new types of materials are marketed all the time, and therefore the risk assessments in this report are limited to the investigated 3D printing materials and the available data.
Environmental Protection Agency / Risk Assessment of 3D Printers and 3D Printed Products 83
References
Abe, Y., Yamaguchi, M., Mutsuga, M., Kawamura, Y. and Akiyama, H. (2014), Survey of volatile substances in kitchen utensils made from acrylonitrile-butadiene-styrene and acrylonitrile-styrene resin in Japan, Food Science & Nutrition, Pamphlet 2, pages 236-243. Afshar-Mohajer N, Wu C-Y, Ladun T, Rajon DA, Huang Y (2015). Characterization of particulate matters and total VOC emissions from a binder jetting 3D-printer. Building and Environment 93, 293-301. Ayutthaya, W.D.N. & Poompradub, S. (2014). Thermal and mechanical properties of poly(lactic acid)/natural rubber blend using epoxidized natural rubber and poly(methyl methacrylate) as co-compatibilizers. Macromol. Res. 22: 686. Azimi, P.; Zhao,D.; Pouzet, C.; Crain, N. E.; & Stephens, B. (2016). Emissions of Ultrafine Particles and Volatile Organic Compounds from Commercially Available Desktop Three-Dimensional Printers with Multiple Filaments. Environmental Science & Technology 50, 1260-1268. BAuA (2015). Assessment criterion (reference value) for granular biopersistent particles without known significant specific toxicity (nanoscaled GBP) (respirable dust) generated from manufactured ultrafine particles. Assessment criterion (reference value) for nanoscaled GBP (Version of 3 June 2015). Bundesanstalt für Arbeitsschutz und Arbeitsmedizin. Cooke, S. L (2011), Migration Models – Comparison of PVC, PET, and PLA Diffusivity, Combined with a Production Cost Model for Westridge Laboratories, California Polytechnic State University Materials Engineering Department. Conn, R.E, Kolstad, J.J., Borzelleca, J.F., Dixler, D.S., Filer, L.J., Ladu, B.N., Pariza, M. W. (1995), Safety assessment of polylactide (PLA) for use as a food-contact polymer, Food and Chemical Toxicology, Vol. 33, Pamphlet 4, pages 273-283. Crompton, T. R (2007), Additive Migration from Plastics into Foods, Smithers Rapra Press; Revised ed. Edition. DS/EN 71-3:2013+A1:2014, Safety of toys – Part 3: Migration of certain elements. DS/EN 71-9 + A1:2007, Safety of toys – Part 9: Organic chemical compounds – Requirements. DS/EN 71-10:2006, Safety of Toys- Part 10: Organic chemical compounds – Sample preparation and extraction. DS/EN 71-11:2005: Safety of toys – Part 11: Organic chemical compounds – Methods of analysis. DTI (2002). Research into the mouthing of children up to 5 years old. Consumer and Competition Policy Directorate, DTI. URN 02/748. ECHA (2012). Characterisation of dose [concentration] - response for human health (Chapter R.8). Version 2.1 November 2012.
84 Environmental Protection Agency / Risk Assessment of 3D Printers and 3D Printed Products
EU Regulation No. 10/2011 on plastic materials and articles intended to come into contact with food. Toy Safety Directive 2009/48/EC of the European Parliament and of the Council of 18 June 2009 in the safety of toys Regulation (EC) No. 1272/2008 of 16 December 2008 concerning classification, marking and packaging of substances and mixtures etc. Regulation (EC) No. 1907/2006 of 18 December 2006 concerning Registration, Authorisation and Restriction of Chemicals (REACH). Hansen, E., Nilsson N. H., Lithner, D., Lassen, C., 2013, Hazardous substances in plastic materials, TA 3017, Klima- og Forurensningsdirektoratet. JRC/EU-Commission (2013). Harmonisation framework for health based evaluation of indoor emissions from construction products in the European Union using the EU-LCI concept. Report no 29. European Collaborative Action, Urban Air, Indoor Environment and Human Exposure. EUR 26168 EN. Kim, Y., Yoon, C., Ham, S., Park, J., Kim, S., Kwon, O., & Tsai, P. J. (2015). Emissions of Nanoparticles and Gaseous Material from 3D printer Operation. Environmental Science & Technology, 49(20), 12044-12053. Miljøstyrelsen (2006), Samlet sundhedsmæssig vurdering af kemiske stoffer i indeklimaet fra udvalgte forbrugerprodukter Kortlægning af kemiske stoffer i forbrugerprodukter, 75, 2006. (The Danish EPA (2006), Complete health assessment of chemical substances in the indoor climate from selected consumer products. Survey of chemical substances in consumer products, 75, 2006.) Miljøstyrelsen (2014), Problematiske kemiske stoffer i plast, Kortlægning af kemiske stoffer i forbrugerprodukter nr. 132, 2014. (The Danish EPA (2014). Problematic chemical substances in plastic, Survey of chemical substances in consumer products no. 132, 2014). The Danish EPA (2015), Exposure to nanomaterials from the Danish Environment. Environmental project No. 1633. Miljøstyrelsen (2016a), Kortlægning og risikovurdering af toluen og andre neurotoksiske stoffer i børneværelset. Kortlægning af kemiske stoffer i forbrugerprodukter nr. 145, 2016. (The Danish EPA (2016a). Survey and risk assessment of toluene and other neuro toxic substances in the children’s room. Survey of chemical substances in consumer products no. 145, 2016). Miljøstyrelsen (2016b). Kortlægning og risikovurdering af kemiske stoffer i gulvtæpper til børn. Kortlægning af kemiske stoffer i forbrugerprodukter nr. 147, 2016. (The Danish EPA (2016c). Survey and risk assessment of chemical substances in rugs for children. Survey of chemical consumer products no. 147, 2016). Miljøstyrelsen (2016c), Fischer, C. H., Jay, O., Tordrup, S. W., Schjøth-Eskesen, J., Kortlægning samt fare- og ressourcevurdering af 3D-printere og 3D-printede artikler, Miljøstyrelsen, Kortlægning af kemiske stoffer i forbrugerprodukter nr. 144. (The Danish EPA (2016c), Fischer, C. H., Jay, O., Tordrup, S. W., Schjøth-Eskesen, J., Survey and risk and resource assessment of 3D printers and 3D printed articles, Survey of chemical substances in consumer products).
Environmental Protection Agency / Risk Assessment of 3D Printers and 3D Printed Products 85
The Danish EPA (2016d), Nilsson, N. H., Schjøth-Eskesen, J., Malmgren-Hansen, B., Jacobsen, E., Determination of Migration Rates for Certain Phthalates, Danish Ministry of Environment and Food of Denmark, Chemical substances in consumer products no. 149. Miljøstyrelsen (2016e), Vejledning om B-værdier. Vejledning nr. 20, august 2016. (The Danish EPA (2016e), Instructions on B values. Instruction no. 20, August 2016). NMR (2012), Existing Default Values and Recommendations for Exposure Assessment. A Nordic Exposure Group Project 2011. The Nordic Council of Ministers, Copenhagen. Series TemaNord, ISSN 0908-6692; 2012:505. 177 p. Regulation (EC) no. 1907/2006-REACH of 18 December 2006 concerning Registration, Evaluation, Authorisation and Restriction of Chemicals. Shelley Cooke and Sarina Surrette, Dr. Linda Vanasupa (2011), Migration Models - Comparison of PVC, PET and PLA Diffusivity, Combined with a Production Cost Model for Westridge Laboratories, Materials Engineering Department, California Polytechnic State University, May 31.
Singh, P., Saengerlaub, S., Wani, A. A., Langowski, H. (2012), Role of plastics additives for food packaging, Pigment & Resin Technology, Vol. 41, Pamphlet 6, pages 368 – 379. Steinle, P. (2016), Characterization of emissions from a desktop 3D-printer and indoor air measurements in office settings. Journal of Occupational and Environmental Hygiene 13 (2), 121-132. Stephens, B.; Azimi, P.; El Orch, Z.; Ramos, T. (2013) Technical note Ultrafine particle emissions from desktop 3D-printers, Atmospheric Environment 79 (2013) 334-339. Stevens, M. (1999), Polymer Chemistry – An introduction, Oxford University Press. Stoffers, N. H., Dekker, M., Linssen, J. P. H., Strörmer, A., Franz, R., Van Boekel, M. A. J. S. (2004), Modelling of simultaneous two-sided migration into water and olive oil from nylon food packaging, European Food Research and Technology, Vol. 220, Pamphlet 2, pages 156-162. The Danish Health Authority (2016). Nutrition for babies and young children – a handbook for health workers. (Sundhedsstyrelsen (2016). ERNÆRING TIL SPÆDBØRN OG SMÅBØRN – en håndbog for sundhedspersonale). Voedsel en Waren Autoriteit (2005), Screening of plastic toys for chemical composition and hazards, report ND05o610/01. WHO (2000). Air Quality Guidelines for Europe, Second Edition. World Health Organization Regional Office for Europe. Copenhagen. WHO (2010). Selected Pollutants, WHO Guidelines for indoor air Quality. WHO Regional Office for Europe, Copenhagen. Yukata, A (2014) Survey of volatile substances in kitchen utensils made from acrylonitrile–butadiene–styrene and acrylonitrile–styrene resin in Japan, Food Science & Nutrition
Internet pages mentioned in the report: www.thingiverse.com WIKIPEDIA WWW.LBORO.AC.UK

86 Environmental Protection Agency / Risk Assessment of 3D Printers and 3D Printed Products
https://www.quora.com http://reprage.com https://groups.google.com/ https://www.3dponics.com http://echa.europa.eu/ http://www.eu-lci.org/EU-LCI_Website/EU-LCI_Values.html Examples of suppliers of 3D prints: http://www.teknologisk.dk/ http://3dprinthuset.dk/ https://www.3dhubs.com/ http://3deksperten.dk/
Environmental Protection Agency / Risk Assessment of 3D Printers and 3D Printed Products 87
Glossary
ABS Acrylonitrile-butadiene-styrene BfR Bundesinstitut für Risikobewertung CLP Classification, Labelling and Packaging, Regulation no. 1272/2008 DBP Dibutyl phthalate DEHP Diethylhexyl phthalate DMEL Derived Minimum Effect Level DNEL Derived No Effect Levels ECHA The European Chemicals Agency FDA Food and Drug administration Approval FDM Fused Deposition Modeling FFF Fused Filament Fabrication LC50 The concentration of a chemical that will kill 50% of the test population within a
designated period of time LCI Lowest Concentration of Interest MMA Methyl acrylate MSDS Material Safety Data Sheet NIST National Institute of Standards and Technology NOAEC No Observed Adverse Effect Concentration NOAEL No Observed Adverse Effect Level NOEL No Observed Effect Level PLA Polylactic acid REACH Registration, Evaluation, Authorisation and Restriction of Chemical substances SLA Stereolithography SLS Selective Laser Sintering SVOC Semi-Volatile Organic Compounds Tg Glass transition temperature TVOC Total Volatile Organic Compounds VOC Volatile Organic Compounds WHO World Health Organisation
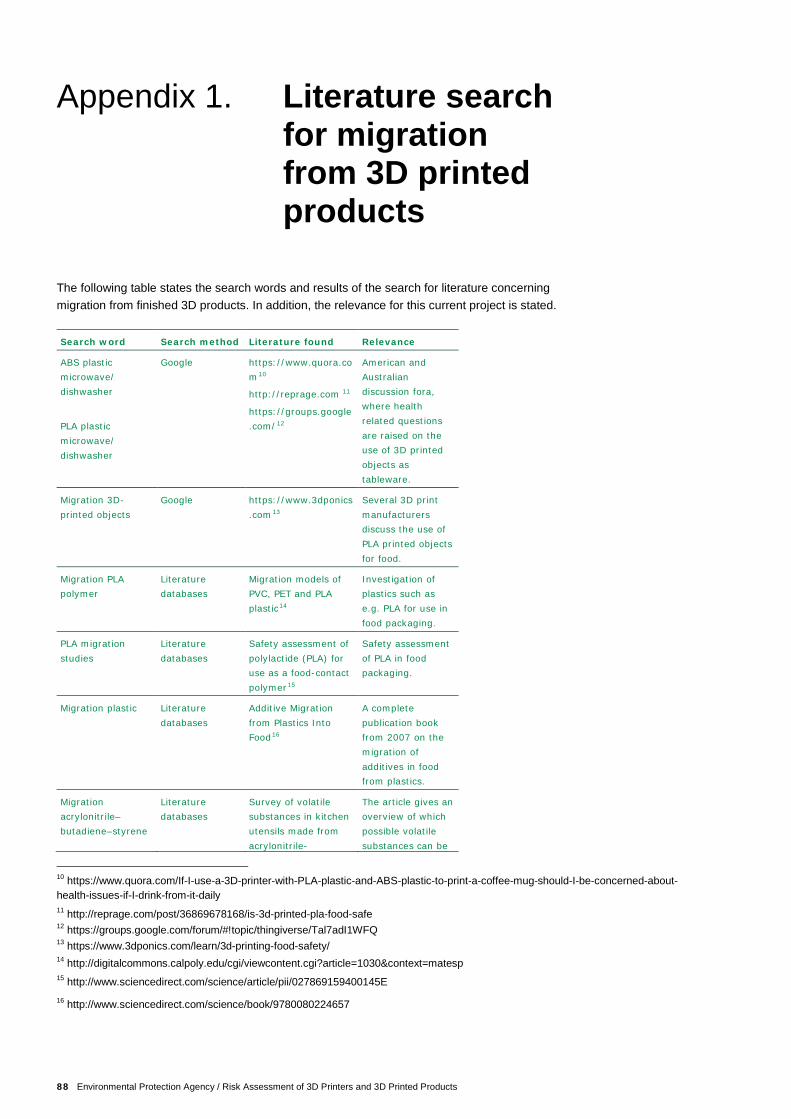
88 Environmental Protection Agency / Risk Assessment of 3D Printers and 3D Printed Products
Appendix 1. Literature search for migration from 3D printed products
The following table states the search words and results of the search for literature concerning migration from finished 3D products. In addition, the relevance for this current project is stated. Search word Search method Literature found Relevance
ABS plastic microwave/ dishwasher
PLA plastic microwave/ dishwasher
Google https://www.quora.com10
http://reprage.com 11
https://groups.google.com/12
American and Australian discussion fora, where health related questions are raised on the use of 3D printed objects as tableware.
Migration 3D-printed objects
Google https://www.3dponics.com13
Several 3D print manufacturers discuss the use of PLA printed objects for food.
Migration PLA polymer
Literature databases
Migration models of PVC, PET and PLA plastic14
Investigation of plastics such as e.g. PLA for use in food packaging.
PLA migration studies
Literature databases
Safety assessment of polylactide (PLA) for use as a food-contact polymer15
Safety assessment of PLA in food packaging.
Migration plastic Literature databases
Additive Migration from Plastics Into Food16
A complete publication book from 2007 on the migration of additives in food from plastics.
Migration acrylonitrile–butadiene–styrene
Literature databases
Survey of volatile substances in kitchen utensils made from acrylonitrile-
The article gives an overview of which possible volatile substances can be
10 https://www.quora.com/If-I-use-a-3D-printer-with-PLA-plastic-and-ABS-plastic-to-print-a-coffee-mug-should-I-be-concerned-about-health-issues-if-I-drink-from-it-daily 11 http://reprage.com/post/36869678168/is-3d-printed-pla-food-safe 12 https://groups.google.com/forum/#!topic/thingiverse/Tal7adI1WFQ 13 https://www.3dponics.com/learn/3d-printing-food-safety/ 14 http://digitalcommons.calpoly.edu/cgi/viewcontent.cgi?article=1030&context=matesp 15 http://www.sciencedirect.com/science/article/pii/027869159400145E 16 http://www.sciencedirect.com/science/book/9780080224657
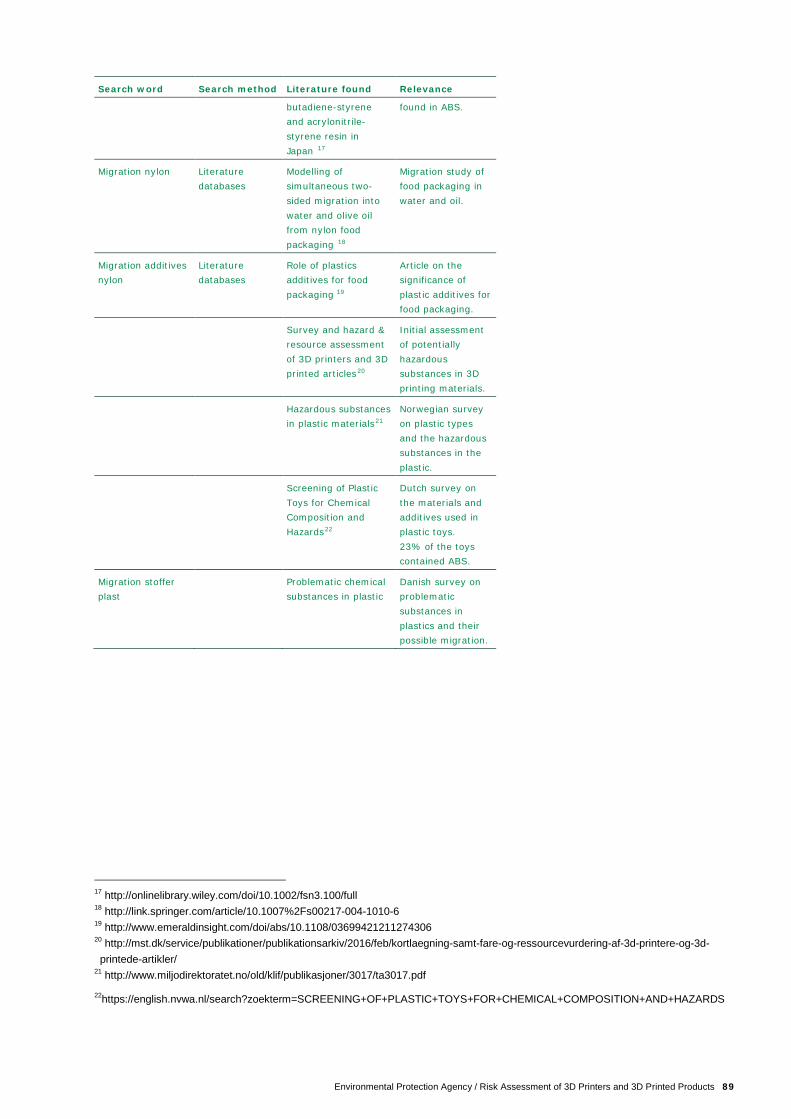
Environmental Protection Agency / Risk Assessment of 3D Printers and 3D Printed Products 89
Search word Search method Literature found Relevance butadiene-styrene and acrylonitrile-styrene resin in Japan 17
found in ABS.
Migration nylon Literature databases
Modelling of simultaneous two-sided migration into water and olive oil from nylon food packaging 18
Migration study of food packaging in water and oil.
Migration additives nylon
Literature databases
Role of plastics additives for food packaging 19
Article on the significance of plastic additives for food packaging.
Survey and hazard & resource assessment of 3D printers and 3D printed articles20
Initial assessment of potentially hazardous substances in 3D printing materials.
Hazardous substances in plastic materials21
Norwegian survey on plastic types and the hazardous substances in the plastic.
Screening of Plastic Toys for Chemical Composition and Hazards22
Dutch survey on the materials and additives used in plastic toys. 23% of the toys contained ABS.
Migration stoffer plast
Problematic chemical substances in plastic
Danish survey on problematic substances in plastics and their possible migration.
17 http://onlinelibrary.wiley.com/doi/10.1002/fsn3.100/full 18 http://link.springer.com/article/10.1007%2Fs00217-004-1010-6 19 http://www.emeraldinsight.com/doi/abs/10.1108/03699421211274306 20 http://mst.dk/service/publikationer/publikationsarkiv/2016/feb/kortlaegning-samt-fare-og-ressourcevurdering-af-3d-printere-og-3d-printede-artikler/
21 http://www.miljodirektoratet.no/old/klif/publikasjoner/3017/ta3017.pdf
22https://english.nvwa.nl/search?zoekterm=SCREENING+OF+PLASTIC+TOYS+FOR+CHEMICAL+COMPOSITION+AND+HAZARDS
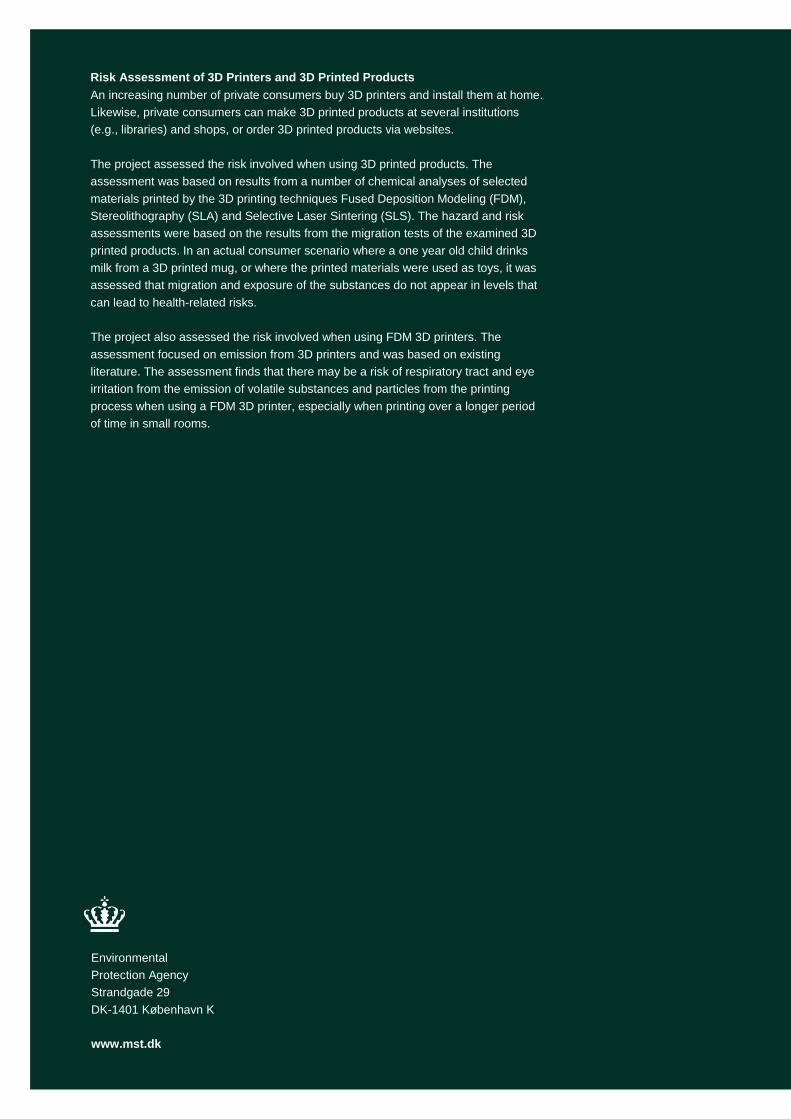
Environmental Protection Agency Strandgade 29 DK-1401 København K www.mst.dk
Risk Assessment of 3D Printers and 3D Printed Products An increasing number of private consumers buy 3D printers and install them at home. Likewise, private consumers can make 3D printed products at several institutions (e.g., libraries) and shops, or order 3D printed products via websites. The project assessed the risk involved when using 3D printed products. The assessment was based on results from a number of chemical analyses of selected materials printed by the 3D printing techniques Fused Deposition Modeling (FDM), Stereolithography (SLA) and Selective Laser Sintering (SLS). The hazard and risk assessments were based on the results from the migration tests of the examined 3D printed products. In an actual consumer scenario where a one year old child drinks milk from a 3D printed mug, or where the printed materials were used as toys, it was assessed that migration and exposure of the substances do not appear in levels that can lead to health-related risks. The project also assessed the risk involved when using FDM 3D printers. The assessment focused on emission from 3D printers and was based on existing literature. The assessment finds that there may be a risk of respiratory tract and eye irritation from the emission of volatile substances and particles from the printing process when using a FDM 3D printer, especially when printing over a longer period of time in small rooms.