Risk Assessment in the Istanbul Strait Using Black Sea MOU Port ...
17
sustainability Article Risk Assessment in the Istanbul Strait Using Black Sea MOU Port State Control Inspections Esma Gül Emecen Kara Maritime Transport Management Engineering, Engineering Faculty, University of Istanbul, Istanbul 34320, Turkey; [email protected]; Tel.: +90-212-473-7070 (ext. 17808) Academic Editor: Marc A. Rosen Received: 8 February 2016; Accepted: 18 April 2016; Published: 20 April 2016 Abstract: The Istanbul Strait has intense maritime traffic while, at the same time, it poses significant navigational challenges. Due to these properties, there is always a high risk arising from maritime shipping in this region. Especially, substandard ships threaten life, as well as the marine environment. In this aspect, Black Sea Memorandum of Understanding (MOU) Port State Control Inspections are important for maritime safety in the Istanbul Strait, because they directly reflect the performance of ships passing through the Istanbul Strait. Stringent and effective inspections assist in the enhancement of navigation safety and help to develop sustainable environment management. In this context, this study aims to assess maritime safety for the Strait region concerning passing flag states. Firstly, to assess the performance of flag states in general, the Black Sea MOU Black-Grey-White lists were generated for the period 2004–2014 and the change in the performance of these flags was examined. Secondly, the risk level of each flag state passing from the Strait region was determined using the method of weighted points based on the Black-Grey-White List, deficiency index level, casualty index level, and passing index level. Keywords: Istanbul Strait; Port State Control; Black Sea MOU; risk level; flag state performance; Black-Grey-White List; casualty; safety; deficiency 1. Introduction For centuries the Istanbul Strait has been an important link between the Black Sea, which is a closed sea, and the rest of the world. It is one of the seaways with the most intense maritime traffic in the world [1]. Moreover, it presents significant navigational challenges due to its geographic and oceanographic characteristics. It is approximately 31 km long, with an average width of 1500 m. It has several sharp turns requiring that ships alter course at least 12 times to safety navigate through it. At its narrowest point, which measures only 700 m, the current can reach 7–8 knots and a 45 degree course alteration is required, while at some sections the necessary course alteration reaches 80 degrees [2]. In addition to these factors, there is another factor making navigation hazardous: that is the intense volume of local maritime traffic. On a daily basis, many passenger boats, passenger and car ferries, and sea buses traverse the Strait [3]. Therefore, maritime shipping poses a particularly high risk to the region. Additionally, substandard ships increase the risk and threaten not only the marine environment but also life in this region. Over the years, serious accidents causing environmental disasters, such as those involving the Independenta, the Nassia, and Volganeft-248, have taken place in this region [4–6]. These causalities resulted in the loss of lives as well as caused significant amounts of oil to spill into the sea and the burning of oil causing air pollution. The Independenta accident resulted in the spillage of around 65,000 tons of crude oil into the Strait, and is one of the worst oil spills on record [4]. According to records of the Turkish Coastal Safety and Salvage, there have been several maritime incidents, such as grounding, contact, collusion, and fire [7]. These include the frequent occurrence of Sustainability 2016, 8, 390; doi:10.3390/su8040390 www.mdpi.com/journal/sustainability
Transcript of Risk Assessment in the Istanbul Strait Using Black Sea MOU Port ...

sustainability
Article
Risk Assessment in the Istanbul Strait Using BlackSea MOU Port State Control Inspections
Esma Gül Emecen Kara
Maritime Transport Management Engineering, Engineering Faculty, University of Istanbul, Istanbul 34320,Turkey; [email protected]; Tel.: +90-212-473-7070 (ext. 17808)
Academic Editor: Marc A. RosenReceived: 8 February 2016; Accepted: 18 April 2016; Published: 20 April 2016
Abstract: The Istanbul Strait has intense maritime traffic while, at the same time, it poses significantnavigational challenges. Due to these properties, there is always a high risk arising from maritimeshipping in this region. Especially, substandard ships threaten life, as well as the marine environment.In this aspect, Black Sea Memorandum of Understanding (MOU) Port State Control Inspections areimportant for maritime safety in the Istanbul Strait, because they directly reflect the performance ofships passing through the Istanbul Strait. Stringent and effective inspections assist in the enhancementof navigation safety and help to develop sustainable environment management. In this context, thisstudy aims to assess maritime safety for the Strait region concerning passing flag states. Firstly, toassess the performance of flag states in general, the Black Sea MOU Black-Grey-White lists weregenerated for the period 2004–2014 and the change in the performance of these flags was examined.Secondly, the risk level of each flag state passing from the Strait region was determined using themethod of weighted points based on the Black-Grey-White List, deficiency index level, casualty indexlevel, and passing index level.
Keywords: Istanbul Strait; Port State Control; Black Sea MOU; risk level; flag state performance;Black-Grey-White List; casualty; safety; deficiency
1. Introduction
For centuries the Istanbul Strait has been an important link between the Black Sea, which is aclosed sea, and the rest of the world. It is one of the seaways with the most intense maritime trafficin the world [1]. Moreover, it presents significant navigational challenges due to its geographic andoceanographic characteristics. It is approximately 31 km long, with an average width of 1500 m. It hasseveral sharp turns requiring that ships alter course at least 12 times to safety navigate through it. Atits narrowest point, which measures only 700 m, the current can reach 7–8 knots and a 45 degree coursealteration is required, while at some sections the necessary course alteration reaches 80 degrees [2].In addition to these factors, there is another factor making navigation hazardous: that is the intensevolume of local maritime traffic. On a daily basis, many passenger boats, passenger and car ferries,and sea buses traverse the Strait [3]. Therefore, maritime shipping poses a particularly high risk to theregion. Additionally, substandard ships increase the risk and threaten not only the marine environmentbut also life in this region. Over the years, serious accidents causing environmental disasters, such asthose involving the Independenta, the Nassia, and Volganeft-248, have taken place in this region [4–6].These causalities resulted in the loss of lives as well as caused significant amounts of oil to spill intothe sea and the burning of oil causing air pollution. The Independenta accident resulted in the spillageof around 65,000 tons of crude oil into the Strait, and is one of the worst oil spills on record [4].
According to records of the Turkish Coastal Safety and Salvage, there have been several maritimeincidents, such as grounding, contact, collusion, and fire [7]. These include the frequent occurrence of
Sustainability 2016, 8, 390; doi:10.3390/su8040390 www.mdpi.com/journal/sustainability

Sustainability 2016, 8, 390 2 of 17
ships ramming into seaside buildings or contact with local maritime vessels and fishing boats due toengine failure or navigation failure.
The 1994 Turkish Maritime Traffic Regulations were revised with the 1998 modified regulationsafter being adopted by the IMO and in 2004, the Vessel Traffic Services (VTS) were established toprovide maritime safety in the region. These regulations, together with the establishment of the VTS,have decreased the number of collision-related accidents, but they have not had any effect on othertypes of accidents [8]. There are various international rules and recommendations in order to reducethe risks arising from maritime transportation on the world’s seas, as well as to provide maritime safetyand protect the marine environment which are regulated by the International Maritime Organization(IMO), such as the convention for the safety of life at sea (SOLAS), the international convention for theprevention of pollution from ships (MARPOL), and the convention of the international regulationsfor preventing collisions at sea (COLREG). The primary responsibility for the implementation andenforcement of these regulations for all ships flying their flags lies with the flag states [9]. Classificationsocieties perform, statutorily, surveys and related activities on behalf of flag states by authorization ofa flag state. Classification societies play an important role in the case of certain states, such as openregisters (Flags of Convenience—FOCs), which do not have the resources or personnel needed to carryout the inspections [10,11]. Additionally, Port States have the right to inspect a foreign-flagged shipcoming into their port to ensure that the ship meets the requirements of international regulations,which is described as Port State Control (PSC). If a ship cannot comply with the standards required bythe relevant conventions, the IMO Standards, it is called a substandard ship. PSC is often accepted as ameasure to consolidate the former maritime safety net constructed by flag states and classificationssocieties; that is, the last safety net [12]. It was due to a problem that PSC originally emerged. Manyflag states were unable to adequately perform their mandated duties of ensuring that ships flying theirflags complied with the IMO standards. This was especially the case with FOCs which were forced todo this because a ship flying with an open register flag rarely visit its ports of registry in its service lifeand additional costs are required for control mechanisms [13]. After a series of tanker accidents in the1970s, the control mechanism used by flag states and classification societies were deemed as ineffectivein eradicating all substandard ships from the seas and the PSC emerged to assist in the enforcement ofthe procedures relating to international conventions [9,14].
Regional agreements on the PSC (Memorandum of Understanding on Port State Control—MOU)have been created in order to develop an effective and sustainable inspection mechanism by balancingthe demand for ports in the same region, exchanging information on ships inspected, unifying thestandards for inspection and detention and the training of officers conducting inspections underthe PSC [15,16]. The first regional agreement was the Paris MOU which includes Europe and theNorth Atlantic region. Since then, another eight regional agreements have been established andare, respectively, the Acuerdo de Vina del Mar Agreement, the Tokyo MOU, the Caribbean MOU,the Mediterranean MOU, the Indian Ocean MOU, the Abuja MOU, the Black Sea MOU, and theRiyadh MOU. In addition to these regional agreements, the USA conducts PSC over its territorialwaters [15–17].
Despite the fact that all regional PSC regimes are the same, there are differences in theirimplementation, such as the evaluation of performance of flag states and selecting priority shipsfor inspection [15]. Moreover, each port in the same regime does not carry out the inspections withthe same strictness due to geographic and cultural differences; therefore, the average detention anddeficiency rates may be different from one to another [18]. The largest and most stringent inspectionsare made in the Paris MOU and the Tokyo MOU with leader memorandums [15]. According toresearch by Li and Zheng, the Paris MOU and the Tokyo MOU have the most efficient ship selectingmethods [12]. The Paris and Tokyo MOUs use “The Black, Grey and White List” (BGW list) of flagstates as one of the parameters for determining a ship’s risk profile. The BGW list which represents theperformances of flag states is generated based on the statistics of inspections and detentions conducted

Sustainability 2016, 8, 390 3 of 17
during the previous three years. From time to time, amendments are necessary by PSC regimes inorder to improve the effectiveness of inspections and to ensure sustainability.
Several academic studies based on detentions and deficiencies detected in the various regionalMOUs have been carried out to determine the effect of the PSC on maritime safety, taking into accountvarious parameters such as ship age, ship type, recognizing organizations and flag states. These studieshave concluded that the PSC has been successful in reducing risk and in raising the maritime safetylevel [12–14,18–23]. The PSC mechanism is regarded as one of the most important tools to ensuremaritime safety.
In this context, although the risks arising from maritime shipping cannot be completely eliminateddue to the aforementioned characteristics of the Istanbul Strait, they may be reduced and the safetyof navigation in this region may be improved by means of PSC inspections. The Black Sea MOUinspections are of special importance for maritime safety in this region because ships passing throughthis region, which visit a seaport of the Black Sea, are inspected in the Black Sea MOU. At the sametime, these inspections are an important indicator of maritime safety in this region because theseinspections directly reflect the performance of flag states passing through this region.
In this study, for the assessment of risks arising from maritime transportation in the IstanbulStrait, the risk level of passing flag states from this region has been taken into consideration. Firstly, inorder to evaluate the performance of flag states, the Black Sea BGW lists are generated, as is the casewith those of the Paris MOU and the Tokyo MOU. Secondly, in order to determine the risk level of flagstates passing through the Istanbul Strait, the weighted point method, which includes the criteria ofthe BGW list, deficiency index level, casualty index level, and passing index level, is used.
2. Literature Review
Various studies on the casualty rates of flag states and the relationship between PSC inspectionsand flag states’ related risk have been carried out. In these studies the risks arising from maritimetransportation are evaluated based on flag state data on PSC and the casualty rate of ships from flagstates like this study. Li and Wonham investigated total loss statistics from 1977 to 1996 and analyzedthe world fleet, dividing it into groups according to the total accidental loss rate. They concludedthat the total loss rate had declining for this period due to the implementation of safety measuresand confirmed that open registers (FOCs) had the worst safety record, generally [24]. Alderton andWinchester examined the casualty record of flag states for the years 1997–1999 by comparing theaverage casualty rates of flag states according to the types of register and their findings indicated thatFOCs had generally a worst record than national flags [25]. Li investigated the relationship between thetotal loss rate of FOCs and Port State Control detentions, and found that there was a high correlationbetween the loss rate and detention rate and the age of a ship [26]. Cariou et al. showed that the maindeterminants of the number of reported deficiencies were the age of the vessel at inspection, the typeof vessel, and the flag of registry [13]. Knapp and Franses analyzed the effect of PSC inspections onthe probability of casualty according to targeting ships, ship types, flag states, classification societies,and detained vessels. One of the conclusions drawn in this study is that black-listed flag states showeda higher probability of a serious casualty compared to the gray- and white-listed flag states [27].Robert and Marlow investigated casualties in dry bulk shipping from 1963–1996 and stressed that therisk would increase with ship age and the ship’s flag of registration [28]. Piniella et al. studied theinfluences of PSC policies concerning FOCs using detention and deficiency data of the Paris and TokyoMOUs and the USCG. As part of this study, the relationship between FOCs fleets and the detection ofsubstandard ships is determined using the detention index and they found that all FOCs have differentresults in the ranking of the highest detention index [29]. Degre generated the Black-Gray-White listof categories of vessels according to their observed casualties using similar methods to those of theBlack-Grey-White list of the Paris MOU to complement flag state performances [30].
Furthermore, there are several studies, which take differing angles, based on maritime traffic ofthe Istanbul Strait and risk assessment. In these studies the risks arising from maritime transportation

Sustainability 2016, 8, 390 4 of 17
in the Istanbul Strait are evaluated using various parameters and methods, and the common finding ofall these studies is that the Istanbul Strait is a high-risk waterway. Emecen Kara and Oksas evaluatedmaritime safety in the Istanbul Strait according to average detention and deficiency rates of flagstates passing through it in all regional MOUs [15]. Using several maritime traffic safety parameterssuch as traffic flow, traffic volume of local vessel, and probability of collusion Aydogdu et al. foundthat the areas most at risk were at the southern entrance to the Istanbul Strait [31]. Arslan andTuran investigated maritime casualties in the Istanbul Strait analytically and found various factorscausing shipping accidents and the weights of each factor using the SWOT-AHP method [32]. Or andKahraman analyzed possible factors contributing to accidents in the Istanbul Strait using Bayesiananalysis and simulations modelling. Their results indicated significant increases in the number ofaccidents in maritime conditions such as higher transit traffic rates, denser local traffic conditions, andadverse weather conditions [33]. Ulusçu et al. analyzed safety risks pertaining to the transit vesselmaritime traffic in the Istanbul Strait by dividing it into slices incorporating a probabilistic accidentrisk model into the simulation model. They also investigated the impact of various factors, whichincluded vessel arrivals, scheduling policies, pilotage, overtaking, and local traffic density, on the riskprofile of the Strait. Local traffic density and pilotage were found to be two main factors affecting thelevel of risk [3]. Contrary to these studies, in this study the risk arising from maritime transportationin the Istanbul Strait are determined based on the performances of flag states on the Black Sea MOU,as well as the number of passing and casualty rates of flag states in this region.
3. Ship Traffic in the Istanbul Strait
The number of ships passing through the Istanbul Strait from 2005 to 2014 are shown in Table 1.The average annual number of ships is approximately 54000 between 2005 and 2009. The annualnumber of ships have decreased since 2009.
Table 1. Number of ships passing through the Istanbul Strait between 2005 and 2014 [34].
Years 2005 2006 2007 2008 2009 2010 2011 2012 2013 2014
Number of Ships 54,794 54,880 56,606 54,396 51,422 50,871 49,798 48,329 46,532 45,529
The 16 flag states with the highest number of ships passing through the Istanbul Strait for theperiod of 2005–2014 are given in Figure 1. The four flags states with the highest total number of shipspassing through the Strait are Turkey, Malta, Russia, and Panama, respectively.
Sustainability 2016, 8, 390 4 of 17
of flag states passing through it in all regional MOUs [15]. Using several maritime traffic safety
parameters such as traffic flow, traffic volume of local vessel, and probability of collusion Aydoğdu
et al. found that the areas most at risk were at the southern entrance to the Istanbul Strait [31]. Arslan
and Turan investigated maritime casualties in the Istanbul Strait analytically and found various
factors causing shipping accidents and the weights of each factor using the SWOT‐AHP method [32].
Or and Kahraman analyzed possible factors contributing to accidents in the Istanbul Strait using
Bayesian analysis and simulations modelling. Their results indicated significant increases in the
number of accidents in maritime conditions such as higher transit traffic rates, denser local traffic
conditions, and adverse weather conditions [33]. Ulusçu et al. analyzed safety risks pertaining to the
transit vessel maritime traffic in the Istanbul Strait by dividing it into slices incorporating a
probabilistic accident risk model into the simulation model. They also investigated the impact of
various factors, which included vessel arrivals, scheduling policies, pilotage, overtaking, and local
traffic density, on the risk profile of the Strait. Local traffic density and pilotage were found to be two
main factors affecting the level of risk [3]. Contrary to these studies, in this study the risk arising from
maritime transportation in the Istanbul Strait are determined based on the performances of flag states
on the Black Sea MOU, as well as the number of passing and casualty rates of flag states in this region.
3. Ship Traffic in the Istanbul Strait
The number of ships passing through the Istanbul Strait from 2005 to 2014 are shown in Table 1.
The average annual number of ships is approximately 54000 between 2005 and 2009. The annual
number of ships have decreased since 2009.
Table 1. Number of ships passing through the Istanbul Strait between 2005 and 2014 [34].
Years 2005 2006 2007 2008 2009 2010 2011 2012 2013 2014
Number of Ships 54,794 54,880 56,606 54,396 51,422 50,871 49,798 48,329 46,532 45,529
The 16 flag states with the highest number of ships passing through the Istanbul Strait for the
period of 2005–2014 are given in Figure 1. The four flags states with the highest total number of ships
passing through the Strait are Turkey, Malta, Russia, and Panama, respectively.
Figure 1. Top 16 flags with respect to the total number of ships passing (2005–2014).
4. Materials and Methods
4.1. Method for Flag State Risk Level Determination
Figure 1. Top 16 flags with respect to the total number of ships passing (2005–2014).

Sustainability 2016, 8, 390 5 of 17
4. Materials and Methods
4.1. Method for Flag State Risk Level Determination
The risk level of flag states passing through the Istanbul Strait is determined based on theparameters of detentions, deficiencies, number of casualties, and number of passing ships. Each flagstate risk level is determined by the following equation:
FRL “ BGW list point`DIL point` CIL point` PIL point (1)
In the formula (1), FRL is Flag State Risk Level, BGW List Point is Black-Grey-White List point,DIL point is the Deficiency Index Level point, CIL point is the Casualty Index Level point andPIL point is the Passing Index Level point.
4.1.1. Method of Generating the BGW List and Calculations of Excess Factor
The BGW list determines the performance of each flag state depending on its detentions andinspections. The BGW list is generated [35,36] using “Equations (2) and (3) assuming that the numberof detentions follows a binominal distribution” in the Paris and Tokyo MOUs.
ublacktogrey “ N.p` 0.5` zb
pN p p1´ pqq (2)
ugreytowhite “ N.p´ 0.5´ zb
pN p p1´ pqq (3)
In the equations; ublacktogrey is the black to grey limit, ugreytowhite is the grey to white limit, N istotal number of inspections, p is allowable detention limit, z is statistical constant. Where p “ 0.07(with 0.03 incremental steps) and z “ 1.645 (for certainty level of 95%) is taken. These limits are usedto calculate the excess factor (EF) of each flag state in order to compare them. These calculations areapplied to flags that have had more than 30 inspections in the previous three-year period.
4.1.2. Calculation of the Flag Deficiency Index Level
DIL is determined by the following equation:
DIL “De f iciency Index
Regional Avarage De f iciency Index(4)
where, “Regional Average De f iciency Index” denotes “the ratio of the total number of deficiencies tothe total number of all inspections in the regional MOU over three years”. “Deficiency Index” of a flagstate is the ratio of the total number of a flag’s deficiencies to the total number of inspections in thisflag over three years [37].
4.1.3. Calculation of the Casualty Index Level
This index level is determined by using the following equation:
CIL “Casualty Index
Regional Average Casualty Index(5)
In the equation, the Casualty Index is the ratio of the total number of a flag’s casualtiesover three years to the total number of ships of a flag passing in the same period, theRegional Average Casualty Index is the ratio of the total number of overall casualties to the totalnumber of all ships passing in this region over three years.

Sustainability 2016, 8, 390 6 of 17
4.1.4. Calculation of Passing Index Level
Passing Index Level (PILq is determined by:
PIL “Passing Rate
Regional Average Passing Rate(6)
Regional Average Passing Rate is the average of all flags’ passing rate over three years for theStrait region. Passing Rate is the ratio of the total passing number of a flag state to the total number ofpassing all ships over three years.
4.2. Determining Risk Level of Criteria and Weighted Points
The criteria and weighted points within each parameter for each Flag State Risk Level are shownin Table 2. FRL groups flag states into “high risk”, “standard risk”, and “low risk”; these risk groupsare used to determine ship risk profile in the Paris MOU [38]. According to the weighted points inTable 2, flags having a total of four or more points are grouped as having a high risk level, while flagshaving between zero and four total points are grouped as having a standard risk level. Other flags thathave a total point of zero are grouped as having a low risk level.
Table 2. Flag state risk criteria and risk level.
Parameter Criteria Weighting Points
Detentions Black-Grey-White List pBGW listq
Black-VHR 1, HR 2, M to HR 3 3Black-MR 4 2
Grey-M to LR 5 1White 0
Deficiencies Deficiency Index Level (DILq HR 1LR 6 0
Number of Casualties Casualty Index Level (CILqVHR 2HR 1LR 0
Number of Passing Ships Passing Index Level (PIL)HR, VHR 2
MR, M to HR 1LR 0
1 VHR-Very High Risk; 2 HR-High Risk; 3 M to HR-Medium to High Risk; 4 MR-Medium Risk; 5 M toLR-Medium to Low Risk; 6 LR-Low Risk.
According to criteria values, risk levels are categorized as the following.The BGW list is divided into three levels by EF value (EFď 0 is the white list, EFě1 is the black list,
and 0 > EF > 1 the grey list). Additionally, the black list has been divided into four risk levels—VHR,HR, M to HR, and MR according to EF value. The relationship between the number of inspections anddetentions is illustrated graphically in Figure 2.
DIL is categorized as:
DIL “
$
’
&
’
%
ă 1.0 Low Risk
ě 1.0 High Risk(7)
CIL is categorized as:
CIL
$
’
&
’
%
ă 1.0 Low Riskě 1.0 and ď 2.0 High Riską 2.0 Very High Risk
(8)
PIL is categorized as:

Sustainability 2016, 8, 390 7 of 17
PIL
$
’
’
’
’
’
&
’
’
’
’
’
%
ă 1 Low Riskě 1 and ă 2 Medium Riskě 2 and ă 3 Medium to High Riskě 3 and ă 4 High Risk
ě 4 Very High Risk
(9)
Sustainability 2016, 8, 390 7 of 17
4.2. Determining Risk Level of Criteria and Weighted Points
The criteria and weighted points within each parameter for each Flag State Risk Level are shown
in Table 2. groups flag states into “high risk”, “standard risk”, and “low risk”; these risk groups
are used to determine ship risk profile in the Paris MOU [38]. According to the weighted points in
Table 2, flags having a total of four or more points are grouped as having a high risk level, while flags
having between zero and four total points are grouped as having a standard risk level. Other flags
that have a total point of zero are grouped as having a low risk level.
Table 2. Flag state risk criteria and risk level.
Parameter Criteria Weighting Points
Detentions Black‐Grey‐White List
Black‐VHR 1, HR 2, M to HR 3 3
Black‐MR 4 2
Grey‐M to LR 5 1
White 0
Deficiencies Deficiency Index Level ( HR 1
LR 6 0
Number of
Casualties Casualty Index Level (
VHR 2
HR 1
LR 0
Number of
Passing Ships Passing Index Level ( )
HR, VHR 2
MR, M to HR 1
LR 0
1 VHR‐Very High Risk; 2 HR‐High Risk; 3 M to HR‐Medium to High Risk; 4 MR‐Medium Risk; 5 M to
LR‐Medium to Low Risk; 6 LR‐Low Risk.
According to criteria values, risk levels are categorized as the following.
The BGW list is divided into three levels by EF value (EF ≤ 0 is the white list, EF ≥1 is the black
list, and 0 > EF > 1 the grey list). Additionally, the black list has been divided into four risk levels—
VHR, HR, M to HR, and MR according to EF value. The relationship between the number of
inspections and detentions is illustrated graphically in Figure 2.
Figure 2. Relations between the number of inspections and detentions [38].
is categorized as:
1.0
1.0 (7)
Figure 2. Relations between the number of inspections and detentions [38].
4.3. Data
The statistics of inspections/detentions/deficiencies conducted on the Black Sea MOU and thestatistics of passing ships and casualties in the Istanbul Strait have been used for this study.
The data used to evaluate performance of flag states was obtained from annual reports (from 2004to 2014) which are found on the Black Sea MOU website [39].
The data used to determine the Flag State Risk Level were obtained from the annual reportsfor 2012, 2013, and 2014 from the Black Sea MOU website [39] and from the passing ships and theMarine Causalities and Incidents statistics of the Turkish Ministry of Transport, Maritime Affairs andCommunications [7].
5. Results
5.1. Port State Control Inspections in the Black Sea MOU Region
The Black Sea MOU was signed by Bulgaria, Georgia, Romania, Russia, Turkey, and Ukraine in2000. The Black Sea MOU includes the Black Sea region and it aims to improve maritime safety inthe Black Sea region. Foreign-flagged ships visiting a seaport in the region are inspected accordingto the international regulations in force [37]. Inspection statistics will be published in the annualreport printed by the middle of the following year. For example, the 2015 annual report has not yetbeen published.
The Black Sea MOU inspection statistics over the period 2005–2014 are summarized in Table 3.These inspection statistics were obtained from annual reports of the Black Sea MOU [39]. It showsthat over 60% deficiencies were detected in inspections and that the detention rate decreased overthe period.

Sustainability 2016, 8, 390 8 of 17
Table 3. Number of inspections, percent of deficiencies and detention (2005–2014) [39].
Years 2005 2006 2007 2008 2009 2010 2011 2012 2013 2014
Number of Inspections 5069 4658 4499 5161 4805 4929 4657 4607 5080 5092Deficiencies Percentage (%) 62.93 69.39 72.42 67.89 66.93 64.74 67.77 65.16 65.08 59.92
Detention Rate (%) 6.23 5.56 8.16 6.37 5.79 5.80 5.35 4.67 3.62 2.97
The percentage of deficiencies by categories over the period of 2012–2014 are shown in Figure 3.This shows that navigation safety, lifesaving appliances, working conditions, and fire safety measuresare the top four categories in terms of deficiency.Sustainability 2016, 8, 390 9 of 17
Figure 3. Major deficiencies as a percent of total deficiencies (2012–2014).
5.2. Examination of Flag State Performance Depending on Detention Rate in the Black Sea MOU
The Black Sea MOU BGW lists are generated annually using data from inspections and
detentions on the Black Sea MOU over the preceding three years. According to the excess factor,
calculated to compare the performance of flags, all flags inspected on the Black Sea MOU are included
in the lists. Thus, a general evaluation has been carried out by means of examining the performance
of flag states and the change in this performance over time.
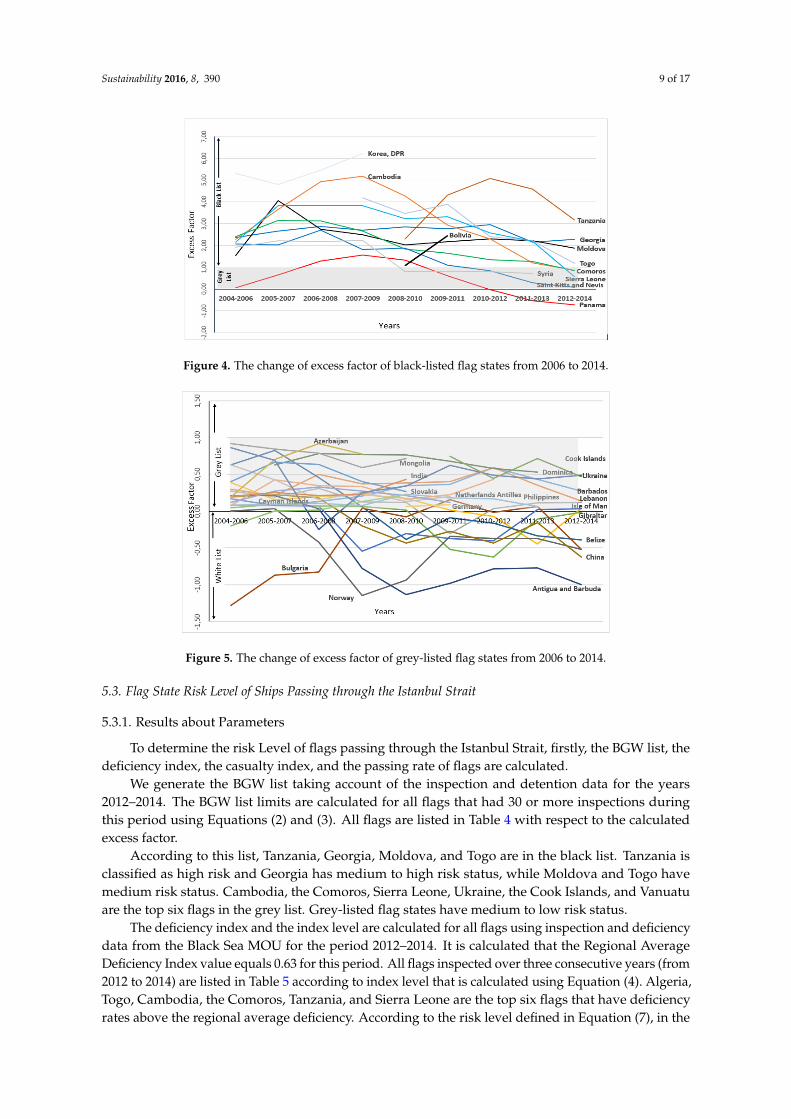
The change in excess factor flag states listed in the black list over time are shown in Figure 4. The
DPR of Korea, the Comoros, Georgia, Cambodia, Sierra Leone, Saint Kitts and Nevis, Syria, and
Moldova were in the black list in 2006 (covering the years 2004–2006). In 2008 Panama was in the
black list, as was Togo in 2009. The DPR of Korea was removed from the BGW list after 2009 due to
a decrease in the number of inspections of the DPR of Korea‐flagged ships in this period (inspections
below 30 in the preceding three years related to a decrease in ship numbers calling to regional
seaports). Tanzania and Bolivia were in the black list in 2010. Bolivia was removed from the BGW in
2012. Tanzania, Georgia, Moldova, and Togo were still in the black list in 2014. Tanzania has high
risk status and Georgia has medium to high risk status, while Moldova and Togo have medium risk
status. Other flags have moved to the grey list. The black list risk level has generally decreased over
time.
Figure 4. The change of excess factor of black‐listed flag states from 2006 to 2014.
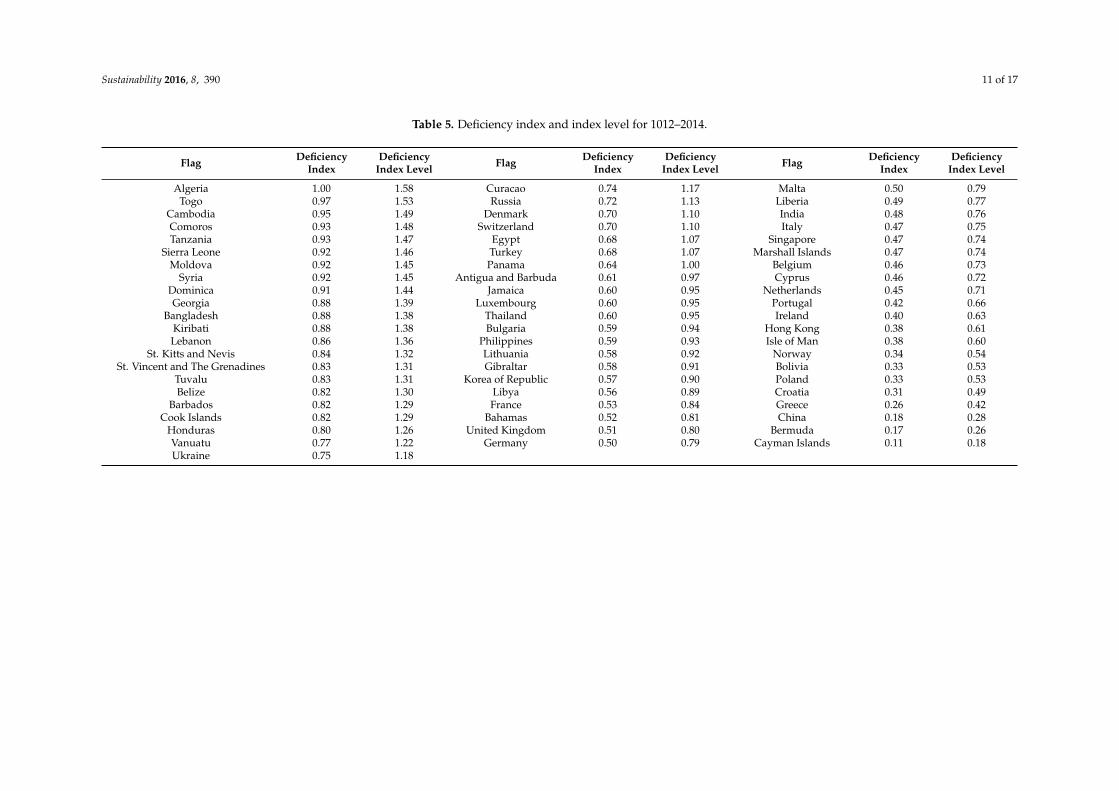
The change in excess factor flag states located in the grey list are shown in Figure 5. Antigua and
Barbuda, Norway, China, Belize, Gibraltar, and the Isle of Man have moved to the white list over
Figure 3. Major deficiencies as a percent of total deficiencies (2012–2014).
5.2. Examination of Flag State Performance Depending on Detention Rate in the Black Sea MOU
The Black Sea MOU BGW lists are generated annually using data from inspections and detentionson the Black Sea MOU over the preceding three years. According to the excess factor, calculated tocompare the performance of flags, all flags inspected on the Black Sea MOU are included in the lists.Thus, a general evaluation has been carried out by means of examining the performance of flag statesand the change in this performance over time.
The change in excess factor flag states listed in the black list over time are shown in Figure 4.The DPR of Korea, the Comoros, Georgia, Cambodia, Sierra Leone, Saint Kitts and Nevis, Syria, andMoldova were in the black list in 2006 (covering the years 2004–2006). In 2008 Panama was in the blacklist, as was Togo in 2009. The DPR of Korea was removed from the BGW list after 2009 due to a decreasein the number of inspections of the DPR of Korea-flagged ships in this period (inspections below 30 inthe preceding three years related to a decrease in ship numbers calling to regional seaports). Tanzaniaand Bolivia were in the black list in 2010. Bolivia was removed from the BGW in 2012. Tanzania,Georgia, Moldova, and Togo were still in the black list in 2014. Tanzania has high risk status andGeorgia has medium to high risk status, while Moldova and Togo have medium risk status. Otherflags have moved to the grey list. The black list risk level has generally decreased over time.
The change in excess factor flag states located in the grey list are shown in Figure 5. Antiguaand Barbuda, Norway, China, Belize, Gibraltar, and the Isle of Man have moved to the white list overtime. Azerbaijan was removed from the BGW list after 2009 because the total number of inspectionsfell below 30 in the preceding three years relative to the number of visiting ships. In the same wayMongolia, India, and Slovakia were removed from the list in 2011.
Sustainability 2016, 8, 390 9 of 17
Sustainability 2016, 8, 390 9 of 17
Figure 3. Major deficiencies as a percent of total deficiencies (2012–2014).
5.2. Examination of Flag State Performance Depending on Detention Rate in the Black Sea MOU
The Black Sea MOU BGW lists are generated annually using data from inspections and
detentions on the Black Sea MOU over the preceding three years. According to the excess factor,
calculated to compare the performance of flags, all flags inspected on the Black Sea MOU are included
in the lists. Thus, a general evaluation has been carried out by means of examining the performance
of flag states and the change in this performance over time.
The change in excess factor flag states listed in the black list over time are shown in Figure 4. The
DPR of Korea, the Comoros, Georgia, Cambodia, Sierra Leone, Saint Kitts and Nevis, Syria, and
Moldova were in the black list in 2006 (covering the years 2004–2006). In 2008 Panama was in the
black list, as was Togo in 2009. The DPR of Korea was removed from the BGW list after 2009 due to
a decrease in the number of inspections of the DPR of Korea‐flagged ships in this period (inspections
below 30 in the preceding three years related to a decrease in ship numbers calling to regional
seaports). Tanzania and Bolivia were in the black list in 2010. Bolivia was removed from the BGW in
2012. Tanzania, Georgia, Moldova, and Togo were still in the black list in 2014. Tanzania has high
risk status and Georgia has medium to high risk status, while Moldova and Togo have medium risk
status. Other flags have moved to the grey list. The black list risk level has generally decreased over
time.
Figure 4. The change of excess factor of black‐listed flag states from 2006 to 2014.
The change in excess factor flag states located in the grey list are shown in Figure 5. Antigua and
Barbuda, Norway, China, Belize, Gibraltar, and the Isle of Man have moved to the white list over
Figure 4. The change of excess factor of black-listed flag states from 2006 to 2014.
Sustainability 2016, 8, 390 10 of 17
time. Azerbaijan was removed from the BGW list after 2009 because the total number of inspections
fell below 30 in the preceding three years relative to the number of visiting ships. In the same way
Mongolia, India, and Slovakia were removed from the list in 2011.
Figure 5. The change of excess factor of grey‐listed flag states from 2006 to 2014.
5.3. Flag State Risk Level of Ships Passing through the Istanbul Strait
5.3.1. Results about Parameters
To determine the risk Level of flags passing through the Istanbul Strait, firstly, the BGW list, the
deficiency index, the casualty index, and the passing rate of flags are calculated.
We generate the BGW list taking account of the inspection and detention data for the years 2012–
2014. The BGW list limits are calculated for all flags that had 30 or more inspections during this period
using Equations (2) and (3). All flags are listed in Table 4 with respect to the calculated excess factor.
According to this list, Tanzania, Georgia, Moldova, and Togo are in the black list. Tanzania is
classified as high risk and Georgia has medium to high risk status, while Moldova and Togo have
medium risk status. Cambodia, the Comoros, Sierra Leone, Ukraine, the Cook Islands, and Vanuatu
are the top six flags in the grey list. Grey‐listed flag states have medium to low risk status.
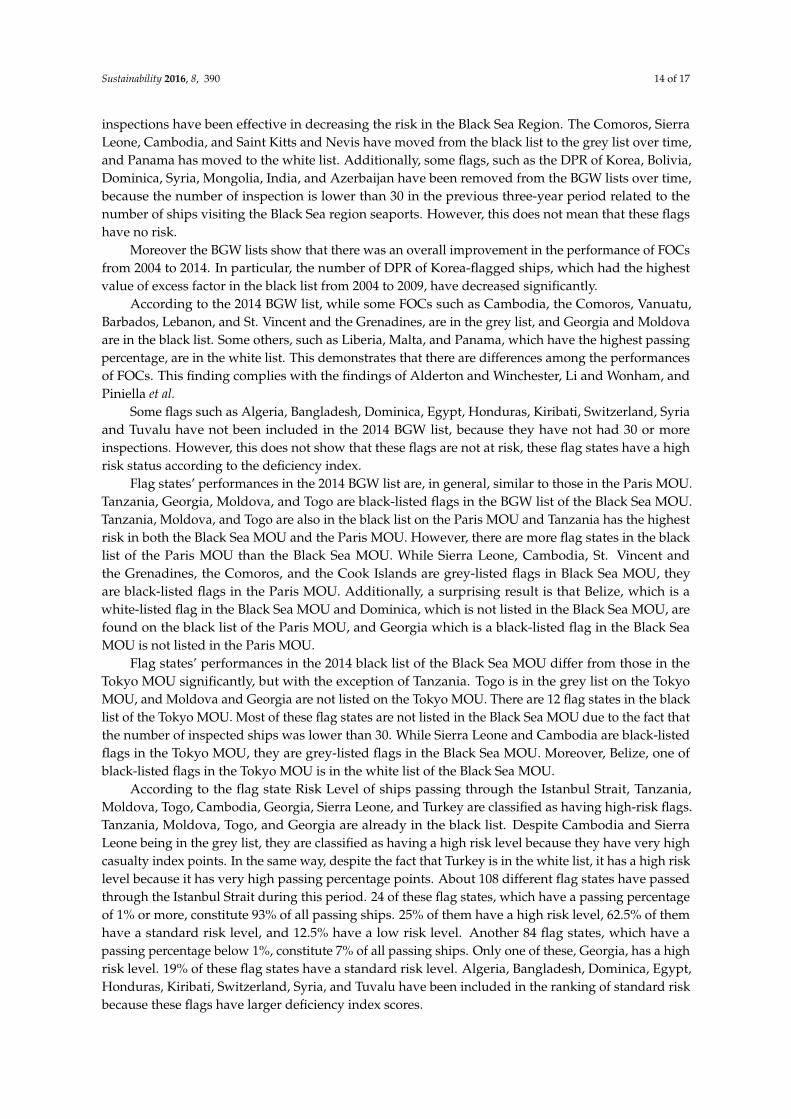
The deficiency index and the index level are calculated for all flags using inspection and
deficiency data from the Black Sea MOU for the period 2012–2014. It is calculated that the Regional
Average Deficiency Index value equals 0.63 for this period. All flags inspected over three consecutive
years (from 2012 to 2014) are listed in Table 5 according to index level that is calculated using
Equation (4). Algeria, Togo, Cambodia, the Comoros, Tanzania, and Sierra Leone are the top six flags
that have deficiency rates above the regional average deficiency. According to the risk level defined
in Equation (7), in the table, while flags whose index level is less than one are evaluated as low risk
flags, the others are evaluated as high risk flags.
The casualty index of flags are calculated using data of casualty rates occurring in the Strait
region for the period 2012–2014. Casualties occurring due to weather conditions have been eliminated
from the evaluation. When the statistics are examined, it becomes evident that most of the casualties
are due to collision/contact/grounding and resulted in minor damage, and most of the ships involved
in such accidents were dry bulk ships.
Figure 5. The change of excess factor of grey-listed flag states from 2006 to 2014.
5.3. Flag State Risk Level of Ships Passing through the Istanbul Strait
5.3.1. Results about Parameters
To determine the risk Level of flags passing through the Istanbul Strait, firstly, the BGW list, thedeficiency index, the casualty index, and the passing rate of flags are calculated.
We generate the BGW list taking account of the inspection and detention data for the years2012–2014. The BGW list limits are calculated for all flags that had 30 or more inspections duringthis period using Equations (2) and (3). All flags are listed in Table 4 with respect to the calculatedexcess factor.
According to this list, Tanzania, Georgia, Moldova, and Togo are in the black list. Tanzania isclassified as high risk and Georgia has medium to high risk status, while Moldova and Togo havemedium risk status. Cambodia, the Comoros, Sierra Leone, Ukraine, the Cook Islands, and Vanuatuare the top six flags in the grey list. Grey-listed flag states have medium to low risk status.
The deficiency index and the index level are calculated for all flags using inspection and deficiencydata from the Black Sea MOU for the period 2012–2014. It is calculated that the Regional AverageDeficiency Index value equals 0.63 for this period. All flags inspected over three consecutive years (from2012 to 2014) are listed in Table 5 according to index level that is calculated using Equation (4). Algeria,Togo, Cambodia, the Comoros, Tanzania, and Sierra Leone are the top six flags that have deficiencyrates above the regional average deficiency. According to the risk level defined in Equation (7), in the

Sustainability 2016, 8, 390 10 of 17
table, while flags whose index level is less than one are evaluated as low risk flags, the others areevaluated as high risk flags.
The casualty index of flags are calculated using data of casualty rates occurring in the Strait regionfor the period 2012–2014. Casualties occurring due to weather conditions have been eliminated fromthe evaluation. When the statistics are examined, it becomes evident that most of the casualties aredue to collision/contact/grounding and resulted in minor damage, and most of the ships involved insuch accidents were dry bulk ships.
Table 4. The Black Sea MOU BGW list (2012–2014).
Black List
Flag Inspections Detentions ublacktogrey ugreytowhiteExcessFactor
Tanzania 269 46 26.21 3.16
Georgia 33 7 5.22 2.27Moldova 608 71 53.41 1.88
Togo 247 26 24.39 1.19
Grey List
Flag Inspections Detentions ublacktogrey ugreytowhiteExcessFactor
Cambodia 484 41 43.61 24.15 0.87
Comoros 246 22 24.30 10.14 0.84Sierra Leone 256 19 25.14 10.70 0.57
Ukraine 188 13 19.41 6.91 0.49Cook Islands 220 15 22.13 8.67 0.47
Vanuatu 48 3 6.77 ´0.05 0.45Barbados 33 1 5.00 0.00 0.27Lebanon 50 1 6.97 0.03 0.14Denmark 53 1 7.27 0.15 0.12
Saint Kitts and Nevis 208 9 21.11 8.01 0.08Saint Vincent and The Grenadines 269 12 26.21 11.45 0.04
Isle of Man 66 1 8.53 0.71 0.04
White List
Flag Inspections Detentions ublacktogrey ugreytowhiteExcessFactor
Gibraltar 73 1 1.02 ´0.02
United Kingdom 83 1 1.49 ´0.29Belize 418 16 20.18 ´0.39
Bulgaria 64 0 1.00 ´0.52Norway 64 0 0.62 ´0.52China 68 0 1.00 ´0.62
Panama 1713 68 102.04 ´0.72Bahamas 320 8 14.39 ´0.81Turkey 1413 47 82.63 ´0.92
Antigua and Barbuda 397 9 18.93 ´1.00Russia 963 24 53.89 ´1.16
Netherlands 239 3 9.74 ´1.20Marshall Islands 818 15 44.76 ´1.38
Liberia 1055 19 59.72 ´1.45Cyprus 153 0 5.02 ´1.55Malta 1743 27 103.99 ´1.62Italy 286 1 12.42 ´1.72
Singapore 262 0 11.05 ´1.88Greece 387 1 18.33 ´1.88
Hong Kong 419 1 20.24 ´1.92
Sustainability 2016, 8, 390 11 of 17
Table 5. Deficiency index and index level for 1012–2014.
Flag DeficiencyIndex
DeficiencyIndex Level Flag Deficiency
IndexDeficiency
Index Level Flag DeficiencyIndex
DeficiencyIndex Level
Algeria 1.00 1.58 Curacao 0.74 1.17 Malta 0.50 0.79Togo 0.97 1.53 Russia 0.72 1.13 Liberia 0.49 0.77
Cambodia 0.95 1.49 Denmark 0.70 1.10 India 0.48 0.76Comoros 0.93 1.48 Switzerland 0.70 1.10 Italy 0.47 0.75Tanzania 0.93 1.47 Egypt 0.68 1.07 Singapore 0.47 0.74
Sierra Leone 0.92 1.46 Turkey 0.68 1.07 Marshall Islands 0.47 0.74Moldova 0.92 1.45 Panama 0.64 1.00 Belgium 0.46 0.73
Syria 0.92 1.45 Antigua and Barbuda 0.61 0.97 Cyprus 0.46 0.72Dominica 0.91 1.44 Jamaica 0.60 0.95 Netherlands 0.45 0.71Georgia 0.88 1.39 Luxembourg 0.60 0.95 Portugal 0.42 0.66
Bangladesh 0.88 1.38 Thailand 0.60 0.95 Ireland 0.40 0.63Kiribati 0.88 1.38 Bulgaria 0.59 0.94 Hong Kong 0.38 0.61Lebanon 0.86 1.36 Philippines 0.59 0.93 Isle of Man 0.38 0.60
St. Kitts and Nevis 0.84 1.32 Lithuania 0.58 0.92 Norway 0.34 0.54St. Vincent and The Grenadines 0.83 1.31 Gibraltar 0.58 0.91 Bolivia 0.33 0.53
Tuvalu 0.83 1.31 Korea of Republic 0.57 0.90 Poland 0.33 0.53Belize 0.82 1.30 Libya 0.56 0.89 Croatia 0.31 0.49
Barbados 0.82 1.29 France 0.53 0.84 Greece 0.26 0.42Cook Islands 0.82 1.29 Bahamas 0.52 0.81 China 0.18 0.28
Honduras 0.80 1.26 United Kingdom 0.51 0.80 Bermuda 0.17 0.26Vanuatu 0.77 1.22 Germany 0.50 0.79 Cayman Islands 0.11 0.18Ukraine 0.75 1.18

Sustainability 2016, 8, 390 12 of 17
The casualty rate and casualty index level values of flags that have been calculated usingEquation (5) are shown in Table 6. Flag states that have zero casualty are not shown in this table. Flagstates that suffered casualties during this period are listed according to the index level. According tothe risk level defined in Equation (8), these calculations show that Sierra Leone, the United Kingdom,Cambodia, Hong Kong, Togo, Moldova, and Tanzania have very high risk status.
Table 6. Casualty rate and index for 2012–2014.
Flag Casualty Rate Casualty Index Level
Sierra Leone 0.00119 3.54613United Kingdom 0.00114 3.3982
Cambodia 0.00104 3.1005Hong Kong 0.00095 2.85157
Togo 0.00094 2.81662Moldova 0.00082 2.44337Tanzania 0.00080 2.39153
Belize 0.00049 1.47653Bahamas 0.00049 1.46638
Netherlands 0.00048 1.4465Turkey 0.00047 1.39566
St. Vincent and The Grenadines 0.00043 1.27541Comoros 0.00042 1.25769Liberia 0.00039 1.16046
Italy 0.00037 1.10426Panama 0.00017 0.5027
Malta 0.00006 0.17972
The passing rate of flags are calculated using data of ships passing in the Strait region for theperiod 2012–2014. The flag states are listed by the value calculated using Equation (6) in Table 7. About108 different flag states passed through the Istanbul Strait during the period of 2012–2014. 24 of theseflag states have a passing percentage of 1% or more. They constitute 93% of all passing ships.
Table 7. Passing rate and passing index level per flag for 2012–2014.
Flag PassingRate
PassingIndex Level Flag Passing
RatePassing
Index Level
Turkey 0.2134 6.08 Tanzania 0.0178 0.51Malta 0.1184 3.37 Comoros 0.0169 0.48
Panama 0.0846 2.41 St. Vincent and The Grenadines 0.0167 0.48Russia 0.0694 1.98 Togo 0.0151 0.43Lıberia 0.0550 1.57 Singapore 0.0150 0.43
Marshall Islands 0.0391 1.11 Hong Kong 0.0149 0.43Moldova 0.0348 0.99 Netherlands 0.0147 0.42
Cambodia 0.0343 0.98 Bahamas 0.0145 0.41Belıze 0.0288 0.82 Saint Kitts and Nevis 0.0144 0.41
Antıgua and Barbuda 0.0231 0.66 Cook Islands 0.0126 0.36Ukraine 0.0205 0.58 Cyprus 0.0064 0.18Greece 0.0193 0.55 United Kingdom 0.0063 0.18
Italy 0.0193 0.55 Gibraltar 0.0050 0.14Sierra Leone 0.0180 0.51
Flags that have passing rates less than 0.005 are not shown in this table. Flags that have the highestpassing rate are Turkey, Malta, Panama, Russia, and Liberia. According to the risk level defined inEquation (9), Turkey has a very high risk status, Malta has high risk, and Panama has medium to highrisk, while Russia, Liberia, and Marshall Islands have medium risk status.

Sustainability 2016, 8, 390 13 of 17
5.3.2. Results of the Risk Level of Flag States
The risk level of flags passing the Istanbul Strait was determined using Equation (1). Each flagwas given points according to the index level shown in Tables 4–7. The total points of flags, whichdetermines the risk level of flag states passing through the Istanbul Strait, are shown in Table 8.With respect to the risk level given in Table 2, flags are listed as having a high risk, or standard riskin Table 8.
Table 8. Risk level of each flag state passing through the Istanbul Strait 2012–2014.
High Risk Level Standard Risk Level
Flag Total Point Flag Total Point Flag Total Point
Tanzania 6 Comoros 3 Algeria 1Moldova * 5 St. Vincent & The Grenadines 3 Bahamas 1
Togo 5 Barbados 2 Bangladesh 1Cambodia 4 Belize 2 Dominica 1Georgia 4 Cook Islands 2 Egypt 1
Sierra Leone 4 Denmark 2 Honduras 1Turkey 4 Hong Kong 2 Isle Of Man 1
Lebanon 2 Italy 1Liberia 2 Kiribati 1Malta 2 Netherlands 1
Panama 2 Switzerland 1Russia 2 Syria 1
St. Kitts and Nevis 2 Tuvalu 1Ukraine 2 Curacao 1
United Kingdom 2 Marshall Islands 1Vanuatu 2
* Italics denotes FOCs.
Table 9 shows flag states that have zero total points. These flags have been grouped as low risklevel. FOCs have been marked with italics in these tables.
Table 9. Low-risk leveled flag states passing through the Istanbul Strait 2012–2014.
Low Risk Flag States
Antigua & Barbuda Philippines MongoliaGreece France Qatar
Singapore Germany TunisiaCyprus Bermuda Albania
Gibraltar India VietnamBulgaria Korea of Republic IsraelNorway Bolivia AzerbaijanChina Luxembourg Estonia
Netherlands Antilles Thailand PakistanLithuania Libya SwedenPortugal USA FinlandCroatia Irish Republic Poland
Cayman Islands Romania SpainPalau Ethiopia Latvia
Belgium Jamaica 1 Others1 Others: Flags having the total number of ships passing less than 10.
6. Discussion
The percentage of inspections with deficiencies in the Black Sea MOU is over 60% and thedetention rate has decreased since 2010. According to the BGW lists generated, a decrease can beseen in the flag states risk level from the years 2004 to 2014. The risk level of black-listed flags hasshown a declining trend from 2009, except for Tanzania and Bolivia. This result indicates that PCS
Sustainability 2016, 8, 390 14 of 17
inspections have been effective in decreasing the risk in the Black Sea Region. The Comoros, SierraLeone, Cambodia, and Saint Kitts and Nevis have moved from the black list to the grey list over time,and Panama has moved to the white list. Additionally, some flags, such as the DPR of Korea, Bolivia,Dominica, Syria, Mongolia, India, and Azerbaijan have been removed from the BGW lists over time,because the number of inspection is lower than 30 in the previous three-year period related to thenumber of ships visiting the Black Sea region seaports. However, this does not mean that these flagshave no risk.
Moreover the BGW lists show that there was an overall improvement in the performance of FOCsfrom 2004 to 2014. In particular, the number of DPR of Korea-flagged ships, which had the highestvalue of excess factor in the black list from 2004 to 2009, have decreased significantly.
According to the 2014 BGW list, while some FOCs such as Cambodia, the Comoros, Vanuatu,Barbados, Lebanon, and St. Vincent and the Grenadines, are in the grey list, and Georgia and Moldovaare in the black list. Some others, such as Liberia, Malta, and Panama, which have the highest passingpercentage, are in the white list. This demonstrates that there are differences among the performancesof FOCs. This finding complies with the findings of Alderton and Winchester, Li and Wonham, andPiniella et al.
Some flags such as Algeria, Bangladesh, Dominica, Egypt, Honduras, Kiribati, Switzerland, Syriaand Tuvalu have not been included in the 2014 BGW list, because they have not had 30 or moreinspections. However, this does not show that these flags are not at risk, these flag states have a highrisk status according to the deficiency index.
Flag states’ performances in the 2014 BGW list are, in general, similar to those in the Paris MOU.Tanzania, Georgia, Moldova, and Togo are black-listed flags in the BGW list of the Black Sea MOU.Tanzania, Moldova, and Togo are also in the black list on the Paris MOU and Tanzania has the highestrisk in both the Black Sea MOU and the Paris MOU. However, there are more flag states in the blacklist of the Paris MOU than the Black Sea MOU. While Sierra Leone, Cambodia, St. Vincent andthe Grenadines, the Comoros, and the Cook Islands are grey-listed flags in Black Sea MOU, theyare black-listed flags in the Paris MOU. Additionally, a surprising result is that Belize, which is awhite-listed flag in the Black Sea MOU and Dominica, which is not listed in the Black Sea MOU, arefound on the black list of the Paris MOU, and Georgia which is a black-listed flag in the Black SeaMOU is not listed in the Paris MOU.
Flag states’ performances in the 2014 black list of the Black Sea MOU differ from those in theTokyo MOU significantly, but with the exception of Tanzania. Togo is in the grey list on the TokyoMOU, and Moldova and Georgia are not listed on the Tokyo MOU. There are 12 flag states in the blacklist of the Tokyo MOU. Most of these flag states are not listed in the Black Sea MOU due to the fact thatthe number of inspected ships was lower than 30. While Sierra Leone and Cambodia are black-listedflags in the Tokyo MOU, they are grey-listed flags in the Black Sea MOU. Moreover, Belize, one ofblack-listed flags in the Tokyo MOU is in the white list of the Black Sea MOU.
According to the flag state Risk Level of ships passing through the Istanbul Strait, Tanzania,Moldova, Togo, Cambodia, Georgia, Sierra Leone, and Turkey are classified as having high-risk flags.Tanzania, Moldova, Togo, and Georgia are already in the black list. Despite Cambodia and SierraLeone being in the grey list, they are classified as having a high risk level because they have very highcasualty index points. In the same way, despite the fact that Turkey is in the white list, it has a high risklevel because it has very high passing percentage points. About 108 different flag states have passedthrough the Istanbul Strait during this period. 24 of these flag states, which have a passing percentageof 1% or more, constitute 93% of all passing ships. 25% of them have a high risk level, 62.5% of themhave a standard risk level, and 12.5% have a low risk level. Another 84 flag states, which have apassing percentage below 1%, constitute 7% of all passing ships. Only one of these, Georgia, has a highrisk level. 19% of these flag states have a standard risk level. Algeria, Bangladesh, Dominica, Egypt,Honduras, Kiribati, Switzerland, Syria, and Tuvalu have been included in the ranking of standard riskbecause these flags have larger deficiency index scores.

Sustainability 2016, 8, 390 15 of 17
Additionally, it has become evident that the risk level of FOCs and national flags are notsignificantly different from each other in terms of evaluating high risk levels and standard risklevels. However, 16% of flag states with low-risk levels are FOCs. Eight of the top ten flag states in theranking of passing percentage are FOCs. However, it should be noted that these FOCs generally havea standard risk level, except for Cambodia and Moldova, which are classed as high risk.
Safety of navigation, lifesaving appliances, and fire safety measures were the top deficiencycategories in the Black Sea MOU during the period of 2012–2014. Research indicates that most of thecasualties in the Strait region occurred due to navigational factors, such as collision or grounding inthis period.
7. Conclusions
This study evaluates the risks arising from maritime transportation in the Istanbul Straitdepending on the flag states of passing ships. The performance of these flags in the Black SeaMOU are a very important indicator because it directly demonstrates their risk level.
According to the Black Sea BGW lists, a decrease can be seen in the flag states risk level from theyears 2004 to 2014. PCS inspections seem to be effective in decreasing the risk level in the Black SeaRegion. There appears to be a similarity between the risk levels of flag states on the Black Sea MOUand the Paris MOU.
According to the flag state risk level of ships passing through the Istanbul Strait, Tanzania,Moldova, Togo, Cambodia, Georgia, Sierra Leone, and Turkey are classified as having high-risk flags.The risk level of FOCs and national flags are not significantly different from each other. About 25% offlag states constitute 93% of all passing ships have a high risk level, 62.5% of them have a standardrisk level.
Sustainable inspection mechanisms on the Black Sea MOU will ensure the removal of substandardships from the region’s seas over time and improve safety at sea. A New Black Sea Inspection Regime,with a risk-based targeting and inspection system is to be introduced from 1 January 2016 by the BlackSea MOU Committee. It is believed that the new inspection system will improve navigation safety inthe Black Sea region and decrease risks in the Strait region arising from maritime transportation morethan ever.
Acknowledgments: Author thanks two anonymous referees for their valuable comments.
Conflicts of Interest: The authors declare no conflict of interest.
References
1. Chamber of Shipping, Istanbul & Marmara, Aegean, Mediterranean and Black Sea Region, Maritime SectorReports. Available online: http://www.denizticaretodasi.org.tr/en-en/pages/Sector-Report.aspx (accessedon 12 May 2011).
2. Class, N.K. Istanbul, the World’s Capital City. Available online: https://www.google.com/url?sa=t&rct=j&q=&esrc=s&source=web&cd=2&ved=0ahUKEwiFi-qrkZzMAhWG8ywKHfrzBywQFggkMAE&url=https%3a%2f%2fwww.classnk.or.jp%2fhp%2fpdf%2fpublications%2fPublications_image%2fclassnk_magazine_no60.pdf&usg=AFQjCNEXY5mIXM98ELvPRoP-6jUk3UyyVw&sig2=yh2k_Kt4-sfmBvkpDglgfw&bvm=bv.119745492,d.bGg&cad=rja (accessed on 1 March 2016).
3. Ulusçu, Ö.S.; Özbas, B.; Altıok, T.; Ilhan, O.; Özhan, A.A. Risk Analysis of the Vessel Traffic in the Strait ofIstanbul. Risk Anal. 2009, 29, 1454–1471. [CrossRef] [PubMed]
4. ITOPF, the Independenta Accident. Available online: http://www.itopf.com/in-action/case-studies/case-study/independenta-boshporus-turkey-1979 (accessed on 1 March 2016).
5. Graham, N.A.; Graham, A.K. Implementing and Enforcing Regional Environmental Policies inComparative Perspective. Available online: http://ceres.isp.msu.edu/occasionalpapers/EnvironmentalChallengesPolicyREV.pdf (accessed on 1 March 2016).
6. ITOPF, Recovery of Sunken Oil in the Sea of Marmara. Available online: http://www.itopf.com/fileadmin/data/Documents/Papers/recovery.pdf (accessed on 1 March 2016).

Sustainability 2016, 8, 390 16 of 17
7. Republic of Turkey Ministry of Transport. Maritime Affairs and Communications, Marine Causalities andIncident Statistics. Available online: http://aakkm.udhb.gov.tr/ (accessed on 14 November 2015).
8. Kara, G. Evaluation of Turkish Straits Vessel Traffic Services (TSVTS) Applications in the Istanbul Strait. InProceedings of the International Conference on Engineering and Natural Sciences, Skopje, Macedonia, 15–19May 2015.
9. Özçayır, O.Z. Port State Control; LLP Professional Publishing: London, UK, 2001.10. Knapp, S.; Franses, P.H. Comprehensive Review of the Maritime Safety Regimes. Econ. Inst. Res. Pap. 2007,
30, 241–270.11. Sılos, J.M.; Piniella, F.; Monedero, J.; Walliser, J. The Role of the Classification Societies in the Era of
Globalization: A Case Study. Marit. Policy Manag. 2013, 40, 384–400. [CrossRef]12. Li, K.X.; Zheng, H. Enforcement of Law by the Port State Control (PSC). Marit. Policy Manag. 2008, 35, 61–71.
[CrossRef]13. Cariou, P.; Mejia, M.Q., Jr.; Wolf, F.-C. An Econometric analysis of deficiencies noted in port state control
inspections. Marit. Policy Manag. 2007, 34, 243–258. [CrossRef]14. Heij, C.; Bijwaard, G.E.; Knapp, S. Ship Inspections Strategies: Effects on maritime Safety and environmental
protection. Transp. Res. D 2011, 16, 42–48. [CrossRef]15. Emecen Kara, E.G.; Oksas, O. Evaluation of Maritime Safety in Istanbul Strait using Port State Control
Inspections. In Proceedings of the International Conference on Engineering and Natural Sciences (ICENS),Skopje, Macedonia, 15 May–19 June 2015.
16. Emecen, E.G.; Yıldız, M. Limanlarımızda Liman Devleti Kontrolü Uygulamaları. In Türkiye’nin Kıyı ve DenizAlanları VI; Ulusal Konferans: Mugla, Turkey; 7–11 November 2006.
17. Emecen, E.G.; Karaoglu, M. Liman Devleti Kontrolü Incelemeleri ve Risk Degerlendirmesi. In Türkiye’ninKıyı ve Deniz Alanları VIII; Ulusal Konferansı: Ankara, Turkey; 27–30 May 2008.
18. Xu, R.-F.; Lu, Q.; Li, W.-J.; Li, K.X.; Zheng, H.-S. A Risk Assessment System for Improving Port State ControlInspection. In Proceedings of the Sixth International Conference on Machine Learning and Cybernetics,Hong Kong, 19–22 August 2007.
19. Bang, H.-S.; Jang, D.-J. Recent Developments in Regional Memorandums of Understanding on Port StateControl. Ocean Dev. Int. Law 2012, 43, 170–187. [CrossRef]
20. Bang, H.-S. Is Port State Control an Effective Means to Combat Vessel-Source Pollution? An Empirical Surveyof the Practical Exercise by Port States of Their Powers of Control. Int. J. Mar. Coast. Law 2008, 23, 715–759.[CrossRef]
21. Payoyo, P.B. Implementation of International Conventions through Port State Control: An assessment.Mar. Policy 1994, 18, 379–392. [CrossRef]
22. Cariou, P.; Mejia, M.Q., Jr.; Wolf, F.-C. On the Effectiveness of port state control inspections. Transp. Res. E2008, 44, 491–503. [CrossRef]
23. Knapp, S.; Franses, P.H. Econometric analysis to differentiate effects of various ship safety inspections. Mar.Policy 2008, 32, 653–662. [CrossRef]
24. Li, K.X.; Wonham, J. Who is safe and who is at risk: A study of 20-years record on accident total loss indifferent flags. Marit. Policy Manag. 1999, 26, 137–144. [CrossRef]
25. Alderton, T.; Winchester, N. Flag States and Safety: 1997–1999. Marit. Policy Manag. 2002, 29, 151–162.[CrossRef]
26. Li, K.X. The safety and quality of open registers and a new approach for classifying risky ships. Transp. Res.E 1999, 35, 135–143. [CrossRef]
27. Knapp, S.; Franses, P.H. Econometric analysis on the effect of port state control Inspection on the probabilityof casualty Can targeting of substandard ships for inspections be improved? Mar. Policy 2007, 31, 550–563.[CrossRef]
28. Roberts, S.E.; Marlow, P.B. Causalities in dry bulk shipping (1963–1996). Mar. Policy 2002, 26, 437–450.[CrossRef]
29. Piniella, F.; Rasero, J.C.; Aragones, J. Maritime Safety Control Instruments in the Era of The Globalization.J. Mar. Res. 2005, 2, 19–39.
30. Degre, T. From Black-Grey-White Detention-based Lists of Flags to Black-Grey-White Casualty-based Listsof Catogories of Vessel. J. Navig. 2008, 61, 485–497. [CrossRef]

Sustainability 2016, 8, 390 17 of 17
31. Aydogdu, V.; Park, J.-S.; Keçeli, Y.; Park, Y.-S. Analysis of Marine Traffic Feature for Safety Assessment atSouthern Entrance of the Istanbul Strait-I. J. Korean Navig. Port Res. 2008, 32, 521–527. [CrossRef]
32. Arslan, Ö.; Turan, O. Analytical Investigation of Marine Causalities at the Strait of Istanbul with SWOT-AHPmethod. Marit. Policy Manag. 2009, 36, 131–145. [CrossRef]
33. Or, I.; Kahraman, I. A Simulation study of the accident risk in the Istanbul Channel. Int. J. Emerg. Manag.2002, 1, 110–124. [CrossRef]
34. Republic of Turkey Ministry of Transport. Maritime Affairs and Communications, Ship Passing Statistics.Available online: http://atlantis.udhb.gov.tr/ (accessed on 14 November 2015).
35. Tokyo MOU. Available online: http://www.tokyo-mou.org/ (accessed on 3 January 2016).36. Paris MOU. Available online: https://www.parismou.org/files/ (accessed on 27 October 2015).37. Black Sea MOU. Available online: http://www.bsmou.org/about/ (accessed on 11 November 2015).38. Paris MOU. Explanatory Note-White, Gray and Black List. Available online: https://www.parismou.org/
files/Explanatory%20Notes%20Annual_0.pdf (accessed on 27 October 2015).39. Black Sea MOU. Annual Reports. Available online: http://www.bsmou.org/ (accessed on 5 October 2015).
© 2016 by the author; licensee MDPI, Basel, Switzerland. This article is an open accessarticle distributed under the terms and conditions of the Creative Commons Attribution(CC-BY) license (http://creativecommons.org/licenses/by/4.0/).