RISK ASSESSMENT FOR OCCUPATIONAL EXPOSURE … · CLINICAL CHEMISTRY SECTION, ... 5.2 In-plant...
39
Pure Appl. Chem., Vol. 73, No. 6, pp. 993–1031, 2001. © 2001 IUPAC 993 INTERNATIONAL UNION OF PURE AND APPLIED CHEMISTRY CHEMISTRY AND HUMAN HEALTH DIVISION CLINICAL CHEMISTRY SECTION, COMMISSION ON TOXICOLOGY* RISK ASSESSMENT FOR OCCUPATIONAL EXPOSURE TO CHEMICALS. A REVIEW OF CURRENT METHODOLOGY (IUPAC Technical Report) Prepared for publication by ROBERT F. M. HERBER 1 , JOHN H. DUFFUS 2,† , JYTTE MOLIN CHRISTENSEN 3 , ERIK OLSEN 3 , AND MILTON V. PARK 2 1 Coronel Institute for Occupational and Environmental Health, Academic Medical Center, University of Amsterdam, P.O. Box 22700, NL1100 DE Amsterdam, The Netherlands; 2 The Edinburgh Centre for Toxicology, 43 Mansionhouse Road, Edinburgh EH9 2JD, United Kingdom; 3 National Institute of Occupational Health, Lerso Parkalle 105, DK-2 100, Copenhagen, Denmark *Membership of the Commission during the preparation of this report (1995–2001) was as follows: Chair: J. H. Duffus (UK, 1997–2001); R. Cornelis (Belgium, 1995–1997); Secretary: D. M. Templeton (Canada, 1999–2001), B. Heinzow (Germany, 1995–1999); Titular Members: J. M. Christensen (Denmark, 1995–1999); R. Heinrich–Ramm (Germany 1997–2001); R. F. M. Herber (Netherlands, 1995–1997); M. Jakubowski (Poland, 1995–1997); R. P. Nolan (USA, 1997–2001); M. Nordberg (Sweden, 1999–2001); E. Olsen (Denmark, 1999–2001); D. M. Templeton (Canada, 1995–1999), Associate Members: I. Desi (Hungary, 1996–2001); O. Hertel (Denmark, 1999–2001); A. Lamberty (Belgium, 1995–1997); J. K. Ludwicki (Poland, 1997–2001); L. Nagymajenyi (Hungary, 1999–2001); D. Rutherford (Australia, 1995–1999); E. Sabbioni (Italy, 1996–2001); P. A. Schulte (USA, 1996–1999); K. T. Suzuki (Japan, 1997–2001); W. A. Temple (New Zealand, 1996–2001); M. Vahter (Sweden, 1995–1999); National Representatives: Z. Bardodej (Czech Republic, 1996–1999); W. King (Ireland, 1995–1997); J. Park (Korea, 1998–1999); F. J. R. Paumgartten (Brazil, 1996–2000); I. S. Pratt (Ireland, 1999–2001); V. Ravindranath (India, 1996–2001); M. Repetto Jimenez (Spain, 1995–1999); Z. Imra (Turkey, 1995–1997); Representative of IUTOX: C. Schlatter (Switzerland); Representative of IUPHAR: C. D. Klaasen (USA). † Corresponding author Republication or reproduction of this report or its storage and/or dissemination by electronic means is permitted without the need for formal IUPAC permission on condition that an acknowledgment, with full reference to the source along with use of the copyright symbol ©, the name IUPAC, and the year of publication, are prominently visible. Publication of a translation into another language is subject to the additional condition of prior approval from the relevant IUPAC National Adhering Organization.
Transcript of RISK ASSESSMENT FOR OCCUPATIONAL EXPOSURE … · CLINICAL CHEMISTRY SECTION, ... 5.2 In-plant...

Pure Appl. Chem., Vol. 73, No. 6, pp. 993–1031, 2001.© 2001 IUPAC
993
INTERNATIONAL UNION OF PURE AND APPLIED CHEMISTRY
CHEMISTRY AND HUMAN HEALTH DIVISIONCLINICAL CHEMISTRY SECTION, COMMISSION ON TOXICOLOGY*
RISK ASSESSMENT FOR OCCUPATIONAL EXPOSURE TO CHEMICALS.
A REVIEW OF CURRENT METHODOLOGY
(IUPAC Technical Report)
Prepared for publication byROBERT F. M. HERBER1, JOHN H. DUFFUS2,†, JYTTE MOLIN CHRISTENSEN3,
ERIK OLSEN3, AND MILTON V. PARK2
1Coronel Institute for Occupational and Environmental Health, Academic Medical Center, Universityof Amsterdam, P.O. Box 22700, NL1100 DE Amsterdam, The Netherlands; 2The Edinburgh Centre for
Toxicology, 43 Mansionhouse Road, Edinburgh EH9 2JD, United Kingdom; 3National Institute ofOccupational Health, Lerso Parkalle 105, DK-2 100, Copenhagen, Denmark
*Membership of the Commission during the preparation of this report (1995–2001) was as follows:Chair: J. H. Duffus (UK, 1997–2001); R. Cornelis (Belgium, 1995–1997); Secretary: D. M. Templeton (Canada,1999–2001), B. Heinzow (Germany, 1995–1999); Titular Members: J. M. Christensen (Denmark, 1995–1999); R. Heinrich–Ramm (Germany 1997–2001); R. F. M. Herber (Netherlands, 1995–1997); M. Jakubowski (Poland,1995–1997); R. P. Nolan (USA, 1997–2001); M. Nordberg (Sweden, 1999–2001); E. Olsen (Denmark,1999–2001); D. M. Templeton (Canada, 1995–1999), Associate Members: I. Desi (Hungary, 1996–2001); O. Hertel (Denmark, 1999–2001); A. Lamberty (Belgium, 1995–1997); J. K. Ludwicki (Poland, 1997–2001); L. Nagymajenyi (Hungary, 1999–2001); D. Rutherford (Australia, 1995–1999); E. Sabbioni (Italy, 1996–2001); P. A. Schulte (USA, 1996–1999); K. T. Suzuki (Japan, 1997–2001); W. A. Temple (New Zealand, 1996–2001); M. Vahter (Sweden, 1995–1999); National Representatives: Z. Bardodej (Czech Republic, 1996–1999); W. King(Ireland, 1995–1997); J. Park (Korea, 1998–1999); F. J. R. Paumgartten (Brazil, 1996–2000); I. S. Pratt (Ireland,1999–2001); V. Ravindranath (India, 1996–2001); M. Repetto Jimenez (Spain, 1995–1999); Z. Imra (Turkey,1995–1997); Representative of IUTOX: C. Schlatter (Switzerland); Representative of IUPHAR: C. D. Klaasen(USA).
†Corresponding author
Republication or reproduction of this report or its storage and/or dissemination by electronic means is permitted without theneed for formal IUPAC permission on condition that an acknowledgment, with full reference to the source along with use of thecopyright symbol ©, the name IUPAC, and the year of publication, are prominently visible. Publication of a translation intoanother language is subject to the additional condition of prior approval from the relevant IUPAC National AdheringOrganization.
Risk assessment for occupational exposure to chemicals. A review of current methodology
(IUPAC Technical Report)
Abstract: This paper reviews the methodology available for risk assessment ofexposure to substances in the workplace. Assessment starts with the identificationand classification of hazard, which must be related to the dose–effect anddose–response information available for the hazards identified. Once the potentialfor exposure has been characterized, it should be quantified and compared with anestablished safe exposure level. The degree to which it exceeds that level is ameasure of the risk. Even if the assessed risk is regarded as acceptable, there is thepossibility that the situation will change with time, so it is important to monitorpotentially harmful exposures. Factors relevant to effective monitoring arereviewed. Addresses of Internet sites where further information may be obtainedare listed along with further reading.
CONTENTS
1. INTRODUCTION2. HAZARD
2.1 Identification of hazard2.2 Nature of hazards to health2.3 Hazard classification of chemicals2.4 Sources of hazard information
3. DOSE–EFFECT AND DOSE–RESPONSE RELATIONSHIPS3.1 Introduction3.2 Threshold and nonthreshold effects—general considerations3.3 Threshold effects in occupational exposure
4. EXPOSURE AT THE WORKPLACE4.1 Physical processes4.2 Chemical processes4.3 The workplace4.4 Workers’ behavior4.5 Exposure assessment
5. MEASUREMENT OF EXPOSURE5.1 Introduction5.2 In-plant emissions5.3 Input concentrations5.4 Output concentrations
6. MONITORING OF EXPOSURE FOR OCCUPATIONAL HYGIENE6.1 Monitoring by continuous sampling6.2 Monitoring by discrete sampling6.3 Monitoring by diffuse sampling6.4 Gases with a low vapor pressure, evaporating liquids, subliming and melting solids6.5 Mists
R. F. M. HERBER et al.
© 2001 IUPAC, Pure and Applied Chemistry 73, 993–1031
994

6.6 Aerosols, particles, and/or dusts6.7 Environmental monitoring or ambient monitoring6.8 Dose (internal exposure)—biomarkers
7. RISK ASSESSMENT—GENERAL PRINCIPLES7.1 Analytical quality in relation to risk assessment7.2 Semiquantitative characterization of risk from chemicals
8. OCCUPATIONAL DISEASES9. CONCLUSIONS
10. ACKNOWLEDGMENTS11. GLOSSARY OF TERMS USED IN THIS REVIEW12. ABBREVIATIONS AND ACRONYMS13. INTERNET SITES RELATED TO OCCUPATIONAL HYGIENE AND HEALTHREFERENCESFURTHER READING
1. INTRODUCTION
In industry, new materials and processes are continually being introduced. Examples of new inorganicmaterials are carbides, nitrides, borides, and silicides in the semiconductor and optical industry.Examples of new organic materials include fibers such as para-aramid (Kevlar®, Twaron®), and carbonfibers. An example of a new process is the cutting and welding of materials with industrial lasers.Cutting with industrial lasers permits the processing of such complicated materials as aluminum sheets,glued with glass fibers and plastics. It is clear that the processing of these new materials may involveexposure to new substances in unknown amounts.
Often, substances previously thought to be inert or harmless to humans have been found to be car-cinogenic (e.g., asbestos and vinyl chloride monomer) or toxic to the reproductive process (e.g., methylmercury and thalidomide). An increasing number of substances have been shown to bemutagenic or carcinogenic in animal studies.
In the face of our limited knowledge of the hazards to humans associated with potential exposureto the substances in use, most governments in the developed countries of the world have introduced leg-islation aimed at protecting both the working population and the general population. This has usuallyrequired the management of enterprises to eliminate, or at least to minimize, risks to workers and to thegeneral population associated with work. Management is now required to carry out risk assessment forall industrial activities. This report reviews the approaches to risk assessment appropriate to the work-place environment in the context of currently accepted risk assessment models. Section 11 contains aglossary of the terminology used.
2. HAZARD
Hazard is the potential of any substance or situation to cause harm. This section reviews approaches tothe assessment of hazard. This is the first stage of risk assessment.
2.1 Identification of hazard
The first step is the identification of the substances or processes in the workplace that might have anadverse effect on those who may be exposed to them. Any process involving potential exposure to haz-ardous substances may cause harm as a result of intake of the substances into the body, by inhalationthrough the respiratory tract, by ingestion, or through the skin. Intake by injection and swallowing mayoccur accidentally.
© 2001 IUPAC, Pure and Applied Chemistry 73, 993–1031
Risk assessment for occupational exposure to chemicals 995

Normally, when carrying out a risk assessment of an enterprise one would divide its total workinto its individual activities and assess each work activity separately. Consideration would also have tobe given to activities such as maintenance, the removal of hazardous wastes, and to staff who may onlyoccasionally be in the working area.
With established commercial substances there may be an extensive database of both their physico-chemical and their toxicological properties, the latter arising from studies on animals and case reportson humans, and often from epidemiological studies. This information is used to classify substances andpreparations according to possible effect and potency. Such classification is an important source ofinformation and is found on product labels and data sheets.
Identification of hazards starts with a list of substances, processes, and circumstances that may bedangerous to the health of workers. With new or unusual substances, or processes, hazard informationmay not be readily available. Potential danger may have to be assessed by a variety of methods, includ-ing surveys of the scientific literature, observation, experiment, and deduction based on physicochemi-cal properties and structure–activity relationships.
2.2 Nature of hazards to health
Health effects following exposure to chemicals can be conveniently divided into the following groups:
• acute or chronic effects• local or systemic effects• reversible or irreversible effects
Acute or chronic effectsAn acute effect is one that occurs after a single exposure (or after a very few repeated exposures); anexample is the effect on the lungs caused by short exposure to high concentrations of cadmium fumesduring processing. In contrast, a chronic effect will only be observed following repeated exposure to asubstance over a long period of time. Examples are hard metal disease, following exposure to carbidesof tungsten and metallic cobalt dust over a period of months or years, and nickel allergy. A complicat-ing factor might be latency, the time period which must elapse after exposure before an effect appears.This time period may be very long; for example, more than 15 years may pass before a bronchial can-cer appears following exposure to asbestos.
Local or systemic effectsA local effect occurs at the point of contact between the substance and the body. An example might bethe effect of a corrosive substance, such as strong mineral acid splashed on the skin. In systemic effects,the action of the substance takes place at a point remote from where it entered the body. An example isthe damage to the kidney by cadmium compounds following their ingestion.
Reversible or irreversible effectsIn reversible effects, the affected tissue recovers and returns to normal when the exposure ceases.Examples are carbon monoxide inhibition of oxygen uptake, or the inhibitory effect of low doses oflead on haem synthesis. Where the effect of exposure to a chemical is irreversible, as in cancer, recov-ery does not take place once exposure ceases. Both acute and chronic effects may be local or systemicand may be reversible or irreversible. For example, skin irritation caused by contact exposure is usu-ally an acute, local, reversible effect (an exception is chloracne associated with exposure to poly-chloro- or polybromobiphenyls and dioxins), whereas liver cancer is chronic, systemic, and irre-versible. With some toxic effects, it can be difficult to decide which of these categories apply; forexample, where there is a preliminary sensitization following chronic exposure, which results in a lateracute effect.
Much of the evidence for the harmful effects of substances is based on animal studies in whichrats and mice have been exposed to high doses, mainly given by the oral route or by intravenous
R. F. M. HERBER et al.
© 2001 IUPAC, Pure and Applied Chemistry 73, 993–1031
996

injection. By contrast, occupational exposure to substances is much more likely to be by the respira-tory tract and by secondary ingestion, with considerably lower doses than in the animal studies. Thereare, therefore, a number of imponderables in extrapolating data based on studies of the ingestion byrodents of high doses, which may show a dose-dependent metabolism, to the human situation, wherethe doses are often much lower and absorbed by a different route. This is of particular relevance topotential carcinogens, the nature of their metabolites and their proportions being entirely dependenton the magnitude of the dose. Consequently, such studies may give rise to results that are difficult tointerpret.
2.3 Hazard classification of chemicals
In many countries, manufacturers, suppliers and importers of substances are responsible for classifyingand labeling the substances they supply and for providing further information about them in the formof Chemical Safety Data Sheets. This is to ensure that the toxicological and physicochemical proper-ties that make a substance dangerous have been identified and publicized to the user.
In the European Union system of classification [1], the package labeling carries hazard informa-tion comprising “indications of danger” (given below) and symbols along with “risk” numbers, to iden-tify the particular hazards associated with the substance, and “safety” numbers, giving advice on theirhandling. The information describing adverse biological effects of a particular substance allows it to beallocated to one of the following categories:
• very toxic (by ingestion, inhalation, or skin contact)• toxic (by ingestion, inhalation, or skin contact)• harmful (by ingestion, inhalation, or skin contact)• corrosive (to skin)• irritant (to respiratory tract, skin, or eyes)
The category and nature of the adverse biological effect is indicated by the hazard symbol and bythe risk number(s) in respect of toxicological effects including the following: acute lethal; nonlethalirreversible effects after a single exposure; severe effects after repeated or prolonged exposure; corro-sive; irritant; sensitizing; carcinogenic, mutagenic, and toxic effects for reproduction, and effects dan-gerous to the environment.
2.4 Sources of hazard information
It is important that hazard information used in an assessment is reliable and current. For commerciallyavailable substances, the principal sources are:
• product labels• Chemical Safety Data Sheets supplied by the manufacturer or supplier• information from governmental and trade associations• Internet sites (examples of Internet sites are shown in Section 13)• specialty handbooks (see reference list)
Normally, when dealing with well-known substances, the Safety Data Sheets produced by manu-facturers should permit assessment of the hazard. Unfortunately, information on these data sheets is notalways reliable [2]. For recently introduced commercial substances, similar information will be avail-able as a result of the requirement in many countries for notification of a “base set” dossier of toxico-logical and other data. However, it should be noted that for most substances not recently introduced, thetoxicological data are inadequate and intelligent deduction is the only substitute. Also, when dealingwith processes, it will sometimes be completely unclear which substances are formed during the
© 2001 IUPAC, Pure and Applied Chemistry 73, 993–1031
Risk assessment for occupational exposure to chemicals 997

process. In this case, only measurements will give an insight into the hazards (see Section 5“Measurement of Exposure”).
3. DOSE–EFFECT AND DOSE–RESPONSE RELATIONSHIPS
3.1 Introduction
Effects may appear on a number of organs and systems of the human body. Once a substance hasentered the body, its distribution depends on its chemical and physical properties. Bioavailability doesnot necessary imply toxicity. However, toxicity does not occur without bioavailability. It should benoted, however, that physiological responses such as dermal irritation or surface membrane modifica-tions can occur without actual assimilation [3]. It should also be noted that the physicochemical prop-erties of a substance not only influence its bioavailability but also its effect.
In general, protection from toxic effects depends upon maintaining exposures below some estab-lished “safe” level. The vast majority of occupational limits are in terms of external exposures, i.e., theamount or concentration of the substance available at the exchange boundaries (lungs, skin) during aspecified time period. Internal exposure is rarely used because this can be measured only by invasivemethods requiring, for example, obtaining blood samples.
3.2 Threshold and nonthreshold effects—general considerations
The adverse effects of a chemical on an organism can be divided into two types. Firstly, there areadverse effects that occur only after a threshold dose has been reached. Exposures associated with dosesbelow the threshold are, therefore, harmless. Substances having a threshold dose for a given effect aremetabolized and/or excreted before any harm is done. However, in any individual, increasing dosesabove the threshold level will result in increasingly severe effects (Fig. 1). Secondly, there are adverseeffects which it is thought may occur at any dose; for such effects there is no harmless dose and nothreshold dose. For this second group, increasing dose increases the probability of the effect occurring.Hence, such effects are referred to as stochastic effects. An example of such an effect is benz[a]pyrene-induced cancer.
R. F. M. HERBER et al.
© 2001 IUPAC, Pure and Applied Chemistry 73, 993–1031
998
Fig. 1 Progressive changes occurring when an organism is challenged with increasing doses of a potentially toxicsubstance.

3.3 Threshold effects in occupational exposure
In assessing an acceptable level of a particular substance in the workplace, the procedure usually startsfrom an experimental database of animal or (preferably) human data (e.g., from epidemiological stud-ies) giving a no-observed-adverse-effect level (NOAEL) or a lowest-observed-adverse-effect level(LOAEL) to derive an occupational exposure limit (OEL) at a lower exposure value which compensatesfor the uncertainties in the data. Comparison of this exposure limit with a measured or estimated expo-sure level is then used to judge whether the situation is satisfactory or whether risk management meas-ures are required. In practice, in workplace situations a subjective safety factor in the range 10–100 ofthe NOAEL or LOAEL to the limit is used for most substances where the database is from animal stud-ies, and of about 10 when the data are from human studies. It is mostly difficult to establish LOAELsin occupational epidemiology because of the many variables in exposure levels in time, exposureentries, toxicokinetics, and toxicodynamics.
An alternative to the NOAEL/LOAEL approach is the benchmark dose method [4,5], original-ly applied to developmental toxicity. In this procedure, the dose–response curve is fitted to the exper-imental data in the range of experimental observation by appropriate curve-fitting modeling. Usingthe upper 95% confidence limit on the estimated curve, the dose corresponding to a risk at a pre-specified risk level, say x%, the lower effective dose (LEDx), with x lying between 1 and 10%, isdetermined. This has been referred to as the “benchmark dose” (BMD). Typically, a 10% risk levelmight be used. The benchmark dose would then be the lower 95% confidence limit on the effectivedose associated with an excess risk of 10% (LED10). This value can be used as an alternative to theNOAEL for calculation of the reference dose (RfD) or acceptable daily intake (ADI) by dividing bya safety factor >1, e.g., RfD = LED10/F.
This safety factor is intended to account for such uncertainties as the potentially higher sensitiv-ity of humans to the toxicant as compared with animals, variation in sensitivity among individuals, anddifferent exposure conditions. If a linear relation is assumed between the origin and the point corre-sponding to LED10 on the upper confidence limit of the estimated curve, at a dose of LED10/F, theunknown risk in the low dose region is expected to be less than 0.1/F, since the true dose–response curveis more likely to be concave than linear [5].
The benchmark dose method has some obvious advantages over the NOAEL approach. Ratherthan focusing on a single test dose, as with the NOAEL, it uses data from all dose levels employed. Itis also less sensitive to the choice of dose levels than the NOAEL and includes some measure of vari-ability in the confidence limits used. However, its adoption generally is still a subject of discussion, andit has not been used to date in the derivation of occupational exposure limits.
Occupational exposure limits in airOne of the earliest moves toward an assessment of quantitative criteria with which to judge the accept-ability of measured exposure levels was the development of threshold limit values (TLV) in the 1940sby the American Conference of Governmental Industrial Hygienists (ACGIH), a nongovernmentalorganization [6]. TLVs are based solely on health considerations and have the status of guidelines; theyare not legally binding unless adopted by a regulatory agency. The TLV concept has developed over theyears and is now present in the legislation of most developed countries.
In the United States, there is the National Institute for Occupational Safety and Health(NIOSH)/Occupational Safety and Health Administration (OSHA) system of permissible exposure lim-its (PEL) originally based on the ACGIH TLV values. OSHA is responsible for promulgating andenforcing these limits. In Germany, there are maximale arbeitsplatzkonzentrationen (MAK, maximumconcentration values in the workplace) and technische richtkonzentrationen (TRK, technical exposurelimits). In the Netherlands, there is a Nationale MAC-lijst (maximaal aanvaarde concentratie). TheUnited Kingdom has a system based on the occupational exposure standard (OES) and the maximumexposure limit (MEL). The European Union is developing a system based on the occupational exposurelimit (OEL), which will apply to the whole Union. It should be kept in mind that although all standards,
© 2001 IUPAC, Pure and Applied Chemistry 73, 993–1031
Risk assessment for occupational exposure to chemicals 999

TLVs, acceptable levels, etc. are based on scientific studies, the decision as to whether a certain level isacceptable is not scientific and is taken by national governments or international bodies after consider-ing the views of management, unions, and the general public.
Biological limit valuesIdeally, a biological limit value, the maximum concentration of a chemical, and/or its compounds,which can be accepted as harmless in a biological sample from an exposed person, should be deter-mined from knowledge of the relationship between dose and effect for these substances. WHO hasworked out biological limit values for lead, cadmium, and mercury on this basis. Unfortunately, thereare very few biological limiting values based on dose–effect relationships, because of the great amountof work required to establish them.
R. F. M. HERBER et al.
© 2001 IUPAC, Pure and Applied Chemistry 73, 993–1031
1000
Table 1 Biological limit values [6,7].
Biological monitoring Sampling ACGIH BEI DFG BAT DFG EKAtime
AcetoneAcetone in urine ES 100 mg/L 80 mg/L
AluminumAluminum in urine ES 200 µg/L
ArsenicInorganic arsenic metabolites in urine ES, EW 50 µg/g creat. 130 µg/L
BenzenePhenyl mercapturic acid in urine ES 25 µg/g creat. 45 µg/g creat.Muconic acid in urine ES 2 mg/LBenzene in blood DS 5 µg/L
LeadLead in blood NC 300 µg/L 700 µg/LLead in blood1 NC 300 µg/Lδ-aminolevulinic acid in urine NC 15 mg/L
FluorideFluoride in urine PS 3 mg/g creat. 4 mg/g creat.Fluoride in urine ES 10 mg/g creat. 7 mg/g creat.
CadmiumCadmium in urine NC 5 µg/g creat. 15 µg/LCadmium in blood NC 5 µg/L 15 µg/L
Cobalt Cobalt in urine ES,EW 15 µg/L 60 µg/LCobalt in blood EW 1 µg/L 5 µg/L
Chromium (VI) solubleChromium in urine IDS 10 µg/g creat.Chromium in urine, total ES,EW 30 µg/g creat. 20 µg/g creat.
Carbon monoxideCarbon monoxide-Hb in blood ES 3.5% 5%
1women <45 years oldcreat. = creatinineDS = during shiftES = end of shiftEW = end of workweekIDS = increase during shiftNC = not criticalPS = preshift

In contrast, there are many statistically determined limiting values for substances in biologicalsamples, often set by correlating established exposure limit values in the atmosphere with concentra-tions in, for example, urine (Table 1). In the United States, biological exposure indices (BEI), whichare prepared by the ACGIH, are often used [6]. The BEI value is the concentration in blood, urine, orexhaled air, which can be expected in a worker who has worked at a moderate rate for 8 h while exposedto the relevant maximum limit for the substance in air. It should be stressed that BEI values indicate anexposure where no account is taken of health risks [6]. In Germany, biologische arbeitsstoff toleranzwerte (BAT), prepared by the Kommission zur Prufung Gesundheitsschadlicher Arbeitsstoffe, are used[7]. These values set limit values based on long-term studies of workers exposed for 8 h a day, 5 daysa week, not showing harmful effects to health over the period of the study. It is more complicated toderive biological limit values for chemicals absorbed through the skin from limit values in the air. Inthese cases, limit values set by measuring concentrations of metabolites in biological samples fromworkers have been related to good working practices. In Denmark, a limit for lead in blood of 200 µg/Lhas been set. Limiting values for other toxic substances will follow in an EU Directive, which containsrequirements for biological monitoring and sets biological limit values for some substances, mostlymetals. Technical and economic consequences have an influence on the level at which national biolog-ical limit values are set. BEI, BAT, and EU biological limit values, which are applied in several coun-tries, are therefore higher than the limit values proposed by WHO.
4. EXPOSURE AT THE WORKPLACE
4.1 Physical processes
Mechanical machine processing such as stirring, drilling, sawing. milling, but especially grating andcutting, produce particles which may include a significant fraction of dust that is respirable. This occurs,for example, in the mining and the metal construction industry. Every mechanical process where dustis formed must be considered to form a hazard. Stirring increases the surface area of a liquid, and thusa greater vaporization rate occurs. Spraying increases the surface area of a liquid more than stirring, andalso, vaporization is greater. Vaporization also increases when a liquid film is formed and the surfacearea increases.
Processes at high temperatures lead to exposure because substances are released into the air asvapors or fumes, e.g., from boiling metals (mercury vapor is released even at room temperature).Examples of such processes are the production of metals from ores by melting, roasting, and distilling,and the production of strings of plastic from bulk by pulling them out at high temperatures.
4.2 Chemical processes
Some chemical processes associated with exposure to potentially toxic substances are described below.Because of the enormous number of substances and processes used in industry, it is impossible to giveexamples from all branches.
During metal refining, high temperatures are necessary for the chemical reactions changing orig-inal inorganic compounds such as oxides and sulfides into the desired metal. Various metallic com-pounds of varying toxicity may be formed. An example is the production of nickel from the ores pent-landite or pyrrhotite. During the process, the highly toxic gaseous compound nickel carbonyl, Ni(CO)4,is formed, removing nickel from the ore and enabling it to be transferred to nickel pellets or plated ontoother materials.
Interaction of electromagnetic radiation with metals is another process leading to the release ofchanged metal compounds. An example of such a process is welding with arc and spark, plasma weld-ing and cutting, and laser drilling, cutting, and welding. Stainless steel welding is a process where, from
© 2001 IUPAC, Pure and Applied Chemistry 73, 993–1031
Risk assessment for occupational exposure to chemicals 1001

the original compounds, metallic chromium and nickel, more toxic and possibly carcinogenic chemicalspecies containing Cr(VI) and Ni(II) are formed following reactions with oxygen in the air.
In oils used to cool turners’ lathes during drilling, carcinogenic nitrosamines are formed afterreacting with nitrogen in the air.
Isocyanates enter the air during the production of polyurethane polymers, elastomers, coatingmaterials, lacquers, and glues. Isocyanates are associated with respiratory sensitization in exposedworkers.
4.3 The workplace
External factors may increase the risk of exposure to potential toxicants. A number of different factorscan be distinguished:
• poor apparatus and/or poorly designed and managed processes• unsafe combination of apparatus and/or processes• incorrect function of apparatus or processes• maintenance problems (technical maintenance and cleaning personnel are at greater risk than
other workers)• excessive use of protective devices leading to poor occupational hygiene• no separate room for cleaning• no separate room for eating and drinking• pressure of work and undue stress• behavior of colleagues
4.4 Workers’ behavior
Workers may increase their own risk, for example by the following actions:
• not complying with safety rules or specified work practices• not wearing personal protection equipment (p.p.e.) and clothing when this is requested• wearing inappropriate p.p.e.• eating, drinking, and smoking at the workplace• not washing hands• putting hands into mouth• not changing clothes
4.5 Exposure assessment
In principle, the exposure of a human population can be assessed by representative monitoring dataand/or by model calculations based on available information on substances with analogous uses andexposure patterns or properties [8]. Where existing substances are used in processes with a high pro-duction volume, exposure data may be available. However, it is important to decide:
• what to assess• when to assess• the representativeness of the measurements• the reliability of the measurements
The reliability of the data will be determined by the adequacy of the techniques used, and thestrategies and quality standards used for sampling, analysis, and protocol. Good quality data (i.e., expo-sure data obtained by employing good occupational hygiene practice) are essential. With regard to therepresentativeness of the measurements, do they give a good picture of the exposures in the different
R. F. M. HERBER et al.
© 2001 IUPAC, Pure and Applied Chemistry 73, 993–1031
1002

locations? This requires consideration of the type of sampling, the location, the duration, and the fre-quency.
In assessing exposure, representative and reliable data and the detailed information to use in mod-eling calculations may not be available in sufficient detail. As a general rule, in risk assessment the bestand most reliable data should be given extra weighting. However, particularly where data is of an unsat-isfactory quality, it is often useful to conduct an assessment using “worst case” assumptions. If this indi-cates a risk that is of “no concern”, no further action is needed. If this is not the case, the assessmentwill have to be refined further.
The predictions of the exposure levels should describe a worst case situation, covering normal usepatterns and allowing for consumers or workers using several products containing the same substanceif this is at all possible; upper estimates of extreme use and even reasonably foreseeable misuse shouldbe taken into account. However, prediction cannot adequately cover exposures as resulting from acci-dents or abuse. In making an assessment, it must be emphasized that the best and most realistic dataavailable should always be given preference. Where the outcome of the assessment is that the exposureis of “no concern”, care should be taken to be able to justify this assessment. This is particularly thecase when dealing with the use of high-volume materials in the workplace. When carrying out anassessment, account should be taken of risk reduction/control measures, which are in place. Generally,the exposure assessed will be an external exposure, i.e., the concentration in the atmosphere.
Exposure-route modelsExposure-route models are a particular subgroup of exposure models intended to answer the question:What is the actual uptake by an individual of a substance in the environment (external exposure)? Theycan use data obtained either directly by measurement or indirectly from modeling. Absorption andbioavailability, which will affect the uptake, are taken into account at the risk estimation stage.
Models generally calculate intake by multiplying the pollutant concentration in the medium by anestimated intake rate for that medium multiplied further by the duration or time an individual is exposedto that medium.
If a pollutant is present in multiple media, or if multiple exposure routes exist, each must be mod-eled separately. For example, if a substance is present in water, consideration has to be given to sever-al routes to obtain the total external exposure dose. These include direct ingestion through drinking;skin absorption from water during washing or bathing; inhalation during showering or bathing, etc.;ingestion of plants and animals exposed to the water; and skin absorption from contact with soilexposed to the water. In some cases, it may be appropriate to sum all the doses, although toxic effectsoften depend on the route of exposure and the resultant distribution of dose in different organs and tis-sues. Certain chromates, asbestos fibers, and beryllium are carcinogenic if inhaled over a long period,but not when ingested.
Physiological routes of exposurePhysiological routes of exposure, also called routes of entry, can be divided into three categories:
• inhalation exposure• ingestion exposure• dermal exposure
Considering the different possible physical states—gases, liquids, liquid aerosols, and solidaerosols (dusts)—a number of combinations are possible. Table 2 shows the conditions to be consid-ered for dusts.
An important parameter of a substance is its solubility in water. An example is the water-soluble(ionic) cobalt–zinc–silicate used in pottery plate painting, which showed 30 times higher cobalt in urinelevels for painters using this compound as compared to the urine levels of painters using the water-insol-uble cobalt aluminate [9].
© 2001 IUPAC, Pure and Applied Chemistry 73, 993–1031
Risk assessment for occupational exposure to chemicals 1003

Inhalation exposureGases, fumes, and vapors can be absorbed from the respiratory tract. The extent of absorption willdepend on the atmospheric concentration of the substance and on its ability to cross cell barriers.
The behavior of solid particulates will depend on their particle size. Dust and fibers of aerody-namic diameter <0.1 µm behave in the same way as vapors. Particles of aerodynamic diameter >10 µmbecome trapped in the upper respiratory tract and may be swallowed. Particles of intermediate size <10µm (known as PM10 dusts) may penetrate deep into the lungs and reach the alveoli. Workload andhence lung ventilation may vary, and it is characteristic for many chemicals that the amount absorbedcorrelates with the air intake. Small particles may stay in the alveoli for periods as long as several years,since alveolar membranes have no cilia to move the particles out of the lungs toward the pharynx.
Ingestion exposureA part of any inhaled dust may be swallowed. This process of swallowing is called primary ingestion,and is of particular importance when the dust originates from very toxic substances. In the 1980s itbecame clear that the behavior of the worker could be an important parameter in intake of cadmium andnickel dust [10]. Factors such as frequency of hand–mouth contact and smoking with contaminatedhands may explain up to 74% concentration variance in blood lead (an uptake measure) in cases of leadexposure, and up to 48% of the variance in urine chromium concentration (an uptake measure) in casesof chromium exposure [11,12].
Ingestion following unhygienic behavior is called secondary ingestion and may be responsible fora major share in the intake (uptake) of dust. Workload and time pressure also affect intake (uptake)[13,14]. The reason for the importance of ingestion exposure for metal dusts is these dusts show a fastfall-out rate from air. Thus, concentrations of metal dusts in air may be low, while large amounts havebeen deposited as a dust layer on all available surfaces. Dust layers may be touched by unprotectedhands and reach the mouth by hand–mouth contact.
R. F. M. HERBER et al.
© 2001 IUPAC, Pure and Applied Chemistry 73, 993–1031
1004
Table 2 Conditions to be considered in the analysis of absorption of chemicals from dust in the air.
1. Inhalation and absorption via the lungsConcentrations in the air, variations over timeVolume of contaminated air inhaledAmount of inhaled risk-chemical which is absorbedBody weight
2. Inhalation and absorption through the digestive systemAmount of risk-chemical swallowed after inhalationAmount of risk-chemical in the digestive system which is absorbedAverage body weight
3. Oral intake and absorption via the digestive systemConcentration of dust and particles on exposed skinAmount of dust and particles on exposed skin consumed through the mouth and swallowedAmount of risk-chemical in the digestive system which is absorbedBody weight
4. Absorption through the skinArea of exposed skinConcentration of dust and particles on exposed skinAmount of risk-chemical absorbed through the skinBody weight

Dermal exposureTable 3 summarizes what we know about uptake of various types of substance following dermal expo-sure. Dermal exposure is of limited importance for inorganic substances as long as the skin is undam-aged. Only a relatively small number of inorganic substances can cross the skin barrier because theirionic character and the resultant water solubility prevent it from happening. Metals and other insolublesubstances cannot easily cross the skin barrier either. In the case of damaged skin, however (e.g., fol-lowing exposure to corrosive agents such as chromates and permanganates), uptake of many substancesmay occur quite easily.
Covalent inorganic compounds that are fat-soluble, such as the metallo-organics, hydrogen sul-fide, and carbon disulfide can penetrate the skin easily.
Organic compounds that are fat-soluble can also penetrate the skin easily. There are numerousorganic substances like this, for example, alkanes (hexane), aromatics (benzene), aromatics with func-tional groups (nitrotoluene, hexachlorobenzene, aniline), ketones (acetone), and many others.Experiments with cis-l,3-dichloropropene vapor [15] showed that the dermal uptake was 2–5% of theinhaled uptake. In the case of 2-methoxyethanol (ME) vapor, the dermal uptake is as much as 55% ofthe total uptake, and in the case of 2-ethoxyethanol (EE), it is 45% [16]. Dermal uptake resulting fromskin contact of both hands and forearms with ME and EE for 60 min would exceed inhalation uptakerelative to the 8-h European occupational exposure limit by 100 times at 16 mg/m3 of ME and 20 timesat 19 mg/m3 of EE [16].
With liquids that are dermal hazards, the less volatile the liquid, the greater its exposure potential.Under normal conditions, a highly volatile liquid is likely to have evaporated from the skin before sig-nificant amounts have been absorbed through the skin. Exposure will, of course, be greatly reduced, oreven eliminated, if the liquid is separated from the skin by a protective barrier, such as that provided by
© 2001 IUPAC, Pure and Applied Chemistry 73, 993–1031
Risk assessment for occupational exposure to chemicals 1005
Table 3 Uptake following dermal exposure.
Substance Dermal exposureIntact skin Damaged skin
Inorganic insoluble(e.g., cadmium sulfide, cobalt aluminate) No No
Inorganic soluble (ionic)(e.g., sodium chloride, potassiumpermanganate) No Yes
Inorganic covalent(e.g., methyl bromide,carbon disulfide) Yes Yes
Metals (e.g., lead, mercury) No Some
Organic soluble (ionic)(e.g., acetic acid) No Yes
Organic covalent(nearly all organic compounds,e.g., alkanes, ethers, aromates) Yes Yes

adequate protective clothing. However, exposure may be increased if the liquid is trapped inside the pro-tective clothing.
As a route of entry, dermal exposure appears to be of particular significance in workers using sol-vents (painters, cleaners of metals, printers, dry cleaners), and in agricultural workers involved in pes-ticide application. Drenched clothes, inadequate protective equipment, and, in agriculture, unsafe spray-ing methods have resulted in a number of intoxications, mainly due to skin absorption.
5. MEASUREMENT OF EXPOSURE
5.1 Introduction
In most situations, it is unlikely that continuous monitoring of a potential hazard can be carried out. Itis therefore necessary to resort to sampling measurements, usually intermittent, in order to obtain a pic-ture of the exposure in different areas and for different people. Decisions have to be made about whatis going to be measured, where it is going to be measured and for how long and how often. Samplingobjectives can be of two types:
• to aid the engineering control of in-plant emissions • to assess the likelihood of risk to workers’ health
Sampling for the first purpose is concentrated on the sources of contaminant emissions, and forthe second in the area where personnel work.
5.2 In-plant emissions
In-plant emission control can be used both for engineering purposes, and to identify the presence of haz-ards. In an ideal situation, it may be assumed that the workroom is homogeneously filled with the sub-stance of concern. In this situation, if the concentration of the substance in the workroom is constant,one sample would be enough to get an exact figure for the risk assessment.
In common practice the ideal situation is never approached. The concentration of a substance mayfluctuate under the influence of a number of parameters. Some of the more important parameters arediscussed below.
5.3 Input concentrations
A given process generates an input of a substance of concern. The input may be constant, but general-ly will be fluctuating, perhaps as a result of batch processing. Several physical changes may occur inthe input mode. The input may be dependent on the nature of the process, the temperature, and fugitiveemissions of material. Also, chemical changes may occur in the input mode. Such changes may resultfrom changes in the process, in the temperature, or in availability of oxygen or of other gases. Thechanges may cause the appearance of new substances in the workroom. Once a substance appears in theworkroom, it will be dispersed throughout the workroom. The distribution of the substance will dependon the physical state of the substance and on the workroom conditions.
GasesGases at room temperature with a low relative molecular mass (Mr) will fill all the available volume ina short time. Examples are He (helium Mr 4), N2 (nitrogen Mr 28), and CO (carbon monoxide Mr 28).Gases with a high density will tend to cover the lowest surface with a layer. Examples are C12 (chlo-rine Mr 71), and CO2 (carbon dioxide Mr 76). The thickness of the layer depends on the amount of gas.Important parameters affecting mixing are the temperature and the air circulation. It must be pointedout that, on parts-per-million concentrations of a contaminant gas, the dominant effect is that of air, andthus the effect of the properties of the trace gas is negligible.
R. F. M. HERBER et al.
© 2001 IUPAC, Pure and Applied Chemistry 73, 993–1031
1006
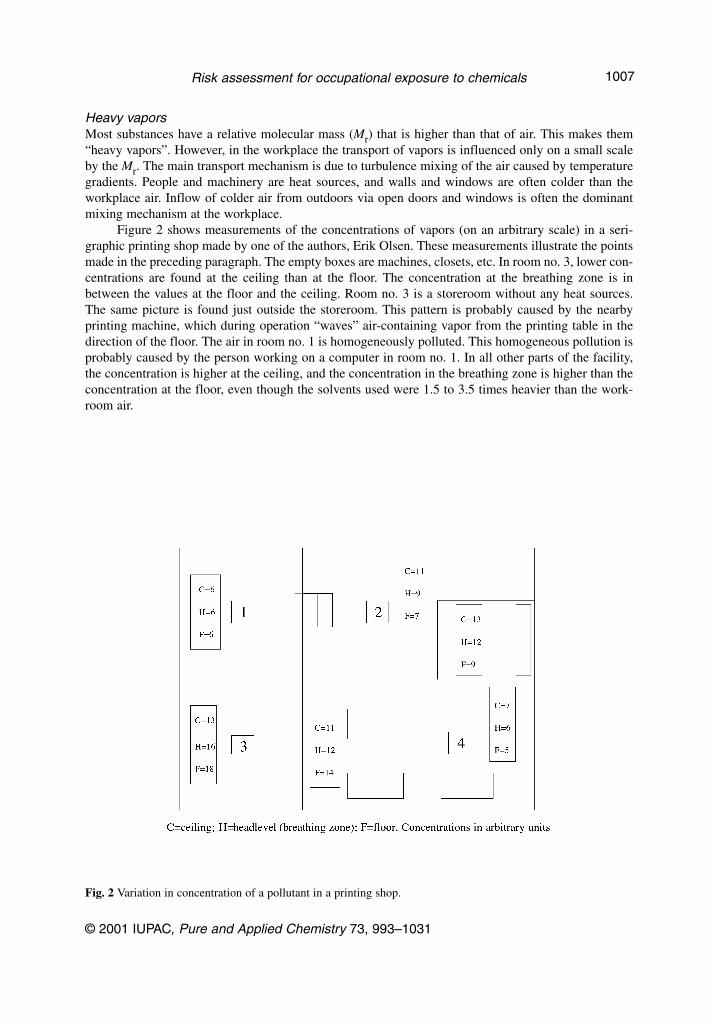
Heavy vaporsMost substances have a relative molecular mass (Mr) that is higher than that of air. This makes them“heavy vapors”. However, in the workplace the transport of vapors is influenced only on a small scaleby the Mr. The main transport mechanism is due to turbulence mixing of the air caused by temperaturegradients. People and machinery are heat sources, and walls and windows are often colder than theworkplace air. Inflow of colder air from outdoors via open doors and windows is often the dominantmixing mechanism at the workplace.
Figure 2 shows measurements of the concentrations of vapors (on an arbitrary scale) in a seri-graphic printing shop made by one of the authors, Erik Olsen. These measurements illustrate the pointsmade in the preceding paragraph. The empty boxes are machines, closets, etc. In room no. 3, lower con-centrations are found at the ceiling than at the floor. The concentration at the breathing zone is inbetween the values at the floor and the ceiling. Room no. 3 is a storeroom without any heat sources.The same picture is found just outside the storeroom. This pattern is probably caused by the nearbyprinting machine, which during operation “waves” air-containing vapor from the printing table in thedirection of the floor. The air in room no. 1 is homogeneously polluted. This homogeneous pollution isprobably caused by the person working on a computer in room no. 1. In all other parts of the facility,the concentration is higher at the ceiling, and the concentration in the breathing zone is higher than theconcentration at the floor, even though the solvents used were 1.5 to 3.5 times heavier than the work-room air.
© 2001 IUPAC, Pure and Applied Chemistry 73, 993–1031
Risk assessment for occupational exposure to chemicals 1007
Fig. 2 Variation in concentration of a pollutant in a printing shop.

LiquidsNonpolar liquid volatile substances with a low Mr (e.g., the vapors CH4, methane, acetylene, C2H2, liq-uids as hexane) have a high volatility at room temperature and will easily be distributed as vapor in theworkroom. Nonpolar liquid volatile substances or metals with a high Mr, such as bromine, polycyclicaromatics, or elemental mercury, will not vaporize so easily. Owing to their higher mass, these sub-stances will remain on the lowest possible surface, generally the workbench or work floor. A gradientof the substance in the air just above the surface will be formed. The thickness of the layer is depend-ent on the amount of substance, the volume, the temperature, and the circulation rate.
Polar liquid substances have a low volatility at room temperature (e.g., water, ethanol, formicacid, acetic acid). A number of slightly polar nonfat-soluble compounds with low Mr will vaporize eas-ily (e.g., acetone, formaldehyde, ethyl acetate, and ether). Longer aliphatic or aromatic chains willdiminish the vaporization (e.g., decanol, stearic acid, caproaldehyde, benzaldehyde, and benzophe-none). Others may still vaporize enough to be detected by their smell (e.g., anisole, aniline, tetrahydro-furan, and aromatic alcohols).
Liquids with low volatility and those that are nonvolatile, such as many insecticides, are not eas-ily distributed in the air. They will remain where they are released, with a concentration gradient aroundthe liquid dependent on the volatility.
Figure 3 shows the relation between boiling point and vapor pressure for alkanes and aromatics.The relationships between the two groups of compounds are nearly the same. Such a simple relation-ship between boiling point and vapor pressure exists only for covalent compounds, where addition ofmethyl groups (in a homologous series) results in a proportional enhancement of the boiling point andthus of the vapor pressure. For organic compounds with functional groups (e.g., alcohols, amines, acids,metals, and ionic compounds), the situation is more complex, although for homologous series of suchorganic compounds again a relatively simple relationship between increasing molecular size and vaporpressure can be found.
R. F. M. HERBER et al.
© 2001 IUPAC, Pure and Applied Chemistry 73, 993–1031
1008
Fig. 3 Vapor pressure as a function of boiling point.
Mixtures: mutual interaction between mixture of components—The UNIFAC Method forCalculation of Activity CoefficientsIt has been found that more than 95% of the liquid products used in industry are mixtures [17]. Forexposure assessment of mixtures in the workplace, knowledge of the presence of a particular substance,therefore, is necessary, but is not sufficient. When substances are mixed, they interact. Possible inter-action must be taken into consideration in the exposure assessment.
The activity coefficient is a factor correcting for mutual interaction between components of a mix-ture. The activity coefficient can be calculated using the UNIFAC method. UNIFAC stands for UNI-QUAC Functional Group Activity Coefficient [18], where UNIQUAC stands for UNIversal QUasiActivity Coefficient [19].
UNIFAC considers molecules as consisting of functional groups. Mixtures are considered, not asmixtures of molecules, but as mixtures of these fragments of molecules. Thousands of molecules ofinterest can be modeled from a limited number of functional groups.
A mixture of ethanol, butanol, and normal hexane, for instance, is not considered as a mixture ofthe molecules:
CH3–CH2–OHCH3–CH2–CH2–OHCH3–CH2–CH2–CH2–CH2–CH3
but as a mixture of the three functional groups:
–CH3 –CH2– –OH
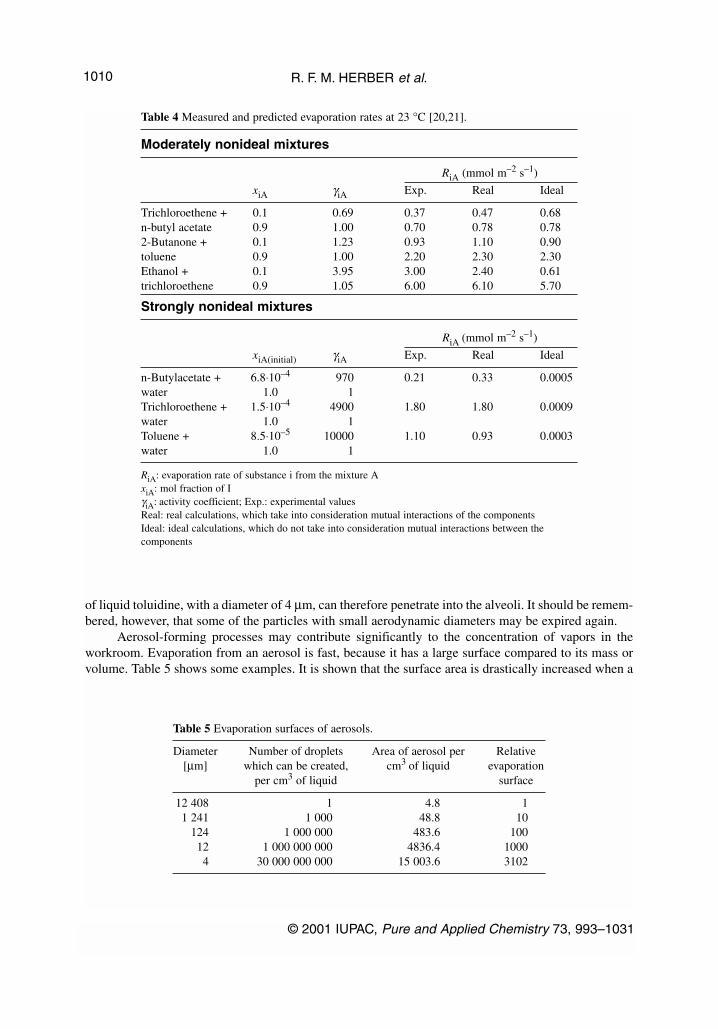
In principle, the activity coefficients of all alkane-alkanol mixtures can be predicted from hexa-ne-ethanol-butanol data, only. Table 4 shows that the interaction between molecules can reduce, as wellas increase, the evaporation rates [20,21]. Toluene evaporates 3700 times faster than ideal calculationshows. The calculation does not take into consideration the mutual interaction between toluene andwater. The last example was found in a printing shop where a water-based glue was introduced toimprove the working environment, but the exposure was actually increased.
The calculation of these activity coefficients is not very complicated. With a computer, such cal-culations can be performed within seconds. The SUBTEC software package [20,21], developed for per-sonal computers, calculates evaporation rates and vapor pressures, taking deviation from ideality intoaccount. The calculations named “real” in Table 4 are calculations where the mutual interaction of themolecules in the mixtures is taken into consideration. It can be seen that the results of “real’ calcula-tions are closer to experimental values than those from “ideal” calculations.
Liquid aerosolsIf a liquid is nebulized (e.g., in spray painting), the mist will fill the available volume dependent on theamount of substance, and the temperature. The density of the mist is also dependent on the amount.
Mists in aerosol form, solid or liquid particles dispersed in air, have quite different transport prop-erties from air pollutants that are gases or vapors. That can easily be understood by considering that theweight of a spherical droplet of toluidine with a diameter of 4 µm, which is a typical droplet diameterfor aerosols met at the workplace, is approximately 2 × 10¹¹ times the weight of a single toluidine mol-ecule. The transport properties of a particle also depend on its shape and size. This is all summarizedin the concept of the aerodynamic diameter. A particle’s aerodynamic diameter is defined as the diam-eter of a spherical particle, with a density of 1 g cm–3, which has the same fall velocity as the particleconsidered. Table 5 shows the influence of droplet size on evaporation rates for aerosols.
When breathing through the nose, most particles with aerodynamic diameters above approximate-ly 10 µm will be deposited in the upper airways, following impaction and sedimentation. Particles withaerodynamic diameters below approximately 10 µm can reach the alveoli when inspired. For example,toluidine has a liquid density of 0.998 g cm–3 (23 °C), i.e., very close to a density of 1 g cm–3. A droplet
© 2001 IUPAC, Pure and Applied Chemistry 73, 993–1031
Risk assessment for occupational exposure to chemicals 1009
of liquid toluidine, with a diameter of 4 µm, can therefore penetrate into the alveoli. It should be remem-bered, however, that some of the particles with small aerodynamic diameters may be expired again.
Aerosol-forming processes may contribute significantly to the concentration of vapors in theworkroom. Evaporation from an aerosol is fast, because it has a large surface compared to its mass orvolume. Table 5 shows some examples. It is shown that the surface area is drastically increased when a
R. F. M. HERBER et al.
© 2001 IUPAC, Pure and Applied Chemistry 73, 993–1031
1010
Table 4 Measured and predicted evaporation rates at 23 °C [20,21].
Moderately nonideal mixtures
RiA (mmol m–2 s–1)
xiA γiA Exp. Real Ideal
Trichloroethene + 0.1 0.69 0.37 0.47 0.68n-butyl acetate 0.9 1.00 0.70 0.78 0.782-Butanone + 0.1 1.23 0.93 1.10 0.90toluene 0.9 1.00 2.20 2.30 2.30Ethanol + 0.1 3.95 3.00 2.40 0.61trichloroethene 0.9 1.05 6.00 6.10 5.70
Strongly nonideal mixtures
RiA (mmol m–2 s–1)
xiA(initial) γiA Exp. Real Ideal
n-Butylacetate + 6.8⋅10–4 970 0.21 0.33 0.0005water 1.0 1Trichloroethene + 1.5⋅10–4 4900 1.80 1.80 0.0009water 1.0 1Toluene + 8.5⋅10–5 10000 1.10 0.93 0.0003water 1.0 1
RiA: evaporation rate of substance i from the mixture AxiA: mol fraction of IγiA: activity coefficient; Exp.: experimental valuesReal: real calculations, which take into consideration mutual interactions of the componentsIdeal: ideal calculations, which do not take into consideration mutual interactions between the components
Table 5 Evaporation surfaces of aerosols.
Diameter Number of droplets Area of aerosol per Relative[µm] which can be created, cm3 of liquid evaporation
per cm3 of liquid surface
12 408 1 4.8 11 241 1 000 48.8 10
124 1 000 000 483.6 10012 1 000 000 000 4836.4 10004 30 000 000 000 15 003.6 3102

liquid is dispersed as an aerosol. Risk assessment of aerosol-forming processes, therefore, should takeinto consideration exposure to both liquid aerosol and vapors.
Vapors
Creation of vapors from liquidsThe amount of vapor created from a liquid is the product of the specific evaporation rate in mg per sec-ond per m2 multiplied by the evaporation area.
The specific evaporation rate of a substance depends on its vapor pressure and diffusion coeffi-cient and on its interactions with other components, if present in a mixture. The specific evaporationrate is not only a property of the substance or of the mixture of substances, it depends also on “outer”parameters such as air velocity over the evaporation surface and the intensity of any air turbulence. InTable 6, the evaporation rates for some substances are listed [20]. It is of note that acetone evaporates118 000 times faster than hexadecane and 1.4 million times faster than 1,2,3-propanetriol. Hence, tomake a proper exposure assessment, exact knowledge of the physical properties of the substances usedat the workplace is essential.
SolidsSome solids (e.g., iodine, phenol, camphor) will sublime—vaporize directly without forming a liquid.The distribution in the workroom of vapor from these substances can be compared with the distributionof vapor from volatile liquids. Other solids may melt at room temperatures and should then be treatedas liquids. Solids that do not sublimate or vaporize at ambient temperatures will remain where they areif they are large or heavy enough. If a solid consists of particles, an aerosol may be formed (e.g., inwelding, cutting, or sawing). The density of the aerosol will be dependent on the amount of substanceand the mechanical process by which the aerosol is formed. Table 7 [22] provides a simple basis forqualitative classification of solids in relation to their potential to release aerosolic dusts.
© 2001 IUPAC, Pure and Applied Chemistry 73, 993–1031
Risk assessment for occupational exposure to chemicals 1011
Table 6 Evaporation rates and vapor pressures for some pure substances at20 °C [20].
Rii Rn–BuAc Pii[g m–2 min–1] [Pa]
Hydrogen cyanide 769.1 242.0 91584.215Trichlorosilane 771.6 579.6 80819.796Acetone 57.6 17.1 28077.6131,1-Dichloroethane 89.1 26.5 27829.6341,2-Dichloroethane 24.9 7.4 9581.852n-Butyl acetate 3.178 1 1362.151o-Toluidine 0.064 0.02 29.0661,3-Propanediol 0.00907 0.0027 4.936Hexadecane 0.00049 0.000147 0.1531,2,3-Propanetriol 0.00004 0.000018 0.017
Rii: evaporation rateLaminar airflow, air velocity: 0.1 m s–1
Rn–BuAc: evaporation rate relative to the evaporation rate of n-butyl acetatePii: pure substance vapor pressure

5.4 Output concentrations
A prime objective of occupational hygiene is to prevent exposure of workers to any potentially toxicsubstance. An effective exhaust ventilation system will lower or completely eliminate the output of atoxicant gas or vapor to the workplace. An example of the theoretical situation is given in Fig. 4. Itshould be emphasized that the time axis may be anything between seconds and hours, depending on theslope of the input and output parts of the figure. The distribution of a gas or vapor as a function of timeis rarely stable.
6. MONITORING OF EXPOSURE FOR OCCUPATIONAL HYGIENE
Monitoring of exposure is essential in order to regulate exposures and to identify any change which maythreaten to increase exposures beyond acceptable levels.
6.1 Monitoring by continuous sampling
Continuous sampling can be performed by any instrument that can follow the concentration of a rele-vant substance on a real-time basis (e.g., an infrared absorption spectrometer). Such an instrument can
R. F. M. HERBER et al.
© 2001 IUPAC, Pure and Applied Chemistry 73, 993–1031
1012
Fig. 4 Concentration of gas in a workroom as a function of time.
Table 7 Solids: how dusty [22]?
LOWPellet-like solids that don’t break up. Little dust seen during use (e.g., lead stearate pellets, waxed flakes, pills).
MEDIUMCrystalline, granular solids. When used, dust is seen, but settles out quickly. Dust is left on surfaces after use(e.g., cadmium sulphide powder, most dust from mechanical cutting of metals).
HIGHFine, light powders. When used, dust clouds can be seen to form and remain airborne for several minutes (e.g., cement, carbon black, chalk dust, welding).

measure absorption of gases and vapors in the infrared spectrum and thus can detect carbon dioxide,alkenes (e.g., ethene), alkynes (e.g., acetylene), and aryl compounds (e.g., benzene). Methane, nitrogen,helium, and vapors and gases which do not show infrared absorption cannot be monitored.
6.2 Monitoring by discrete sampling
A simple measure of exposure might be an indicator tube, which changes color when a vapor or gasinteracts with its contents. The measuring time for such tubes is only a few minutes, and thus the resultsare only indicative of relevant exposure (OEL limits are set for at least 15-min samples). Sampling aflow of ambient air stream and measuring its light absorbance, or collecting a sample on a filter withsubsequent determination of the substance of interest, may be used to give a substantive quantitativemeasurement. If the time axis is very short (seconds), it is clear that discrete sampling may be hard toperform. Thus, this method can be used only if the time axis (in fact, the residence time) is long enough.
6.3 Monitoring by diffuse sampling
An adsorbing material in a suitable container is placed in the workroom for a certain time period.During this period the substance of concern is adsorbed onto the medium (carbon, silica gel, zeolite).Subsequently, the compound is desorbed and determined by gas chromatography or by another suitablemethod. This method gives the total amount that has been sampled. The method is valuable for meas-uring time-weighted average concentrations over a workshift.
6.4 Gases with a low vapor pressure, evaporating liquids, subliming and meltingsolids
With regard to these substances, there always exists a concentration gradient from floor to ceiling.Instead of real-time measurements, monitoring as a function of the distance from floor to ceiling is moreimportant. Thus, in addition to continuous sampling and diffuse sampling, discrete targeted samplingmethods may be needed. Air turbulence is common in workrooms and must be taken into account.
6.5 Mists
The nature of a mist is dependent on the droplet diameter, the temperature, and the ventilation rate. Ifthe droplets are very small, and the other parameters are appropriate, the mist may remain stable (likea natural “water and air” mist, or an “oil and air” mist). Monitoring can be done in this situation by con-tinuous or discrete methods. Only a few samples are needed in such a stable situation. A fall in tem-perature may cause condensation of mist droplets, and a liquid may be formed. This liquid may bevolatile, and then the appropriate sampling methods must be adopted.
6.6 Aerosols, particles, and/or dusts
Aerosols generally behave in the same way as fogs. If the particle size is small enough, the aerosol con-centration will remain constant in time (e.g., smoke in a cafe). Monitoring of smoke can be performedboth by continuous and discrete sampling. Generally, however, the particles will be heavy, and theaerosol will disappear completely and form dust. If the dust sublimes, or vaporizes, we have situationsalready described above. If not, monitoring will require sampling the dust. A complicating factor is thatmechanical disturbance of dusts may produce an aerosol again. Sampling of dust can only be performedby collection of dust from the surfaces where it is deposited. Recently, a geltape method for the opticalmeasurements of the total amount of dusts on surfaces has been developed [23]. If a correlation existsbetween the total amount of dust and the concentration of the substance in the dust, the geltape method
© 2001 IUPAC, Pure and Applied Chemistry 73, 993–1031
Risk assessment for occupational exposure to chemicals 1013
may be a supplement to air measurements in a routine surveillance of the work environment. If the peri-od over which the dust is formed is known, a time-weighted average over that period can be calculat-ed. Otherwise, dust sampling must be only qualitative.
6.7 Environmental monitoring or ambient monitoring
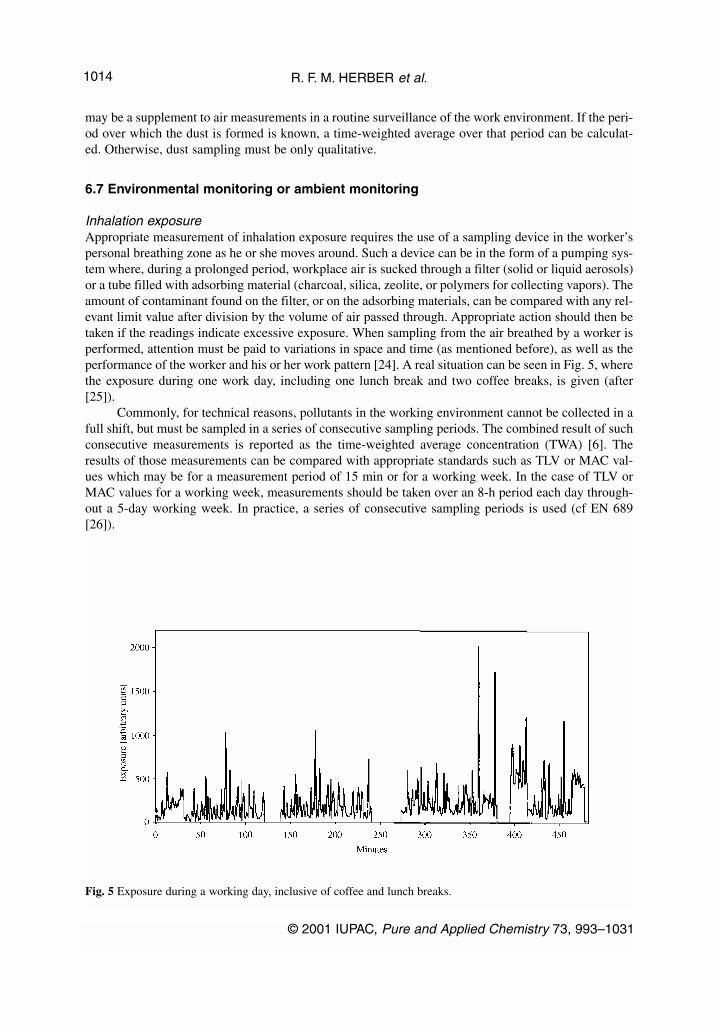
Inhalation exposureAppropriate measurement of inhalation exposure requires the use of a sampling device in the worker’spersonal breathing zone as he or she moves around. Such a device can be in the form of a pumping sys-tem where, during a prolonged period, workplace air is sucked through a filter (solid or liquid aerosols)or a tube filled with adsorbing material (charcoal, silica, zeolite, or polymers for collecting vapors). Theamount of contaminant found on the filter, or on the adsorbing materials, can be compared with any rel-evant limit value after division by the volume of air passed through. Appropriate action should then betaken if the readings indicate excessive exposure. When sampling from the air breathed by a worker isperformed, attention must be paid to variations in space and time (as mentioned before), as well as theperformance of the worker and his or her work pattern [24]. A real situation can be seen in Fig. 5, wherethe exposure during one work day, including one lunch break and two coffee breaks, is given (after[25]).
Commonly, for technical reasons, pollutants in the working environment cannot be collected in afull shift, but must be sampled in a series of consecutive sampling periods. The combined result of suchconsecutive measurements is reported as the time-weighted average concentration (TWA) [6]. Theresults of those measurements can be compared with appropriate standards such as TLV or MAC val-ues which may be for a measurement period of 15 min or for a working week. In the case of TLV orMAC values for a working week, measurements should be taken over an 8-h period each day through-out a 5-day working week. In practice, a series of consecutive sampling periods is used (cf EN 689[26]).
R. F. M. HERBER et al.
© 2001 IUPAC, Pure and Applied Chemistry 73, 993–1031
1014
Fig. 5 Exposure during a working day, inclusive of coffee and lunch breaks.

Skin exposureSeveral methods, none completely satisfactory, have been used to estimate exposure of the skin tochemicals [27]. One technique is the use of wipe samples from a known area of the skin surface, fol-lowed by their analysis for the substance of interest. However, uncertainties arise both from how quick-ly the substance is absorbed through the skin and also the extent of its recovery from the skin by thistechnique. Methods of this type have been useful for chemicals that are only slowly absorbed throughthe skin, such as polychlorinated biphenyls, polyaromatic hydrocarbons, and certain pesticides.
6.8 Dose (internal exposure)—biomarkers
To determine the dose of a human to a chemical substance, analysis of tissues and body fluids can becarried out [28]. In determining the dose, analysis is aimed at measuring amounts of the substance itselfand/or of its metabolites. It must be kept in mind that the dose is defined as the total amount of a sub-stance absorbed. Thus, the measurement of the substance of concern should be repeated over the peri-od of exposure, and the measurement results should be integrated over time.
The initial changes in enzymes and other biological substances or responses affected by the sub-stance are called early effects. The term “biomarker” is used in a very broad sense to include a wholerange of biological effects reflecting an interaction between a toxicant and human biology. The termmay be applied to a functional, biochemical, or physiological change, or it may be applied to a specif-ic molecular interaction (Fig. 6). Biomarkers provide direct evidence for the exposure of individuals ina population to a particular substance, for example, lead in bone, cadmium in the kidney (both in vivodeterminations), mercury in urine, or trichloroethylene in exhaled air. Quantitative measurements maypermit the determination of a dose–effect relationship, particularly if the toxicokinetics of the substanceare well established. Contrary to sampling for clinical purposes, in occupational health only limitednumbers of samples are available. Mostly, samples of blood, urine, and exhaled air are used. There is apreference for noninvasive methods. Where available, such measurements may be used for screeningand, if repeated at timed intervals, for monitoring either an individual or a group.
Figure 6 indicates what methods should be used for monitoring. For some substances, especiallythose in the form of dusts, where worker behavior strongly influences the intake, biomarkers are the
© 2001 IUPAC, Pure and Applied Chemistry 73, 993–1031
Risk assessment for occupational exposure to chemicals 1015
Fig. 6 The relationship betweeen biomarkers of exposure and biomarkers of effect.
methods of choice. This is also true for solvents where skin exposure occurs. An advantage of bio-markers of exposure is that they are an integrative measure, that is, they provide information aboutexposure through all routes including those of nonoccupational exposure. An example where this isimportant is the combination of occupational exposure to lead with exposure to lead through hobbies(such as in soldering, shooting, glazing with glazes containing lead) and environmental exposure toleaded gasoline. Another example is occupational exposure to solvents combined with exposure athome during painting or hobbies involving paint and glue. Biological data must be collected to takeaccount of differences in lifestyles, including gender, age, height and weight, smoking, alcohol, intakeof medicine, food consumption, and personal habits and characteristics.
Biomarkers of exposure or effect may be used to evaluate compliance with recommended meth-ods for minimizing exposures or to indicate the need for remedial measures (e.g., the reduction of leadexposure). Biomarkers can conveniently be classified into three groups:
• biomarkers of exposure (biological monitoring)• biomarkers of effect (biological effect monitoring)• biomarkers of susceptibility
Biomarkers of exposure (biological monitoring)Measurements of body burden rather than of exposure need to be established, and these should be relat-ed to measures of effect. Measurements of body burden will need biological monitoring [3].
To assess body burden, the amounts of exogenous substances or their metabolites and/or deriva-tives in cells, tissues, body fluids, or excreta are measured. Alternatively, the biomarker of exposuremay take the form of cytogenetic change or reversible physiological change in exposed individuals. Itmust be understood that, generally, biomarkers of exposure give an indication of the substance circu-lating in the body and/or the amount excreted. Thus, we have measures of intake (e.g., cadmium in fae-ces) or uptake (e.g., lead in blood). If lead effects on haem synthesis appear, lead in blood may be usedin addition as a dose measure (if integrated in time) for this particular effect. In the case of cadmium inblood, there is no effect on the blood, and thus cadmium in blood has to be used exclusively as an uptakemeasure. An early effect of cadmium is an effect on the kidney, the leakage of proteins in urine. A gooddose measure to relate to effect in this case is the concentration of cadmium in urine (integrated in time),and this measure also gives an indication of the body burden.
Lifestyle (smoking, drinking and eating habits, exercise and leisure pursuits, etc.) can influencethe effective dose of a chemical. Alcohol increases the absorption of certain chemicals and interactswith cobalt in the production of harmful effects. Many organic substances, including DDT and PCB,and drugs, including prescribed medicines, change the body’s ability to metabolize toxic chemicals.
Assessment of dataWhen the properties of biological samples are measured in order to assess risk, it is important that thereis adequate documentation of the sampling techniques applied and the associated uncertainty.
Data for substances that disappear rapidly from the blood are only useful in risk assessment ifthere is a standard time at which samples are taken. For substances with a short half-life, the sampleshould be taken no later than 30 min after work has stopped at the end of a work period, and the sam-pling time should be documented. Data for chemicals in urine will usually be acceptable for risk assess-ment if they reflect both current and long-term exposures. However, a standard time for sampling isimportant if the half-life of the toxicant in the body is less than 20 h. Furthermore, several samples (2–5)taken over a longer period than 20 h should be analyzed. If the half-life is relatively short, measure-ments where the time of sampling has not been recorded are not acceptable. Other factors that con-tribute to inadequate data are contamination of samples from the surroundings or from the sample con-tainer, evaporation, and chemical changes and bacterial growth in urine samples standing at room tem-perature. Contamination is the worst source of errors when analyzing many chemicals, especially met-als such as nickel, chromium, and cadmium. Contamination can come from the air, the skin and sweat,
R. F. M. HERBER et al.
© 2001 IUPAC, Pure and Applied Chemistry 73, 993–1031
1016

sample containers, and anticoagulants (for blood samples). The risk of contamination from skin,clothes, and hair, as well as from the air at the workplace, is particularly great when collecting urinesamples. Precipitation and adsorption are big problems when collecting and storing urine samples.Certain chemicals, for example, aluminum and volatile organic compounds, are adsorbed on glass andplastic. It is important to check that the correct sample containers recommended for any given analysisare used.
Sample materialsThe most common sample materials are blood (whole blood, serum, or plasma) urine, and exhaled air.Saliva, sweat, hair, and nails may also be used in biological monitoring. In workplace surveys, urinesamples are frequently used as urine is easy to collect in large amounts. Variations in liquid intake andliquid loss, for example, in a warm working environment where a lot of liquid is lost through sweat,result in large variations in concentrations of substances in urine. This variation is often corrected usingthe creatinine concentration of the urine or by measuring the urinary 24-h volume output.
Multiple exposureThere are several examples where the toxicity of a metal is influenced by the presence of a second sub-stance. For example, with carcinogens, there are at least three stages in the development of a cancer—initiation, promotion, and progression. Toxic substances can act at any of these stages. Clearly, simul-taneous exposure to agents that function as initiators, promoters, and progressors, will increase the riskof cancer compared with the risk when exposed to just one agent. There are many natural and synthet-ic initiators, promoters, and progressors in the “external environment”, food, the atmosphere, and water.However, it is very difficult to classify a cancer-inducing chemical as exclusively an initiator, promot-er, or progressor. From a legislative point of view, the extent to which a certain dose of agent inducescancer in humans and animals is the matter of concern. With regard to setting limit values within theworking environment, it is generally assumed, in the absence of better knowledge, that the impact ofthe various agents in a simultaneous mixed exposure is additive. However, in particular cases, this maynot be so, and we must always be alert for this possibility.
Biomarkers of effect (biological effect monitoring)Biomarkers of effect are measurable biochemical, physiological, or other alterations within an organ-ism that can be recognized as associated with an established or potential health impairment or disease.Biomarkers of effect are often not specific for a certain substance. They may be used for so-called“umbrella” measurements. If many compounds are used in a factory, some biomarkers of effect can beapplied to find out if a risk exists by looking for effects that may be a result of the mixed exposure. Ifone or more markers is positive, additional biomarkers of exposure or environmental monitoring can beused to determine the substance responsible for the effect.
Examples of biomarkers of effect:
• The inhibition of certain enzymes of the haem synthesis pathway is caused by lead (or by diox-ins), resulting in elevated concentrations of the precursors protoporphyrin and δ-aminolaevulinicacid dehydratase in blood and δ-aminolaevulinic acid and coproporphyrin in urine.
• The leakage into urine of certain proteins, such as β2-microglobulin, δ-microglobulin, retinol-binding protein, and albumin, is caused by a number of metals and solvents; in addition, there isinhibition of the activity of certain enzymes in the urine (e.g., N-acetyl-D-glycosaminidase).
• The occurrence of negative changes in higher cognitive function (e.g., learning and memory) mayoccur in workers exposed to metals or solvents.
• The inhibition of the enzyme acetylcholinesterase occurs following exposure to a number oforganophosphate and carbamate insecticides (e.g., parathion).
• An increase in haemoglobin adducts follows exposure to aromatic amines, ethylene oxide, propy-lene oxide, butadiene, and alkylating or arylating agents of all kinds.
© 2001 IUPAC, Pure and Applied Chemistry 73, 993–1031
Risk assessment for occupational exposure to chemicals 1017
Effect parameters may show a short half-life, and therefore, correct sampling methodology is cru-cial to the production of useful data. The methodology is not the same for all parameters and must beappropriate to the parameters to be measured. Moreover, time lags often appear between exposure andeffect or between the monitored parameters and effect. This must be known for an adequate samplingstrategy. Multisampling within a working week may be necessary.
Biomarkers of susceptibilityBiomarkers of susceptibility are parameters that may indicate an increase or decrease in the risk of anindividual developing an adverse effect following exposure to a toxicant. Often, susceptibility resultsfrom differing rates of enzyme activity controlling activation or detoxification of toxicants. Often thereis a genetic component to susceptibility. The following are some examples of biomarkers of suscepti-bility:
• People with glucose-6-phosphate dehydrogenase deficiency have more fragile red cells than thosewith average human levels. They are thus more likely than the average person to develop anemiaupon exposure to certain industrial chemicals such as aromatic amines. Low glucose-6-phosphatedehydrogenase activity in blood is therefore a biomarker of susceptibility to these substances.
• People with decreased concentrations of α-1-antitrypsin are more at risk than others of develop-ing emphysema. This protease inhibitor protects the connective tissue of the lung from damageby the proteases that increase in activity when the lung becomes inflamed after exposure to toxi-cants such as dusts or cigarette smoke. Thus, low α-1-antitrypsin in blood is a biomarker of sus-ceptibility to substances that may damage the lungs.
• About half the population acetylates aromatic amines rather slowly. Such slow acetylators are atgreater risk of developing aromatic amine-induced bladder cancer, and low acetylase enzymeactivity is a biomarker for this susceptibility.
• There is a wide variation in the rate at which different people can detoxify para-oxon, a more toxiccompound produced in the body from the insecticide parathion. Monitoring the correspondingenzyme activity provides a measurement that may be used as a biomarker of susceptibility.
7. RISK ASSESSMENT—GENERAL PRINCIPLES
In risk assessment for human health, the normal procedure is to compare the total exposure to which apopulation is exposed or likely to be exposed with the exposure at which no toxic effects are expectedto occur. This is usually done by comparing the calculated exposure with a NOAEL, adjusted by appro-priate “uncertainty”, “modifying” and/or “safety” factors to obtain a conservative assessment of a like-ly “safe dose”. Where it has not been possible to obtain a NOAEL, a LOAEL may be substituted. TheN(L)OAEL values are derived from results obtained from testing with animals or from available humandata, usually expressed as mg/kg/day. Where a N(L)OAEL is not available, a qualitative evaluation ismade of the likelihood of an adverse effect occurring. N(L)OAEL values are not usually available forsubstances not considered to have a threshold for adverse effects. These include genotoxic substancesand substances which are noncorrosive skin or eye irritants and/or skin or lung sensitizers. For assess-ment of human exposure in the workplace, factors such as pulmonary ventilation rate and absorptionfraction in the case of inhalation exposure are needed. For other routes of entry, comparable parametersare needed for assessment of exposure.
For assessments of both exposure and of effects, data on the physicochemical properties (e.g.,vapor pressure, pKa, and lipophilicity) and chemical reactivity may be required. Knowledge of thephysicochemical properties is needed to estimate potential human exposure, to assess the design of tox-icity tests from which data have been obtained, and for analysis of the likely extent of absorption of asubstance by different routes of exposure. The chemical reactivity may be important in estimatinghuman exposure to the substance and will affect its toxicokinetics and metabolism.
Prediction of the effects of the exposure must be carried out:
R. F. M. HERBER et al.
© 2001 IUPAC, Pure and Applied Chemistry 73, 993–1031
1018

• for each exposed human population (e.g., workers, general public)• for each effect
The risk assessment will lead to one or more of the following results for each population exposedand for each effect:
• there is a need for more information or testing• there is sufficient information available, and the present risk reduction measures are satisfactory• there is a need for action to introduce further risk reduction measures, followed by re-analysis
7.1 Analytical quality in relation to risk assessment
Risk assessment may be followed by decisions with wide-ranging and significant consequences forworkers’ health and for the engineering of industrial processes. It is therefore essential that the under-lying analytical data are trustworthy. Thus, there are fundamental criteria to be applied to determine theacceptability of the analytical methods and of the results obtained. Firstly, the analytical method mustbe described in sufficient detail to allow others to repeat determinations. Secondly, the performance ofthe method must be documented (i.e., the method should be validated in order to document analyticalcharacteristics). Thirdly, a value from a determination should be traceable, and the uncertainty known.The International Standard Organization (ISO) defines traceability as “the property of a result of ameasurement or the value of a standard whereby it can be related to stated references, usually nationalor international standards, through an unbroken chain of components all having stated uncertainties”.However, in many fields such unbroken chains do not exist.
Uncertainty may be expressed as a standard deviation, or as the half-width of a confidence inter-val or as a range. Uncertainty is basically a measure of the “goodness” of the determination result [29].
Determinations will always be subject to a degree of uncertainty which must be assessed.Measurement uncertainty of biomonitoring results is partly due to natural variation in the measurementprocess and partly due to interfering substances which occur naturally in high concentrations in thesample (e.g., salt and proteins in a blood sample).
Data should be used only from laboratories that can document continuous use of quality controlresults and approved reference material as well as traceability and uncertainties in measurements.Documentation of the analytical quality can be obtained through accredited laboratories, which are sub-ject to external quality tests and interlaboratory comparisons with reference material.
7.2 Semiquantitative characterization of risk from chemicals
Where a process is in operation and adequate measures of both external and, where possible, internalexposure have been made, it is possible for a risk assessment to be made to assess whether the meas-ures taken to control the risk are adequate. In practice, in many circumstances, an assessment has to bemade prior to the setting up of a process, where there is a lack of hard reliable information. This couldparticularly apply in research and/or development. In this situation some form of modeling has to beapplied based on consideration of the hazards associated with the substances involved and estimates oflikely exposures. One relatively simple procedure has been formulated [22,30,31] as being suitable forthe assessment and control of chemical risks in small- and medium-size enterprises, and also appropri-ate for many assessments in research and development. Sections from this guidance are:
• Getting started• What is a health hazard?• How dusty or volatile?• How much is being used?• Find the control approach and general advice
© 2001 IUPAC, Pure and Applied Chemistry 73, 993–1031
Risk assessment for occupational exposure to chemicals 1019

• Find the task—specific control guidance sheet(s)• Implement and review
In this guidance, both risk assessment and risk management are described at a basic level. Thisguidance is not suited for lead and asbestos, for which in the United Kingdom other procedures mustbe followed. Also excluded are substances formed in industrial processes and external factors influenc-ing the risk and behavior of workers. A particularly useful part of the scheme is the table on assessmentof dustiness (Table 7).
Risk assessment can be used to guide health surveillance by occupational physicians [32].Biological monitoring and fitness for work may be used in health surveillance for primary prevention.For secondary prevention, biological effect monitoring and routine surveillance for adverse effects dueto occupational risks may be used.
8. OCCUPATIONAL DISEASES
When risk management has failed, occupational diseases may appear. A common division of occupa-tional diseases is based on the cause of the disease:
• chemicals• physical processes, such as radiation, noise, heat, and pressure• mechanical stress, such as heavy load and dynamic burden• psychological burdens, such as stress
As there are about 120 000 chemicals with a Chemical Abstracts Service (CAS) Registry Numberused in industry, one may expect that occupational diseases are described for a fraction of these chem-icals only. A possible way to simplify prediction of chemically induced diseases is to base it on class-es of substance (e.g., polyaromatic hydrocarbons or solvents), which produce characteristic effects suchas, for these examples, cancer and neurological disturbances respectively. A second possibility is tolook at homologous series (e.g., formic acid is corrosive to eyes, lungs, and skin). For the related homol-ogous series, acetic acid, propionic acid to palmitic acid, it is observed that corrosive effects start to dis-appear with propionic acid, owing to the domination of the long alkyl chain over the acid functionalgroup. A third possibility is to look at the properties of functional groups such as alcohols, organicacids, and esters.
A quite different approach is to look first at the disease (e.g., occupational asthma, cancer, effectson the reproduction system, and dermatology). There are a number of chemicals that may cause thesepathological conditions, and these may be grouped according to the symptoms which they produce [33].
Once a disease is diagnosed, its cause has to be established from the case history of the patient,including workplace description, and, if possible, biological monitoring or environmental monitoringdata. After establishment of a possible occupational cause, an assessment has to be made to find out ifthe exposure levels were high enough to cause the disease. Moreover, a minimum exposure time mustexist. Between exposure and disease, there will be a time lag with a maximum latency time (the maxi-mum time that the disease can take to appear). The time lag and maximum latent period criteria must besatisfied. Subsequently, a differential diagnosis must be performed to exclude nonoccupational causes.
9. CONCLUSIONS
The importance of risk assessment can hardly be overestimated. In every situation dealing with storage,transport, or handling of chemicals, risk assessment is necessary to protect the environment, the gener-al population, and the workers.
Nearly all countries have at least some regulations on safe handling of flammable or poisonouschemicals. Generally, these regulations depend on the production by chemical manufacturers or suppli-
R. F. M. HERBER et al.
© 2001 IUPAC, Pure and Applied Chemistry 73, 993–1031
1020

ers of informative labels and material safety data sheets or chemical safety cards. In addition, theInternational Labor Organization and the World Health Organization along with the EuropeanCommunity have produced International Chemical Safety Cards since 1993 [34]. An example of thecurrent state of the development of safety regulations is the Risk Inventory and Evaluation (RIE)Directive of the European Community (Framework Directive 89/391) for all workplaces (includingoffices) [35]. Under this directive, on the basis of the available written information (chemical safetycards, quantity of chemicals, hazardous situation, and other relevant information), a hazard identifica-tion must take place to be followed by risk assessment. Finally, control measures (risk management)must be taken, to reduce the risk to an acceptable level. Control measures must be followed by regularevaluation (auditing) to ensure their effectiveness. In principle, this approach should be effective.
10. ACKNOWLEDGMENTS
The authors wish to thank Profs. Frank van Dijk and Dirk Bruynzeel for comments on parts of the man-uscript.
11. GLOSSARY OF TERMS USED IN THIS REVIEW
Acceptable daily intake (ADI)Estimate of the amount of a substance in food or drinking water, expressed on a body mass basis (usu-ally mg/kg body weight), which can be ingested daily over a lifetime by humans without appreciablehealth risk. For calculation of the daily intake per person, a standard body mass of 60 kg is used. ADIis normally used for food additives (tolerable daily intake (TDI) is used for contaminants) [36].
Adverse effect Change in morphology, physiology, growth, development or lifespan of an organism which results inimpairment of functional capacity or impairment of capacity to compensate for additional stress orincrease in susceptibility to the harmful effects of other environmental influences [37].
Benchmark dose (BMD) and lower effective dose (LED)The statistical lower bound on a dose corresponding to a specified level of risk [38].
BioavailabilityExtent to which a substance to which the body is exposed (by ingestion, inhalation, injection, or skincontact) reaches the systemic circulation and the rate at which this occurs [39].
Biological effect monitoringContinuous or repeated measurement of early biological effects of exposure to a substance to evaluateambient exposure and health risk by comparison with appropriate reference values based on knowledgeof the probable relationship between ambient exposure and biological effects [40].
Biological exposure index (BEI)Reference values intended as guidelines for the evaluation of potential health hazards in the practice ofindustrial hygiene. BEIs represent the levels of determinants that are most likely to be observed in spec-imens collected from a healthy worker who has been exposed to chemicals to the same extent as a work-er with inhalation exposure to the TLV [6].
Biological monitoring Sometimes also called “biomonitoring”. Continuous or repeated measurement of potentially toxic sub-stances or their metabolites in tissues, secreta, excreta, expired air, or any combination of these to eval-uate occupational or environmental exposure and health risk by comparison with appropriate reference
© 2001 IUPAC, Pure and Applied Chemistry 73, 993–1031
Risk assessment for occupational exposure to chemicals 1021

values based on knowledge of the probable relationship between ambient exposure and resultant healtheffects [41].
Biological tolerance values for working materials (biologische arbeitsstoff toleranz werte) (BAT)BAT is defined as the maximum permissible quantity of a chemical compound or its metabolites, or anydeviation from the norm of biological parameters induced by those substances in exposed humans [42].
BiomarkerA biomarker can be defined as a parameter that can be used to identify a toxic effect in an individualorganism and can be used in extrapolation between species, or as an indicator signalling an event orcondition in a biological system or sample and giving a measure of exposure, effect, or susceptibility[39]. The term “biomarker” is generally used in scientific publications. In occupational hygiene andhealth, “biological monitoring” and “biological effect monitoring” are used with the meaning “moni-toring biomarkers”.
Body burdenTotal amount of substance of a chemical present in an organism at a given time [39].
DoseTotal amount of a substance administered to, taken, or absorbed by an organism [39]. Sometimes alsocalled “effective dose”.
Dose–response and dose–effect relationships The dose–response curve can be defined as the graph of the relation between dose and the proportionof individuals responding with an all-or-none effect, and is essentially the graph of the probability of anoccurrence (or the proportion of a population exhibiting an effect) against dose [39]. Typical examplesof such all-or-none effects are mortality or the incidence of cancer.
The dose–effect curve is the graph of the relation between dose and the magnitude of the biolog-ical change produced measured in appropriate units [39]. It applies to measurable changes giving agraded response to increasing doses of a drug or xenobiotic. It represents the effect on an individual ani-mal or person, when biological variation is taken into account. An example is the increased effect oflead on the haem synthesis, e.g., on activity of the enzyme 6-amino laevulinic acid dehydratase in bloodserum or coproporphyrin levels in urine.
Environmental (or ambient) monitoring Continuous or repeated measurement of agents in the (working) environment to evaluate environmen-tal exposure and possible damage by comparison with appropriate reference values based on knowledgeof the probable relationship between ambient exposure and resultant health effects [39].
ExposureIn this context it is defined as: the concentration, amount, or intensity of a particular physical or chem-ical agent or environmental agent that reaches the target population, organism, organ, tissue, or cell,usually expressed in numerical terms of substance concentration, duration, and frequency (for chemi-cal agents and micro-organisms) or intensity (for physical agents such as radiation). The term can alsobe applied to the process by which a substance becomes available for absorption by the target popula-tion, organism, organ, tissue, or cell by any route [39].
Half-life (half-time, t1/2)Time in which the concentration of a substance will be reduced by half, assuming a first-order elimi-nation process [39].
HazardSet of inherent properties of a substance, mixture of substances or a process involving substances that,under production, usage, or disposal conditions, make it capable of causing adverse effects to organ-
R. F. M. HERBER et al.
© 2001 IUPAC, Pure and Applied Chemistry 73, 993–1031
1022

isms or the environment, depending on the degree of exposure; in other words, it is a source of danger[39].
Health surveillanceGeneric term used for the procedure for effects of work on the health of employees [43].
IntakeAmount of a substance that is taken into the body regardless of whether or not it is absorbed; the totaldaily intake is the sum of the daily intake by an individual from food and drinking water, and inhaledair [39].
LOAELLowest-observed-adverse-effect level. Lowest concentration or amount of a substance, found by exper-iment or observation, which causes an adverse alteration of morphology, functional capacity, growth,development, or life span of a target organism distinguishable from normal (control) organisms of thesame species and strain under defined conditions of exposure [39].
Maximum latent periodThe length of time after which no causal relationship can reasonably be established. This length of timeis the period from the last exposure to the point of time at which an exposed person has demonstratedthe initial signs or symptoms [44].
NOAELNo-observed-adverse-effect level. Greatest concentration or amount of a substance, found by experi-ment or observation, which causes no detectable adverse alteration of morphology, functional capacity,growth, development, or life span of the target organism under defined conditions [39].
Reference dose (RfD)Term used for an estimate (with uncertainty spanning perhaps an order of magnitude) of daily exposureto the human population (including sensitive subgroups) that is likely to be without appreciable risk ofdeleterious effects during a lifetime [45].
RiskRisk expresses the likelihood that the harm from a particular hazard is realized and is a function of haz-ard and exposure. More formally, it can be defined as: the possibility that a harmful event (death, injury,or loss) arising from exposure to a chemical or physical agent may occur under specific conditions.Alternatively, the expected frequency of occurrence of a harmful event (death, injury, or loss) arisingfrom exposure to a chemical or physical agent may occur under specific conditions [39].
Risk assessmentThe identification and quantification of the risk resulting from a specific use or occurrence of a chem-ical or physical agent, taking into account possible harmful effects on the individual people or societyfrom using the chemical or physical agent in the amount and manner proposed and all the possibleroutes of exposure. Quantification ideally requires the establishment of dose–effect and dose–responserelationships and most likely targets individuals and populations [39].
Risk estimation Assessment with or without mathematical modeling, of the probability and nature of effects of expo-sure to a substance based on quantification of dose–effect and dose–response relationships for that sub-stance and the population(s) and environmental components likely to be exposed and on assessment ofthe levels of potential exposure of people, organisms, and environment at risk [39].
Stochastic effect Consequence for which the probability of occurrence depends on the absorbed dose; hereditary effectsand cancer induced by radiation are considered to be stochastic effects. The term “stochastic” indicates
© 2001 IUPAC, Pure and Applied Chemistry 73, 993–1031
Risk assessment for occupational exposure to chemicals 1023

that the occurrence of effects so named would be random. This means that, even for an individual, thereis no threshold of dose below which there is absolutely no probability of an effect occurring, and thechance of experiencing the effect increases with increasing dose [46].
Threshold limit value (TLV)The TLV is defined as the concentration in air to which it is believed that most workers can be exposeddaily without an adverse effect (i.e., effectively, the threshold between safe and dangerous concentra-tions). The values were established (and are revised annually) by the ACGIH and are time-weightedconcentrations (TWA) for a 7- or 8-h workday and a 40-h workweek, and thus are related to chroniceffects. A short-term exposure limit (STEL) is defined as a 15-min TWA exposure, which should notbe exceeded at any time during a workday even if the 8-h TWA is within the TLV-TWA [6].
UptakeEntry of a substance into the body, an organ, a tissue, a cell, or the body fluids by passage through a mem-brane or by other means [39]. Sometimes, the uptake is also called absorbed dose or internal exposure.
12. ABBREVIATIONS AND ACRONYMS
ACGIH American Conference of Government Industrial HygienistsADI acceptable daily intakeBAT biologische arbeitsstoff toleranz werteBEI biological exposure indexBMD benchmark doseCAS Chemical Abstracts ServiceCEN European Committee for Standardization, BrusselsDDT dichlorodiphenyltrichloroethaneEE ethoxyethanolICME International Council on Metals in the EnvironmentLOAEL lowest-observed-adverse-effect levelLED lower effective doseMAC maximaal aanvaarde concentratieMAK maximale arbeitsplatzkonzentrationenME methoxyethanolMEL maximum exposure limitNOAEL no-observed-adverse-effect levelOEL occupational exposure limitOES occupational exposure standardOSHA Occupational Safety and Health AgencyPCBs polychlorinated biphenylsPEL permissible exposure levelPM10 particles of aerodynamic diameter less than 10 µmRfD reference doseRIE risk inventory and evaluationSUBTEC substitution technologyTLV threshold limit valueTRK technische richtkonzentrationenTWA time-weighted averageUNIFAC UNIQUAC functional group activity coefficientUNIQUAC universal quasi activity coefficient
R. F. M. HERBER et al.
© 2001 IUPAC, Pure and Applied Chemistry 73, 993–1031
1024
13. INTERNET SITES RELATED TO OCCUPATIONAL HYGIENE AND HEALTH
International organizations
Environmental Chemicals Data and Information Network (ECDIN, European Union)Web site: http://ecdin.etomep.net/
The European Agency for Safety and Health at WorkWeb site: http://europe.osha.eu.int/
International Program on Chemical Safety (IPCS), a program from WHO, ILO, and UNEPWeb site: http://www.who.ch/programmes/pcs/index
International Chemical Safety CardsWeb site: http://www.cdc.gov/niosh/ipcs/icstart.html
International Labor Organization (ILO)Web site: http://turva.me.tut.fi/cis/home.html
United Nations Environmental Program (UNEP)Web site: http://irptc.unep.ch
World Health Organization (WHO)Web site: http://www.who.int/home-page/
National organizations
Agency for Toxic Substances and Disease Registry (ATSDR)Country: USAWeb site: http://www.atsdr.cdc.gov/
Cancer Information Service, National Cancer Institute Country: USAWeb site: http://cis.nci.nih.gov
Cancer Research CampaignCountry: UKWeb site: http://www.crc.org.uk
Health and ExecutiveCountry: UKWeb site: http://www.open.gov.uk/hse/
National Institute of Environmental Health Sciences (NIEHS) Country: USAWeb site: http://www.niehs.nih.gov/
Occupational Safety and Health Administration (OSHA), U.S. Department of LaborCountry: USAWeb site: http://www.osha.gov
© 2001 IUPAC, Pure and Applied Chemistry 73, 993–1031
Risk assessment for occupational exposure to chemicals 1025

Nongovernmental organizations
American Conference of Governmental Industrial Hygienists, Inc. Some free sites of the founders ofthe ACGIH threshold limit values (TLVs). The information about the TLVs is not free of charge. Country: USAWeb site: http://www.acgih.org
British Occupational Hygiene SocietyCountry: UKWeb site: http://www.bohs.org
Chemical Abstracts Service (CAS)Web site: http://info.cas.org
Universities and institutes
Canadian Centre for Occupational Health and SafetyCountry: CanadaWeb site: http://www.ccohs.com/
Cornell University, Material Safety Data SheetsCountry: USAWeb site: http://msds.pdc.cornell.edu/msdssrch.asp
EdinTox. Introduction to Applied Toxicology (Self Study Course)Country: UKWeb site: http://www.aqius.com/hew/resource/toxicol.htm
Finnish Institute of Occupational Health Country: FinlandWeb site: http://www.occuphealth.fi/e/
Institute of Occupational Safety and Health (IOSH)Country: UKWeb site: http://www.iosh.co.uk/home.html
International Agency for Research on Cancer (IARC)Country: FranceWeb site: http://www.iarc.fr
IARC MonographsWeb site: http://193.51.164.11/default.html
Karolinska Institute Library, Occupational DiseasesCountry: Sweden Web site: http://www.kib.ki.se/index_en.html
University of Lund, Occupational and Environmental MedicineCountry: SwedenWeb site: http://www.ymed.lu.se
R. F. M. HERBER et al.
© 2001 IUPAC, Pure and Applied Chemistry 73, 993–1031
1026
McGill University, Occupational Health ServicesCountry: CanadaWeb site: http://www.mcgill.ca/occh/
National Institute for Occupational Safety and Health (NIOSH)Country: USAWeb site: http://www.cdc.gov/niosh/homepage.html
NIOSH Pocket Guide to Chemical HazardsWeb site: http://www.cdc.gov/niosh/npg/pgdstart.html
Swedish Institute for Working LifeCountry: SwedenWeb site: http://www.niwl.se
Where to find MSDS on the InternetCountry: USAWeb site: http://www.ilpi.com/msds/index.html
University of Occupational and Environmental HealthCountry: JapanWeb site: http://www.uoeh-u.ac.jp
University of Vermont (host). Vermont SIRI Material Safety Data Sheet CollectionCountry: USAWeb site: http://hazard.com/msds2/
University of Uppsala, Department of Occupational and Environmental MedicineCountry: SwedenWeb site: http://www.occmed.uu.se/english/index.html
REFERENCES
1. European Community. Council Directive 67/548/EEC, Commission of the European Community,Luxembourg (1967).
2. A. H. Verschoor and L. Reijnders. Occup. Hyg. 4, 161 (1998).3. ICME. International Workshop on Risk Assessment of Metals and Their Inorganic Compounds,
Angers, ICME, Toronto (1996).4. K. S. Crump. Fundam. Appl. Toxicol. 4, 854 (1984).5. C. A. Kimmel and D. W. Gaylor. Risk Analysis 8, 15 (1988).6. ACGIH Worldwide. TLVs® and BEIs® - Threshold Limit Values for Chemical Substances and
Physical Agents and Biological Exposure Indices. ACGIH Worldwide, Cincinnati (2001).7. Deutsches Forschungsgemeinschaft. Maximum Concentrations at the Workplace and Biological
Tolerance Values. VCH, Weinheim (1998).8. European Commission. Technical Guidance Document in Support of Commission Directive
93/67/EEC on Risk Assessment for New Notified Substances and Commission Regulation (EC) No1488/94 on Risk Assessment for Existing Substances. Office for Official Publications of theEuropean Communities, Luxembourg (1996).
9. J. M. Christensen and O. M. Poulsen. Sci. Tot. Environ. 150, 95 (1994).
© 2001 IUPAC, Pure and Applied Chemistry 73, 993–1031
Risk assessment for occupational exposure to chemicals 1027

10. E. Hassler. Exposure to Cadmium and Nickel in an Alkaline Battery Factory - As Evaluated fromMeasurements in Air and Biological Material, Karolinska Institute, Stockholm (1983).
11. M. E. G. L. Lumens, P. Ulenbelt, H. M. A. Geron, R. F. M. Herber. Int. Arch. Occup. Environ.Health 64, 509 (1993).
12. M. E. G. L. Lumens, P. Ulenbelt, R. F. M. Herber, T. F. Meijman. Appl. Occup. Environ. 9, 53(1994).
13. P. Ulenbelt, M. E. G. L. Lumens, H. M. A. Geron, R. F. M. Herber, S. Broersen, R. L. Zielhuis.Int. Arch. Occup. Environ. Health 62, 203 (1990).
14. P. Ulenbelt, M. E. G. L. Lumens, H. M. A. Geron, R. F. M. Herber. Int. Arch. Occup. Environ.Health 63, 89 (1991).
15. S. Kezic, A. C. Monster, A. J. W. Verplanke, F. A. de Wolff. Hum. Exp. Toxicol. 15, 396 (1996).16. S. Kezic, K. Mahieu, A. C. Monster, F. A. de Wolff. Occup. Environ. Med. 54, 38 (1997).17. E. Olsen and L. Seedorf. Ann. Occup. Hyg. 34, 379 (1990).18. A. Fredenslund, J. Gmehling, P. Rasmussen. Vapor-Liquid Equilibria Using UNIFAC, Elsevier,
Amsterdam (1977).19. R. C. Reid, J. M. Prausnitz, B. E. Poling. The Properties of Gases and Liquids, McGraw-Hill,
New York (1987).20. E. Olsen, E. Wallstrom, J. Rasmussen, I. Olsen, G. Mortensen. The SUBTEC-software Package
Manual. Danish Working Environment Service, Copenhagen (1992).21. E. Olsen, I. Olsen, E. Wallstrom, D. Rasmussen. Ann. Occup. Hyg. 36, 637 (1992).22. Health and Safety Executive. COSHH Essentials: Easy Steps to Control Hazardous Substances,
The Stationery Office, Norwich (1999).23. O. M. Poulsen, E. Olsen, J. M. Christensen, P. Vinzent, O. H. Petersen. Occup. Environ. Med. 52,
827 (1995).24. E. Olsen. Analyst 121, 1155 (1996).25. H. Kromhout, E. Symanski, S. M. Rappaport. Ann. Occup. Hyg. 37, 253 (1993).26. European Committee for Standardisation. Workplace atmospheres - guidance for the assessment
of exposure by inhalation to chemical agents for comparison with limit values and measurementstrategy - EN 689, ECS, Brussels (1995).
27. B. Harvey (Ed.). Croner’s Handbook of Occupatonal Hygiene. Croner CCH, Kingston-upon-Thames (2001).
28. World Health Organization. Biomarkers and Risk Assessment; Concepts and Principles - EHC155. Environmental Health Criteria, WHO, Geneva (1993).
29. J. Kristiansen and J. M. Christensen. Clin. Biochem. 35, 371 (1998).30. R. M. Russell, S. C. Maidment, I. Brooke, M. D. Topping. Ann. Occup. Hyg. 42, 367 (1998).31. I. M. Brooke. Ann. Occup. Hyg. 42, 377 (1998).32. J. G. Bell, C. Bishop, M. Gann, M. J. Gilbert, W. Howe, C. T. Lamb, G. Leighton-Davies, N. I.
P. McKie, I. Picton-Robinson. Occup. Med. 45, 305 (1995).33. R. D. Kimbrough, K. R. Mahaffey, P. Grandjean, S.-H. Sandoe, D. D. Rutstein. Clinical Effects
of Environmental Chemicals, Hemisphere, New York (1989).34. International Programme on Chemical Safety. International Chemical Safety Cards, Commission
of the European Union, Luxembourg (1993 onwards).35. European Union. Council Directive 89/391/CEC on Risk Inventory and Evaluation (RIE),
Commission of the European Union, Luxembourg (1989).36. World Health Organization. Evaluation of Certain Veterinary Drug Residues in Food (38th
Meeting of JECFA), WHO, Geneva (1991).37. International Programme on Chemical Safety. Environmental Health Criteria 6: Principles and
Methods for Evaluating the Toxicity of Chemicals, Part 1, WHO, Geneva (1978).38. B. C. Allen, R. J. Kavlock, C. A. Kimmel, E. M. Faustman. Fundam. Appl. Toxicol. 23, 487 (1994).39. J. H. Duffus. Pure Appl. Chem. 65(9), 2003 (1993).
R. F. M. HERBER et al.
© 2001 IUPAC, Pure and Applied Chemistry 73, 993–1031
1028
40. USEPA. Fed. Regist. 57(104), 22888 (1992).41. R. L. Zielhuis and P. T. Henderson. Int. Arch. Occup. Environ. Health 57, 249 (1986).42. D. Henschler. Occupational Toxicants: Commission for the Investigation of Health Hazards of
Chemical Compounds in the Work Area, VCH, Weinheim (1991).43. C. J. M. Poole. Occup. Med. 46, 245 (1996).44. European Commission. Information Notices on Diagnosis of Occupational Diseases. ECSC-EC-
EAEC, Luxembourg (1994).45. D.G. Barnes and M. Dourson. Reg. Toxicol. Pharmacol. 8, 471 (1988).46. World Health Organization. Glossary of Terms on Chemical safety for Use in IPCS Publications,
WHO, Geneva (1989).
FURTHER READING
A. Aitio. “Biological monitoring today and tomorrow”, Scand. J. Work Environ. Health 20, specialissue, 46 (1994).
H. Andrews. Croner’s Risk Assessment, Croner, Kingston-upon-Thames (1999).P. Arlien-Soberg. Solvent Neurotoxicity, CRC, Boca Raton (1992).P. J. Baxter, P. H. Adams, T.-C. Aw, A. Cockcroft, J. M. Harrington. Hunter’s Diseases of Occupations,
Edward Arnold, London, (2000).P. J. Boogaard, G. D. J. Beulink, N. J. van Sittert. “Biological monitoring of exposure to 3-chloro-4-flu-
oroaniline by determination of a urinary metabolite and a haemoglobin adduct”, Environ. HealthPerspect. 102, 23 (1994).
P. J. Boogaard and N. J. van Sittert. “Biological monitoring of occupational exposure to benzene: Acomparison between S-phenylmercapturic acid, trans, trans-muconic acid, and phenol”, Occup.Environ. Med. 52, 611 (1995).
R. P. Bos, P. J. M. Sessink. Biomonitoring of occupational exposure to cytostatic anticancer drugs. Rev.Environ. Health 12, 43 (1997).
P. Brochard and J. Bignon. “Proposal of a tiered approach to assessing and classifying the health riskof exposure to fibres”, Annal. Occup. Hyg. 39, 737 (1995).
J. M. Christensen. “Human exposure to toxic metals: Factors influencing interpretation of biomonitor-ing results”, Sci. Tot. Environ. 166, 89 (1995).
G. D. Clayton and F. E. Clayton (Eds.). Patty’s Industrial Hygiene and Toxicology, Wiley, New York,10 volumes (1991).
Council of the European Communities. Council directive of 27 November 1980 on the protection ofworkers from the risk related to exposure to chemicals, physical and biological agents at work(80/1107/EEC). Off. J. Eur. Communities L 327, 8 (1980).
DIPPR. Data Compilation of Pure Compound Properties, Version 6.0. National Institute of Standardand Technology, Gaithersburg (1998).
J. H. Duffus and H. G. J. Worth (Eds.). Fundamental Toxicology for Chemists, The Royal Society ofChemistry, Cambridge (1996).
J. S. Evans, J. D. Graham, G. M. Gray, R. L. Sielken, Jr. “A distributional approach to characterizinglow-dose cancer risk”, Risk Anal. 14, 25 (1994).
V. Foa and A. Ferioli. “Chemicals at low doses and disease”, Medicina del Lavoro 81, 11 (1990).P. I. M. Foster and T. R Auton. “Application of the benchmark dose risk assessment methodology to
development toxicology: An industrial view”, Toxicol. Lett. 82/83, 555 (1995).B. D. Goldstein. “Biological markers and risk assessment”, Drug Metabol. Rev. 28, 225 (1996).G. B. Gori. “Whither risk assessment?”, Regulat. Toxicol. Pharmacol. 17, 224 (1993).F. Goyal, K. Krishnan, F. Tardif, S. Lapare, J. Brodeur. “Assessment of occupational health risk during
unusual workshifts: Review of the needs and solutions for modifying environmental and biolog-ical limit values for volatile organic solvents”, Can. J. Publ. Health 83, 109 (1992).
© 2001 IUPAC, Pure and Applied Chemistry 73, 993–1031
Risk assessment for occupational exposure to chemicals 1029

Y. M. Hallenbeck. Quantitative Risks Assessment for Environmental and Occupational Health, LewisPublishers, Boca Raton (1993).
B. Harvey (Ed.). Croner’s Handbook of Occupational Hygiene, Croner, Kingston-upon-Thames (1999).D. Henschler. Occupational Toxicants, Commission for the investigation of health hazards of chemical
compounds in the work area. VCH, Weinheim, 4 volumes (1991).R. F. M. Herber and M. Stoeppler (Eds.). Trace Element Analysis in Biological Specimens, Elsevier,
Amsterdam (1994).N. W. Hurst. Risk Assessment: The Human Dimension, The Royal Society of Chemistry, Cambridge
(1998)International Agency for Research on Cancer (IARC). Monographs on the evaluation of carcinogenic
risks to humans, International Agency on Research for Cancer, Lyon, 70 titles.International Labour Organization. Encyclopaedia of Occupational Health and Safety, 2nd ed., ILO,
Geneva (1998).International Programme on Chemical Safety (IPCS). Environmental Health Criteria (EHC). Published
under the joint sponsorship of the United Nations Environment Program, the International LaborOrganization, and the World Health Organization. Over 200 titles on compounds and methods(1976 onwards).
International Standard Organization. Guide to Expression of Uncertainty in Measurement (GUM), ISO,Geneva (1993).
J. Jankovic and F. Drake. “A screening method for occupational reproductive health risk”, Am. Ind. Hyg.Assoc. J. 57, 641 (1996).
R. D. Kimbrough. “Uncertainties in risk assessment”, Appl. Occup. Environ. Hyg. 6, 759 (1991).C. D. Klaassen (Ed.). Casarett and Doull’s Toxicology. The Basic Science of Poisons, 5th ed., McGraw-
Hill, New York (1998).K. Kogi. “Workplace strategies for the control of work-related risks”, Environ. Res. 63, 88 (1993).J. Kristiansen, J. M. Christensen, B. S. Iversen, E. Sabbioni. “Toxic trace element reference levels in
blood and urine: Influence of gender and lifestyle factors”, Sci. Total Environ. 204, 147 (1997).F. N. Laird. “Risk assessment and occupational health: Conceptual problems”, Ann. NY Acad. Sci. 572,
79 (1989).J. Lewalter. “n-Alkylvaline levels in globin as a new type of biomarker in risk assessment of alkylating
agents”, Int. Arch. Occup. Environ. Health 68, 519 (1996).D. Mackay and R. S. Matsugu. “Evaporation rates of liquid hydrocarbon spills on land and water”, Can.
J. Chem. Eng. 51, 434 (1973).S. Maes, F. Kittel, H. Scholten, C. Verhoeven. “Healthier work at Brabantia: A comprehensive approach
to wellness at the worksite”, Safety Sci. 15, 351 (1990).M. Maroni. “The use of human exposure and health data for improving the toxicological risk assess-
ment of pesticides and their regulatory control”, Medicina del Lavoro 81, 450 (1992).M. A. Mehlman (Ed.). Advances in Modern Environmental Toxicology, Princeton Scientific, Princeton,
25 volumes (1981–1998).R. J. M. Niesink, J. de Vries, N. I. A. Hoffinger. Toxicology Principles and Applications, CRC, Boca
Raton (1996).F. Nielsen, E. Olsen, Aa. Fredenslund. “Prediction of isothermal evaporation rates of pure volatile
organic compounds in occupational environments: A theoretical approach based on laminarboundary layer theory”, Ann. Occup. Hyg. 39, 497 (1995).
E. Olsen, I. Olsen, E. Wallstrom, D. Rasmussen. “On the substitution of chemicals. Use of the SUB-FAC-index for volatile substances”, Ann. Occup. Hyg. 36, 637 (1992)
E. Olsen and B. Jensen. “On the concept of the ‘normal’ day. Quality control of occupational hygienemeasurements”, Appl. Occup. Environ. Hyg. 9, 245 (1994).
E. Olsen. “Analysis of exposure using a logbook method”, Appl. Occup. Environ. Hyg. 9, 712 (1994).
R. F. M. HERBER et al.
© 2001 IUPAC, Pure and Applied Chemistry 73, 993–1031
1030

J. V. Rodricks. Calculated Risks. The Toxicity and Human Health Risks of Chemicals in ourEnvironment, Cambridge University Press, Cambridge (1995).
L. Rosenstock and N. I. R. Cullen (Eds.). Textbook of Clinical Occupational and EnvironmentalMedicine, Saunders, Philadephia (1994).
J. Saari. “Risk assessment and risk evaluation and the training of OHS professionals”, Safety Sci. 20,183 (1995).
H. G. Seiler, A. Sigel, H. Sigel (Eds.). Handbook on Metals in Clinical and Analytical Chemistry,Dekker, New York (1994).
P. J. M. Sessink, A. J. W. Verplanke, R. F. M. Herber, R. P. Bos. “Occupational exposure to antineo-plastic agents and parameters of renal dysfunction”, Int. Arch. Occup. Environ. Health 69, 215(1997).
N. J. van Sittert and E. W. N. van Vliet. “Monitoring occupational exposure to some industrial chemi-cals by determination hemoglobin adducts”, Clin. Chem. 40, 1472 (1994).
C. M. Smith, D. C. Christian, K. T. Kelsey. Chemical Risk Assessment and Occupational Health,Auburn House, Westport (1994).
N. H. Stacey (Ed.). Occupational Toxicology, Taylor and Francis, Basingstoke (1993).A. J. W. Verplanke and R. F. M. Herber. “Effects on the kidney of occupational exposure to styrene”,
Int. Arch. Occup. Environ. Health 71, 47 (1998)A. J. W. Verplanke, M. H. L. Leummens, R. F. M. Herber. “Occupational exposure to tetrachloroethene
and is effects on the kidneys”, J. Occup. Environ. Med. 41, 11 (1999).World Health Organization. Biological Monitoring of Chemical Exposure in the Workplace, Vol. 1,
WHO, Geneva (1996).
© 2001 IUPAC, Pure and Applied Chemistry 73, 993–1031
Risk assessment for occupational exposure to chemicals 1031