Risk Assessment and Mitigation Program Data Sources Last ...
21
Risk Assessment and Mitigation Program – Data Sources Overview Last Updated: September 2021 Risk Assessment and Mitigation Program Data Sources Last Updated: September 2021 This document provides an overview of key data sources frequently considered by the California Department of Fish and Wildlife (CDFW) and California Dungeness Crab Fishing Gear Working Group (Working Group) when assessing marine life entanglement risk and appropriate management actions under the Risk Assessment and Mitigation Program (§132.8, Title 14, California Code of Regulations). Sources used to evaluate whether risk is elevated (i.e. triggers under §132.8(c)) are discussed first, followed by other available data which may inform assessment of management considerations under §132.8(d). This is not a comprehensive list of all data under consideration for a given risk assessment, and not all data are available for a given risk assessment. This document will be periodically updated as new information becomes available or data collection methods are altered. Contents Confirmed Entanglements: §132.8(c)(1).................................................................................... 2 National Marine Fisheries Service (NMFS) Reports ............................................................... 2 Marine Life Concentrations: §132.8(c)(2).................................................................................. 3 Aerial Surveys: Line Transect, Reconnaissance ..................................................................... 4 Small Vessel Surveys ............................................................................................................. 7 Satellite Telemetry ................................................................................................................ 8 Monterey Bay Whale Watch ................................................................................................. 9 Fishing Season dynamics: §132.8(d)(7) ................................................................................... 11 Domoic Acid Testing ............................................................................................................ 11 Quality Testing .................................................................................................................... 12 CDFW Databases: Landing Receipts and Permitting Information ........................................ 12 Mandatory Bi-Weekly Reporting ......................................................................................... 14 Electronic Monitoring.......................................................................................................... 14 Forage distribution and abundance: §132.8(d)(8) ................................................................... 16 California Current Integrated Ecosystem Assessment Indices ............................................. 16 Ocean conditions: §132.8(d)(9) ............................................................................................... 16 Habitat Compression Index ................................................................................................. 16 Coastal Upwelling Transport Index (CUTI) ........................................................................... 17 North Pacific High (NPH) ..................................................................................................... 18
Transcript of Risk Assessment and Mitigation Program Data Sources Last ...

Risk Assessment and Mitigation Program – Data Sources Overview Last Updated: September 2021
Risk Assessment and Mitigation Program Data Sources Last Updated: September 2021
This document provides an overview of key data sources frequently considered by the
California Department of Fish and Wildlife (CDFW) and California Dungeness Crab Fishing Gear
Working Group (Working Group) when assessing marine life entanglement risk and appropriate
management actions under the Risk Assessment and Mitigation Program (§132.8, Title 14,
California Code of Regulations). Sources used to evaluate whether risk is elevated (i.e. triggers
under §132.8(c)) are discussed first, followed by other available data which may inform
assessment of management considerations under §132.8(d). This is not a comprehensive list of
all data under consideration for a given risk assessment, and not all data are available for a
given risk assessment. This document will be periodically updated as new information becomes
available or data collection methods are altered.
Contents
Confirmed Entanglements: §132.8(c)(1) .................................................................................... 2
National Marine Fisheries Service (NMFS) Reports ............................................................... 2
Marine Life Concentrations: §132.8(c)(2).................................................................................. 3
Aerial Surveys: Line Transect, Reconnaissance ..................................................................... 4
Small Vessel Surveys ............................................................................................................. 7
Satellite Telemetry ................................................................................................................ 8
Monterey Bay Whale Watch ................................................................................................. 9
Fishing Season dynamics: §132.8(d)(7) ................................................................................... 11
Domoic Acid Testing ............................................................................................................ 11
Quality Testing .................................................................................................................... 12
CDFW Databases: Landing Receipts and Permitting Information ........................................ 12
Mandatory Bi-Weekly Reporting ......................................................................................... 14
Electronic Monitoring.......................................................................................................... 14
Forage distribution and abundance: §132.8(d)(8) ................................................................... 16
California Current Integrated Ecosystem Assessment Indices ............................................. 16
Ocean conditions: §132.8(d)(9) ............................................................................................... 16
Habitat Compression Index ................................................................................................. 16
Coastal Upwelling Transport Index (CUTI) ........................................................................... 17
North Pacific High (NPH) ..................................................................................................... 18

Risk Assessment and Mitigation Program – Data Sources Overview Last Updated: September 2021
Oceanic Nino Index (ONI) .................................................................................................... 18
California Current Marine Heatwave Tracker ...................................................................... 18
Actionable Species migration into or out of Fishing Grounds and across Fishing Zones:
§132.8(d)(11) .......................................................................................................................... 19
Point Blue Conservation Science Whale Observations and Mapping Tool .......................... 19
WhaleWatch 2.0 .................................................................................................................. 20
Confirmed Entanglements: §132.8(c)(1)
National Marine Fisheries Service (NMFS) Reports In close coordination with members of the West Coast Large Whale Entanglement Response
Network, NMFS staff provide summaries of large whale and Pacific leatherback sea turtle
entanglements that are reported to NMFS, along with any specific details or documentation
from individual entanglement cases needed to support RAMP discussions. Summaries are
typically provided for the current fishing season and calendar year, however data from previous
years may also be shared to provide historical context (see Appendix 1 of the April 7, 2020 Data
Compilation for an example).
Information provided may relate to both confirmed and unconfirmed reports. Confirmed
reports are those reports which meet one or more of the following criteria (from Saez et al.
2020):
- Photo or video of gear on the entangled animal
- Direct visual observation by NOAA staff
- Reported by a trusted source (trained or professional reporting party)
- Reporting source was interviewed by an experienced member of the large whale
entanglement response network or NMFS expert, and the information provided is
detailed and specific enough to confirm the entanglement
- Multiple sources provided reports with detailed descriptions of the animal and
entanglement
Confirmed reports often, but not always, include sufficient information for NMFS to positively
identify the species entangled; if not, these are categorized as “unidentified whale.” Depending
on the type of information available about the entangling material, NMFS may attribute the
entanglement to a specific fishery (e.g. California commercial Dungeness crab), a general
category (e.g. gillnet), or categorize it as “unidentified” (e.g. dark colored rope). Pursuant to
Section 132.8(a)(4) and Section 132.8(c)(1)(A), Confirmed Entanglements will be evaluated
separately depending on whether NOAA confirms them in California commercial Dungeness
crab gear or in Unknown Fishing Gear. For the purposes of evaluating elevated risk and need for
management action under the RAMP, CDFW will not consider Confirmed Entanglements which
NMFS attributes to other fisheries or non-fishery origins.

Risk Assessment and Mitigation Program – Data Sources Overview Last Updated: September 2021
Marine Life Concentrations: §132.8(c)(2) Marine Life Concentrations will be evaluated at the Fishing Zone level (see Figure 1). The
following are sources which will be considered by CDFW to assess attainment of triggers
specified in the RAMP regulations. Other sources of Marine Life Concentrations information are
described under 132.8(d)(6) and 132.8(d)(11).
Figure 1. RAMP Fishing Zones. Map showing latitudinal boundaries of each Fishing Zone, as defined in Section 132.8(a)(7). All Fishing Zones extend to 200 nautical miles offshore.

Risk Assessment and Mitigation Program – Data Sources Overview Last Updated: September 2021
Aerial Surveys: Line Transect, Reconnaissance Multiple aerial survey methods are used to inform assessment of marine life entanglement risk.
Each method has distinct caveats, and is therefore summarized separately.
Distance Sampling: Line Transects
To date, line transects have been used by Working Group Advisors from the National Marine
Fisheries Service Southwest Fisheries Science Center. The methodology is based on a well-
established sampling technique known as distance sampling. All objects of interest (e.g. large
whales, leatherback sea turtles, trap buoys) which can be viewed from the plane are counted,
as is the location from which the observation is made (e.g. side window, belly window). The
angle of each observation is recorded, which is paired with the height of the plane to calculate
the distance between the plane and the object. Based on the frequency of sighting a particular
object (e.g. Humpback whale) at a given distance, after correcting for group size and sea
conditions, the effective strip width is calculated. By summing the effective strip widths,
compared to the total area surveyed, the number of observed objects can be used to estimate
the total number of objects within the surveyed area. Observations and transect lines are also
plotted to assess spatial distribution of the observations and assess overlap (Figures 2-4).
One key assumption of distance sampling is that transect lines proportionally sample available
habitat. Surveys are flown along lines perpendicular to the coast or in a zig-zag pattern between
two depth contours, to ensure even sampling across all depth ranges.
Due to the importance of being able to detect and accurately measure distances to objects,
surveys are only flown during calm sea states and low wind conditions.
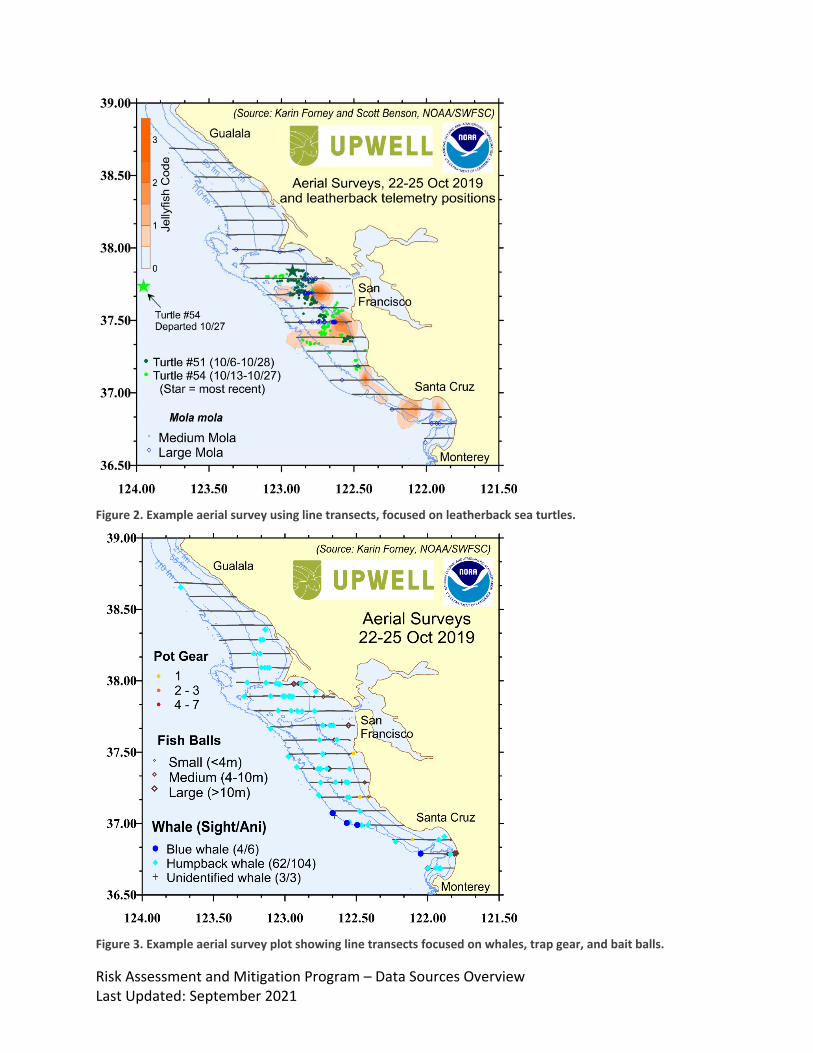
The primary targets of these surveys are whales, Pacific leatherback sea turtles, and available
forage (bait balls, jelly blooms, etc). If sufficient observers are present, trap gear is also
recorded. Due to the speed and altitude at which the plane is flying, buoy configurations or
markings which might identify the gear as belonging to a particular fishery cannot always be
documented. Therefore, neither the observed nor estimated total number of traps should be
interpreted as reflecting the total amount of commercial Dungeness crab gear.
Risk Assessment and Mitigation Program – Data Sources Overview Last Updated: September 2021
Figure 2. Example aerial survey using line transects, focused on leatherback sea turtles.
Figure 3. Example aerial survey plot showing line transects focused on whales, trap gear, and bait balls.

Risk Assessment and Mitigation Program – Data Sources Overview Last Updated: September 2021
Figure 4. Example aerial survey plot showing zig-zag transect method.
Reconnaissance
Reconnaissance flights have been used by CDFW, Lighthawk, and the US Coast Guard. Flights
may utilize perpendicular line transects, zig-zag transects, or follow specified depth contours
(e.g. flying the 30 fathom contour north to south and the 50 fathom contour south to north).
Regardless of the transect design, observations are used to estimate relative abundance and
identify hotspots with a high concentration of Actionable Species. However, effective strip
widths are not calculated, and the surveys are not used to estimate total presence of a given
species within the surveyed area. Additionally, trap gear abundance and distribution are
assessed qualitatively, rather than the census approach during line transect surveys.

Risk Assessment and Mitigation Program – Data Sources Overview Last Updated: September 2021
Small Vessel Surveys Small vessel surveys are periodically conducted by Cascadia Research Group and other partners
(Figure 5). Transects typically follow both a shallower (e.g. 70m) and deeper (e.g. 200m) depth
contour to assess the spatial distribution of large whales across multiple depths. All sightings of
Humpback whales and Blue whales are recorded, as well as unidentified whales and other
species of interest. In addition to sightings information, researchers document prey species
when animals are observed foraging at the surface. Photographs are taken to allow for
identification of individual humpback whales and assignment to a specific Distinct Population
Segment. Satellite telemetry tags are opportunistically deployed, allowing tracking of individual
animal movements and inference of foraging behavior. These additional sources of information
are considered under Section 132.8(d)(6) and 132.8(d)(8).
Figure 5. Example small vessel survey plot showing transect lines and sightings information.
During the 2020-21 fishing season, industry members are piloting a similar small-vessel survey
on commercial fishing vessels focused on assessing abundance and distribution of Humpback
and Blue whales along both inshore and offshore transects. Findings are considered under
Section 132.8(d)(11).

Risk Assessment and Mitigation Program – Data Sources Overview Last Updated: September 2021
Satellite Telemetry In contrast to large whales, Pacific leatherback sea turtles are rare and cryptic. Due to their low
profile, Pacific leatherback sea turtles are very difficult to encounter from a ship unless the sea
state is unusually calm. Aerial platforms provide a better means for finding Pacific leatherback
sea turtles but even this method has its limitations because the effective strip half-width is only
about 260 meters on each side of the aircraft, therefore, satellite telemetry is a superior means
for obtaining information about the presence of leatherback turtles. Furthermore, unlike vessel
or aerial survey observations, which provide a snapshot of animal distributions at a given time,
satellite telemetry also allows for long-term tracking of individual animals. Within the context
of RAMP, satellite telemetry has focused on tracking Pacific leatherback sea turtles. Aerial
surveys are used to locate Pacific leatherback sea turtles foraging off central California during
the summer and early fall, and small vessels are used to approach and capture the animal to
directly attach a transmitter to the carapace (or shell). The transmitter reports the animal’s
location at specified intervals until the attachment or batteries fail. Movement patterns and
current position can be viewed from a web interface (see Figure 6), allowing continuous near
real-time assessment of the animal’s position and any directional movement patterns (e.g.
migration in or out of the foraging grounds).
As the number of concurrently tagged animals increases, there is increased confidence
observations are representative of the overall patterns for the population foraging off California
during the summer and fall months. Pacific leatherback sea turtles return to their western
Pacific nesting beaches every 3-5 years. Those that do not engage in trans-Pacific movements
return to California foraging grounds during the spring and early summer months. Tags that
persist until the spring and early summer can provide an indication of when Pacific leatherback
sea turtles are likely to return to Dungeness crab fishing grounds.
Figure 6. Fastlock GPS positions for tagged leatherback sea turtle from October 6 to December 2, 2019.

Risk Assessment and Mitigation Program – Data Sources Overview Last Updated: September 2021
Monterey Bay Whale Watch Sightings on commercial whale watching trips and research surveys by Nancy Black are
reported on a publicly available website. Karin Forney (National Marine Fisheries Service
Southwest Fisheries Science Center) compiles new postings into a database which contains
reported sightings from 2003 to present.
Data is summarized as a time series of daily sightings (blue bars), standardized to half-day trips
(see Figure 7). The figure includes the 7-day running average (red line) to make it easier to
discern patterns. Green lines are added on November 15th of each year (the typical start date of
the commercial Dungeness crab season), and x-axis tick marks are at one-month intervals. Plots
are prepared for each large whale species (humpback, blue, and gray). Plots may be re-scaled to
include only more recent data to make it easier to identify trends (see Figure 8).
Figure 7. Example plot of Monterey Bay Whale Watch data for humpback whales, expanded time series.

Risk Assessment and Mitigation Program – Data Sources Overview Last Updated: September 2021
Figure 8. Example plot of Monterey Bay Whale Watch data for humpback whales, shorter time series.
Another type of plot (Figure 9) presents bi-monthly (1st – 15th, 15th- end of the month) averages
of sightings from 2003 to present. The boxplots are formatted according to standard statistical
practice; the horizontal black line is the average number of whales, the blue box shows the 24th
– 75th percentiles (i.e. half of all past averages fall within the box), and outliers are shown as
black dots. Average values for more recent years may be overlaid on top of the boxplots to
show them in historical context. Plots are prepared separately for each large whale species.
These are generally considered under Section 132.8(d)(6).

Risk Assessment and Mitigation Program – Data Sources Overview Last Updated: September 2021
Figure 9. Historical boxplots and recent bi-monthly averages for MBWW data.
Fishing Season dynamics: §132.8(d)(7)
Domoic Acid Testing Annual domoic acid testing of Dungeness crab begins at the end of September and results are
posted as PDF files on the California Department of Public Health (CDPH) website under
Analytical Data - Crabs. Currently, 17 locations are sampled between Crescent City and
Avila/Port San Luis. A sample contains a minimum of 6 Dungeness crab. If all crab viscera are
found to be at or below 30 ppm for domoic acid, that location will not be re-tested. If a sample
contains at least one crab that exceeds 30ppm in the viscera, then the site is retested. To clear
a site a minimum of two consecutive sets of crab samples must be collected at least a week
apart and all crab from both sets must be at or below 30 ppm domoic acid. Any location(s) that
does not clear in time for the season start date would result in a delay of the corresponding
Biotoxin Management Area(s) from the Director via a recommendation from the health
agencies of the Office of Environmental Health Hazard Assessment and CDPH (Fish and Game
Code Section 5523). When a commercial closure is lifted, the Director is required to give the

Risk Assessment and Mitigation Program – Data Sources Overview Last Updated: September 2021
fleet a minimum of 72-hours notice before the fishery opens. If that opening day would land on
a state or federal holiday, the opener may be further postponed to avoid a holiday opener.
Each Biotoxin Management Area has at least one boundary line that aligns with a RAMP Fishing
Zone boundary. More information can be found on CDFW’s Update on Biotoxin Management.
Quality Testing Pre-season testing for crab quality (i.e. the amount of crab meat) could result in a delay of
RAMP Fishing Zones 1 and 2. Since crab that are harvested for the purposes of the quality test
can be sold, these locations must be cleared of domoic acid prior to scheduling the first round
of the quality test. Within each port area (Crescent City, Trinidad and Eureka), samples are
collected from the same locations as those used for domoic acid testing. The test is overseen by
CDFW in coordination with the fishery managers of Oregon and Washington under the Tri-State
agreement. Quality testing procedures are outlined in the latest PSMFC protocol (see the “Crab
tests” section). Results of the coastal crab quality tests are also posted at this PSMFC website.
For a port to pass the quality test and open without delay, the average meat recovery
percentage must be at or above 24% (no rounding). If a given port does not meet this minimum
value, then the Director will delay the opener for that area (Fish and Game Code Section
8276.2) after consulting with the other Tri-State managers.
Quality delays occur in 15-day increments, and the season cannot be delayed due to low quality
after January 15. Initial quality tests for California typically occur at the end of October, in order
to inform whether the scheduled December 1 opener should be delayed to December 16. In
some instances, an additional round of testing may occur in mid-November, with a target
completion date of November 15, to further inform decisions regarding the December 1
opener. If an area is delayed due to low quality, additional rounds of testing are scheduled for
completion by December 7 (to inform a December 31 opener) and December 22 (to inform a
final delay until January 15).
CDFW Databases: Landing Receipts and Permitting Information All commercial fishing activity must be documented on a landing receipt, which must be
submitted electronically through Pacific States Marine Fisheries Commission’s E-Tix platform
within 3 business days. Data is transferred twice per day to CDFW’s Marine Landings Data
System (MLDS), where it is available to CDFW staff for extraction and analysis.
Error-checking procedures are implemented throughout the fishing season, however there may
be delays between identification and correction of errors. All landings data is preliminary until
official publication of the annual CDFW commercial landing report the following year.
CDFW typically summarizes data at the weekly level (starting with the first day the season was
open). In light of the delays between the landing date and data availability, and to avoid
presenting incomplete data, summaries do not include information from partial weeks. This
means data from up to two weeks prior to data extraction will be withheld.
Risk Assessment and Mitigation Program – Data Sources Overview Last Updated: September 2021
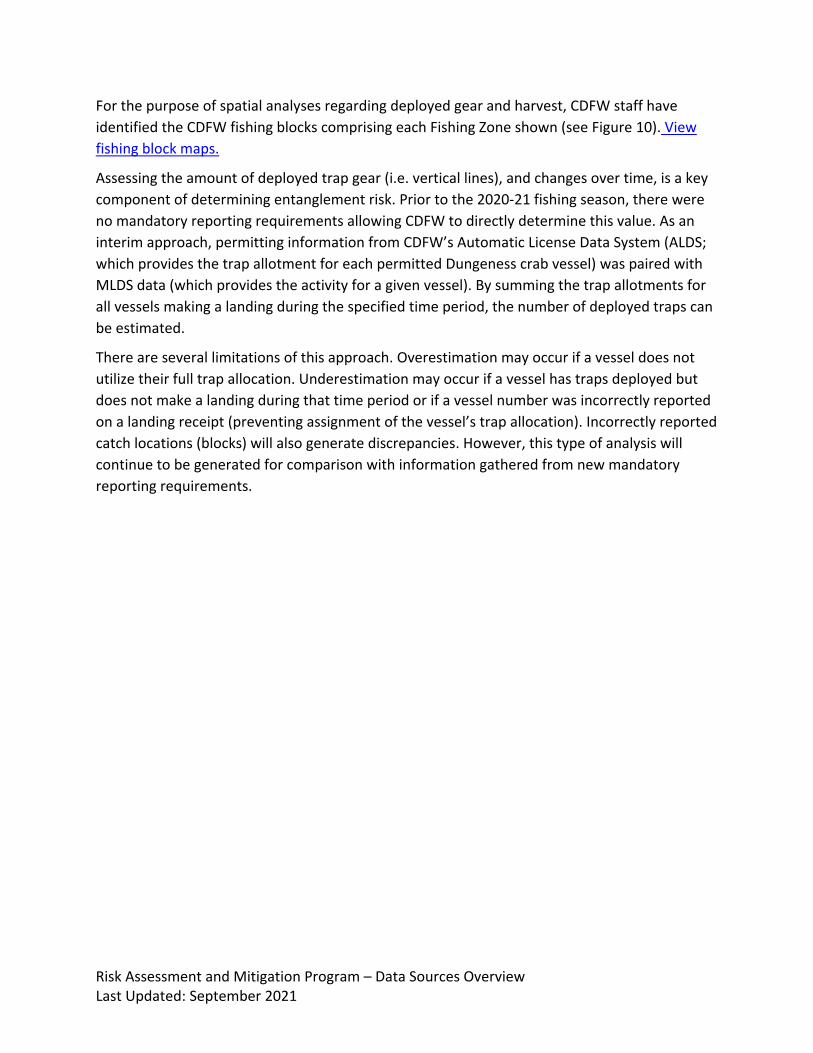
For the purpose of spatial analyses regarding deployed gear and harvest, CDFW staff have
identified the CDFW fishing blocks comprising each Fishing Zone shown (see Figure 10). View
fishing block maps.
Assessing the amount of deployed trap gear (i.e. vertical lines), and changes over time, is a key
component of determining entanglement risk. Prior to the 2020-21 fishing season, there were
no mandatory reporting requirements allowing CDFW to directly determine this value. As an
interim approach, permitting information from CDFW’s Automatic License Data System (ALDS;
which provides the trap allotment for each permitted Dungeness crab vessel) was paired with
MLDS data (which provides the activity for a given vessel). By summing the trap allotments for
all vessels making a landing during the specified time period, the number of deployed traps can
be estimated.
There are several limitations of this approach. Overestimation may occur if a vessel does not
utilize their full trap allocation. Underestimation may occur if a vessel has traps deployed but
does not make a landing during that time period or if a vessel number was incorrectly reported
on a landing receipt (preventing assignment of the vessel’s trap allocation). Incorrectly reported
catch locations (blocks) will also generate discrepancies. However, this type of analysis will
continue to be generated for comparison with information gathered from new mandatory
reporting requirements.

Risk Assessment and Mitigation Program – Data Sources Overview Last Updated: September 2021
Figure 10. Map showing assignment of CDFW Fishing Blocks to RAMP Fishing Zones.
Mandatory Bi-Weekly Reporting Section 132.8(g)(1) requires all vessels participating in the California commercial Dungeness
crab fishery to submit electronic reports on or before the first and 16th day of each month. The
reports include the Dungeness crab vessel permit number, current Fishing Zone, depth range,
and number of traps deployed at the time of reporting. CDFW staff review and compile these
reports to produce summary tables, charts, and figures.
Electronic Monitoring Section 132.8(g)(2)(A) requires all vessels operating under a depth constraint or using
Alternative Gear must have an operational electronic monitoring system. Section 132.8(g)(2)(B)

Risk Assessment and Mitigation Program – Data Sources Overview Last Updated: September 2021
expands the electronic monitoring requirement to all vessels participating in the commercial
Dungeness crab fishery beginning with the 2023-24 season. While specific devices or
manufacturers are not identified, the system must meet requirements for ping rate, data
collection, and data retention.
Solar Loggers
Through a grant from the Ocean Protection Council, electronic monitoring devices have been
installed on multiple commercial fishing and whale watch vessels. These solar-powered
instruments, known as “solar loggers”, automatically collect positional information every few
seconds. Data is then uploaded via cellphone networks to Pelagic Data Systems, which
aggregates data to produce a variety of map-based summaries.
Review of solar logger data by fishery participants has informed development of filters which
enable specific portions of each vessel track to be classified as either transiting or fishing
activity (see Figure 11), and to distinguish between fishing for Dungeness crab or other species.
Figure 11. Example map showing transiting and fishing activity for vessels based in Half Moon Bay.
Vessel position information is presented in two main forms: track lines or cumulative time
within specified cells. The cumulative time analyses allow assessment of overlap between
fishing effort (i.e. time spent fishing for Dungeness crab; see Figure 12) and large whale
presence (inferred by the total time spent in the area by whale watch vessels).

Risk Assessment and Mitigation Program – Data Sources Overview Last Updated: September 2021
Figure 12. Example map showing estimated fishing effort (in hours) for vessels based in Half Moon Bay.
Forage distribution and abundance: §132.8(d)(8)
California Current Integrated Ecosystem Assessment Indices Relative abundance of krill and anchovy is assessed during the annual NOAA Southwest
Fisheries Science Center Rockfish Recruitment and Ecosystem Assessment Surveys. Midwater
trawls are deployed during the spring and early summer at defined sampling stations which
cover both coastal and offshore waters. Data for central California are available from 1990 on,
allowing for comparison of current values with historical conditions and trends.
Higher coastal abundance of forage species increases entanglement risk by increasing the
probability large whales will congregate in nearshore areas and overlap with fishing activity.
Conversely, abundant offshore or widespread foraging opportunities are associated with
reduced entanglement risk.
Ocean conditions: §132.8(d)(9)
Habitat Compression Index The Habitat Compression Index (HCI) uses sea surface temperature output from the Regional
Ocean Modeling System to calculate the area of cool surface water (< 12 °C) and track available
coastal upwelling habitat on a monthly basis. Cool expansion periods are defined as months
where area exceeds +1 standard deviation (SD) of the full time series (1980 – present) and
limited cool habitat as months where area is less than -1 SD. Habitat compression (months
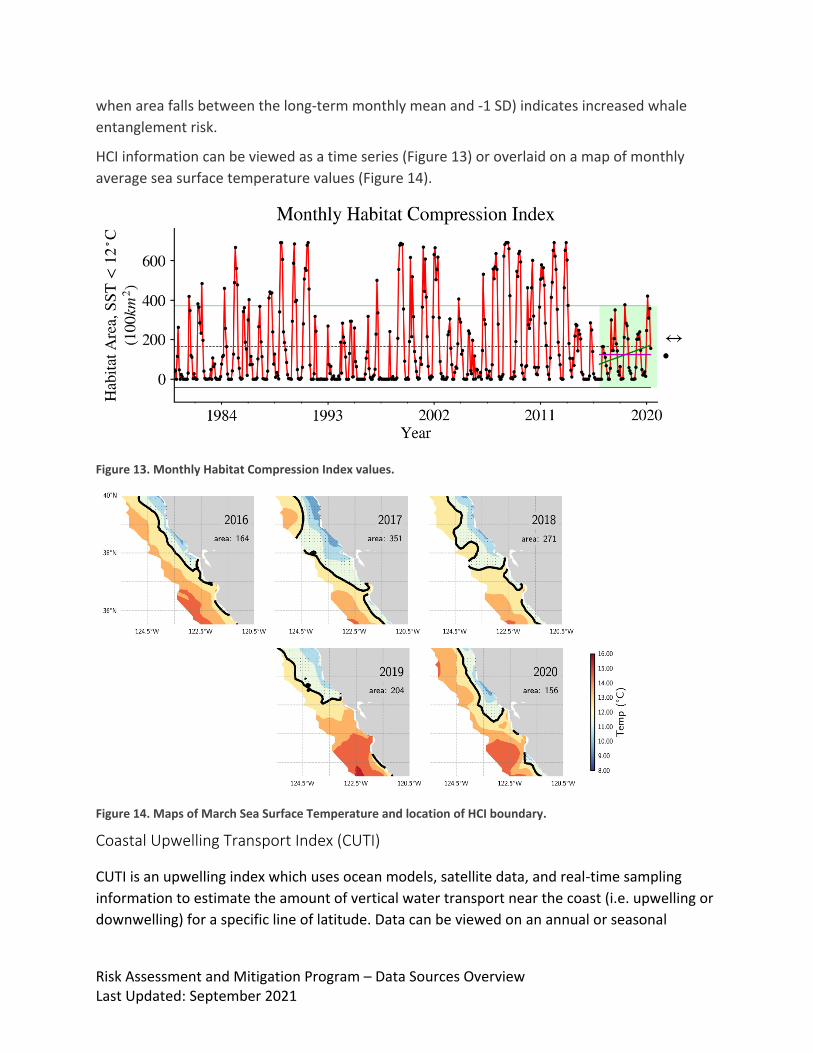
Risk Assessment and Mitigation Program – Data Sources Overview Last Updated: September 2021
when area falls between the long-term monthly mean and -1 SD) indicates increased whale
entanglement risk.
HCI information can be viewed as a time series (Figure 13) or overlaid on a map of monthly
average sea surface temperature values (Figure 14).
Figure 13. Monthly Habitat Compression Index values.
Figure 14. Maps of March Sea Surface Temperature and location of HCI boundary.
Coastal Upwelling Transport Index (CUTI)
CUTI is an upwelling index which uses ocean models, satellite data, and real-time sampling
information to estimate the amount of vertical water transport near the coast (i.e. upwelling or
downwelling) for a specific line of latitude. Data can be viewed on an annual or seasonal

Risk Assessment and Mitigation Program – Data Sources Overview Last Updated: September 2021
timescale. Higher values indicate greater upwelling, which is associated with more productive
foraging conditions for large whales and sea turtles.
North Pacific High (NPH)
Variations in large-scale atmospheric forcing influence upwelling dynamics and ecosystem
productivity off California. The NPH is a semi-permanent area of high pressure (> 1020 Pascals)
in the North Pacific Ocean. Variation in both the size and location of the NPH affects the timing
and strength of coastal upwelling off California. Winter NPH values (January – February mean)
provide an early indication of likely upwelling conditions during the spring and summer.
Oceanic Nino Index (ONI)
The ONI is a 3-month running mean of Sea Surface Temperature (SST) anomalies in the Nino 3.4
region (120°-150°W and 5°N-5°S). Positive values indicate higher-than-average SST (aka El Niño
conditions). Negative values indicate lower-than-average SST (aka La Niña conditions).
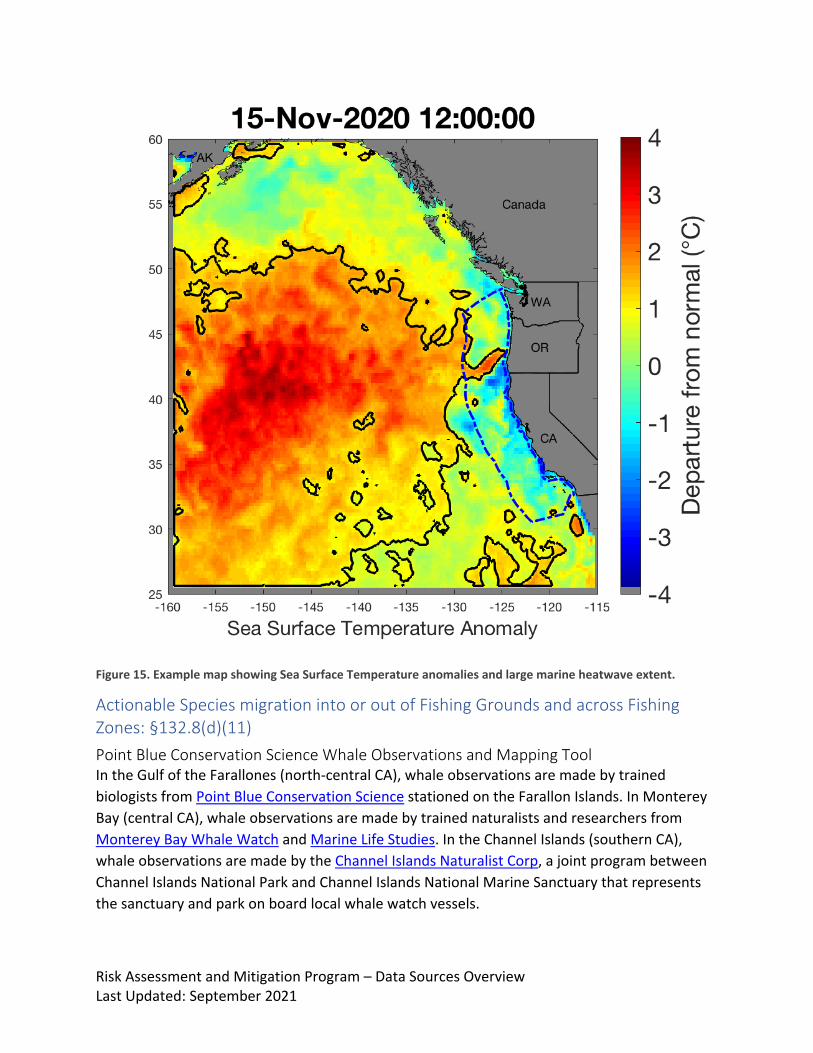
California Current Marine Heatwave Tracker
Marine heatwaves occur when ocean temperatures are warmer than usual (based on location
and time of year) for an extended period of time. A large marine heatwave event which began
in 2014 and persisted until mid-2016, colloquially known as “the blob” resulted in a large
number of ecosystem impacts and helped drive the increased numbers of large whale
entanglements seen during those years. The NOAA Integrated Ecosystem Assessment
program’s Blob Tracker webpage provides maps (Figure 15) and analysis describing SST
anomalies in the Northeastern Pacific and any large marine heatwave events.
Risk Assessment and Mitigation Program – Data Sources Overview Last Updated: September 2021
Figure 15. Example map showing Sea Surface Temperature anomalies and large marine heatwave extent.
Actionable Species migration into or out of Fishing Grounds and across Fishing Zones: §132.8(d)(11)
Point Blue Conservation Science Whale Observations and Mapping Tool In the Gulf of the Farallones (north-central CA), whale observations are made by trained
biologists from Point Blue Conservation Science stationed on the Farallon Islands. In Monterey
Bay (central CA), whale observations are made by trained naturalists and researchers from
Monterey Bay Whale Watch and Marine Life Studies. In the Channel Islands (southern CA),
whale observations are made by the Channel Islands Naturalist Corp, a joint program between
Channel Islands National Park and Channel Islands National Marine Sanctuary that represents
the sanctuary and park on board local whale watch vessels.

Risk Assessment and Mitigation Program – Data Sources Overview Last Updated: September 2021
In all cases, whale sightings are entered using a mobile application that records the whale
species and count, time and GPS location of the observation. The record is stored in the mobile
device until there is access to a phone network. Once the observation is transmitted, it takes
about two hours for Point Blue Conservation Science to harvest the data and update the map.
Once on the mapping tool, observations can be filtered and summarized by location, species
and time period.
Data is typically visualized with a map displaying recent sightings for key whale species
(humpback whales and blue whales), over either the last 7 day or 30 day period (Figure 16).
Each white dot represents a single report, which may include sightings of multiple individuals.
In the online data portal, clicking on one of these dots will display additional information (e.g.
observation date and number of individuals by species).
Figure 16. Screenshot of the Point Blue Conservation Science Data Portal, showing Humpback Whale observations for Monterey Bay.
Sightings from all three areas can be used as a proxy for humpback whale migration trends and
distribution patterns (e.g. onshore/offshore). The systematic nature of the counts for the
Farallon and Channel Islands means observations can also be used to assess trends in
abundance and distribution. In Monterey Bay, the same individual may be counted multiple
times by different whale watch companies, or the same company on multiple days.
WhaleWatch 2.0 WhaleWatch 2.0 is a web-hosted map which generates daily predictions of the spatial
distribution of blue whales along the entire California coast (Figure 17). These predictions are
based on a collection of models which predict suitable blue whale habitat based on current
ocean conditions. Better habitat (aka higher likelihood of blue whale presence) is indicated by
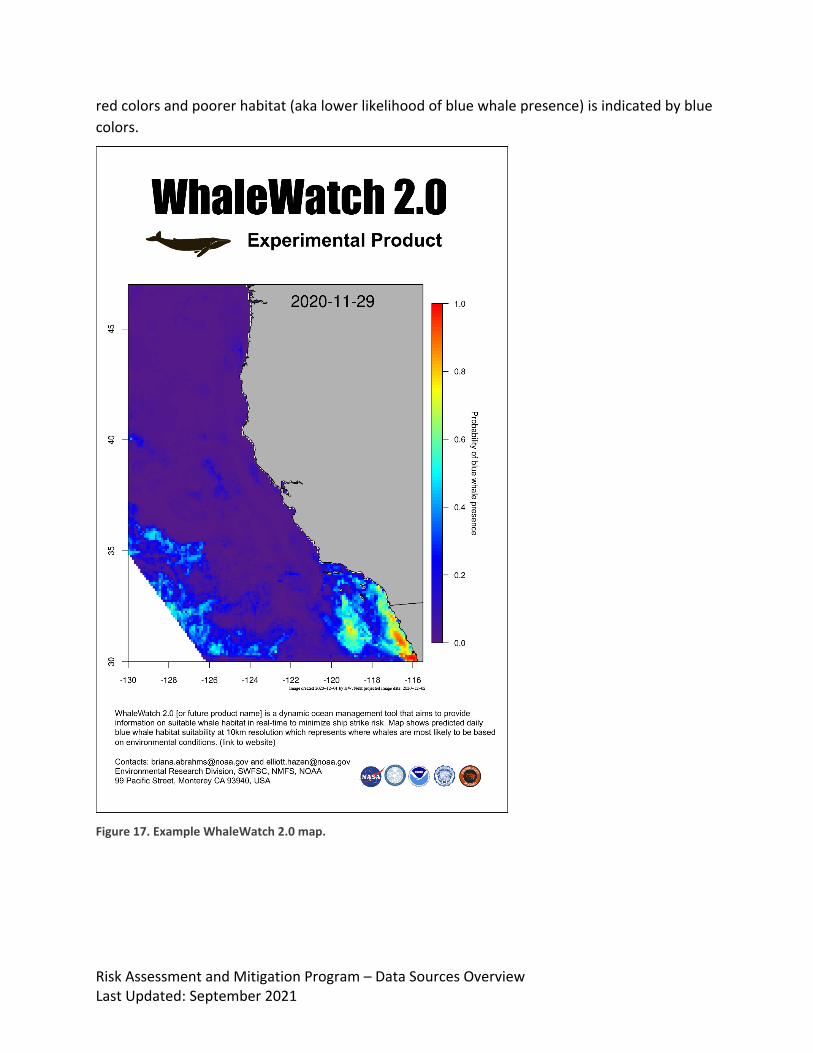
Risk Assessment and Mitigation Program – Data Sources Overview Last Updated: September 2021
red colors and poorer habitat (aka lower likelihood of blue whale presence) is indicated by blue
colors.
Figure 17. Example WhaleWatch 2.0 map.