Risk and Value in Banking and Insurance - Roma Tre...
47
Università Luigi Bocconi Risk and Value in Banking and Insurance Operational Risk
Transcript of Risk and Value in Banking and Insurance - Roma Tre...

Università Luigi Bocconi
Risk and Value in Banking and Insurance
Operational Risk
Oper
atio
nal R
isk
Agenda
• Operational risk: definition • Peculiarities of operational risk • Measuring operational risk • From OR measurement to OR management • The Basel Committee capital requirements

3
OR: a definition problem
Some major banks’ definitions • “The risk that deficiencies in info systems or internal controls will
result in unexpected loss. The risks associated with human error, systems failure and inadequate procedures and controls”
• “The potential of any activity to damage the organization, including physical, financial and legal risks”
• “Risk that deficiencies in information systems or internal controls will result in financial loss, failure to meet regulatory requirements or an adverse impact on the bank’s reputation”
• “The risk of loss through inadequate systems, controls and procedures, human error or management failure”
• All risks which are not banking (ie it excludes credit, market, and trading risks, and those arising from business decisions etc.)
Oper
atio
nal R
isk
4
OR: definition
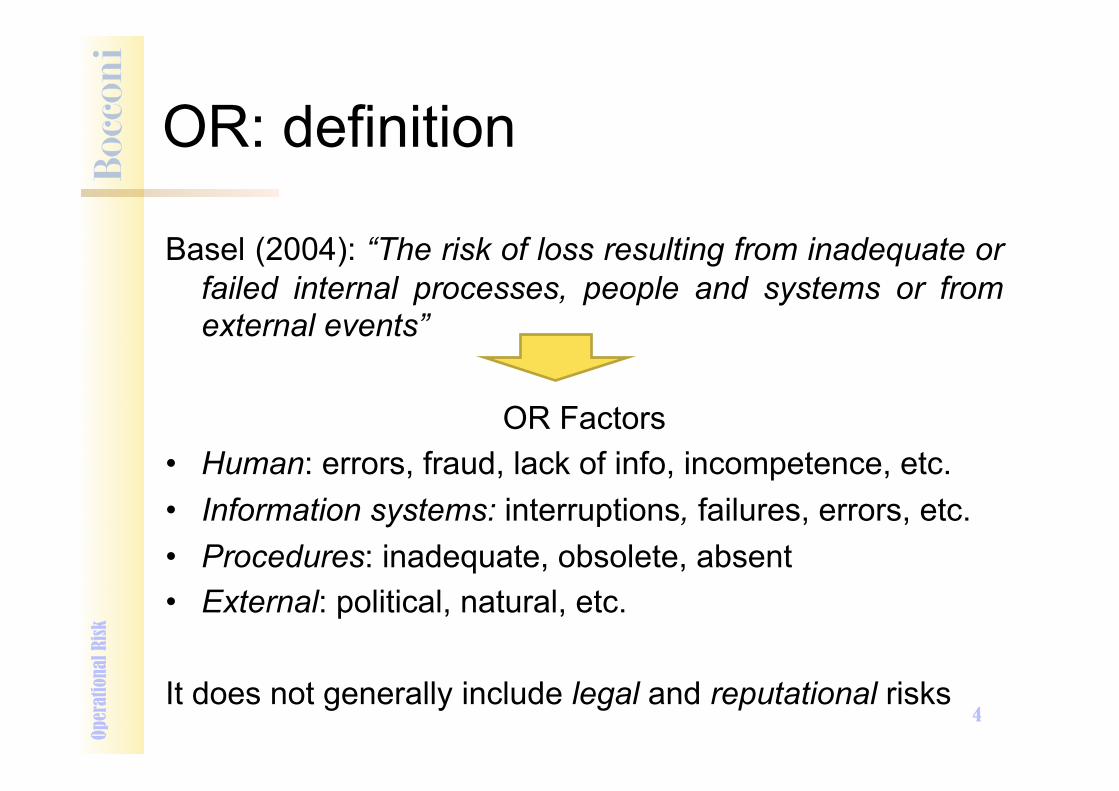
Basel (2004): “The risk of loss resulting from inadequate or failed internal processes, people and systems or from external events”
OR Factors
• Human: errors, fraud, lack of info, incompetence, etc. • Information systems: interruptions, failures, errors, etc. • Procedures: inadequate, obsolete, absent • External: political, natural, etc. It does not generally include legal and reputational risks
Oper
atio
nal R
isk
5
OR: some distinctive features
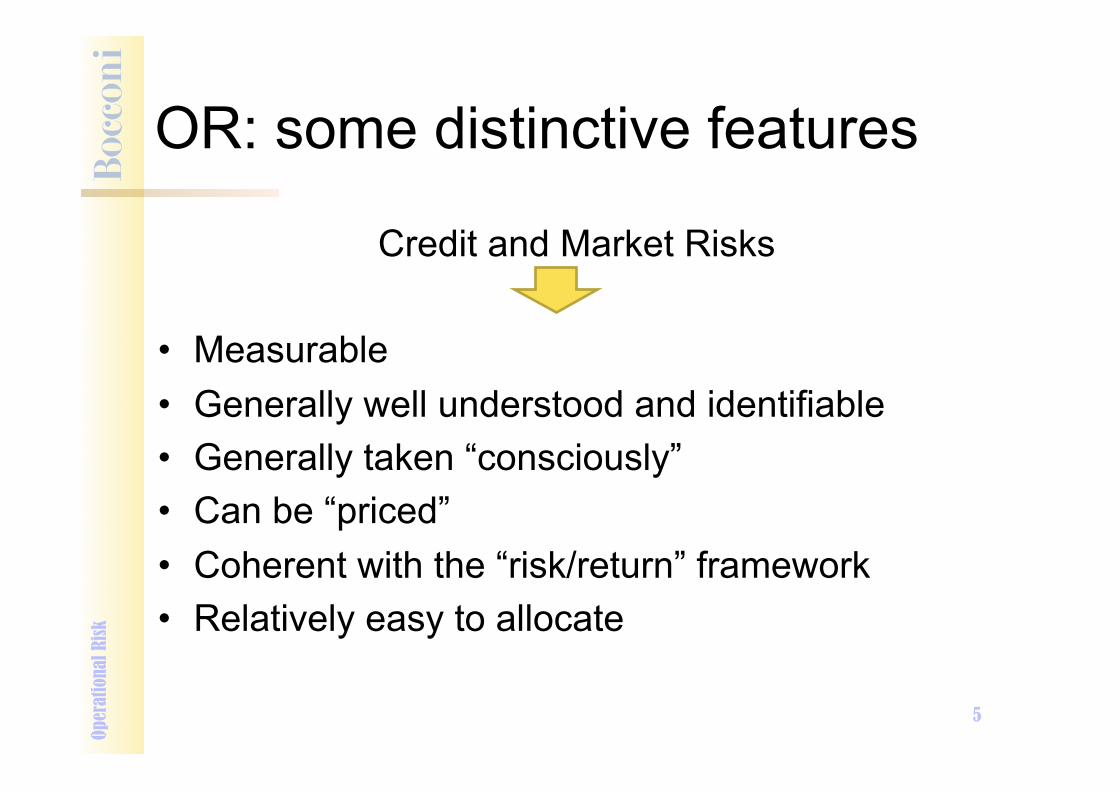
Credit and Market Risks
• Measurable • Generally well understood and identifiable • Generally taken “consciously” • Can be “priced” • Coherent with the “risk/return” framework • Relatively easy to allocate
Oper
atio
nal R
isk

6
OR: some distinctive features
Operational Risk
• Difficult to quantify • Generally poorly understood • Generally taken “inevitably” • Cannot be “priced” ! no liquid market • Not always coherent with the “risk/return”
framework
Oper
atio
nal R
isk

7
Measuring OR
Problems
• Some events have non-measurable consequences (e.g. loss of reputation)
• Lack of historical data • Some events are very rare (natural disasters) • History is often a poor indicator of future potential
events
Oper
atio
nal R
isk
8
Measuring OR
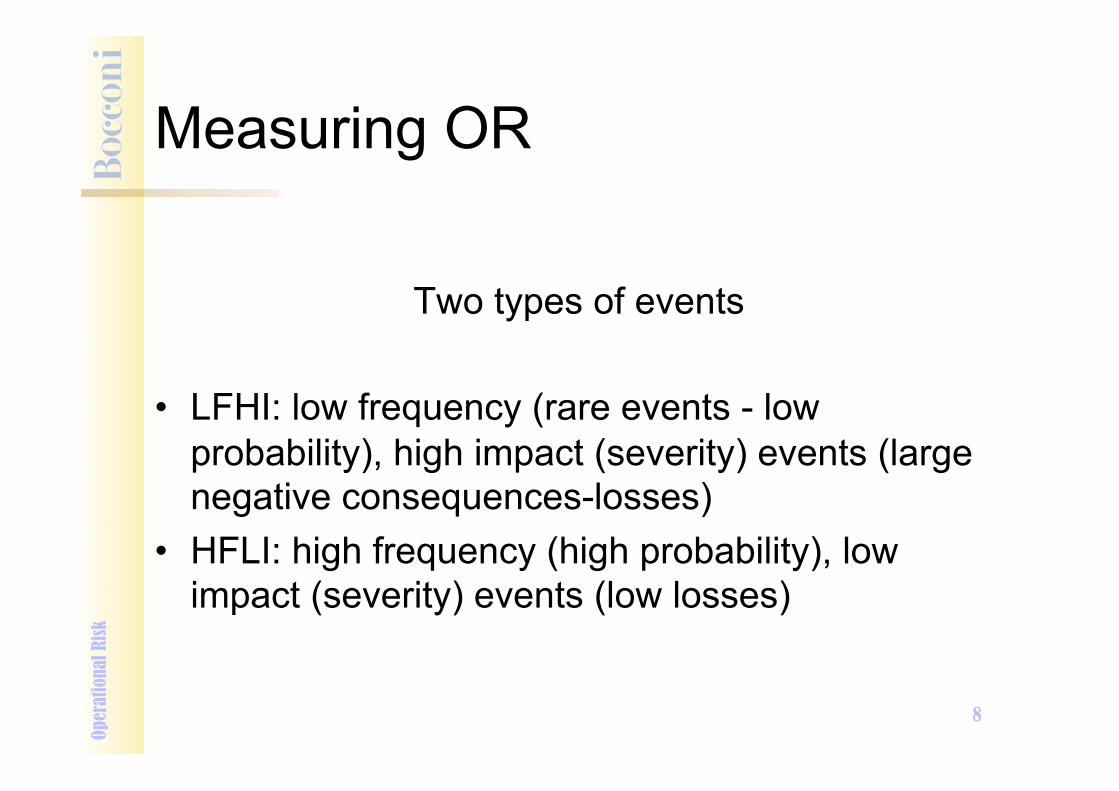
Two types of events
• LFHI: low frequency (rare events - low probability), high impact (severity) events (large negative consequences-losses)
• HFLI: high frequency (high probability), low impact (severity) events (low losses)
Oper
atio
nal R
isk

9
" Due to mismanagement in the day to day business activity " Can be reduced by improving efficiency/effectiveness of procedures " Expected losses can be estimated through an adequate data base
Severity
HFLI Events
" Low frequency often does not allow to understand what are the real causes behind them
" The lack of internal historical data requires to use external data sources
LFHI Events
Freq
uenc
y
Oper
atio
nal R
isk
Measuring OR

10
Measuring OR
Typical process structure 1. Identification of potential risk sources (mapping) 2. Estimate of event probability ! PE 3. Estimate of severity (amount of potential loss) !
LGE 4. Estimate of expected loss ! EL = PE x LGE 5. Estimate of unexpected loss (UL) and VaR/EC
Oper
atio
nal R
isk

11
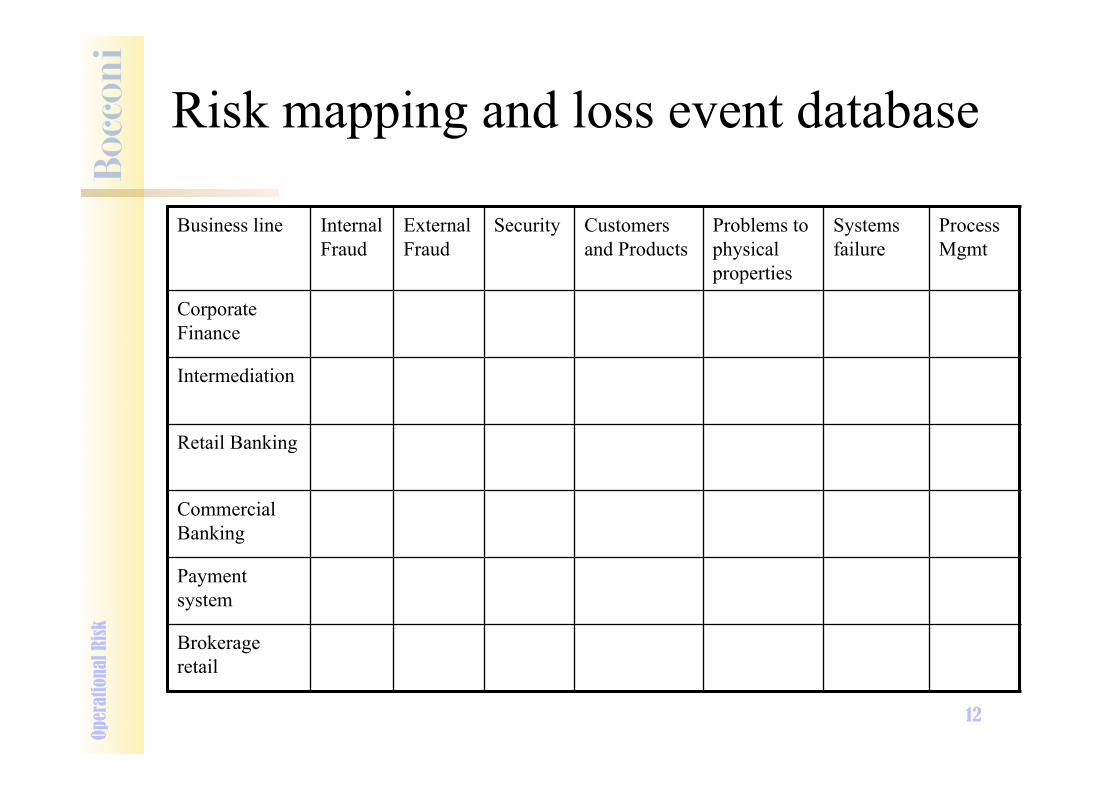
The first step is to build up a list of potential events Example: Internal Fraud • Theft • Disruption of goods • Falsification • Identity appropriation • Tax evasion • Corruption • Insider trading • Balance sheet alteration • Functional power abuse • Collusion
Identification of risk factors Op
erat
iona
l Risk
12
Risk mapping and loss event database
Business line Internal Fraud
External Fraud
Security Customers and Products
Problems to physical properties
Systems failure
Process Mgmt
Corporate Finance
Intermediation
Retail Banking
Commercial Banking
Payment system
Brokerage retail
Oper
atio
nal R
isk
13
Exposure Indicator Op
erat
iona
l Risk
• An exposure indicator can be used to estimate exposure, different for different business units
• It works as a scale variable, indicating how severe an operational loss could be, if it were to happen in a given business line and/or because of a certain type of risk factor.
• Examples: – total revenues – gross operating income – assets under management
14
Probability estimation
" For every risk factor and for all the business units we must estimate the probability associated to each risky event (PE)
" To estimate PE for each individual business unit or line and for every risk factor a qualitative evaluation and a rating can be used
" Similarly to credit risk, an OR rating can be used to estimate probability
" For HFLI events banks generally rely on internal data
" For LFHI events internal historical data are often not enough ! external data (data pooling)
Oper
atio
nal R
isk

15
Risk factor Qualitative rank
Rating (1= low risk;
10 = high risk)
Probability range
1. Human resources
- fraud Intermediate/Low 3 0,3%-0,5%
- incompetence Intermediate 5 1,0%-2,0%
- Rule violation High 9 7,0%-10,0%
2. Technology
- systems Intermediate 4 0,5%-1,0%
- programming mistakes Intermediate/High 8 5,0%-7,0%
- telecommunication Low 2 0,1%-0,3%
3. Process
- model risk High 10 >10,0%
- transaction risk Intermediate 6 2,0%-3,0%
- documentation risk Intermediate/Low 3 0,3%-0,5%
4. External factors
- political risk Low 1 0,0%-0,1%
- regulatory/fiscal risk Intermediate/High 8 5,0%-7,0%
- natural events Low 2 0,1%-0,3%
Example Op
erat
iona
l Risk

16
Internal Fraud External
Fraud Employment Practices and
Workplace Safety Clients,
Products and Business Services
Damage to Physical Assets
Business Disruption
and System Failure
Execution, Delivery and
Process Management
Total
Corporate Finance 4 (0,01%) 3
(0,01%) 16 (0,06%) 15
(0,05%) 8 (0,03%) 1
(0,00%) 33 (0,12%) 80
(0,29%)
Trading and Sales 16 (0,06%) 6
(0,02%) 37 (0,14%) 112
(0,41%) 10 (0,04%) 39
(0,14%) 1.114 (4,07%) 1.334
(4,87%)
Retail Banking 593 (2,17%) 7.798
(28,49%) 579 (2,12%) 1.273
(4,65%) 837 (3,06%) 570
(2,08%) 6.807 (24,87%) 18.457
(67,43%)
Commercial Banking 93 (0,34%) 1.180
(4,31%) 55 (0,20%) 66
(0,24%) 285 (1,04%) 474
(1,73%) 1.463 (5,35%) 3.616
(13,21%)
Payment and Settlement 22
(0,08%) 961 (3,51%) 9
(0,03%) 57 (0,21%) 40
(0,15%) 64 (0,23%) 752
(2,75%) 1.905 (6,96%)
Agency and Custody Services 6
(0,02%) 7 (0,03%) 12
(0,04%) 69 (0,25%) 17
(0,06%) 11 (0,04%) 356
(1,30% 478 (1,75%)
Asset Management 4 (0,01%) 4
(0,01%) 21 (0,08%) 35
(0,13%) _ 6 (0,02%) 360
(1,32%) 430 (1,57%)
Retail Brokerage 7 (0,03%) 2
(0,01%) 12 (0,04%) 122
(0,45%) 28 (0,10%) 291
(1,06%) 609 (2,22%) 1.071
(3,91%)
Total 745 (2,72%) 9.961
(36,39%) 741 (2,71%) 1.749
(6,39%) 1.225 (4,48%) 1.456
(5,32%) 11.494 (41,99%) 27.371
(100,00%)
Sample: 30 international banks Number of events for each BL and type of
event Op
erat
iona
l Risk
17
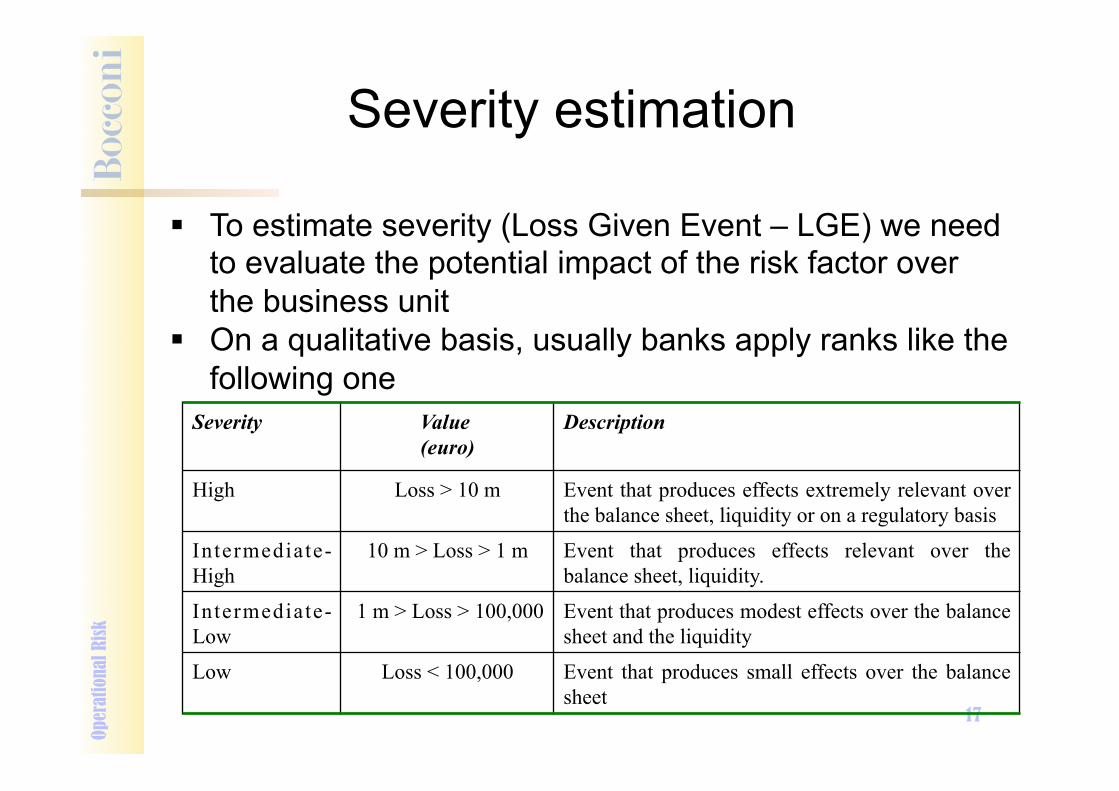
" To estimate severity (Loss Given Event – LGE) we need to evaluate the potential impact of the risk factor over the business unit
" On a qualitative basis, usually banks apply ranks like the following one
Severity estimation
Severity Value (euro)
Description
High Loss > 10 m Event that produces effects extremely relevant over the balance sheet, liquidity or on a regulatory basis
Intermediate-High
10 m > Loss > 1 m Event that produces effects relevant over the balance sheet, liquidity.
Intermediate-Low
1 m > Loss > 100,000 Event that produces modest effects over the balance sheet and the liquidity
Low Loss < 100,000 Event that produces small effects over the balance sheet
Oper
atio
nal R
isk
18
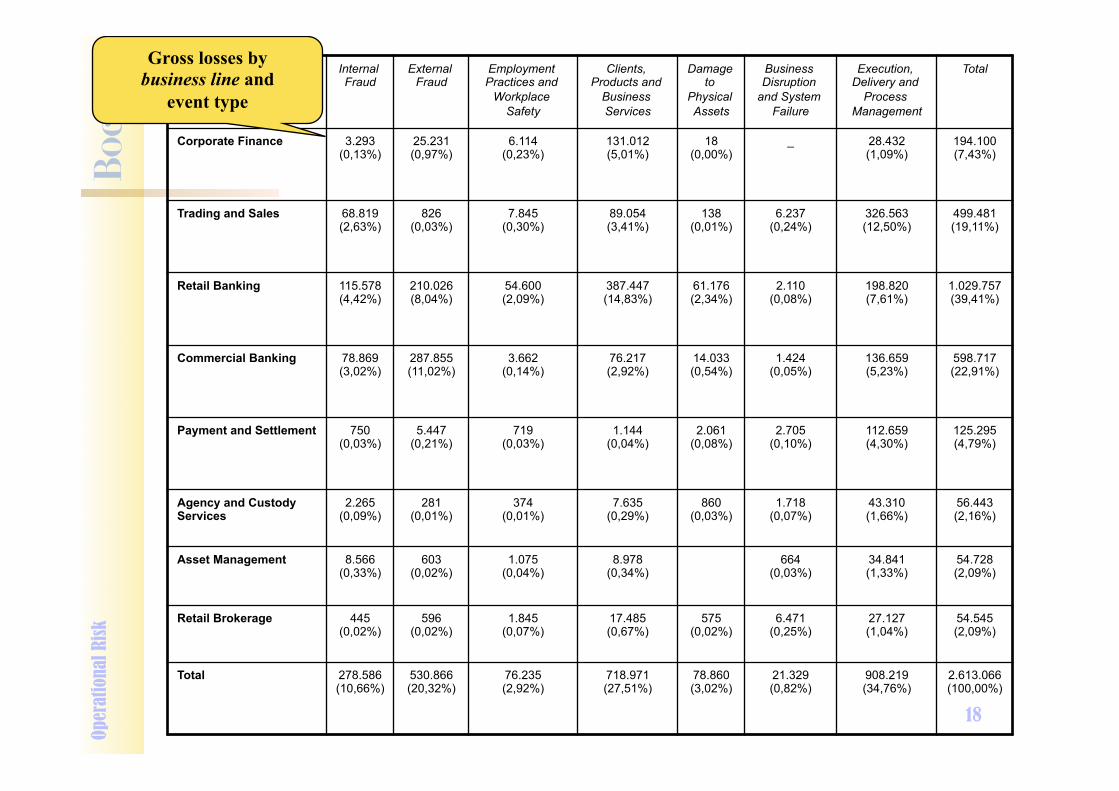
Internal Fraud External
Fraud Employment Practices and
Workplace Safety
Clients, Products and
Business Services
Damage to
Physical Assets
Business Disruption
and System Failure
Execution, Delivery and
Process Management
Total
Corporate Finance 3.293 (0,13%) 25.231
(0,97%) 6.114 (0,23%) 131.012
(5,01%) 18 (0,00%) _ 28.432
(1,09%) 194.100 (7,43%)
Trading and Sales 68.819 (2,63%) 826
(0,03%) 7.845 (0,30%) 89.054
(3,41%) 138 (0,01%) 6.237
(0,24%) 326.563 (12,50%) 499.481
(19,11%)
Retail Banking 115.578 (4,42%) 210.026
(8,04%) 54.600 (2,09%) 387.447
(14,83%) 61.176 (2,34%) 2.110
(0,08%) 198.820 (7,61%) 1.029.757
(39,41%)
Commercial Banking 78.869 (3,02%) 287.855
(11,02%) 3.662 (0,14%) 76.217
(2,92%) 14.033 (0,54%) 1.424
(0,05%) 136.659 (5,23%) 598.717
(22,91%)
Payment and Settlement 750 (0,03%) 5.447
(0,21%) 719 (0,03%) 1.144
(0,04%) 2.061 (0,08%) 2.705
(0,10%) 112.659 (4,30%) 125.295
(4,79%)
Agency and Custody Services 2.265
(0,09%) 281 (0,01%) 374
(0,01%) 7.635 (0,29%) 860
(0,03%) 1.718 (0,07%) 43.310
(1,66%) 56.443 (2,16%)
Asset Management 8.566 (0,33%) 603
(0,02%) 1.075 (0,04%) 8.978
(0,34%) 664 (0,03%) 34.841
(1,33%) 54.728 (2,09%)
Retail Brokerage 445 (0,02%) 596
(0,02%) 1.845 (0,07%) 17.485
(0,67%) 575 (0,02%) 6.471
(0,25%) 27.127 (1,04%) 54.545
(2,09%) Total 278.586
(10,66%) 530.866 (20,32%) 76.235
(2,92%) 718.971 (27,51%) 78.860
(3,02%) 21.329 (0,82%) 908.219
(34,76%) 2.613.066 (100,00%)
Gross losses by business line and
event type Op
erat
iona
l Risk

19
Info sources Op
erat
iona
l Risk
Table 5 – Information sources for the measurement of OR Probability of event (PE) Loss given event (LGE)
! Internal audit reports ! Internal historical events data ! Management reports ! Experts’ opinions (Delphi techniques1) ! Vendors’ estimates ! Budgets ! Business plans
! Management interviews ! Internal historical loss data ! Historical loss data from other banks or
consortium data series ! Industry benchmark ! External estimates (consultants,
dataproviders, vendors, etc.) Source: adapted from Crouhy, Galai, Mark (2000)
1 Delphi are iterative techniques aimed at developing consensus among different people which can be used to obtain a group estimate of the probability of future events.

20
The Basel Committee Survey
0,00%
10,00%
20,00%
30,00%
40,00%
50,00%
60,00%
70,00%C
orpo
rate
Fina
nce
Trad
ing
& S
ales
Ret
ail B
anki
ng
Com
me
rcia
l
Ban
king
Paym
ent
&
Set
tlem
ent
Age
ncy
&
Cus
tody
Ass
et
Man
agem
ent
Ret
ail B
roke
rage
Business line
Ripartizione % del numero d i eventi d i perd ita e de ll'importo medio de lle perd ite per business line (30 banche - 1998-2000)
Number of loss events Gross Loss Amount
Oper
atio
nal R
isk

21
0,00%
5,00%
10,00%
15,00%
20,00%
25,00%
30,00%
35,00%
40,00%
45,00%
InternalFraud
ExternalFraud
Employmentpractices &w orkplace
safety
Clients,products &
bus.services
Damage tophysicalassets
Bus.disruption &system fail.
Execution,delivery &process
mgmt
Tipo di evento rischioso
Distribuzione % numero eventi di perdita e perdite medie per tipo di evento - Dati relativi a 30 banche (1998-2000)
Number of loss events Gross Loss Amount
The Basel Committee Survey Op
erat
iona
l Risk
22
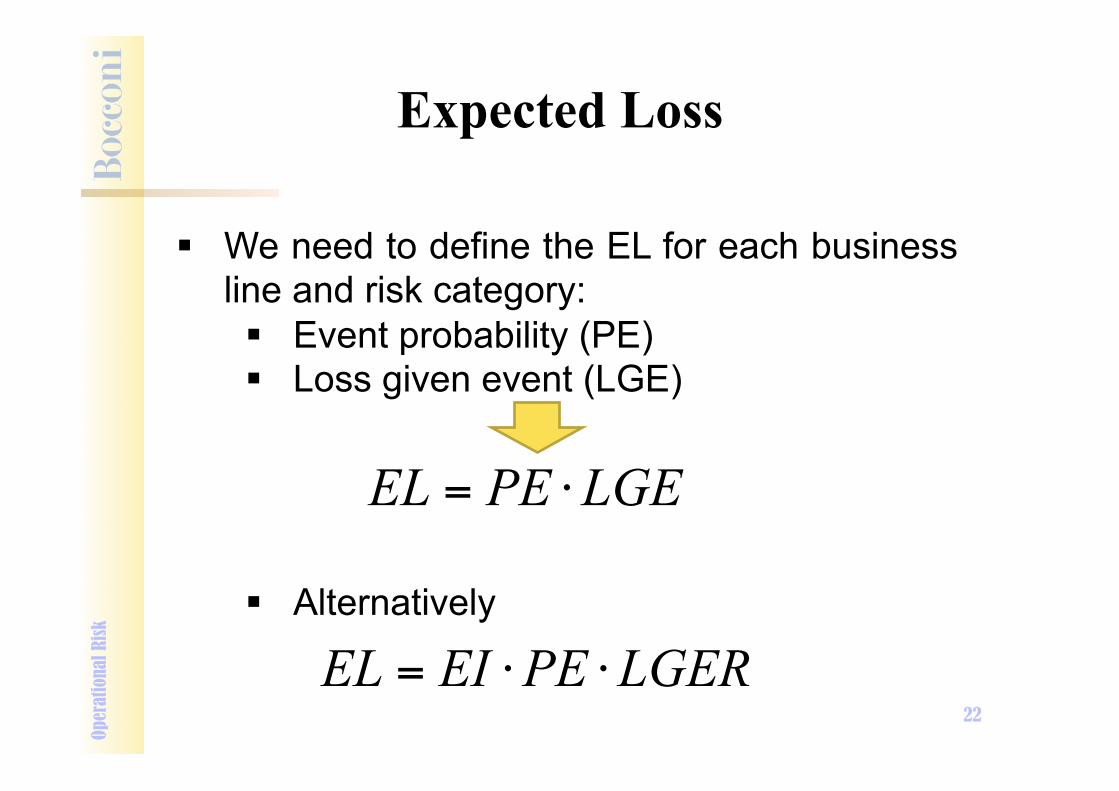
Expected Loss
" We need to define the EL for each business line and risk category: " Event probability (PE) " Loss given event (LGE)
" Alternatively
LGEPEEL ⋅=
Oper
atio
nal R
isk
LGERPEEIEL ⋅⋅=

23
Let us imagine 2 BU with the same EL but with different volatility
Business Unit A B
PE 0.2% 10%
LGE – ml euro 100 2
EL – ml euro 0.2 0.2
LFHI HFLI
Expected Loss Op
erat
iona
l Risk
24
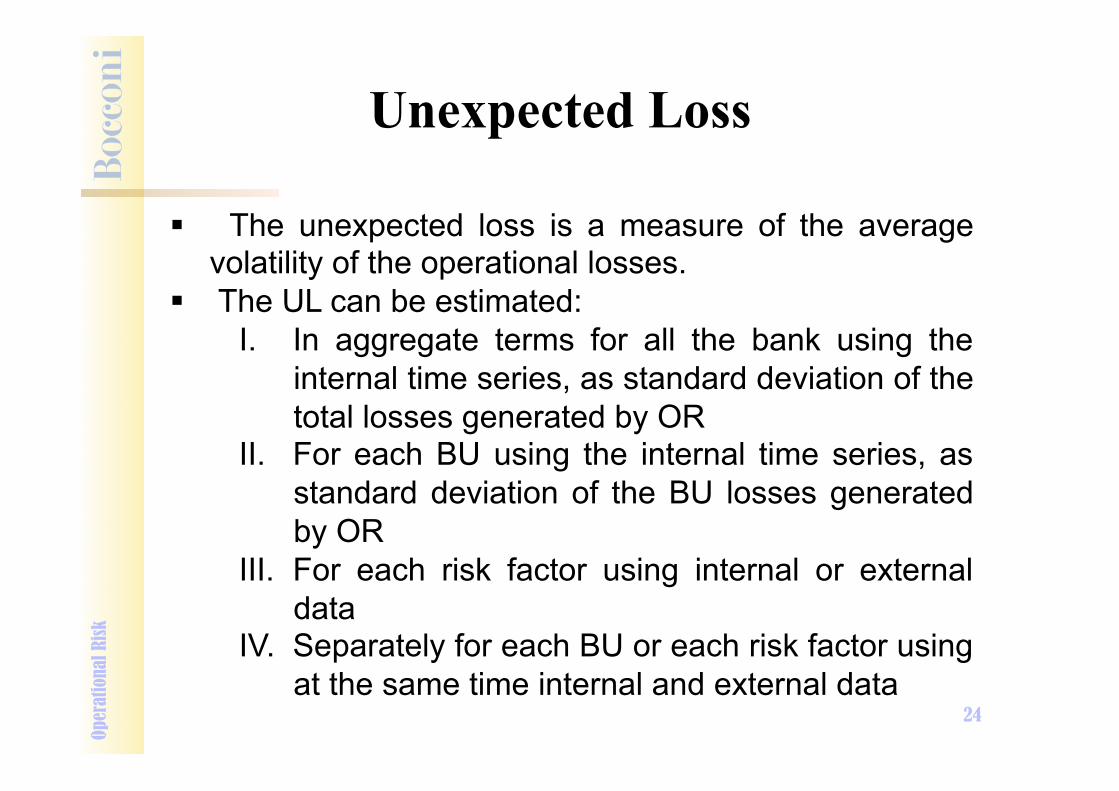
" The unexpected loss is a measure of the average volatility of the operational losses.
" The UL can be estimated: I. In aggregate terms for all the bank using the
internal time series, as standard deviation of the total losses generated by OR
II. For each BU using the internal time series, as standard deviation of the BU losses generated by OR
III. For each risk factor using internal or external data
IV. Separately for each BU or each risk factor using at the same time internal and external data
Unexpected Loss Op
erat
iona
l Risk
25
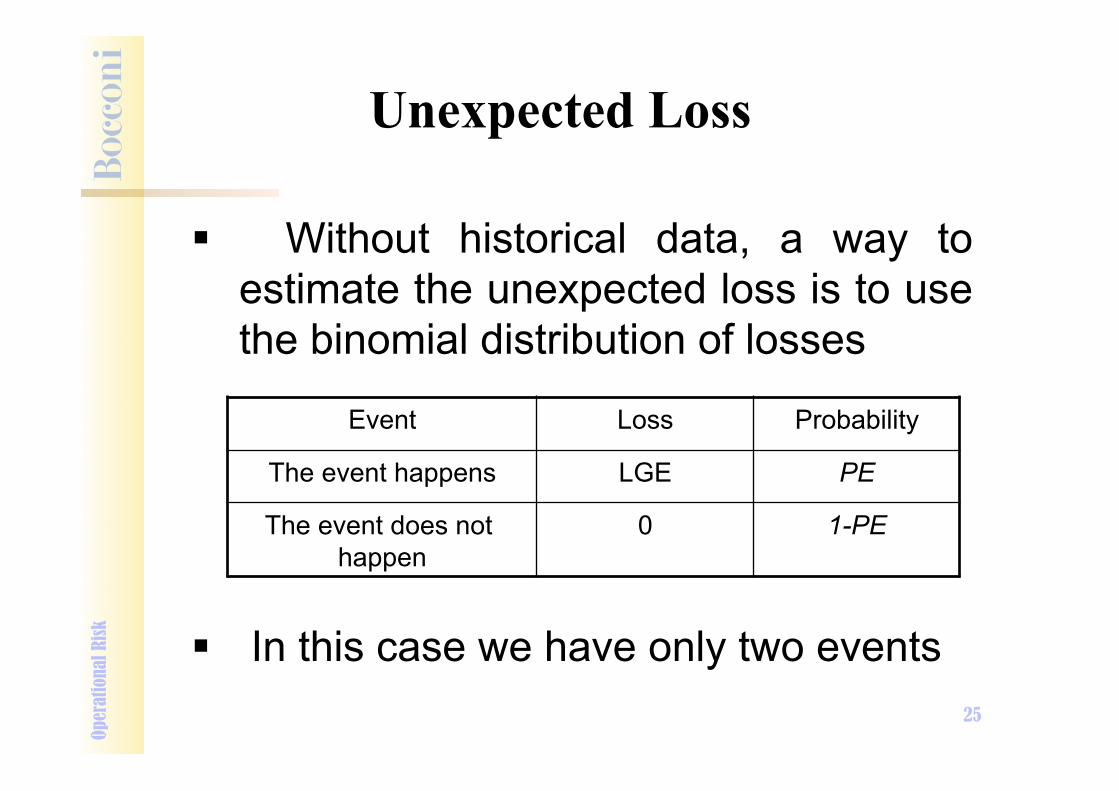
" Without historical data, a way to estimate the unexpected loss is to use the binomial distribution of losses
" In this case we have only two events
Event Loss Probability
The event happens LGE PE
The event does not happen
0 1-PE
Unexpected Loss Op
erat
iona
l Risk
26
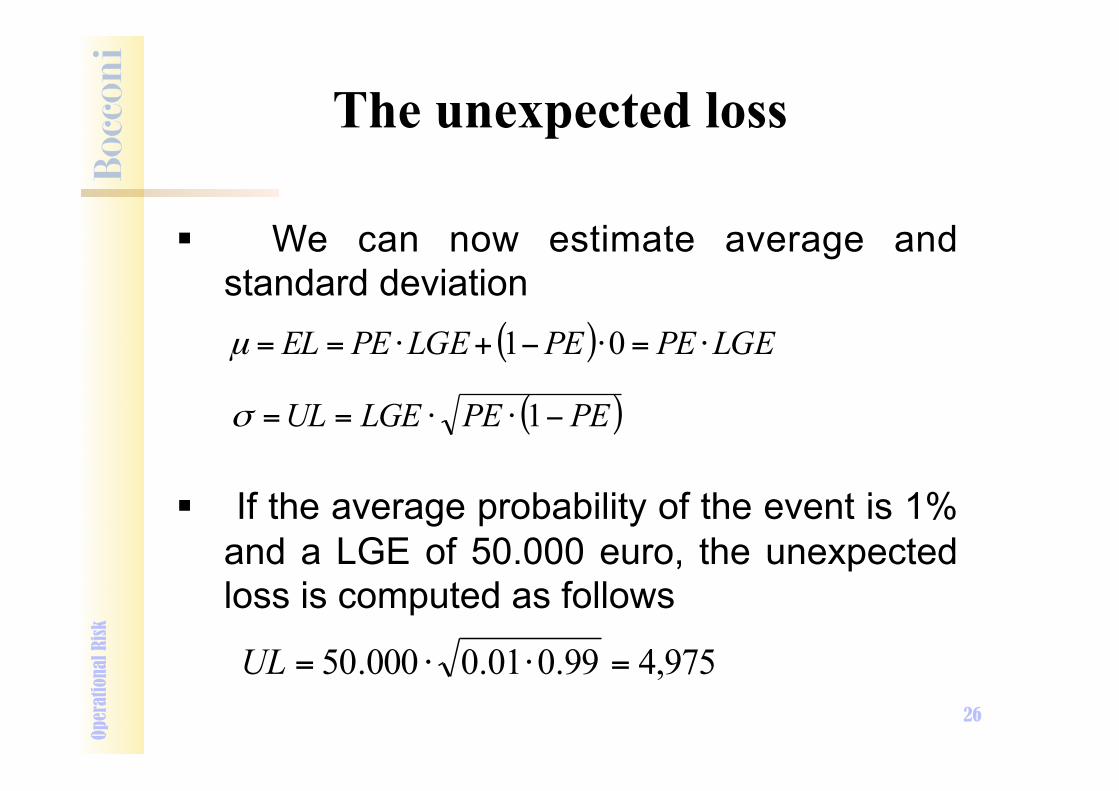
" We can now estimate average and standard deviation
" If the average probability of the event is 1% and a LGE of 50.000 euro, the unexpected loss is computed as follows
( ) LGEPEPELGEPEEL ⋅=⋅−+⋅== 01µ
( )PEPELGEUL −⋅⋅== 1σ
975,499.001.0000.50 =⋅⋅=UL
The unexpected loss Op
erat
iona
l Risk
27
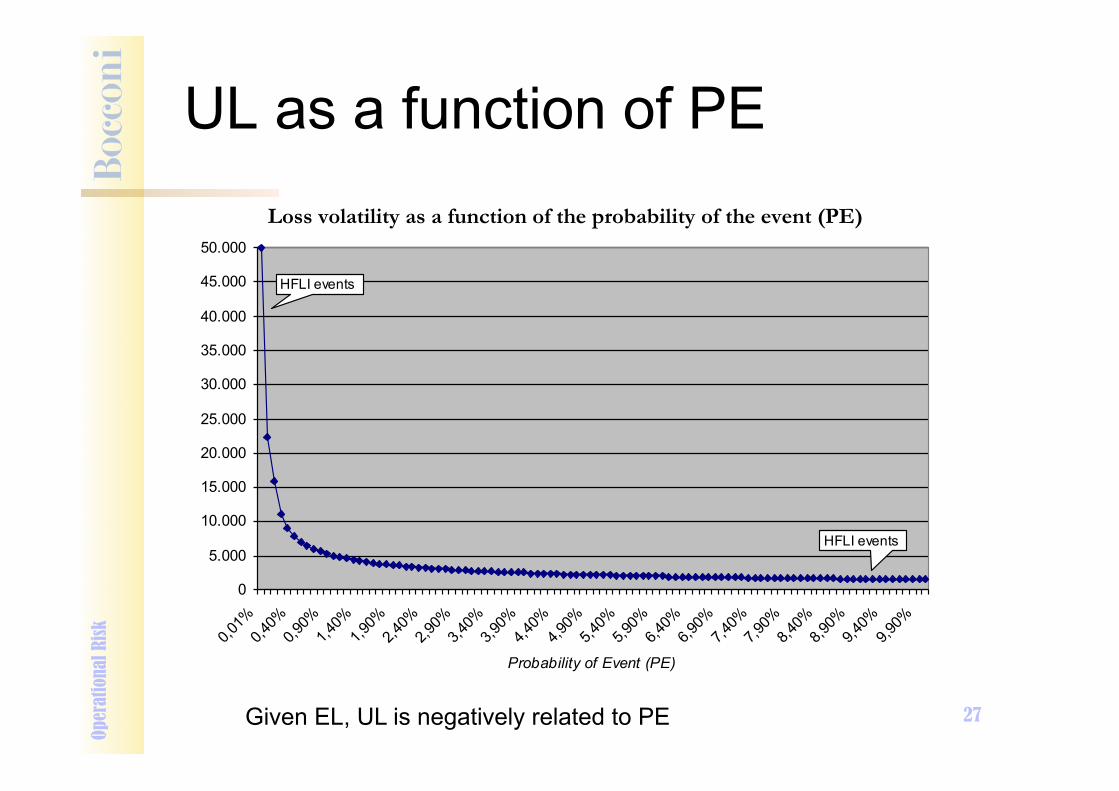
UL as a function of PE Op
erat
iona
l Risk
Loss volatility as a function of the probability of the event (PE) Unexpected loss corresponding to an expected loss of 500,000 euro
0
5.000
10.000
15.000
20.000
25.000
30.000
35.000
40.000
45.000
50.000
0,01%
0,40%
0,90%
1,40%
1,90%
2,40%
2,90%
3,40%
3,90%
4,40%
4,90%
5,40%
5,90%
6,40%
6,90%
7,40%
7,90%
8,40%
8,90%
9,40%
9,90%
Probability of Event (PE)
UL
- Eur
o 00
0s
HFLI events
HFLI events
Given EL, UL is negatively related to PE

28
" If LGE is not deterministic
If sigma LGE = 20%, PE = 1%, LGE = 50,000 UL = 11,169 euro > 4,975 euro with constant LGE
The unexpected loss Op
erat
iona
l Risk
( )( )2 2 2 21 (1 )LGE LGEPE PE LGE PE PE PEσ σ σ= ⋅ − + ⋅ + ⋅ − ⋅
( )( )2 21 LGEPE PE LGE PEσ σ= ⋅ − + ⋅

29
CAR estimation
" How to estimate VAR? " Starting from a functional form of RO
losses, the same for all the BU of the bank " Defining a capital multiplier to apply to the
unexpected loss " Estimating the economic capital absorbed
by each bank unit, multiplying the UL to the capital multiplier
%%, CLCLOR kULCaR ⋅=
• CaRRO,CL is the VaR under a confidence level
• kCL% is the capital multiplier.
Oper
atio
nal R
isk
30
CAR estimation Op
erat
iona
l Risk
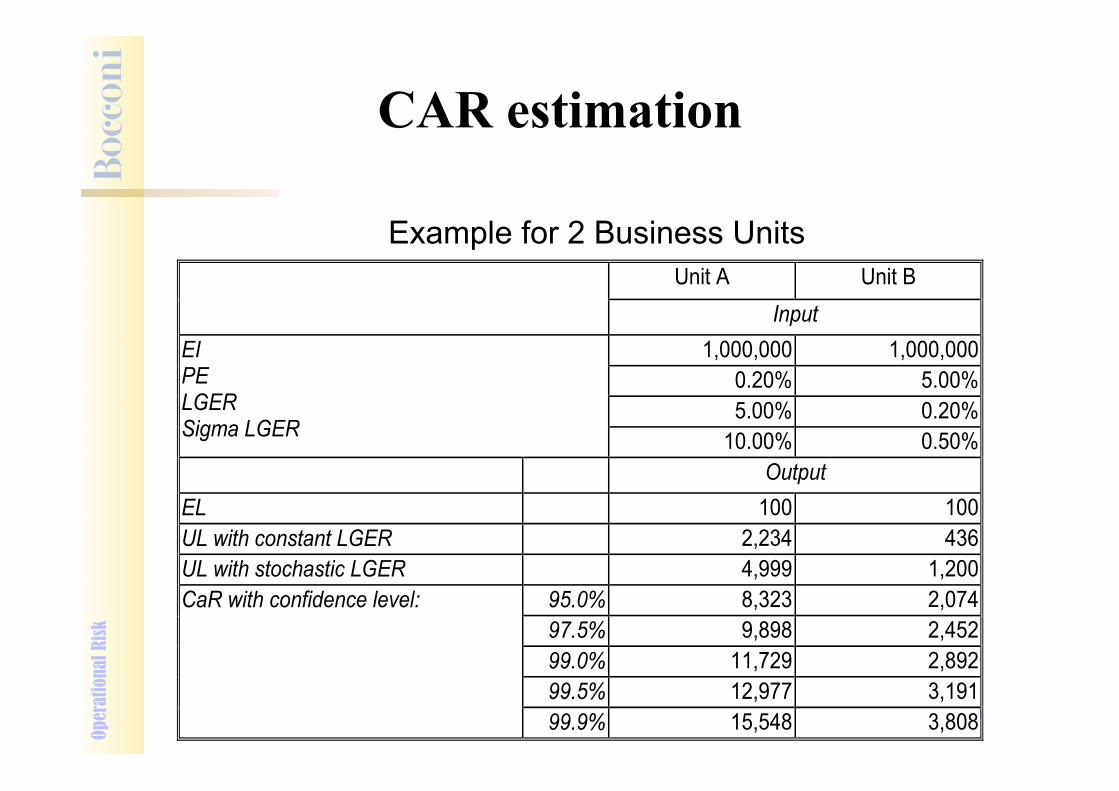
Unit A Unit B Input
EI PE LGER Sigma LGER
1,000,000 1,000,000 0.20% 5.00% 5.00% 0.20%
10.00% 0.50% Output EL 100 100 UL with constant LGER 2,234 436 UL with stochastic LGER 4,999 1,200 CaR with confidence level: 95.0% 8,323 2,074
97.5% 9,898 2,452 99.0% 11,729 2,892 99.5% 12,977 3,191 99.9% 15,548 3,808
Example for 2 Business Units
31
CAR estimation
" OR capital at risk can also be estimated using simulation approaches
" The relative lack of historical data makes it advisable to use Monte Carlo simulations, which typically require less data than historical simulations
" Once a functional form of the OR loss distribution has been estimated or assumed, it is possible to simulate future losses associated with different scenarios and to build a simulated distribution on which the appropriate percentile can be read
Oper
atio
nal R
isk
32
OR Management
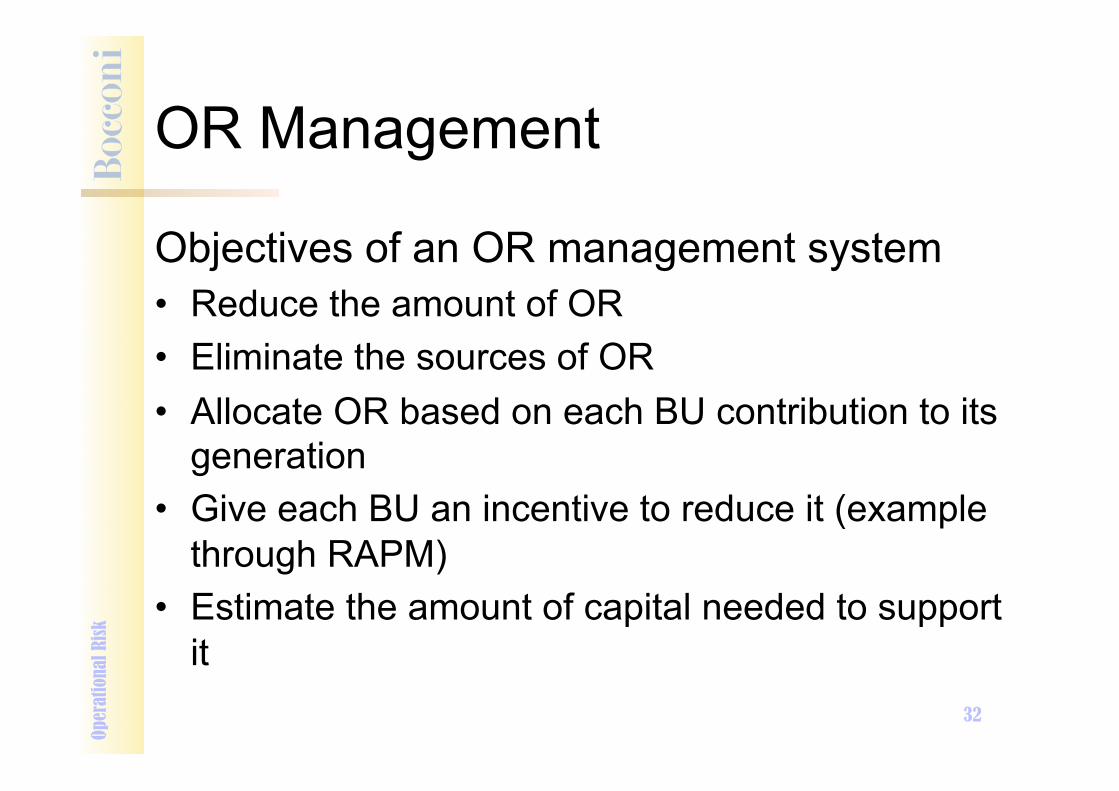
Objectives of an OR management system • Reduce the amount of OR • Eliminate the sources of OR • Allocate OR based on each BU contribution to its
generation • Give each BU an incentive to reduce it (example
through RAPM) • Estimate the amount of capital needed to support
it
Oper
atio
nal R
isk
33
OR Management
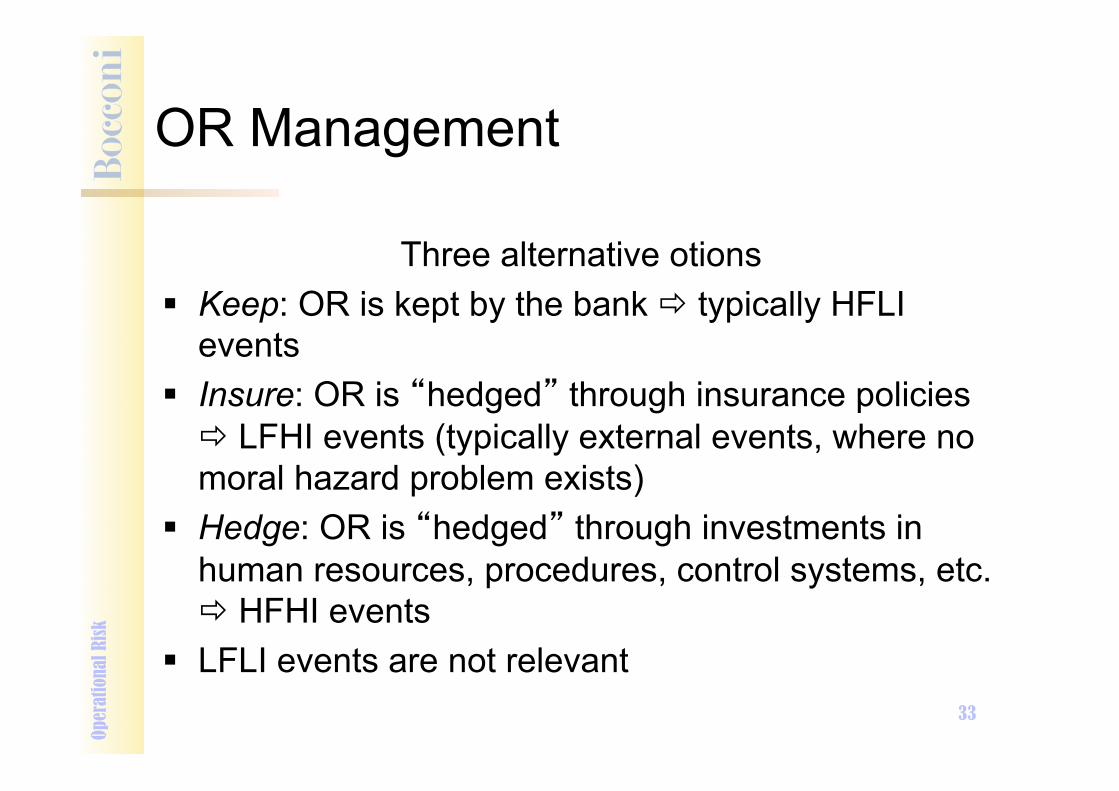
Three alternative otions " Keep: OR is kept by the bank ! typically HFLI
events " Insure: OR is �hedged� through insurance policies
! LFHI events (typically external events, where no moral hazard problem exists)
" Hedge: OR is �hedged� through investments in human resources, procedures, control systems, etc. ! HFHI events
" LFLI events are not relevant
Oper
atio
nal R
isk
34
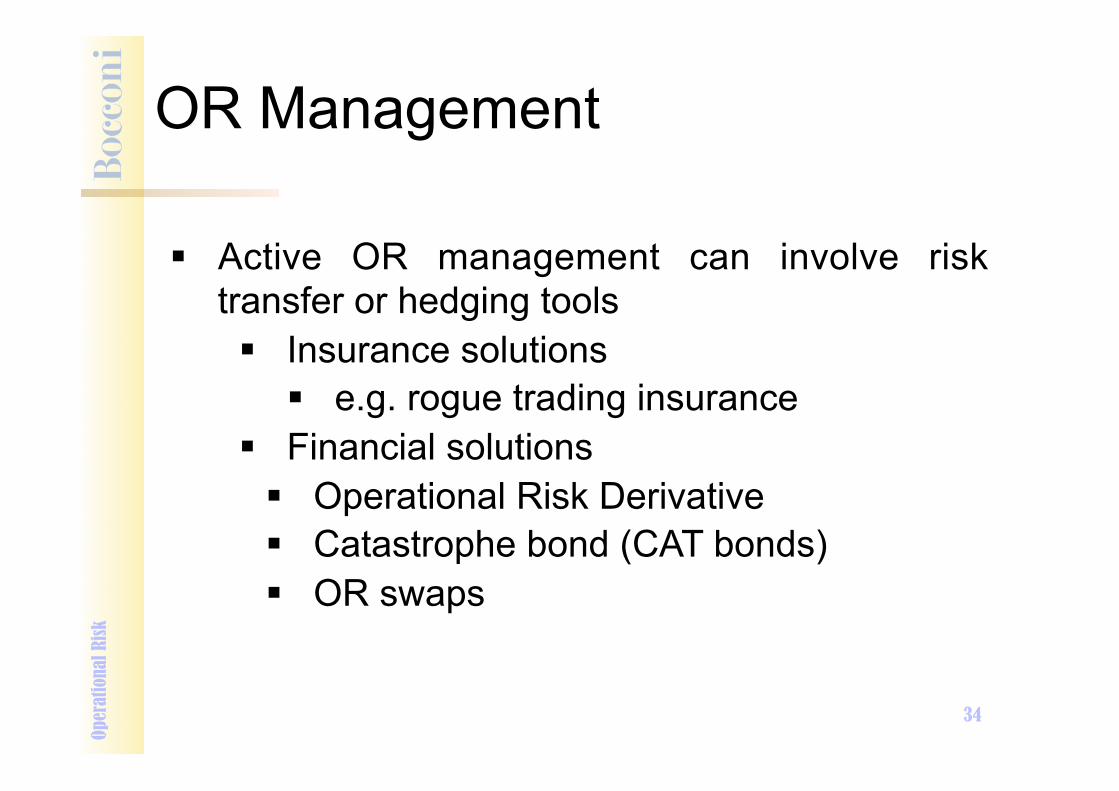
" Active OR management can involve risk transfer or hedging tools " Insurance solutions
" e.g. rogue trading insurance " Financial solutions " Operational Risk Derivative " Catastrophe bond (CAT bonds) " OR swaps
Oper
atio
nal R
isk
OR Management
35
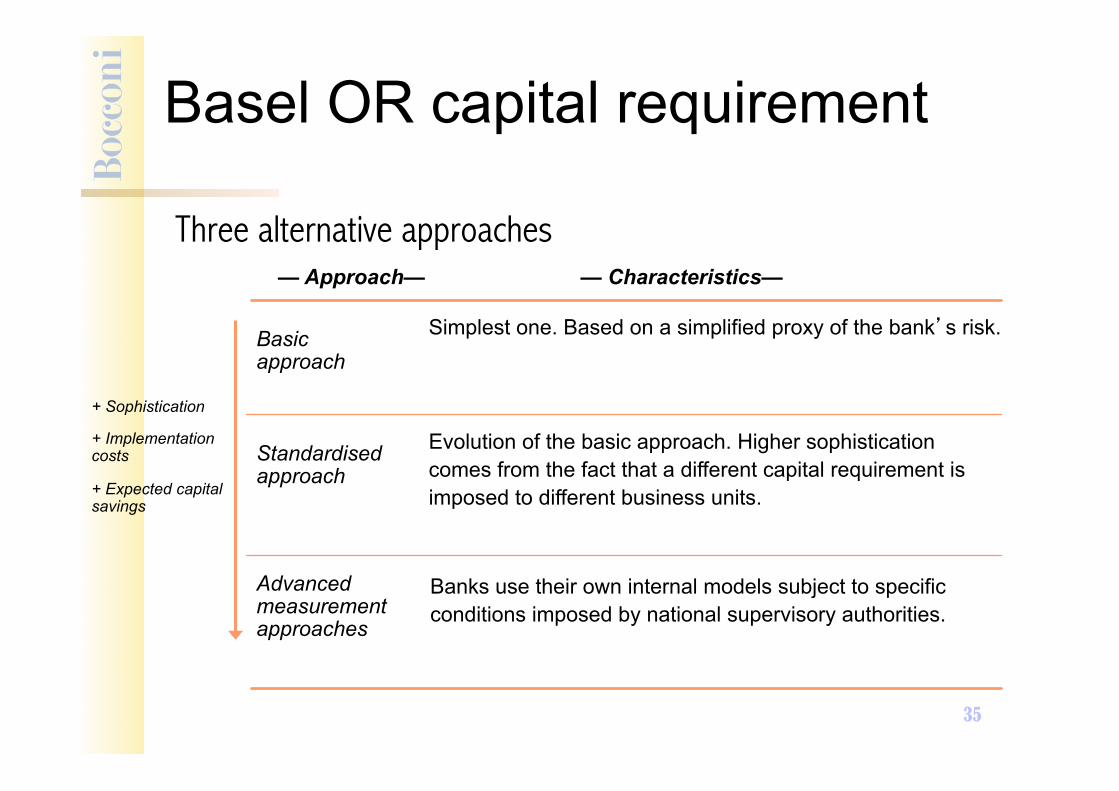
Basic approach
Standardised approach
Advanced measurement approaches
Simplest one. Based on a simplified proxy of the bank�s risk.
Evolution of the basic approach. Higher sophistication comes from the fact that a different capital requirement is imposed to different business units.
Banks use their own internal models subject to specific conditions imposed by national supervisory authorities.
Three alternative approaches — Approach— — Characteristics—
+ Sophistication
+ Implementation costs
+ Expected capital savings
Basel OR capital requirement
36
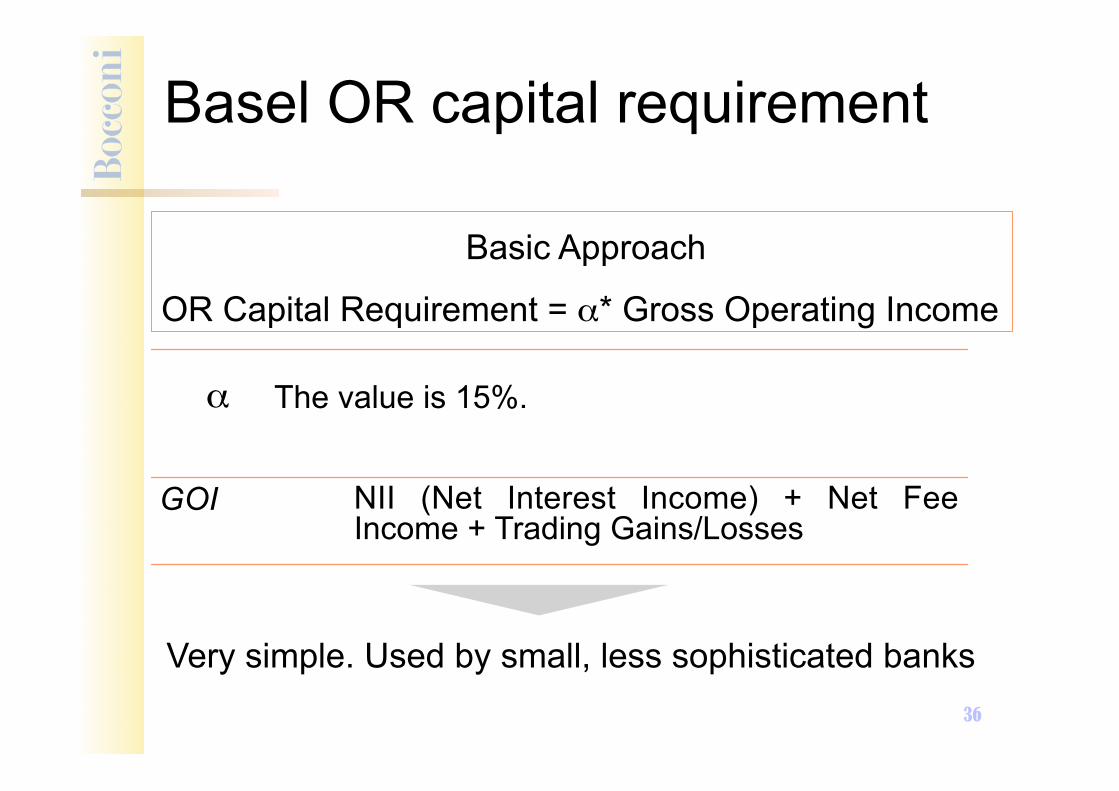
Basic Approach
OR Capital Requirement = α* Gross Operating Income
Very simple. Used by small, less sophisticated banks
α
GOI
The value is 15%.
NII (Net Interest Income) + Net Fee Income + Trading Gains/Losses
Basel OR capital requirement

37
• Each Business Line has a different β and gets its OR capital requirement
• Most large banks chose this approach
• In order to adopt this approach banks have to satisfy certain criteria related to OR mgmt
Business Unit Business Line
Corporate Finance
Trading & Sales
Retail Banking
Commercial Banking
Payment and Settlement
Agency Services and custody
Asset Management
Retail Brokerage
Investment Banking
Banking
Others
Standardized Approach OR Capital Requirement = ∑i βi * GOIi
Basel OR capital requirement
38
Basel OR capital requirement
39
Basel OR capital requirement

40
The different Beta values by Business line
BUSINESS LINE Factor Beta Corporate Finance 18% Trading & Sales 18% Retail Banking 12% Commercial Banking 15% Payment & Settlement 18% Agency Services and custody 15% Asset Management 12% Retail Brokerage 12%
Basel OR capital requirement
41
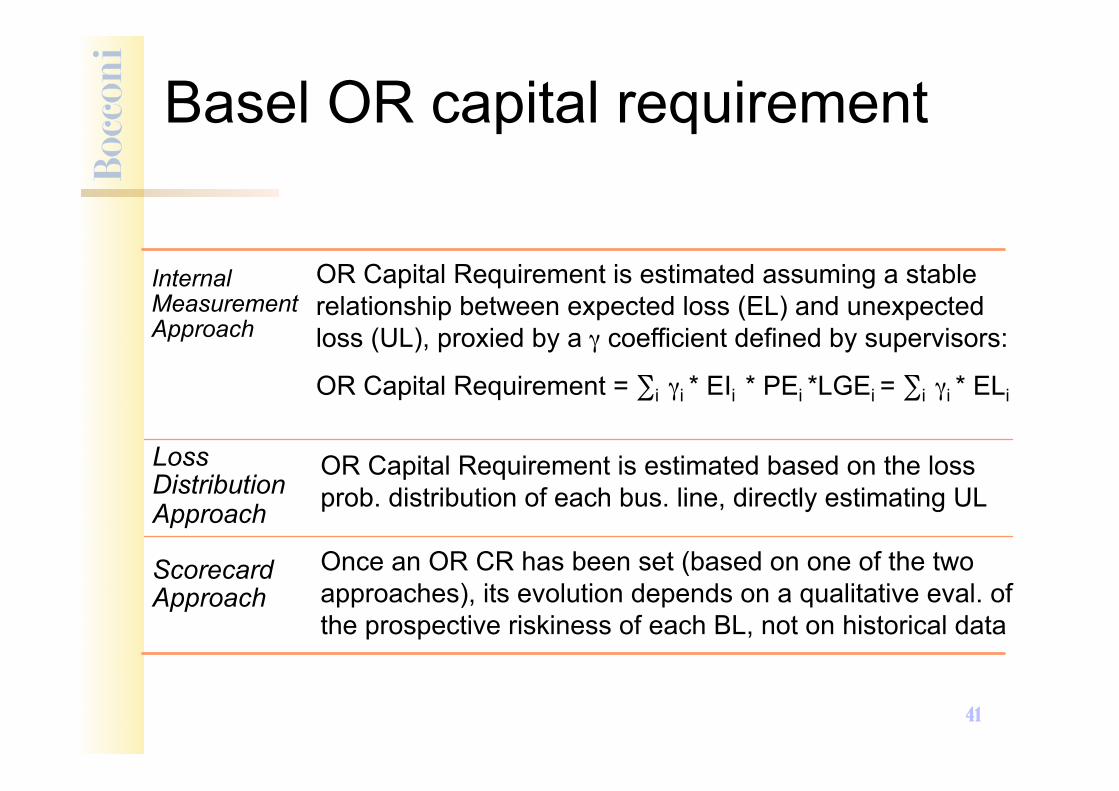
Internal Measurement Approach
Loss Distribution Approach
Scorecard Approach
Once an OR CR has been set (based on one of the two approaches), its evolution depends on a qualitative eval. of the prospective riskiness of each BL, not on historical data
OR Capital Requirement is estimated based on the loss prob. distribution of each bus. line, directly estimating UL
OR Capital Requirement is estimated assuming a stable relationship between expected loss (EL) and unexpected loss (UL), proxied by a γ coefficient defined by supervisors:
OR Capital Requirement = ∑i γi * EIi * PEi *LGEi = ∑i γi * ELi
Basel OR capital requirement
42
Summary
• OR is difficult to define: one needs to identify the causal factors
• OR is inevitable, complex to quantify, not coherent with a risk-return framework
• The objective of an OR management system should be to minimize it
• OR control depends on the amount and quality of resources (human, IT, etc.)
43
Questions & Exercises 1. Consider the following statements: operational risk is different from “financial risks” (like market or credit risk) because… I. …it cannot be avoided; II. …it affects insurance companies, not banks; III. …an increase in risk does not necessarily bring about higher expected returns; IV. …it cannot be covered through capital. Which one(s) would you agree with? A. Only IV; B. Only I; C. I and III; D. I and II.

44
Questions & Exercises
2. For each of the following loss events, indicate the risk factor(s) (people, systems, processes or external events) to which it can be ascribed: A. the tax rate on the bank’s bestselling certificates of deposit is raised from 10% to 30%, causing a drop in demand; B. some customer files are missing/incomplete and the backup data cannot be reconciled with the original ones; C. an expense item was improperly treated as tax-deductible, leading to undemating taxable profits and to evading taxes, so that the bank now has to pay a fine; D. the bank’s chief treasury officer illegally had some FX profits moved to his personal account in Monte Carlo.

45
Questions & Exercises
3. What is an exposure indicator (EI), when it comes to operational risk? A. A measure of loss experienced by the bank in the past. B. A measure of loss expected by the bank in the future. C. A scale variable, indicating how severe an operational loss could be, if it were to happen in a given business line and/or because of a certain type of risk factor. D. A parameter measuring the correlation among two different business lines and/or risk factors.
46
Questions & Exercises
4. A typical probability distribution for operational losses tends to be… A. …symmetric, because high-frequency, low-impact events are totally balanced by low-frequency, high-impact events; B. …skewed to the right, as it shows both high-frequency, low-impact events and low-frequency, high-impact events. C. … skewed to the left, as it shows both high-frequency, low-impact events and low-frequency, high-impact events. D. … uniform, since you have both high and low impact events, and they all tend to happen with both high and low the same frequencies.

47
Questions & Exercises
5. Consider two business lines, both of which face an equal volume of expected losses (e.g., 100,000 euros) due to operational risk. The former estimates a probability of event (PE) of 1%, while the latter has a PE of 5%. The estimated volatility of Loss Given Event (LGE) is 500 euros for both business lines. Compute and compare the volatilities of the operational losses for the two business lines. What does this example teach us, regarding LFHI and HFLI events?