Risk and Portfolio Management Spring 2010
24
Risk and Portfolio Management Spring 2010 Equity Options: Risk and Portfolio Management
Transcript of Risk and Portfolio Management Spring 2010

Risk and Portfolio ManagementSpring 2010
Equity Options: Risk and
Portfolio Management
Summary
Review of equity options
Risk-management of options on a single underlying asset
Full pricing versus Greeks
Volatility Surface: PCA
Stress Test (SPAN)
Multi-asset portfolios
Multi-asset option portfolios
Equity Options Markets
• Single-name options
Electronic trading in 6 exchanges, cross-listing of many stocks, penny-widebid ask spreads for many contracts
• Index Options
S&P 500, NDX, Minis. Traded on the Chicago Mercantile Exchange. VIX options& futures trade in CME as well.
• ETF Options
Most of the large ETFs are optionable. Traded like stocks in multiple exchanges.SPY, QQQQ, XLF are among the most traded options in the US.

Options MarketsHalliburton (HAL) April 09
CALLS PUTSSymbol Last Change Bid Ask Volume Open Int Strike Symbol Last Change Bid Ask Volume Open IntHALDA.X 12.65 0 11.15 11.3 0 0 5 HALPA.X 0.03 0 N/A 0.04 100 210HALDU.X 8.5 0 8.65 8.85 2 2 7.5 HALPU.X 0.05 0 0.01 0.06 1 2,237HALDB.X 5.2 0 6.3 6.35 57 116 10 HALPB.X 0.15 0 0.1 0.12 25 3,775HALDZ.X 4.2 0.15 4.05 4.15 20 944 12.5 HALPZ.X 0.4 0.12 0.39 0.4 185 10,482HALDC.X 2.31 0.1 2.3 2.33 220 4,942 15 HALPC.X 1.06 0.33 1.09 1.11 52 10,592HALDP.X 1.11 0.18 1.09 1.11 495 8,044 17.5 HALPP.X 2.42 0.34 2.36 2.37 196 8,482HALDD.X 0.43 0.05 0.42 0.44 57 10,693 20 HALPD.X 4.59 0 4.15 4.25 250 12,440HALDQ.X 0.15 0.02 0.14 0.16 23 7,646 22.5 HALPQ.X 7.25 0 6.4 6.45 25 2,770HALDE.X 0.05 0.01 0.05 0.06 13 4,060 25 HALPE.X 9.95 0 8.8 8.85 4 1,111HALDR.X 0.03 0 0.01 0.03 8 5,784 27.5 HALPR.X 12.35 0 11.25 11.35 18 977HALDF.X 0.01 0 N/A 0.02 20 8,399 30 HALPF.X 14.8 0 13.7 13.9 18 5,772HALDS.X 0.04 0 N/A 0.04 1 1,698 32.5 HALPS.X 15.5 0 16.2 16.4 20 150HALDG.X 0.08 0 N/A 0.04 2 1,470 35 HALPG.X 18.93 0 18.7 18.9 5 514HALDT.X 0.02 0 N/A 0.04 9 604 37.5 HALPT.X 20.59 0 21.2 21.35 40 151HALDH.X 0.02 0 N/A 0.03 10 1,593 40 HALPH.X 20.6 0 23.7 23.85 10 139HALDV.X 0.02 0 N/A 0.02 4 2,805 42.5 HALPV.X 26.1 0 26.2 26.4 752 311HALDI.X 0.02 0 N/A 0.02 1 623 45 HALPI.X 28.6 0 28.7 29 152 0HALDW.X 0.02 0 N/A 0.02 1 245 47.5 HALPW.X 31.1 0 31.2 31.4 52 13HALDJ.X 0.02 0 N/A 0.02 7 733 50 HALPJ.X 24.55 0 33.7 33.9 0 0HALDX.X 0.04 0 N/A 0.02 10 324 52.5 HALPX.X 14.8 0 36.2 36.4 0 0HALDK.X 0.02 0 N/A 0.02 10 376 55 HALPK.X 19.1 0 38.7 39 0
HAL= $16.36
Available expirations: Mar09, Apr09, Jul09, Oct09, Jan10, Jan112 front months, 2 LEAPS, quarterly cycle (Jan cycle for HAL).
Put-Call Parity
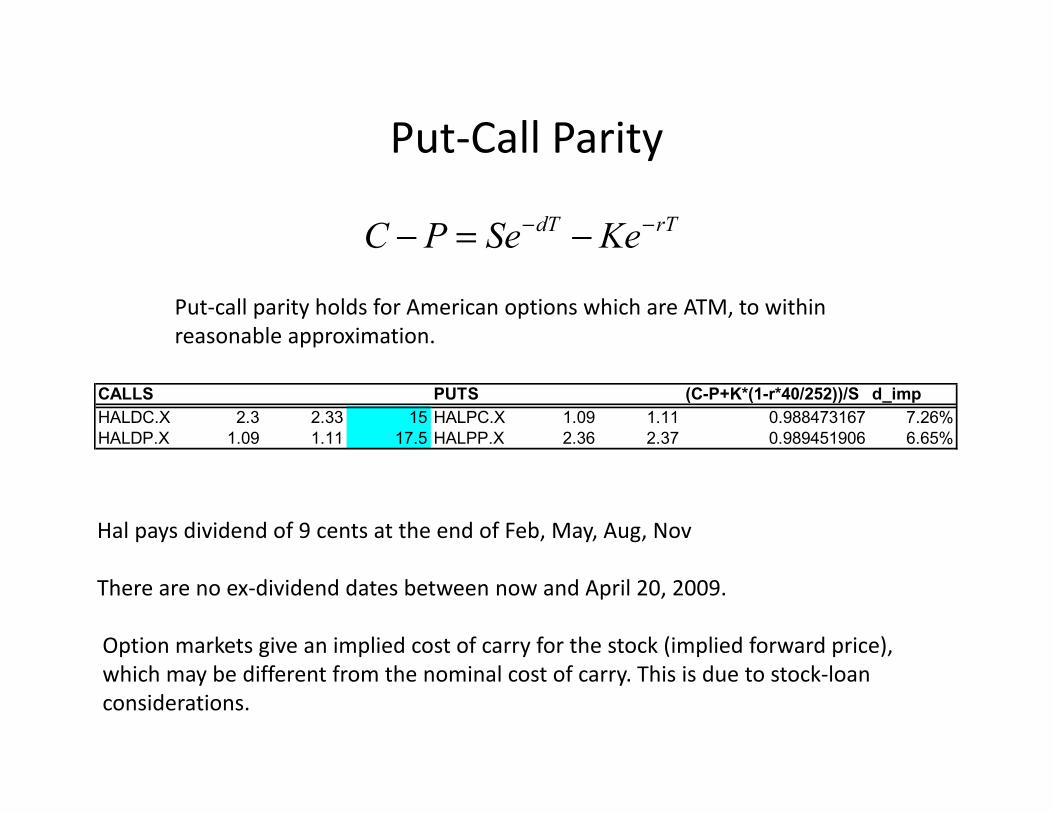
rTdT KeSePC −− −=−
Put-call parity holds for American options which are ATM, to withinreasonable approximation.
CALLS PUTS (C-P+K*(1-r*40/252))/S d_impHALDC.X 2.3 2.33 15 HALPC.X 1.09 1.11 0.988473167 7.26%HALDP.X 1.09 1.11 17.5 HALPP.X 2.36 2.37 0.989451906 6.65%
Hal pays dividend of 9 cents at the end of Feb, May, Aug, Nov
There are no ex-dividend dates between now and April 20, 2009.
Option markets give an implied cost of carry for the stock (implied forward price),which may be different from the nominal cost of carry. This is due to stock-loanconsiderations.
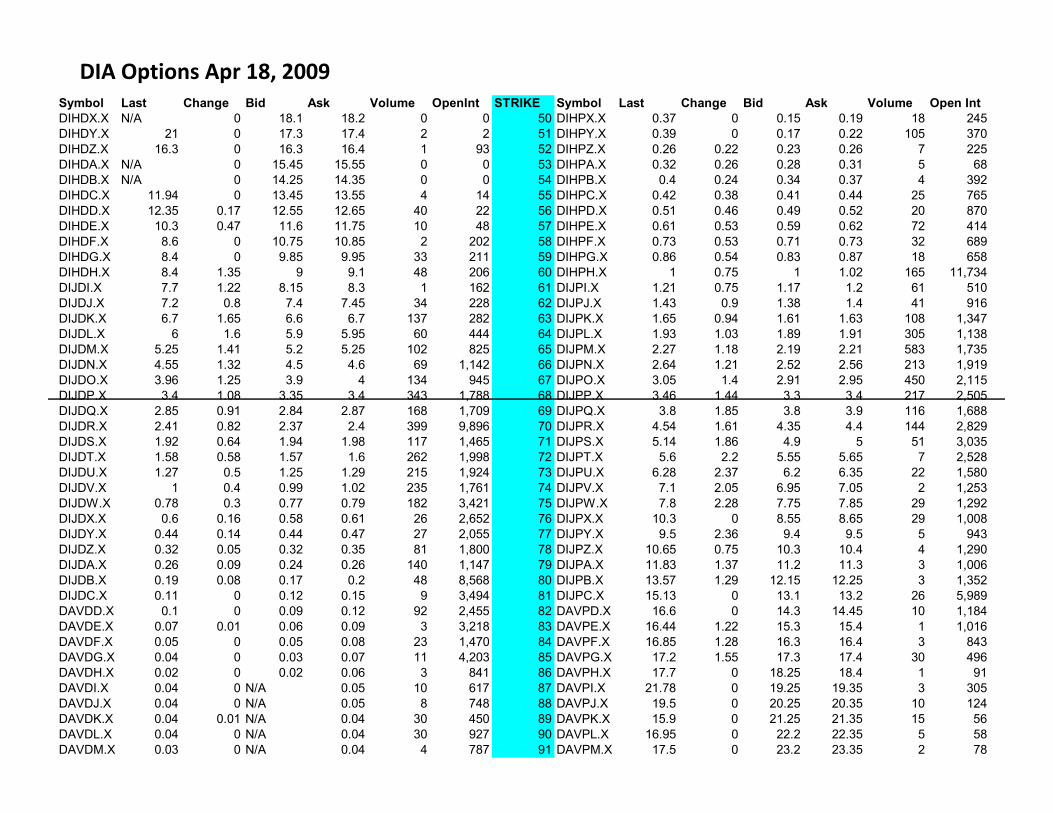
Symbol Last Change Bid Ask Volume OpenInt STRIKE Symbol Last Change Bid Ask Volume Open IntDIHDX.X N/A 0 18.1 18.2 0 0 50 DIHPX.X 0.37 0 0.15 0.19 18 245DIHDY.X 21 0 17.3 17.4 2 2 51 DIHPY.X 0.39 0 0.17 0.22 105 370DIHDZ.X 16.3 0 16.3 16.4 1 93 52 DIHPZ.X 0.26 0.22 0.23 0.26 7 225DIHDA.X N/A 0 15.45 15.55 0 0 53 DIHPA.X 0.32 0.26 0.28 0.31 5 68DIHDB.X N/A 0 14.25 14.35 0 0 54 DIHPB.X 0.4 0.24 0.34 0.37 4 392DIHDC.X 11.94 0 13.45 13.55 4 14 55 DIHPC.X 0.42 0.38 0.41 0.44 25 765DIHDD.X 12.35 0.17 12.55 12.65 40 22 56 DIHPD.X 0.51 0.46 0.49 0.52 20 870DIHDE.X 10.3 0.47 11.6 11.75 10 48 57 DIHPE.X 0.61 0.53 0.59 0.62 72 414DIHDF.X 8.6 0 10.75 10.85 2 202 58 DIHPF.X 0.73 0.53 0.71 0.73 32 689DIHDG.X 8.4 0 9.85 9.95 33 211 59 DIHPG.X 0.86 0.54 0.83 0.87 18 658DIHDH.X 8.4 1.35 9 9.1 48 206 60 DIHPH.X 1 0.75 1 1.02 165 11,734DIJDI.X 7.7 1.22 8.15 8.3 1 162 61 DIJPI.X 1.21 0.75 1.17 1.2 61 510DIJDJ.X 7.2 0.8 7.4 7.45 34 228 62 DIJPJ.X 1.43 0.9 1.38 1.4 41 916DIJDK.X 6.7 1.65 6.6 6.7 137 282 63 DIJPK.X 1.65 0.94 1.61 1.63 108 1,347DIJDL.X 6 1.6 5.9 5.95 60 444 64 DIJPL.X 1.93 1.03 1.89 1.91 305 1,138DIJDM.X 5.25 1.41 5.2 5.25 102 825 65 DIJPM.X 2.27 1.18 2.19 2.21 583 1,735DIJDN.X 4.55 1.32 4.5 4.6 69 1,142 66 DIJPN.X 2.64 1.21 2.52 2.56 213 1,919DIJDO.X 3.96 1.25 3.9 4 134 945 67 DIJPO.X 3.05 1.4 2.91 2.95 450 2,115DIJDP.X 3.4 1.08 3.35 3.4 343 1,788 68 DIJPP.X 3.46 1.44 3.3 3.4 217 2,505DIJDQ.X 2.85 0.91 2.84 2.87 168 1,709 69 DIJPQ.X 3.8 1.85 3.8 3.9 116 1,688DIJDR.X 2.41 0.82 2.37 2.4 399 9,896 70 DIJPR.X 4.54 1.61 4.35 4.4 144 2,829DIJDS.X 1.92 0.64 1.94 1.98 117 1,465 71 DIJPS.X 5.14 1.86 4.9 5 51 3,035DIJDT.X 1.58 0.58 1.57 1.6 262 1,998 72 DIJPT.X 5.6 2.2 5.55 5.65 7 2,528DIJDU.X 1.27 0.5 1.25 1.29 215 1,924 73 DIJPU.X 6.28 2.37 6.2 6.35 22 1,580DIJDV.X 1 0.4 0.99 1.02 235 1,761 74 DIJPV.X 7.1 2.05 6.95 7.05 2 1,253DIJDW.X 0.78 0.3 0.77 0.79 182 3,421 75 DIJPW.X 7.8 2.28 7.75 7.85 29 1,292DIJDX.X 0.6 0.16 0.58 0.61 26 2,652 76 DIJPX.X 10.3 0 8.55 8.65 29 1,008DIJDY.X 0.44 0.14 0.44 0.47 27 2,055 77 DIJPY.X 9.5 2.36 9.4 9.5 5 943DIJDZ.X 0.32 0.05 0.32 0.35 81 1,800 78 DIJPZ.X 10.65 0.75 10.3 10.4 4 1,290DIJDA.X 0.26 0.09 0.24 0.26 140 1,147 79 DIJPA.X 11.83 1.37 11.2 11.3 3 1,006DIJDB.X 0.19 0.08 0.17 0.2 48 8,568 80 DIJPB.X 13.57 1.29 12.15 12.25 3 1,352DIJDC.X 0.11 0 0.12 0.15 9 3,494 81 DIJPC.X 15.13 0 13.1 13.2 26 5,989DAVDD.X 0.1 0 0.09 0.12 92 2,455 82 DAVPD.X 16.6 0 14.3 14.45 10 1,184DAVDE.X 0.07 0.01 0.06 0.09 3 3,218 83 DAVPE.X 16.44 1.22 15.3 15.4 1 1,016DAVDF.X 0.05 0 0.05 0.08 23 1,470 84 DAVPF.X 16.85 1.28 16.3 16.4 3 843DAVDG.X 0.04 0 0.03 0.07 11 4,203 85 DAVPG.X 17.2 1.55 17.3 17.4 30 496DAVDH.X 0.02 0 0.02 0.06 3 841 86 DAVPH.X 17.7 0 18.25 18.4 1 91DAVDI.X 0.04 0 N/A 0.05 10 617 87 DAVPI.X 21.78 0 19.25 19.35 3 305DAVDJ.X 0.04 0 N/A 0.05 8 748 88 DAVPJ.X 19.5 0 20.25 20.35 10 124DAVDK.X 0.04 0.01 N/A 0.04 30 450 89 DAVPK.X 15.9 0 21.25 21.35 15 56DAVDL.X 0.04 0 N/A 0.04 30 927 90 DAVPL.X 16.95 0 22.2 22.35 5 58DAVDM.X 0.03 0 N/A 0.04 4 787 91 DAVPM.X 17.5 0 23.2 23.35 2 78
DIA Options Apr 18, 2009

Implied Dividend Yield for DIAApril 18, 2009 Options
CALLS PUTS (C-P+K*(1-r*40/252))/S d_impDIJDP.X 3.35 3.4 68 DIJPP.X 3.3 3.4 0.995267636 2.98%DIJDQ.X 2.84 2.87 69 DIJPQ.X 3.8 3.9 0.994951292 3.18%
Dividend Yield from Yahoo.com= 3.30%
Actual payments are approx 15 cents / month ~ $1.80 ~ 2.60%
Step1 in understanding options markets: find the implied dividend from the market.
If the implied dividend is different from the nominal dividend then
-- check for HTB if
-- check for dividend reductions if
nomimp dd >
nomimp dd <

Calculation of d_{nom}, d_{imp}
⎟⎟⎠
⎞⎜⎜⎝
⎛ +−−=
⎟⎟⎟⎟
⎠
⎞
⎜⎜⎜⎜
⎝
⎛ −−=
−
=
−∑
SeKPC
Td
S
eDS
Td
rTatmatmatm
imp
n
i
rTi
nom
i
ln1
ln1 1
Dividend paymentdates

LDK Solar Co. (LDK) May 2010 options series
Pricing Date 3/23/2010Rate 0.12%Spot 6.9
Expiration 5/22/2010 Days 44CALLS PUTS
Symbol Last Bid Ask Volume Open Int Strike Symbol Last Bid Ask Volume Open Int idiv
DLO100522C00005000 N/A 1.9 2 0 0 5
DLO100522P00005000 0.21 0.2 0.3 60 26 15%
DLO100522C00006000 N/A 1.1 1.3 0 0 6
DLO100522P00006000 0.6 0.5 0.6 30 30 15%
DLO100522C00007000 0.65 0.7 0.7 175 73 7
DLO100522P00007000 N/A 1 1.1 0 0 17%
DLO100522C00008000 0.35 0.3 0.35 40 206 8
DLO100522P00008000 N/A 1.7 1.9 0 0 28%
DLO100522C00009000 0.15 0.2 0.2 9 101 9
DLO100522P00009000 N/A 2.5 2.8 0 0 26%
LDK is a hard-to-borrow stock with repo rate of approximately -12.5% in one of the brokers.No ``real’’ dividend is paid.
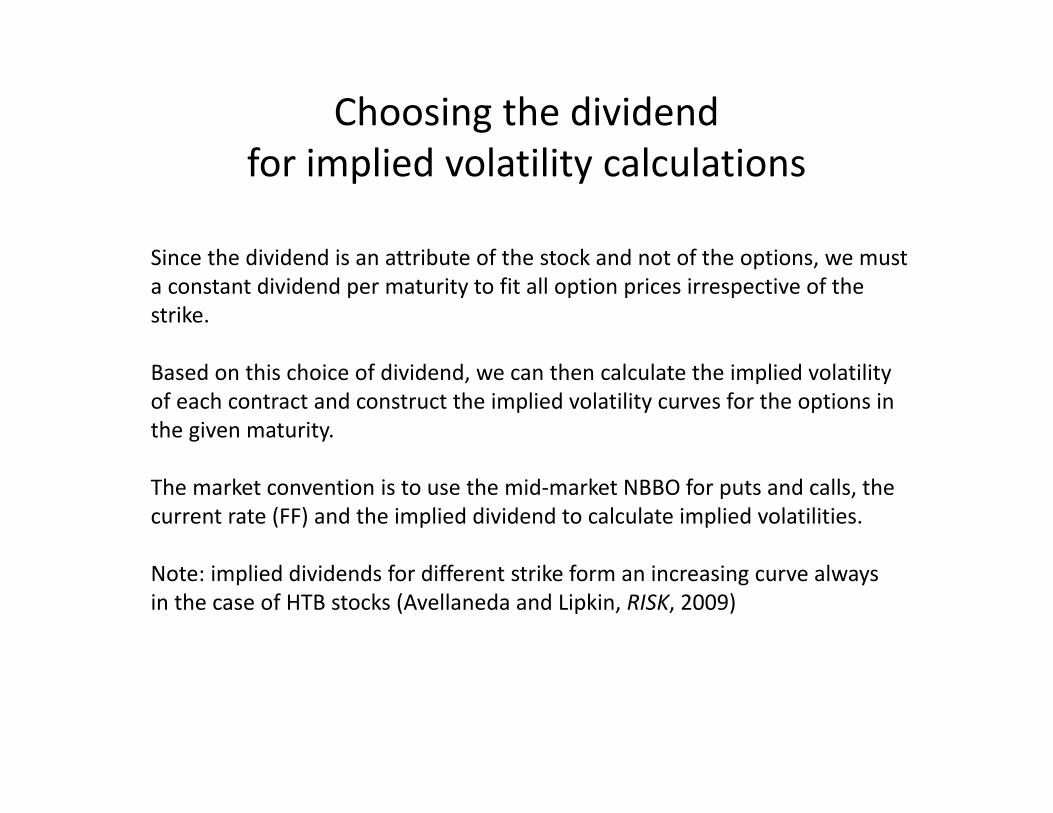
Choosing the dividendfor implied volatility calculations
Since the dividend is an attribute of the stock and not of the options, we musta constant dividend per maturity to fit all option prices irrespective of the strike.
Based on this choice of dividend, we can then calculate the implied volatilityof each contract and construct the implied volatility curves for the options inthe given maturity.
The market convention is to use the mid-market NBBO for puts and calls, thecurrent rate (FF) and the implied dividend to calculate implied volatilities.
Note: implied dividends for different strike form an increasing curve alwaysin the case of HTB stocks (Avellaneda and Lipkin, RISK, 2009)

Implied VolatilityHAL April 09
CALLS PUTSSymbol Last Bid Ask IVOL Delta Strike Symbol Last Bid Ask IVOL DeltaHALDU.X 8.5 8.65 8.85 na 1.00 7.5 HALPU.X 0.05 0.01 0.06 211 0.00HALDB.X 5.2 6.3 6.35 141 0.99 10 HALPB.X 0.15 0.1 0.12 144 -0.01HALDZ.X 4.2 4.05 4.15 108 0.94 12.5 HALPZ.X 0.4 0.39 0.4 109 -0.05HALDC.X 2.31 2.3 2.33 92.4 0.76 15 HALPC.X 1.06 1.09 1.11 93 -0.24HALDP.X 1.11 1.09 1.11 85.1 0.36 17.5 HALPP.X 2.42 2.36 2.37 85 -0.63HALDD.X 0.43 0.42 0.44 82.4 0.09 20 HALPD.X 4.59 4.15 4.25 84 -0.90HALDQ.X 0.15 0.14 0.16 89.3 0.02 22.5 HALPQ.X 7.25 6.4 6.45 90 -0.97
0
50
100
150
200
250
7.5 10 12.5 15 17.5 20 22.5
Strike
Impl
ied
Vol
atili
ty
CALLSPUTS
3032343638404244464850
64 65 66 67 68 69 70 71 72 73
callput
30
32
34
36
38
40
42
64 65 66 67 68 69 70 71 72 73
callput
DIA, Mar09
DIA, Apr09
30313233343536373839
64 65 66 67 68 69 70 71 72 73
callput
DIA, Jun 30, 09
30
31
32
33
34
35
36
37
64 65 66 67 68 69 70 71 72 73
callput
DIA, Sep 30, 09
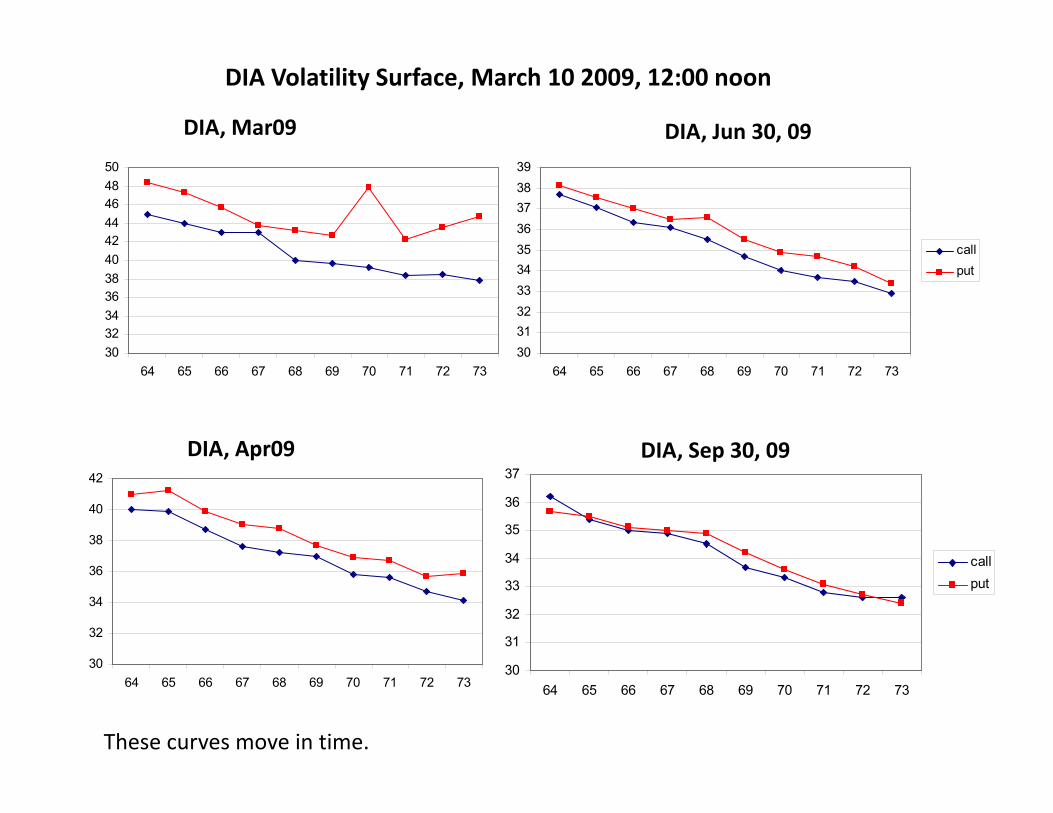
These curves move in time.
DIA Volatility Surface, March 10 2009, 12:00 noon

Modeling the Volatility Risk
1. Compute the historical volatility of a constant maturity series byinterpolation over fixed maturities.
( Typically, for equities: 30d , 60 d, 90 d, 180 d, etc)
2. Express the implied volatilities in terms of moneyness or deltas.Deltas is better because this takes into account the volatilityof the underlying asset as well.
3. Study the variations of the implied volatility curve for each maturityusing PCA & extreme-value theory (Student T)
4. Deduce a model for the variation of implied volatilities for portfoliorisk analysis

The Data (example with DIA)
date\delta -20 -25 -30 -35 -40 -45 50 45 40 35 30 25 20
9/2/2008 23.9% 23.2% 22.6% 22.0% 21.5% 21.1% 20.8% 20.5% 20.1% 19.7% 19.3% 18.9% 18.5%
9/3/2008 23.1% 22.4% 21.9% 21.3% 20.9% 20.4% 20.2% 20.1% 19.7% 19.3% 18.9% 18.5% 18.1%
9/4/2008 26.2% 25.6% 25.0% 24.6% 24.2% 23.8% 22.7% 21.6% 21.3% 21.0% 20.7% 20.4% 20.0%
9/5/2008 25.0% 24.3% 23.7% 23.2% 22.8% 22.3% 21.9% 21.5% 21.1% 20.7% 20.4% 20.0% 19.6%
9/8/2008 24.9% 24.2% 23.6% 23.0% 22.5% 22.0% 21.9% 21.7% 21.3% 20.8% 20.4% 19.9% 19.5%
OTM Puts OTM Calls
We consider data from 9/2/2008 until 10/30/2009, organized by Deltas (13 strikes per day)

DIA 30 day Implied Vol Curves

DIA ATM VolatilitySep 2, 2008 – Oct 30 2009

Eigenvalues of the Correlation Matrix30 Day Ivol returns
EIGENVALUE90.91%7.51%1.28%0.27%0.01%0.01%0.00%0.00%0.00%0.00%0.00%0.00%0.00%

Eigenvectors and their explanatory power
1st Eigenvector 91.1% 2nd Eigenvector 7.51%
3rd Eigenvector 1.28%Most of the risk is in the parallel shift,i.e. exposure to the ATM vol
The second EV corresponds to the classical skew, i.e. exposure torisk-reversals.
RR= long 30 D put / short 30 D call

Risk-model for single-name option portfolios
( )
( )( ) εβ
σσβ
σσ
εββσ
+⎟⎠⎞
⎜⎝⎛ −Δ+=
ΔΔ
+⎟⎠⎞
⎜⎝⎛ −Δ+=Δ
221
2211
5050
5050
Rdd
RRR
c
atm
atm
c
or
The distributions for ATM vol returns and RR returns can be estimatedfrom historical data.
One important consideration: ATM vol is negatively correlated to stock prices, sothere is a further analysis needed to specify the joint distribution of stocksand volatility

X=DIA returns, Y=ATM vol returns
Negative correlationof vol returns with stockreturns, with regressioncoefficient b=-1.6 and R2=0.28

Coupled model for stock and vol shocks
( )
( )( )
( ) ( ) ⎟⎠⎞
⎜⎝⎛ −Δ++=
+⎟⎠⎞
⎜⎝⎛ −Δ+=
ΔΔ
+⎟⎠⎞
⎜⎝⎛ −Δ+=
Δ
Δ
5050
5050
5050
22211
221
2211
cs
c
atm
atm
c
RERR
Rdd
RRR
βγγβ
εβσσβ
σσ
εββ
σ
σ
Stock return Idiosyncratic vol return RR return

Extreme-value analysis: ATM vol
QQ-plot vs. Student T with DF=4
prob student data0.0034 -3.633 -3.3330.0068 -2.976 -3.0740.0102 -2.633 -2.779
0.01361 -2.406 -2.7550.01701 -2.238 -2.550.02041 -2.106 -1.9990.02381 -1.997 -1.6780.02721 -1.905 -1.6510.03061 -1.825 -1.5610.03401 -1.755 -1.5260.03741 -1.693 -1.4680.04082 -1.637 -1.4440.04422 -1.585 -1.3850.04762 -1.538 -1.3470.05102 -1.495 -1.328

Left tail vs right tail using DF=4
prob student data0.0034 -3.633 -3.3330.0068 -2.976 -3.0740.0102 -2.633 -2.779
0.01361 -2.406 -2.7550.01701 -2.238 -2.550.02041 -2.106 -1.9990.02381 -1.997 -1.6780.02721 -1.905 -1.6510.03061 -1.825 -1.5610.03401 -1.755 -1.5260.03741 -1.693 -1.4680.04082 -1.637 -1.4440.04422 -1.585 -1.3850.04762 -1.538 -1.3470.05102 -1.495 -1.328
prob student data0.9558 1.5853 1.990210.9592 1.6366 2.03490.9626 1.6929 2.105790.966 1.7554 2.11977
0.9694 1.8255 2.216350.9728 1.9051 2.224580.9762 1.9971 2.391560.9796 2.1058 2.661360.983 2.2381 2.70045
0.9864 2.406 2.80360.9898 2.6331 3.017310.9932 2.9757 3.064950.9966 3.6328 3.28219
Extreme down moves Extreme up moves moves

Risk-management of option portfolios
( ) ( )[ ]
y volatilitimplied pricestock
)or ( callor put ,maturity , strike with options ofnumber
where
,,,,,)1(,,,,),1(
change Portfolio
,
0
,,
,,,,0,0,, ,
==
==
−+Δ−+
=
∑=
TK
aTK
cpaTKTKTTaTKTTsaaTK
ScpaTKQ
drKTSBSRdrKTTRSBSQTK
σ
σσ σ
Simulate risk-scenarios using the factor model described above and analyze extreme values
Risk scenarios correspond to joint stock shocks and vol shocks ( )TK
RRs ,, σ