Risk analysis for cultural resources within the floodplains of the Snoqualmie River
23
Risk Analysis of Cultural Resources within Snoqualmie Flood Plains GIS Project Presentation For King County GIS User Group 10.07.09 Architecture | Technology | Culture Presented By Odra Cardenas Shweta Bhatia Gupta
Transcript of Risk analysis for cultural resources within the floodplains of the Snoqualmie River

Risk Analysis of Cultural Resources within Snoqualmie Flood Plains
GIS Project Presentation
For King County GIS User Group
10.07.09
A r c h i t e c t u r e | T e c h n o l o g y | C u l t u r e
Presented By
Odra Cardenas
Shweta Bhatia Gupta

“GIS as a technology in the heart of preservation planning, community building,
and effective decision making”

The Project
Relation between land and cultural resource
Cultural resources are the buildings, sites, areas, architecture, and properties that bear
evidence of human activity and have a scientific, historic, and/or cultural importance.
Cultural resources help define human history, remind us of our interdependence
with the land, and show how cultures change over time.
Hence cultural resource itself embodies the three important aspects of GIS
-Knowledge( Read information)
-Location
-Time
King County cultural resources
• The County’s cultural resources include around 2000 inventory, local, state and landmark
structures.
• The Snoqualmie valley, is home to historical railroad and timber Industries
• It is also home to the largest agricultural heritage within King County. The valley was
originally settled by members of the Snoqualmie tribe, and one can find displays of its native
American roots through relics like totem poles and archeological sites.

Snoqualmie Site
Farmlands are one of the most important component
of the county's historic and cultural resources.
In the last 16 years, the Snoqualmie valley
has experienced four of the worst floods on record,
including November 06's record-breaking deluge.
Within the Snoqualmie River basin floodplain
there are a total of 1,880 parcels.
This is approximately 40 percent of the total number
of parcels within King Countys floodplains (4,738).
There are structures at risk from flooding on 867 of
these parcels. The depth of flooding varies depending
on location.
The Goal
• Evaluating use of GIS as documentation tool in historic preservation
• Evaluating use of GIS as analytical and decision making tool
• Its resources and limitations

Methodology
Resource
Identification
Data
Accumulation
Research
Data Gathering
Defining dataset
Defining Of Matrix
Database
design
Creating feature set
Digitization
Reclassification
Analysis
Process
Model Building
Actual project plan
Work breakdown
structure
Task Division
Monitoring the
processStatus reports
Work quality
Time schedule
Reporting
Management

The Process
• Stage 1:
– Data Collection
– Data cleanup
– Digitization
• Stage 2:
– Risk Matrix
– Database Design
– Reclassification for analysis
• Stage 3:
– Structural Analysis
– Site Level Analysis

Stage 1- Data Collection and Digitization
The two main sets of data were the geographical data and information about the structures on
the properties under consideration.
The former was collected from various GIS data repository and the later from local Historical
Archives.

Stage 2- The Matrix
The analysis was based on a risk matrix prepared to calculate percentage contribution each of
the factors considered. These contributions were then ranked ranging from 1 to 5 denoting the
lowest to highest risk levels to have uniformity across the analysis.

Stage 2- Risk Percentages
40 % Status
25 % Structural Condition
20 % Structural/Material
10 % Architectural Style
5 % Site Condition Stru
ctu
ral R
isk
Foundation Type 40%Cladding Type 20 %Roof Type 20 %Roof Material 20 %
Change in Use 40%Accessibility 30 %Extant 30 %
20 % Site Slope
20 % Site Soil
15 % Flood Way
Site
Ris
k
45 % Flood Elevation
Analysis 1
Analysis 2The percentage
contributors were decided
on discussions with
heritage preservation
program coordinators of
the King County office and
research on the behavior of
system types and materials

Stage 2-Integrated GIS Model
Historic DistrictID
Location Info
Characteristics HistPropretyID
HistoricDistrict
PolygonHistPropretyID
HistDistrictID
HistMunicipleID
Characteristics Summary
CharacteristicDetail
HistoricProperty
Point
HistPropPolygon
HistPropretyID
HistMunicipality
Polygon
PolygonHistPropretyID
HistStructureID
Characteristics Summary
CharacteristicDetail
HistStructure
PolygonPolygon
Polygon
HistElementID
HistPropretyID
Element Name[n]
Element Type
Characteristics
Historic Element
HistElementID
HistPropretyID
Location Info
HistElemPoint
Point
HistElementID
HistPropretyID
Location Info
HistElemPolygon
Polygon
Object
Feature
HasSites
ArchSite Grid
¼ Mile grid
Historic Architecture
ArchPropertyID
Location Info
Characteristics
Archaeological District
Polygon
ArchPropertyID
ArchProperty Polygon
Polygon
ArchPropertyID
SmithsodianID
ArchDistrictID
Property Name
Location Info
Characteristics Summary
CharacteristicDetail
SiteDetails
Archaeological Property
Point
Feature
Feature
Archaeological Site

Flood Data Set
Flood Plain
Flood Way
Water Bodies
Contour Data
5ft Contour
2ft Contour
Contour TIN
Contour _ Merge
Historic Site Point
Historic Site Structure
Parcel KC
Zoning
Admin Data
Models
Flood Plain Raster
General Analysis
Parcel Analysis
Modelwoflood Analysis
Structure Analysis
Result Raster Set
Parcel Flood
Parcel Soil
Parcel Slope
Flood Plain uni
Soil 15
Slope
Flood pl reclass
Soil reclass
Slope reclass
Final Result
Zone st –Par
Zonal St- Min
Zonal St- Mean
Stage 2- Project Data

Stage 3- Analysis at Structure Level
Formula: with a consideration 1 as low risk and 5 as highest risk rank
Total Structural Risk(%)= 20% X (structure Condition Rank)
+ 15% X (Structural material and construction type Rank)
+ 45% (Status and Arc Style Rank)+ 20% (Structure related Site Condition)

Formula: With a consideration 1 as low risk and 5 as highest risk rank
Total Site Risk(%)= 20% X (Slope Rank)+ 20% X (Soil type Rank)
+ 40% (100 yrs flood plain )+ 15% (Flood Elevation)
Stage 3- Analysis at Site Level

Stage 3- Analysis at Site Level(Model)

Results

353
Results
Snoqualmie Falls Lumber Mills
Year built: :1917
National Landmark registered
No of structures in site at risk : 17 out
of 22
Most endangered property according to
this study and at 88% of risk of flooding

ITEM NAME NUMBER OF STR LOCATION RISK PERSENTAGE
1 Broadacre Farm 9 Carnation 70-78 %
2 Carnation Research Farm Historic District 16 Carnation 51-72 %
3 Curtis Link Farm 3 Carnation 48-53%
4
Fred Keller Barn
1
Carnation 36%
5 Hjertoos Farms 2 Carnation 66-68%
6 Charles Suvan & Louise 5 Duvall 29-47%
7 DeJong, Jerry Farm 12 Duvall 46-55%
8 Herman, Art and Letha Farm 5 Duvall 53-63%
9 John W. Platt Farm 4 Duvall 42-46%
10 Kosters Farm 9 Duvall 36-43%
11 Neilson Hay & Dairy Company 9 Duvall 39-53%
12 Old Rupard Place 9 Duvall 51-67%
13 Roetcisoender, James Farm 11 Duvall 47-59%
14 Roney Ranch 15 Duvall 56-63%
15 904 4 Duvall 74-81%
16 Sam and Marylin Rupard Farm/ Alder Grove Diary10
Duvall 43-55%
17 Stan Chapman Farm 8 Duvall 42-60%
18 Charles Jancke/Canine Country Club 9 Fall City 36-47%
19 Dale Brevick Residence 4 Fall City 33-37%
20 Donald Evans Farm 5 Fall City 47-48%
21 Fall City Hop Shed 1 Fall City 78%
22 Fred Keller Barn 9 Fall City 37-38%
23 Johnson House 2 Fall City 38-43%
24 Jubliee Farm 15 Fall City 37-52%
25 Mary Thompson Rental House 1 Fall City 57%
26 Residence 1 Fall City 55%
27 Stanley Little Residence 2 Fall City 52-55%
28 Thelma Hart House 1 Fall City 48%
29 Weyerhaeuser Company Snoqualmie Falls Plant15
Snoqualmie 69-82%
30 0739 42%
31 0716-1 42%
32 0717e 42%
33 0717d 42%
34 0717c 42%
35 0717a 42%
36 0902-3 42%
37 0902-4 42%
38 0902-2 42%
39 0902-5 43%
40 0902-1
Results

Maps
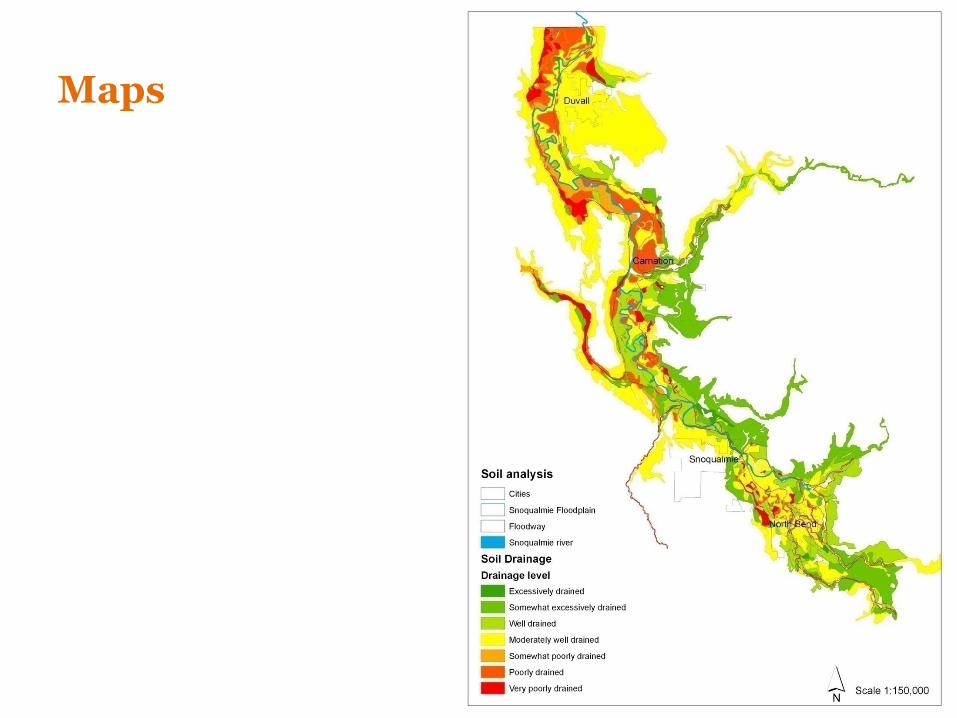
Maps

Maps

Maps

Model developed by the US Corps of EngineersHydrologic Engineering Center (HEC)River Analysis Systems (RAS)
TIN Flood elevation
Detailed survey information
Use of HEC RASReplicate information to verify data
HEC1
Process- Flood information HEC RAS