RISING COSTS FOR PATENTED DRUGS DRIVE … · rising costs for patented drugs drive growth of...
12
RISING COSTS FOR PATENTED DRUGS DRIVE GROWTH OF PHARMACEUTICAL SPENDING IN THE U.S.
Transcript of RISING COSTS FOR PATENTED DRUGS DRIVE … · rising costs for patented drugs drive growth of...

RISING COSTS FOR PATENTED DRUGS DRIVE GROWTH OF PHARMACEUTICAL SPENDING IN THE U.S.
Rising Costs for Patented Drugs Drive Growth of Pharmaceutical Spending in the U.S. ( 1 )
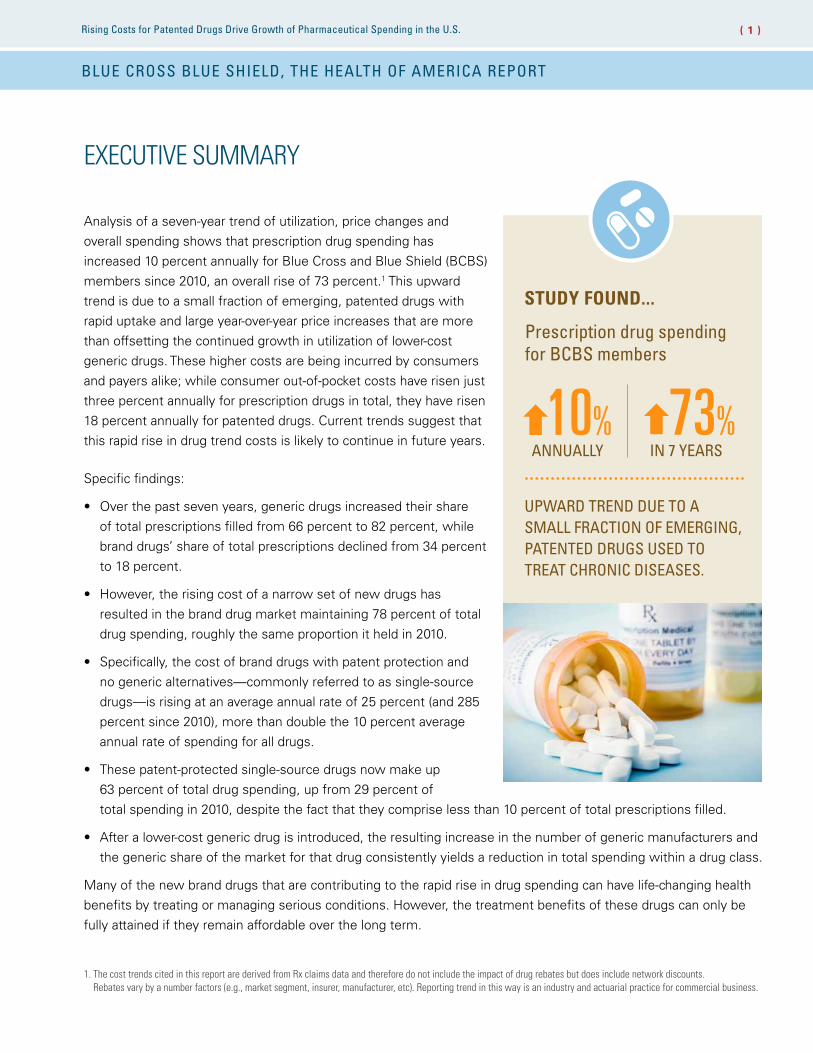
Analysis of a seven-year trend of utilization, price changes and overall spending shows that prescription drug spending has increased 10 percent annually for Blue Cross and Blue Shield (BCBS) members since 2010, an overall rise of 73 percent.1 This upward trend is due to a small fraction of emerging, patented drugs with rapid uptake and large year-over-year price increases that are more than offsetting the continued growth in utilization of lower-cost generic drugs. These higher costs are being incurred by consumers and payers alike; while consumer out-of-pocket costs have risen just three percent annually for prescription drugs in total, they have risen 18 percent annually for patented drugs. Current trends suggest that this rapid rise in drug trend costs is likely to continue in future years.
Specific findings:
• Over the past seven years, generic drugs increased their share of total prescriptions filled from 66 percent to 82 percent, while brand drugs’ share of total prescriptions declined from 34 percent to 18 percent.
• However, the rising cost of a narrow set of new drugs has resulted in the brand drug market maintaining 78 percent of total drug spending, roughly the same proportion it held in 2010.
• Specifically, the cost of brand drugs with patent protection and no generic alternatives—commonly referred to as single-source drugs—is rising at an average annual rate of 25 percent (and 285 percent since 2010), more than double the 10 percent average annual rate of spending for all drugs.
• These patent-protected single-source drugs now make up 63 percent of total drug spending, up from 29 percent of total spending in 2010, despite the fact that they comprise less than 10 percent of total prescriptions filled.
• After a lower-cost generic drug is introduced, the resulting increase in the number of generic manufacturers and the generic share of the market for that drug consistently yields a reduction in total spending within a drug class.
Many of the new brand drugs that are contributing to the rapid rise in drug spending can have life-changing health benefits by treating or managing serious conditions. However, the treatment benefits of these drugs can only be fully attained if they remain affordable over the long term.
EXECUTIVE SUMMARY
BLUE CROSS BLUE SHIELD, THE HEALTH OF AMERICA REPORT
STUDY FOUND...
Prescription drug spending for BCBS members
UPWARD TREND DUE TO A SMALL FRACTION OF EMERGING, PATENTED DRUGS USED TO TREAT CHRONIC DISEASES.
IN 7 YEARS73%
ANNUALLY10%
1. The cost trends cited in this report are derived from Rx claims data and therefore do not include the impact of drug rebates but does include network discounts. Rebates vary by a number factors (e.g., market segment, insurer, manufacturer, etc). Reporting trend in this way is an industry and actuarial practice for commercial business.
Rising Costs for Patented Drugs Drive Growth of Pharmaceutical Spending in the U.S. ( 2 )
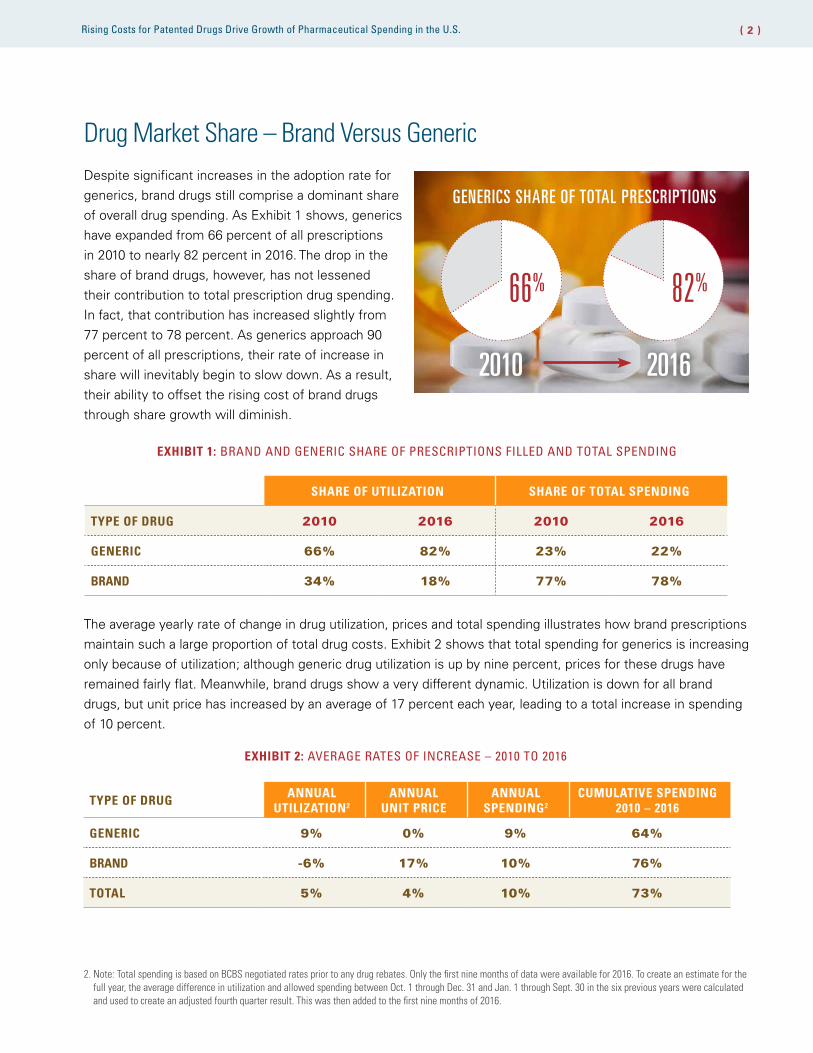
Drug Market Share – Brand Versus GenericDespite significant increases in the adoption rate for generics, brand drugs still comprise a dominant share of overall drug spending. As Exhibit 1 shows, generics have expanded from 66 percent of all prescriptions in 2010 to nearly 82 percent in 2016. The drop in the share of brand drugs, however, has not lessened their contribution to total prescription drug spending. In fact, that contribution has increased slightly from 77 percent to 78 percent. As generics approach 90 percent of all prescriptions, their rate of increase in share will inevitably begin to slow down. As a result, their ability to offset the rising cost of brand drugs through share growth will diminish.
EXHIBIT 1: BRAND AND GENERIC SHARE OF PRESCRIPTIONS FILLED AND TOTAL SPENDING
The average yearly rate of change in drug utilization, prices and total spending illustrates how brand prescriptions maintain such a large proportion of total drug costs. Exhibit 2 shows that total spending for generics is increasing only because of utilization; although generic drug utilization is up by nine percent, prices for these drugs have remained fairly flat. Meanwhile, brand drugs show a very different dynamic. Utilization is down for all brand drugs, but unit price has increased by an average of 17 percent each year, leading to a total increase in spending of 10 percent.
SHARE OF UTILIZATION SHARE OF TOTAL SPENDING
TYPE OF DRUG 2010 2016 2010 2016
GENERIC 66% 82% 23% 22%
BRAND 34% 18% 77% 78%
2. Note: Total spending is based on BCBS negotiated rates prior to any drug rebates. Only the first nine months of data were available for 2016. To create an estimate for the full year, the average difference in utilization and allowed spending between Oct. 1 through Dec. 31 and Jan. 1 through Sept. 30 in the six previous years were calculated and used to create an adjusted fourth quarter result. This was then added to the first nine months of 2016.
TYPE OF DRUG ANNUAL UTILIZATION2
ANNUAL UNIT PRICE
ANNUAL SPENDING2
CUMULATIVE SPENDING 2010 – 2016
GENERIC 9% 0% 9% 64%
BRAND -6% 17% 10% 76%
TOTAL 5% 4% 10% 73%
EXHIBIT 2: AVERAGE RATES OF INCREASE – 2010 TO 2016
2010 2016
GENERICS SHARE OF TOTAL PRESCRIPTIONS
66% 82%
Rising Costs for Patented Drugs Drive Growth of Pharmaceutical Spending in the U.S. ( 3 )
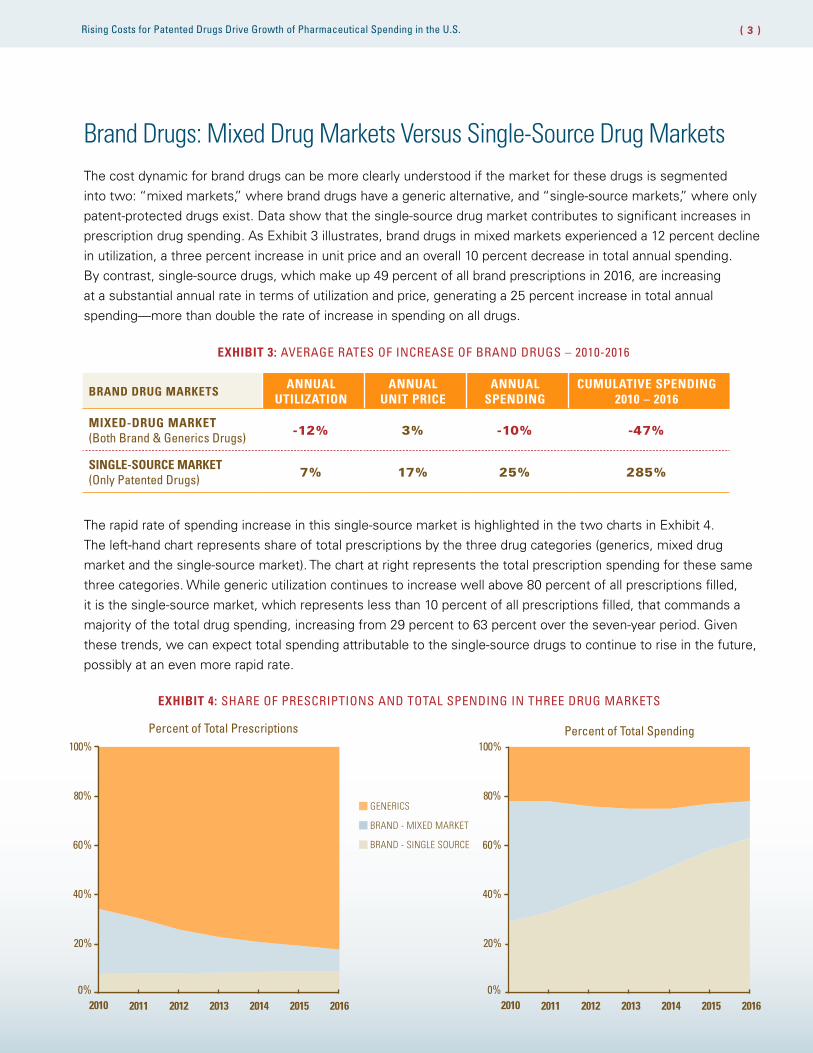
EXHIBIT 4: SHARE OF PRESCRIPTIONS AND TOTAL SPENDING IN THREE DRUG MARKETS
Brand Drugs: Mixed Drug Markets Versus Single-Source Drug MarketsThe cost dynamic for brand drugs can be more clearly understood if the market for these drugs is segmented into two: “mixed markets,” where brand drugs have a generic alternative, and “single-source markets,” where only patent-protected drugs exist. Data show that the single-source drug market contributes to significant increases in prescription drug spending. As Exhibit 3 illustrates, brand drugs in mixed markets experienced a 12 percent decline in utilization, a three percent increase in unit price and an overall 10 percent decrease in total annual spending. By contrast, single-source drugs, which make up 49 percent of all brand prescriptions in 2016, are increasing at a substantial annual rate in terms of utilization and price, generating a 25 percent increase in total annual spending—more than double the rate of increase in spending on all drugs.
EXHIBIT 3: AVERAGE RATES OF INCREASE OF BRAND DRUGS – 2010-2016
The rapid rate of spending increase in this single-source market is highlighted in the two charts in Exhibit 4. The left-hand chart represents share of total prescriptions by the three drug categories (generics, mixed drug market and the single-source market). The chart at right represents the total prescription spending for these same three categories. While generic utilization continues to increase well above 80 percent of all prescriptions filled, it is the single-source market, which represents less than 10 percent of all prescriptions filled, that commands a majority of the total drug spending, increasing from 29 percent to 63 percent over the seven-year period. Given these trends, we can expect total spending attributable to the single-source drugs to continue to rise in the future, possibly at an even more rapid rate.
0%
20%
40%
60%
80%
100%
2010 2011 2012 2013 2014 2015 2016
BRAND DRUG MARKETSANNUAL
UTILIZATIONANNUAL
UNIT PRICEANNUAL
SPENDINGCUMULATIVE SPENDING
2010 – 2016
MIXED-DRUG MARKET (Both Brand & Generics Drugs) -12% 3% -10% -47%
SINGLE-SOURCE MARKET (Only Patented Drugs) 7% 17% 25% 285%
Percent of Total Prescriptions
GENERICS
BRAND - MIXED MARKET
BRAND - SINGLE SOURCE
Percent of Total Spending
2010 2011 2012 2013 2014 2015 20160%
20%
40%
60%
80%
100%

Rising Costs for Patented Drugs Drive Growth of Pharmaceutical Spending in the U.S. ( 4 )
The Single-Source Drug MarketBreaking down single-source drugs by broad drug group classifications as shown in Exhibit 5, reveals that a majority of drug groups had double digit price increases from 2010 to 2016, ranging from eight percent annually for patented asthma drugs to 30 percent for dermatological drugs.
EXHIBIT 5: DRUG GROUP ANNUAL UNIT COST INCREASES AND SHARE OF SPEND
The top 25 single-source drugs make up more than half of drug spending in this market. The list, presented in Exhibit 6, shows that nearly all had rapid year-over-year growth in both utilization and unit price, with annual spending increases well into double digits. As noted in the introduction, the high cost of these drugs needs to be weighed, on a case-by-case basis, against their potential effectiveness in treating or managing serious conditions.
DRUG GROUP*ANNUAL UNIT
COST INCREASE 2010 - 2016 (%)
SHARE OF SPEND
2015 (%)
SKIN CONDITION (Psoriasis, Eczema, Acne, etc.)
30 3
ANTIVIRALS (Hepatitis C, HIV) 19 14
HIGH CHOLESTEROL THERAPIES 18 2
CANCER 17 5
NEUROLOGICAL AGENTS (MS, Dementia, Alzheimer’s, etc.)
14 10
DIABETES 14 17
ANTI-INFLAMMATORIES (Rheumatoid Arthritis, Inflammation, Pain, etc.)
13 15
ENDOCRINE/METABOLIC AGENTS (Growth Disorders, Thyroid Conditions, etc.)
12 3
STIMULANTS (ADHD, Narcolepsy, etc.) 10 2
ASTHMA 8 5
OTHER† — 24
* Drug groups were created using Medi-Span’s Generic Product Identifier (GPI) classification system with group labels revised for readability.
† Category contains 76 other drug groups with <2% share of spending each.

Rising Costs for Patented Drugs Drive Growth of Pharmaceutical Spending in the U.S. ( 5 )
Nearly half of these drugs (12 of 25, which are shaded in Exhibit 6) are considered “specialty drugs5”. It is estimated that 17 of these drugs will have a long road to generic competition, and price relief is far from certain. Reasons for this delay include:
• Ten of these drugs have more than five years expected patent life remaining
• Four (Humira, Enbrel, Rebif, Stelara) are biologicals that, because of their complexity and complicated approval process, will be difficult and expensive for biosimilars to replicate. Biosimilars for Humira and Enbrel have already been approved, but launch has been delayed due to a variety of challenges, including manufacturing, interchangeability with the innovator product, uncertain market acceptance and unknown price savings
• Four (Lantus, Novolog, Levemir, Humalog) are insulins that have proven historically to be difficult to replace with generics due to their clinical and patent complexity
• Two (Lantus, Somatropin) have had other drug developers receive 505(b)(2) approval for new brand drugs that are similar to these established drugs but not true generics
As a result, low-cost generic alternatives to the majority of these drugs cannot be expected anytime soon.
5. Specialty drugs are typically expensive medications used to treat complex chronic conditions and often require special handling, administration or monitoring. CVS specialty, Comprehensive Specialty Pharmacy Drug List
SPECIALTY DRUGS THAT HAVE A LONG ROAD TO GENERIC COMPETITION:
DRUG ANTICIPATED GENERIC
DRUG ENTRY TO MARKET
HUMIRA < 5 YEARS
HARVONI 15 YEARS
ENBREL 2-12 YEARS
COPAXONE 40 < 5 YEARS
REBIF < 5 YEARS
TECFIDERA 6-9 YEARS
ATRIPLA < 5 YEARS
REVLIMID < 5 YEARS
SOVALDI > 10 YEARS
GILENYA < 5 YEARS
STELARA 6-9 YEARS
TRUVADA < 5 YEARS

Rising Costs for Patented Drugs Drive Growth of Pharmaceutical Spending in the U.S. ( 6 )
DRUG (Brand Name) DRUG GROUP
ANTICIPATED MARKET ENTRY OF GENERIC
COMPETITION* (in Years)
ANNUAL UTILIZATION
ANNUAL UNIT PRICE
ANNUAL SPENDING
CUMULATIVE SPENDING 2010 – 2016
Humira Anti-Inflammatories < 5† 16% 15% 33% 465%
Harvoni Antivirals 15 New After 2010‡
Enbrel Anti-Inflammatories 2 – 12†,§ 3% 14% 17% 159%
Lantus Antidiabetics Basaglar|| (Brand Competitor) Launched Dec. 2016
9% 13% 23% 250%
Copaxone Neurological Agents Generic for Copaxone 20 Launched Apr. 2015
< 5 years (Copaxone 40)
2% 11% 13% 111%
Novolog Antidiabetics < 5 15% 14% 32% 421%
Rebif Neurological Agents < 5† -7% 14% 6% 42%
Tecfidera Neurological Agents 6 – 9 New After 2010‡
Advair Antiasthmatic/ Bronchodialators
< 5 for Advair Diskus 6 – 9 for Advair HFA -6% 8% 2% 13%
Victoza Antidiabetics 6 – 9 39% 12% 56% 1325%
Vyvanse Stimulant 6 – 9 16% 10% 28% 337%
Januvia Antidiabetics < 5 6% 12% 18% 176%
Lyrica Anticonvulsants < 5 2% 16% 19% 182%
Atripla Antivirals < 5 5% 8% 14% 115%
Somatropin¶ Endocrine/ Metabolic Agents
Several Approved Brand Products|| 5% 7% 12% 98%
Levemir Antidiabetics < 5 15% 13% 30% 393%
Revlimid Assorted Classes < 5 15% 6% 22% 231%
Sovaldi Antivirals > 10 New After 2010‡
Invokana Antidiabetics > 10 New After 2010‡
Gilenya Neurological Agents < 5 140% 8% 159% 30230%
Humalog Antidiabetics < 5 0% 14% 14% 118%
Stelara Dermatologicals 6 – 9† 53% 9% 67% 2074%
Truvada Antivirals < 5 22% 7% 31% 397%
Zetia Antihyperlipidemics Generic launched Dec. 2016 -4% 17% 12% 100%
Xarelto Anticoagulants 6 – 9 New After 2010‡
EXHIBIT 6: TOP 25 SINGLE-SOURCE MARKET DRUGS IN TERMS OF SPENDING IN 2015 – RATE OF INCREASE FROM 2010 TO 2016
* Launch dates are estimates only made by a combination of patent life remaining, additional exclusivity remaining and the outcome of patent litigation between manufacturers.
† These four drugs are biological drug products that requires a biosimilar replacement that is harder to produce than a typical generic. Biosimilars for Humira and Enbrel have already been approved by the FDA but launch has been delayed due to complexities of manufacturing, issues with interchangeability with the original innovator product, unknown market acceptance by prescribers and consumers and uncertain price savings, but far less than a typical generic.
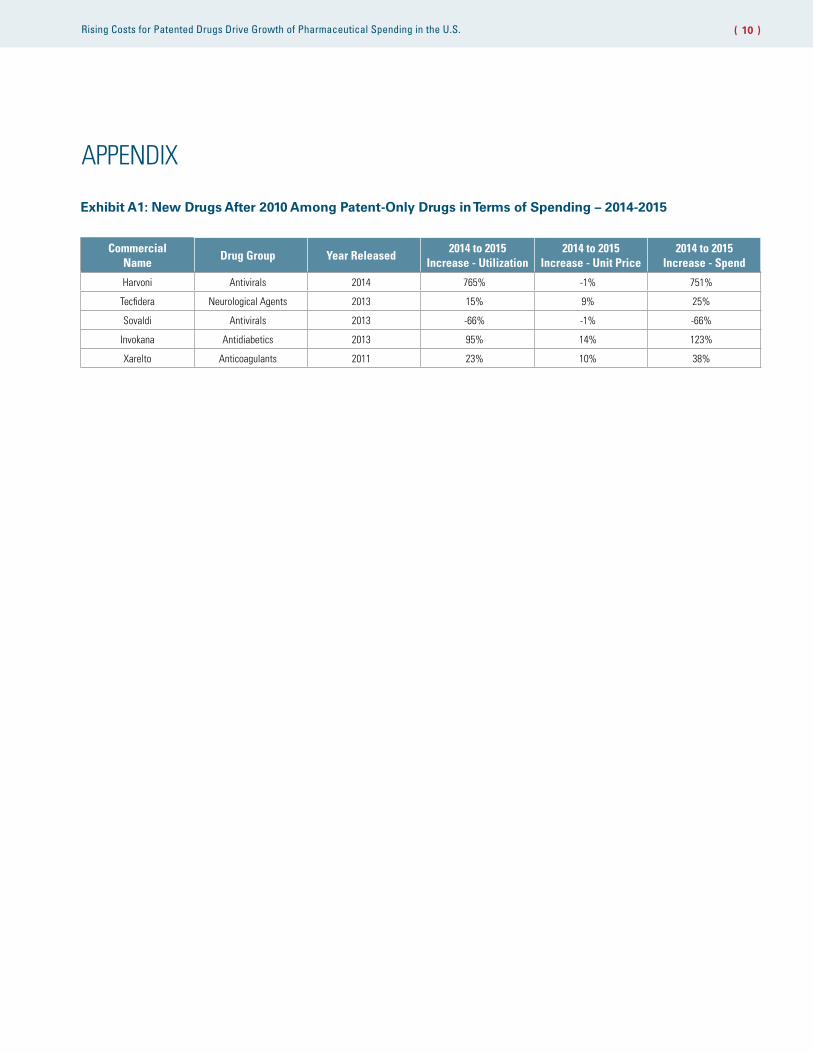
‡ Drugs introduced after 2010 are not shown here because changes in their utilization and pricing are affected by new product “ramp up.” We have provided the results for these drugs in Exhibit A1 in the Appendix.
§ The window for Enbrel is highly variable due to extended patents in 2011 and 2012 and current litigation.|| Basaglar and several brand Somatropin products approved through 505(b)(2) pathway, see bullet above.
¶ Brand names include Genotrope, Omnitrope, Norditropin and Humatrope.
Rising Costs for Patented Drugs Drive Growth of Pharmaceutical Spending in the U.S. ( 7 )
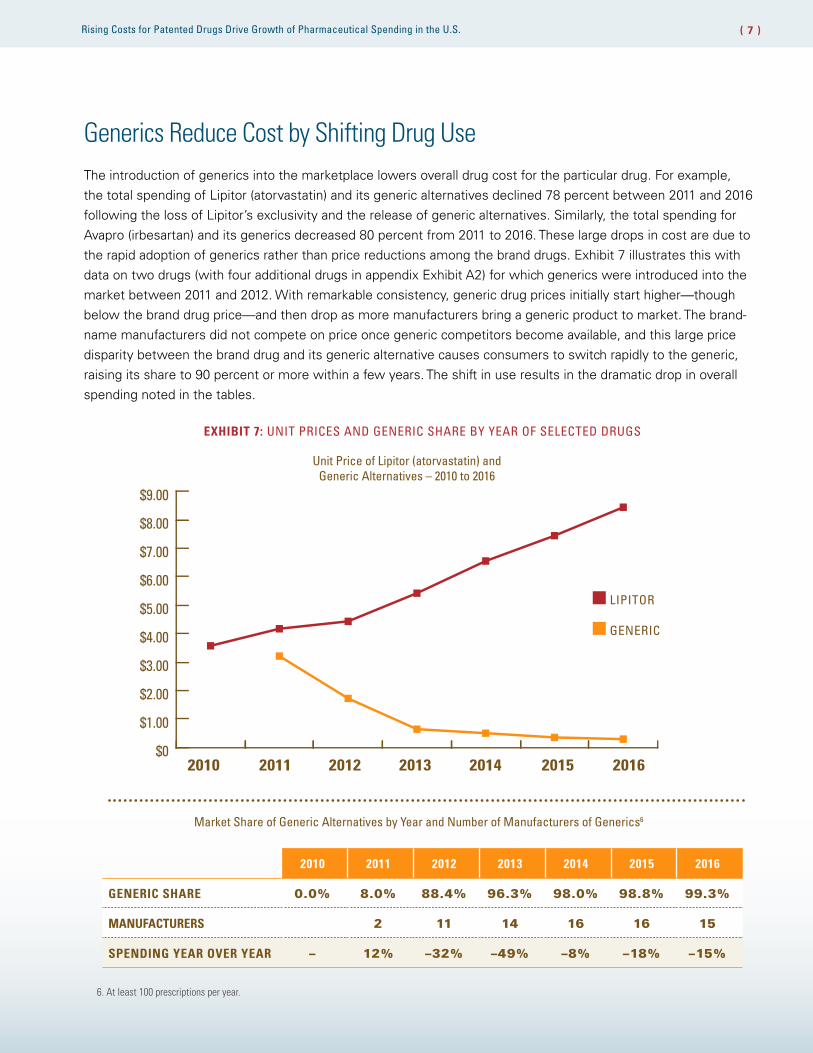
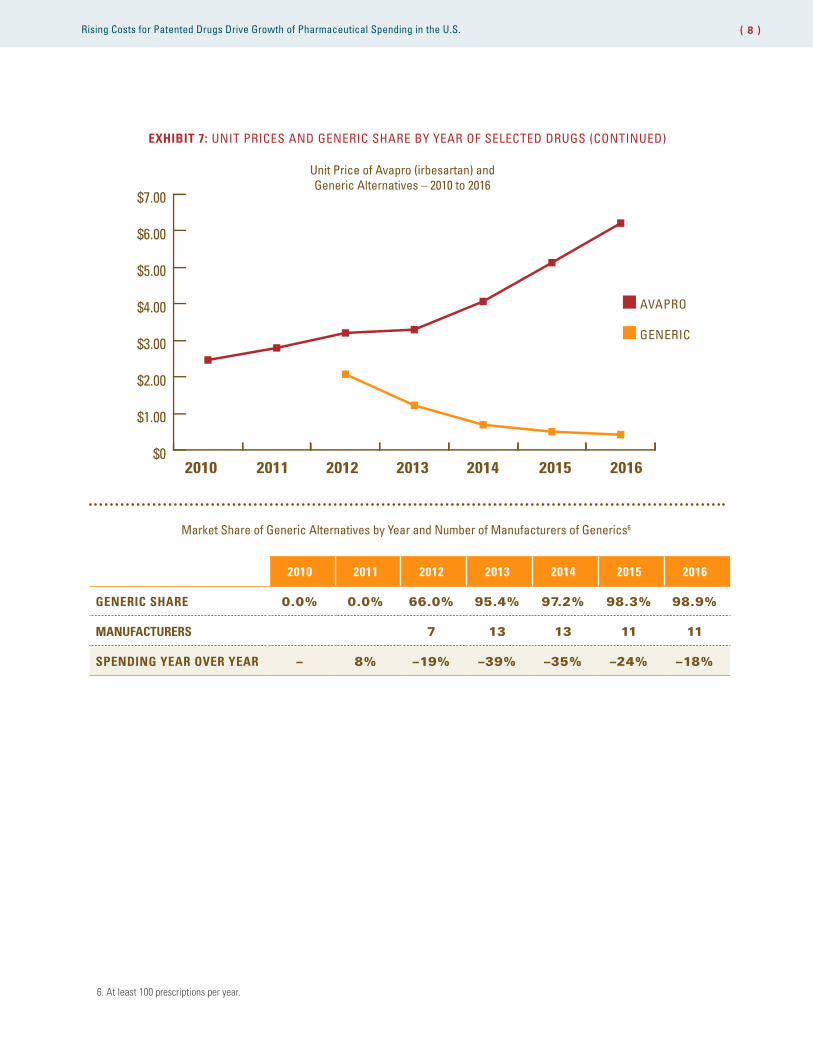
Generics Reduce Cost by Shifting Drug UseThe introduction of generics into the marketplace lowers overall drug cost for the particular drug. For example, the total spending of Lipitor (atorvastatin) and its generic alternatives declined 78 percent between 2011 and 2016 following the loss of Lipitor’s exclusivity and the release of generic alternatives. Similarly, the total spending for Avapro (irbesartan) and its generics decreased 80 percent from 2011 to 2016. These large drops in cost are due to the rapid adoption of generics rather than price reductions among the brand drugs. Exhibit 7 illustrates this with data on two drugs (with four additional drugs in appendix Exhibit A2) for which generics were introduced into the market between 2011 and 2012. With remarkable consistency, generic drug prices initially start higher—though below the brand drug price—and then drop as more manufacturers bring a generic product to market. The brand-name manufacturers did not compete on price once generic competitors become available, and this large price disparity between the brand drug and its generic alternative causes consumers to switch rapidly to the generic, raising its share to 90 percent or more within a few years. The shift in use results in the dramatic drop in overall spending noted in the tables.
EXHIBIT 7: UNIT PRICES AND GENERIC SHARE BY YEAR OF SELECTED DRUGS
$0
$1.00
$2.00
$3.00
$4.00
$5.00
$6.00
$7.00
$8.00
$9.00
2010 2011 2012 2013 2014 2015 2016
Unit Price of Lipitor (atorvastatin) and Generic Alternatives – 2010 to 2016
LIPITOR
GENERIC
2010 2011 2012 2013 2014 2015 2016
GENERIC SHARE 0.0% 8.0% 88.4% 96.3% 98.0% 98.8% 99.3%
MANUFACTURERS 2 11 14 16 16 15
SPENDING YEAR OVER YEAR – 12% –32% –49% –8% –18% –15%
Market Share of Generic Alternatives by Year and Number of Manufacturers of Generics6
6. At least 100 prescriptions per year.
Rising Costs for Patented Drugs Drive Growth of Pharmaceutical Spending in the U.S. ( 8 )
$0
$1.00
$2.00
$3.00
$4.00
$5.00
$6.00
$7.00
2010 2011 2012 2013 2014 2015 2016
Unit Price of Avapro (irbesartan) and Generic Alternatives – 2010 to 2016
AVAPRO
GENERIC
2010 2011 2012 2013 2014 2015 2016
GENERIC SHARE 0.0% 0.0% 66.0% 95.4% 97.2% 98.3% 98.9%
MANUFACTURERS 7 13 13 11 11
SPENDING YEAR OVER YEAR – 8% –19% –39% –35% –24% –18%
Market Share of Generic Alternatives by Year and Number of Manufacturers of Generics6
EXHIBIT 7: UNIT PRICES AND GENERIC SHARE BY YEAR OF SELECTED DRUGS (CONTINUED)
6. At least 100 prescriptions per year.
Rising Costs for Patented Drugs Drive Growth of Pharmaceutical Spending in the U.S. ( 9 )
Over the seven-year study period, a limited number of patent-protected prescription drugs have driven the entire year-over-year increase in drug costs. Generics have only managed to offset the cost growth of these patented drugs by taking an increasing share of total prescriptions. Despite generics accounting for 82 percent of all prescriptions in 2016, patented drugs account for 63 percent of total spending. This 63 percent share of spending is more than a two-fold increase over their share in 2010, and this rise shows no signs of leveling off. Moreover, if the expansion of generic share slows down or if the number of drugs qualifying for patent protection increases in the coming years, these cost trends could rise even faster.
BCBS companies help customers maximize their prescription coverage to get the drugs they need at the most affordable cost. For example, members are encouraged to use generic prescription medicines, mail-order delivery and home infusion, when available, and follow medication plans as prescribed by their doctors.
CONCLUSION
METHODOLOGY NOTES This is the twelfth study of the Blue Cross Blue Shield: The Health of America Report series, a collaboration between the Blue Cross Blue Shield Association and Blue Health Intelligence, which uses a market-leading claims database to uncover key trends and insights into healthcare affordability and access to care.
The report examines the medical claims of more than 30 million BCBS commercially-insured members per year (non-Medicare) and more than $208 billion in prescription spending from January 2010 through September 2016.* Unit prices were computed as the total cost of the prescription divided by the days supplied, or the average daily price of the prescription.
For more information and to read past reports, visit www.bcbs.com/healthofamerica.
* Only the first nine months of data were available for 2016. To create an estimate for the full year, the average difference in utilization and allowed spending between Oct. 1 through Dec. 31 and Jan. 1 through Sept. 30 in the six previous years were calculated and used to create an adjusted fourth quarter result. This was then added to the first nine months of 2016.
SM
All product names, logos and brands are property of their respective owners and used for identification purposes only. Use of these names, logos and brands does not imply endorsement.
Rising Costs for Patented Drugs Drive Growth of Pharmaceutical Spending in the U.S. ( 10 )
APPENDIX
Exhibit A1: New Drugs After 2010 Among Patent-Only Drugs in Terms of Spending – 2014-2015
Commercial Name
Drug Group Year Released2014 to 2015
Increase - Utilization2014 to 2015
Increase - Unit Price2014 to 2015
Increase - Spend
Harvoni Antivirals 2014 765% -1% 751%
Tecfidera Neurological Agents 2013 15% 9% 25%
Sovaldi Antivirals 2013 -66% -1% -66%
Invokana Antidiabetics 2013 95% 14% 123%
Xarelto Anticoagulants 2011 23% 10% 38%

Rising Costs for Patented Drugs Drive Growth of Pharmaceutical Spending in the U.S. ( 11 )
Exhibit A2: Unit Prices and Generic Share by Year of Selected Drugs
$0
$1.00
$2.00
$3.00
$4.00
$5.00
$6.00
$7.00
$8.00
2010 2011 2012 2013 2014 2015 2016
Unit Price of Singulair (montelukast) and Generic Alternatives – 2010 to 2016
SINGULAIR
GENERIC
2010 2011 2012 2013 2014 2015 2016
GENERIC SHARE 0.0% 0.0% 41.1% 98.3% 99.0% 99.3% 99.5%
MANUFACTURERS 13 18 21 24 25
SPENDING YEAR OVER YEAR – 16% –9% –58% –36% –23% –20%
Market Share of Generic Alternatives by Year and Number of Manufacturers of Generics6
$0
$10.00
$20.00
$30.00
2010 2011 2012 2013 2014 2015 2016
Unit Price of Femara (letrozole) and Generic Alternatives – 2010 to 2016
FEMARA
GENERIC
2010 2011 2012 2013 2014 2015 2016
GENERIC SHARE 0.0% 58.3% 94.8% 96.8% 98.1% 98.8% 99.0%
MANUFACTURERS 8 10 9 8 8 7
SPENDING YEAR OVER YEAR – –19% –74% –36% –23% –15% –9%
Market Share of Generic Alternatives by Year and Number of Manufacturers of Generics6
$0
$5.00
$10.00
$15.00
$20.00
$25.00
2010 2011 2012 2013 2014 2015 2016
Unit Price of Seroquel (quetiapine) and Generic Alternatives – 2010 to 2016
SEROQUEL
GENERIC
2010 2011 2012 2013 2014 2015 2016
GENERIC SHARE 0.0% 0.0% 59.9% 83.4% 85.5% 86.7% 88.4%
MANUFACTURERS 13 16 17 17 15
SPENDING YEAR OVER YEAR – %16 –32% –30% 0% –3% –9%
Market Share of Generic Alternatives by Year and Number of Manufacturers of Generics6
$0
$2.00
$4.00
$6.00
$8.00
$10.00
2010 2011 2012 2013 2014 2015 2016
Unit Price of Lexopro (escitalopram) and Generic Alternatives – 2010 to 2016
LEXOPRO
GENERIC
2010 2011 2012 2013 2014 2015 2016
GENERIC SHARE 0.0% 0.0% 77.4% 96.9% 98.0% 98.6% 99.0%
MANUFACTURERS 0 0 9 17 20 22 25
SPENDING YEAR OVER YEAR – 8% –11% –48% –39% –28% –16%
Market Share of Generic Alternatives by Year and Number of Manufacturers of Generics6
6. At least 100 prescriptions per year.