Rising Above the Bottom Line...In health care, rising costs over time hav e outpaced any gains made...
100
International Global Centre for Nursing Executives research consulting technology Rising Above the Bottom Line Nurse-led opportunities to achieve sustainable cost savings Look inside for 11 proven strategies for labour savings, including: • Creating accurate targets • Precisely matching staffing to predicted demand • Embedding flexibility to respond to unpredictable mismatches • Leveraging the skills and training of every member of the care team
Transcript of Rising Above the Bottom Line...In health care, rising costs over time hav e outpaced any gains made...

InternationalGlobal Centre for Nursing Executives
research consultingtechnology
Rising Above the Bottom Line
Nurse-led opportunities to achieve sustainable cost savings
Look inside for 11 proven strategies for labour savings, including:
• Creating accurate targets
• Precisely matching staffing to predicted demand
• Embedding flexibility to respond to unpredictable mismatches
• Leveraging the skills and training of every member of the care team

TOPIC
LEARN HOW TO
• Identify top opportunities for labour savings without cutting personnel
• Set targets that match staffing to predicted demand
• Reduce premium labour use
• Ensure maximum value in care team hours
Nursing productivity
READING TIME
2 hr.
BEST FOR
Nurse executives and other members of the executive team

research technology consulting
Rising Above the Bottom Line
Nurse-led opportunities to achieve sustainable cost savings
InternationalGlobal Centre for Nursing Executives

©2016 Advisory Board • All Rights Reserved • 34059 advisory.com2
LEGAL CAVEAT
Advisory Board is a division of The Advisory Board Company. Advisory Board has made efforts to verify the accuracy of the information it provides to members. This report relies on data obtained from many sources, however, and Advisory Board cannot guarantee the accuracy of the information provided or any analysis based thereon. In addition, Advisory Board is not in the business of giving legal, medical, accounting, or other professional advice, and its reports should not be construed as professional advice. In particular, members should not rely on any legal commentary in this report as a basis for action, or assume that any tactics described herein would be permitted by applicable law or appropriate for a given member’s situation. Members are advised to consult with appropriate professionals concerning legal, medical, tax, or accounting issues, before implementing any of these tactics. Neither Advisory Board nor its officers, directors, trustees, employees, and agents shall be liable for any claims, liabilities, or expenses relating to (a) any errors or omissions in this report, whether caused by Advisory Board or any of its employees or agents, or sources or other third parties, (b) any recommendation or graded ranking by Advisory Board, or (c) failure of member and its employees and agents to abide by the terms set forth herein.
The Advisory Board Company and the “A” logo are registered trademarks of The Advisory Board Company in the United States and other countries. Members are not permitted to use these trademarks, or any other trademark, product name, service name, trade name, and logo of Advisory Board without prior written consent of Advisory Board. All other trademarks, product names, service names, trade names, and logos used within these pages are the property of their respective holders. Use of other company trademarks, product names, service names, trade names, and logos or images of the same does not necessarily constitute (a) an endorsement by such company of Advisory Board and its products and services, or (b) an endorsement of the company or its products or services by Advisory Board.Advisory Board is not affiliated with any such company.
IMPORTANT: Please read the following.
Advisory Board has prepared this report for the exclusive use of its members. Each member acknowledges and agrees that this report and the information contained herein (collectively, the “Report”) are confidential and proprietary to Advisory Board. By accepting delivery of this Report, each member agrees to abide by the terms as stated herein, including the following:
1. Advisory Board owns all right, title, and interest in and to this Report. Except as stated herein, no right, license, permission, or interest of any kind in this Report is intended to be given, transferred to, or acquired by a member. Each member is authorized to use this Report only to the extent expressly authorized herein.
2. Each member shall not sell, license, republish, or post online or otherwise this Report, in part or in whole. Each member shall not disseminate or permit the use of, and shall take reasonable precautions to prevent such dissemination or use of, this Report by (a) any of its employees and agents (except as stated below), or (b) any third party.
3. Each member may make this Report available solely to those of its employees and agents who (a) are registered for the workshop or membership program of which this Report is a part, (b) require access to this Report in order to learn from the information described herein, and (c) agree not to disclose this Report to other employees or agents or any third party. Each member shall use, and shall ensure that its employees and agents use, this Report for its internal use only. Each member may make a limited number of copies, solely as adequate for use by its employees and agents in accordance with the terms herein.
4. Each member shall not remove from this Report any confidential markings, copyright notices, and/or other similar indicia herein.
5. Each member is responsible for any breach of its obligations as stated herein by any of its employees or agents.
6. If a member is unwilling to abide by any of the foregoing obligations, then such member shall promptly return this Report and all copies thereof to Advisory Board .
Global Centre for Nursing Executives
Project DirectorsMarguerite Baty Lucea, PhD, MPH, RNVanessa Orco-Zerpa, MPP
Contributing ConsultantsSara Teixeira MoerhleAriel ShahKarl Frederick Meyer Whitemarsh
Managing DirectorKatherine Virkstis, ND
Executive DirectorAndrew Rosen, MBA
Design ConsultantJoy Drakes

©2016 Advisory Board • All Rights Reserved • 34059 advisory.com3
Table of Contents
Advisors to Our Work . . . . . . . . . . . . . . . . . . . . . . . . . . . . . . . . . . . . . . . . . . . . . . . . . . . . . . . . . . . . . . . . . . . . . . . . . . . . . . . . . . . 4Executive Summary . . . . . . . . . . . . . . . . . . . . . . . . . . . . . . . . . . . . . . . . . . . . . . . . . . . . . . . . . . . . . . . . . . . . . . . . . . . . . . . . . . . . . 5Move from Insight to Action . . . . . . . . . . . . . . . . . . . . . . . . . . . . . . . . . . . . . . . . . . . . . . . . . . . . . . . . . . . . . . . . . . . . . . . . . . . . . . 6Introduction: Health Care’s “Cost Disease” . . . . . . . . . . . . . . . . . . . . . . . . . . . . . . . . . . . . . . . . . . . . . . . . . . . . . . . . . . . . . . . . . 7Section 1: Establish Safe, Cost-Effective Staffing Targets . . . . . . . . . . . . . . . . . . . . . . . . . . . . . . . . . . . . . . . . . . . . . . . . . . . . 17
Opportunity: Accurately Project Patient Demand . . . . . . . . . . . . . . . . . . . . . . . . . . . . . . . . . . . . . . . . . . . . . . . . . . . . . . . . . 22Opportunity: Set Goals Based on Unit-Level Needs . . . . . . . . . . . . . . . . . . . . . . . . . . . . . . . . . . . . . . . . . . . . . . . . . . . . . . 23
Section 2: More Precisely Match Staffing to Predicted Demand . . . . . . . . . . . . . . . . . . . . . . . . . . . . . . . . . . . . . . . . . . . . . . . . 31Opportunity: Equip Managers to Schedule Appropriate Staff . . . . . . . . . . . . . . . . . . . . . . . . . . . . . . . . . . . . . . . . . . . . . . . . 34Practice 1: Tiered Scheduling Responsibility . . . . . . . . . . . . . . . . . . . . . . . . . . . . . . . . . . . . . . . . . . . . . . . . . . . . . . . . . . . . . 35Practice 2: Skill Mix Tagging . . . . . . . . . . . . . . . . . . . . . . . . . . . . . . . . . . . . . . . . . . . . . . . . . . . . . . . . . . . . . . . . . . . . . . . . . 40Opportunity: Avoid Preventable Scheduling Overlap . . . . . . . . . . . . . . . . . . . . . . . . . . . . . . . . . . . . . . . . . . . . . . . . . . . . . 44Practice 3: Flexible Shift Patterns . . . . . . . . . . . . . . . . . . . . . . . . . . . . . . . . . . . . . . . . . . . . . . . . . . . . . . . . . . . . . . . . . . . . . 45Practice 4: Patient Placement Algorithm . . . . . . . . . . . . . . . . . . . . . . . . . . . . . . . . . . . . . . . . . . . . . . . . . . . . . . . . . . . . . . . . 50
Section 3: Embed Flexibility to Respond to Unexpected Mismatches . . . . . . . . . . . . . . . . . . . . . . . . . . . . . . . . . . . . . . . . . . 53Opportunity: Calibrate Daily Staffing Levels . . . . . . . . . . . . . . . . . . . . . . . . . . . . . . . . . . . . . . . . . . . . . . . . . . . . . . . . . . . . . 57Practice 5: Real-Time Staff Target Tracking . . . . . . . . . . . . . . . . . . . . . . . . . . . . . . . . . . . . . . . . . . . . . . . . . . . . . . . . . . . . . .58Opportunity: Improve In-House Alternatives to Premium Labour . . . . . . . . . . . . . . . . . . . . . . . . . . . . . . . . . . . . . . . . . . . . .63Practice 6: Cross-Subsidised Float Pool . . . . . . . . . . . . . . . . . . . . . . . . . . . . . . . . . . . . . . . . . . . . . . . . . . . . . . . . . . . . . . . . .65Practice 7: “Floater” Support System . . . . . . . . . . . . . . . . . . . . . . . . . . . . . . . . . . . . . . . . . . . . . . . . . . . . . . . . . . . . . . . . . . . 66
Section 4: Fully Leverage the Skills and Training of Each Care Team Member . . . . . . . . . . . . . . . . . . . . . . . . . . . . . . . . . . . .71Opportunity: Optimise Skill Mix Based on Unit-Level Needs . . . . . . . . . . . . . . . . . . . . . . . . . . . . . . . . . . . . . . . . . . . . . . . . 76Practice 8: Unit-Level Modelling . . . . . . . . . . . . . . . . . . . . . . . . . . . . . . . . . . . . . . . . . . . . . . . . . . . . . . . . . . . . . . . . . . . . . . . 77Opportunity: Better Utilise Support Staff to Fully Leverage RNs . . . . . . . . . . . . . . . . . . . . . . . . . . . . . . . . . . . . . . . . . . . . . 79Practice 9: Evidence-Based Sitter Algorithm . . . . . . . . . . . . . . . . . . . . . . . . . . . . . . . . . . . . . . . . . . . . . . . . . . . . . . . . . . . . . 80Practice 10: Specialised PCA Roles . . . . . . . . . . . . . . . . . . . . . . . . . . . . . . . . . . . . . . . . . . . . . . . . . . . . . . . . . . . . . . . . . . . . 86 Opportunity: Reinforce Top-of-License Prioritisation . . . . . . . . . . . . . . . . . . . . . . . . . . . . . . . . . . . . . . . . . . . . . . . . . . . . . . 89Practice 11: Customised Care Teams . . . . . . . . . . . . . . . . . . . . . . . . . . . . . . . . . . . . . . . . . . . . . . . . . . . . . . . . . . . . . . . . . . 90

©2016 Advisory Board • All Rights Reserved • 34059 advisory.com4
Advisors to Our Work
With Sincere AppreciationThe Global Centre for Nursing Executives’ research team is sincerely grateful to those who shared their insights, analyses, and time with us. We would especially like to recognisethe following organisations for being particularly generous with their time and expertise, helping to shape our research.
AUSTRALIABarwon HealthLucy Cuddihy
Darling Downs Hospital and Health ServiceRobyn Henderson
Monash HealthCheyne Chalmers
Princess Alexandra HospitalSean BirganVeronica Casey
Sir Charles Gairdner and Osborne Park Health Care GroupAnthony Dolan
BELGIUMUniversitair ZiekenhuisAntwerpenPaul Van Aken
CANADAAdvisory BoardRhonda Seidman-Carlson
Centre Hospitalier Universitaire de QuébecJosée GuillemetteLucie LévesqueBrigitte Martel
Children's Hospital of Eastern OntarioMorgan Cunningham-FetchMegan WrightHelen Yoxon
Health Sciences NorthDavid McNeil
Michael Garron HospitalIrene AndressSarah Coppinger
Southlake Regional Health CentreAnnette Jones
St. Joseph's Healthcare (Hamilton)Winnie Doyle
St. Joseph's Health Centre (Toronto)Jenni Glad Timmons
ENGLANDEast Sussex Healthcare NHS TrustAngela Colosi
The Royal WolverhamptonHospitals NHS TrustCheryl Etches
IRELANDMayo General HospitalCatherine Donohoe
JERSEYStates of Jersey Health and Social ServicesJulie GarbuttGary KynmanRose NaylorJason Turner
NETHERLANDSZGT AlmeloOlga BoutensAgnes Maas
NORWAYSykehuset ØstfoldAnne-Karine Østbye Roos
SAUDI ARABIA Johns Hopkins Aramco Health CareZeina Khouri-Stevens
King Faisal Specialist Hospital and Research CentreSandy Lovering
UNITED STATESCleveland Clinic HospitalMeg DuffyJeffrey KnoppAngie Walden
Inova Health SystemTheresa DryeMaureen Swick
©2016 Advisory Board • All Rights Reserved • 34059 advisory.com5
Executive Summary
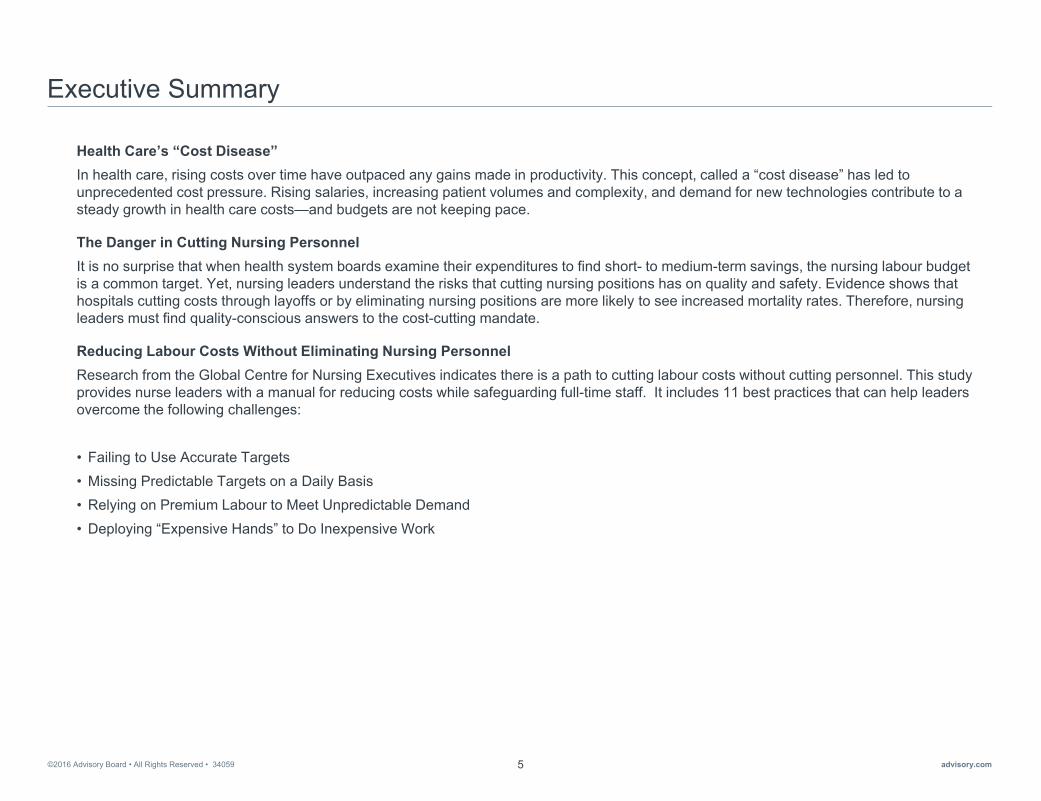
Health Care’s “Cost Disease”In health care, rising costs over time have outpaced any gains made in productivity. This concept, called a “cost disease” has led to unprecedented cost pressure. Rising salaries, increasing patient volumes and complexity, and demand for new technologies contribute to a steady growth in health care costs—and budgets are not keeping pace.
The Danger in Cutting Nursing PersonnelIt is no surprise that when health system boards examine their expenditures to find short- to medium-term savings, the nursing labour budget is a common target. Yet, nursing leaders understand the risks that cutting nursing positions has on quality and safety. Evidence shows that hospitals cutting costs through layoffs or by eliminating nursing positions are more likely to see increased mortality rates. Therefore, nursing leaders must find quality-conscious answers to the cost-cutting mandate.
Reducing Labour Costs Without Eliminating Nursing PersonnelResearch from the Global Centre for Nursing Executives indicates there is a path to cutting labour costs without cutting personnel. This study provides nurse leaders with a manual for reducing costs while safeguarding full-time staff. It includes 11 best practices that can help leaders overcome the following challenges:
• Failing to Use Accurate Targets• Missing Predictable Targets on a Daily Basis• Relying on Premium Labour to Meet Unpredictable Demand• Deploying “Expensive Hands” to Do Inexpensive Work
©2016 Advisory Board • All Rights Reserved • 34059 advisory.com6
Adapt and Implement Proven Practices with Help from Global Centre Tool Suites Move from Insight to Action
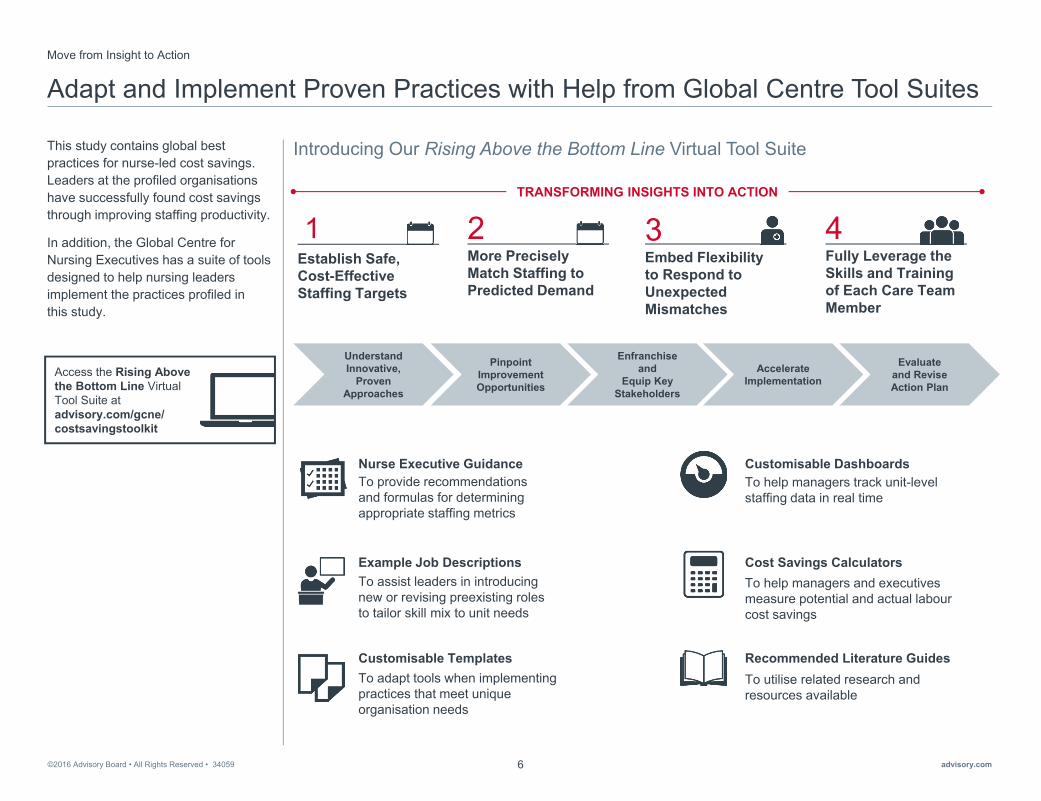
This study contains global best practices for nurse-led cost savings. Leaders at the profiled organisationshave successfully found cost savings through improving staffing productivity.
In addition, the Global Centre for Nursing Executives has a suite of tools designed to help nursing leaders implement the practices profiled in this study.
Understand Innovative,
Proven Approaches
Pinpoint Improvement Opportunities
Enfranchise and
Equip Key Stakeholders
Accelerate Implementation
Evaluateand Revise Action Plan
Introducing Our Rising Above the Bottom Line Virtual Tool Suite
TRANSFORMING INSIGHTS INTO ACTION
Nurse Executive Guidance To provide recommendations and formulas for determining appropriate staffing metrics
Example Job Descriptions To assist leaders in introducing new or revising preexisting roles to tailor skill mix to unit needs
Customisable TemplatesTo adapt tools when implementing practices that meet unique organisation needs
Recommended Literature GuidesTo utilise related research and resources available
Cost Savings Calculators To help managers and executives measure potential and actual labourcost savings
Customisable DashboardsTo help managers track unit-level staffing data in real time
2More Precisely Match Staffing to Predicted Demand
3Embed Flexibility to Respond to Unexpected Mismatches
4Fully Leverage the Skills and Training of Each Care Team Member
Establish Safe, Cost-Effective Staffing Targets
1
Access the Rising Above the Bottom Line Virtual Tool Suite at advisory.com/gcne/ costsavingstoolkit

©2016 Advisory Board • All Rights Reserved • 34059 advisory.com7
►Health Care’s “Cost Disease”
Introduction

©2016 Advisory Board • All Rights Reserved • 34059 advisory.com8
Health Care’s “Cost Disease”
Ironically, the health care industry suffers from a “cost disease,” and it is one of the biggest challenges health care executives are facing today.
The “cost disease” is a concept developed by economist William Baumol. It states that in labour-intensive industries that rely on human interaction and activities, costs rise over time and widely outpace any gains in productivity.
This is in contrast to other industries, in which both productivity gains and cost reductions occur through innovation and automation. For example, by allowing workers to stay in one place, assembly lines in car manufacturing have cut the time required to build a car from 12 hours to less than two.
But, in service-oriented, labour-intensive industries such as education, performing arts, and health care, it is much more difficult to achieve these gains. While some things have been automated (i.e., electronic health records), the majority of health care delivery activities cannot be automated or sped up. As the wages of health care workers rise over time, so does the cost of providing care.
Source: Baumol WJ, The Cost Disease: Why Computers Get Cheaper and Health Care Doesn't, New Haven: Yale University Press, 2012; “An Incurable Disease.” The Economist. 29 September 2012, http://www.economist.com/node/21563714; Advisory Board interviews and analysis.
In the personal services industries [like health care] …automation is not always possible, and labor-saving productivity improvements occur at a rate well below average for the economy…
Employers in [these] sectors face a problem: they need to increase their wages so workers don’t defect. The result is that, although output per worker rises only slowly or not at all, wages go up as fast as they do in the rest of the economy.”
Baumol WJ, The Cost Disease: Why Computers Get Cheaper and Health Care Doesn’t

©2016 Advisory Board • All Rights Reserved • 34059 advisory.com9
Multiple Factors Increase the Pressure from “Cost Disease”
Organisations Face Growing Pressure to Find SavingsIn addition to rising salaries, other forces contribute to the rise in health care costs.
As shown here, patient volume is increasing, and those patients are also older, sicker, and more complex. At the same time, new technologies create demand for more expensive services.
These trends show no signs of abating. Health care executives are faced with a “new normal” that must eventually be addressed through a full transformation of their care delivery model. However, such a universal transformation will take years. In the meantime, leaders must find savings to sustain hospital operations.
The question is: where can organisations look for savings?
Source: Advisory Board interviews and analysis.
Static or Decreasing Budgets, Ballooning Costs “We say we will reinvest sometimes, but the reality is [we are] just surviving because the pressure of the budget cuts is so high that we struggle to make it at the end of the year. Last year nothing came back for example, and that is just the reality.”
Director of Nursing, Canadian public hospital
Mon
ey
Time
Cost Versus Payer Budget Over Time
Example payer spending on health care
Cost required to deliver safe care
Budgetary gap and margin pressures increasing2015
2020
2025
Pressures Increasing Health Care Costs
Wages
Patient volume
Patient complexity
Technology

©2016 Advisory Board • All Rights Reserved • 34059 advisory.com10
Nursing Labour Seen as Easy Target in Cost Cutting
When health system boards examine their expenditures to find short- to medium-term savings, the nursing budget is a common starting point.
This is not surprising, since nursing costs account for approximately 40% of all hospital costs. Of those, an average of 70% are typically comprised of labour costs.
As a result, nurse executives face increasing pressure to cut costs from the nursing budget. To avoid making personnel cuts, many nurse leaders begin by pursuing opportunities for non-labour savings, such as reducing supply waste and revising outdated care protocols.
The Global Centre for Nursing Executives’ briefing Untapped Opportunities for Saving Millions outlines these near-term, non-labourcost savings opportunities.
Source: Simoens S, et al., “Tackling Nurse Shortages in OECD Countries,” OECD Health Working Papers, 2005; Advisory Board interviews and analysis.
1) Organisation for Economic Co-operation and Development.2) Average proportion of budget, based on Advisory Board interviews; range from 50-90; n=20.
Non-labourLabour
Estimated Total Hospital Expenditure in OECD1 Countries
Labour as a Percentage of Nursing Budgets2
40% Nursing Costs
Other Costs
70%
“The challenge is that with nursing being the largest workforce, whenever you are sitting in a room with your operations or financial executives, they always look straight to that workforce.” Nursing executive, Australian public hospital
FOR MORE RESOURCES Consult the Global Centre’s research brief Untapped Opportunities for Savings Millions to learn about the four ripest operational cost-cutting strategies.
• Premium Labour
• Unfavourable Contract Terms
• Outdated Care Protocols
• SupplyWaste

©2016 Advisory Board • All Rights Reserved • 34059 advisory.com11
The Danger in Cutting Nursing Personnel
Cutting Costs Through Layoffs Impacts Patient OutcomesThe reason nurse executives typically aim to exhaust all non-labour cost savings opportunities before cutting personnel from the nursing budget is shown here.
Research has shown that cutting costs through layoffs or by eliminating nursing positions has a negative impact on care quality and safety. Hospitals making large cuts to nursing labour are twice as likely to see a significant increase in patient mortality. Moreover, each additional patient a nurse is assigned increases the likelihood of that patient dying within 30 days of admission by 7%.
Many nurse leaders are now finding themselves with no clear path forward. They must prioritise patient safety, while receiving pressure to cut costs from the nursing labour budget.
Source: Aiken LH, et al., “Patient safety, satisfaction, and quality of hospital care: cross sectional surveys of nurses and patients in 12 countries in Europe and the United States,” BMJ (2012); Ford S, “More than seven patients per nurse risks missing vital care,” Nursing Times, 29 July 2013; Aiken LH, et al., “Nurse staffing and education and hospital mortality in nine European countries: a retrospective observational study,” The Lancet, (February 2014); Murphy M, et al., “Cutting healthcare costs through work force reductions,” Healthcare Financial Management, 1996, 50(7): 64-9; Advisory Board interviews and analysis.
1) Based on survey of 26,516 nurses in nine European countries.
The Need to Think Differently“People are living longer, growing older, with more comorbidities—basically more demand. And we can’t meet that demand in terms of RN workforce...It’s impossible to think we can carry on the status quo in these times of change.”
Nursing executive, NHS Trust
Impact of Insufficient Staffing on Patient Outcomes
Impact of Nurse-to-Patient Ratio on Mortality
7%Percentage by which each additional patient per nurse increased the likelihood of patient dying within 30 days of admission1
Mortality Before and After RN Layoffs
2xLikelihood that hospitals cutting ≥4% of RN workforce see a statistically significant increase in mortality

©2016 Advisory Board • All Rights Reserved • 34059 advisory.com12
Using a “Scalpel” Instead of an “Axe” to Cut Labour Costs
Finding Savings in Nursing Labour Without Cutting PeopleResearch from the Global Centre for Nursing Executives indicates there is a path to cutting costs from the nursing labour budget without cutting personnel or eliminating nursing positions.
Rather than “using an axe” to cut personnel or whole nursing positions, the Global Centre recommends examining the underlying drivers of productivity for opportunities to “use a scalpel” instead. Put another way, nurse executives can make more precise, proactive staffing adjustments by addressing key inefficiencies. The primary drivers of labour costs are the total number of nursing care hours delivered per day and the cost of each worked hour. Several costly inefficiencies exist within each of those drivers, some of which are highlighted here.
By using a “scalpel” rather than an “axe,” nurse executives can ensure that deployed care hours match actual patient demand as closely as possible.
Source: Advisory Board interviews and analysis. 1) Hours per patient day.
× =
Primary Drivers of Labour Expense
Hours per Patient Day
Cost per Worked Hour
Sample Inefficiencies
Inappropriate skill mix distribution
Overreliance on agency staff
Non-adjustable RNto patient ratios
No daily monitoring of HPPD1 targets
Unexpected alterations in patient census
Excess use of overtime
Hours per Patient Day
Costs per Worked Hour
Total Costs per Patient Day

©2016 Advisory Board • All Rights Reserved • 34059 advisory.com13
Mismatches Between Staffing and Patient Demand Result in Avoidable Waste
In order to make more precise, proactive staffing adjustments, nurse leaders should begin by examining the typical census fluctuations on a given day. Although patient demand changes frequently throughout the day, many health care organisations do not adequately account for this fluctuation when setting their staffing patterns.
The typical approach to unit staffing is to use the average daily census (ADC) to determine staffing needs. This approach fails to account for even predictable census peaks and valleys. As a result, leaders often encounter the costly mismatches shown here.
First, if units have too few staff, managers must resort to expensive premium labour to meet patient needs—often agency and overtime.
Second, if units have too many staff for the current census, they are paying for more hours of staff than needed.
Finally, if units have the wrong staff mix, they may be overpaying for each worked hour, or “using expensive hands to do inexpensive work.”
Source: Advisory Board interviews and analysis. 1) Average daily census.
Pat
ient
Cen
sus
Time
Too Few StaffPatient levels above average daily census require calling in expensive labour or running understaffed
ADC
Actual Census Fluctuations Across Time
Too Many StaffPatient levels below average daily census require flexing down or paying staff not needed to meet care demands
Wrong Staff Failure to match level of staff to patient acuity creates unnecessary costs, employing expensive hands to do inexpensive work
Results of Staffing to Annual Average Daily Census
Many organisationscurrently staff to ADC1

©2016 Advisory Board • All Rights Reserved • 34059 advisory.com14
Quantifying the Savings Opportunity in Matching Supply to Demand
By more closely matching staffing to demand, nurse leaders can achieve meaningful labour cost savings.
An Advisory Board study analyseddaily productivity volumes on all units in a 55-hospital cohort. Findings showed that the average 300-bed hospital could save $US 2.4 million by better matching staffing hours to patient demand. The total savings were from three key areas: agency use, overtime use, and being over target.
Source: Carter P, “Operational Productivity and Performance in English NHS Acute Hospitals: Unwarranted Variations,” 2016, https://www.gov.uk/government/uploads/system/uploads/attachment_data/file/499229/Operational_productivity_A.pdf; Nursing Compass, 2008-2009 Cohort Data, The Advisory Board Company; Advisory Board interviews and analysis.1) US dollars.
Small Changes Can Mean Big Savings
“When you consider just 1% improvement in workforce productivity could represent around £400M in savings, it is easy to see why a stronger grip on workforce management can make a significant difference to costs.”
Carter P, Operational Productivity and Performance
in English NHS Acute Hospitals: Unwarranted Variations
2.4M
517K
637K
1.25M
Total Agency Overtime Over Target
Average Annual Savings Opportunity by Area of Spend1
Scaled to Typical 300-Bed Hospital
Too Many or Wrong StaffOver target, spending more than necessary
Too Few Staff:Calling in expensive labour through overtime and agency
Too Few StaffCalling in expensive labour through agency and overtime
Study in Brief: Advisory Board’s Productivity Savings Model Methodology
• Advisory Board’s Nursing Compass: Proprietary Advisory Board analytic platform that monitors workforce productivity; availability limited to US-based organisations
• Study Time Frame: Data pulled from April 2008 to December 2009• Data Selection: 55 hospitals evaluated in six-month period • RN Only: Due to wide variety in existence of nursing assistants and other care providers on units, model
reflects only RN labour costs• HPPD Targets: Over target cost calculated using institution-specific HPPD targets; calculation made on day-
by-day basis, so any target adjustments reflected accurately• Census Metrics: Model tracked census as determined by each institution, with some using midnight census
and some using more frequent census measures• Premium Costs: Overtime, contract hours tracked directly by Compass; cost above non-premium staff
determined using hospital’s mean RN hourly wage• Scaling: Total savings opportunity for hospitals calculated as percentage of internal RN labour costs; also
scaled to typical 300-bed facility, assuming 85% average occupancy rate
©2016 Advisory Board • All Rights Reserved • 34059 advisory.com15
Precisely Matching Staffing to Demand Is No Simple Feat
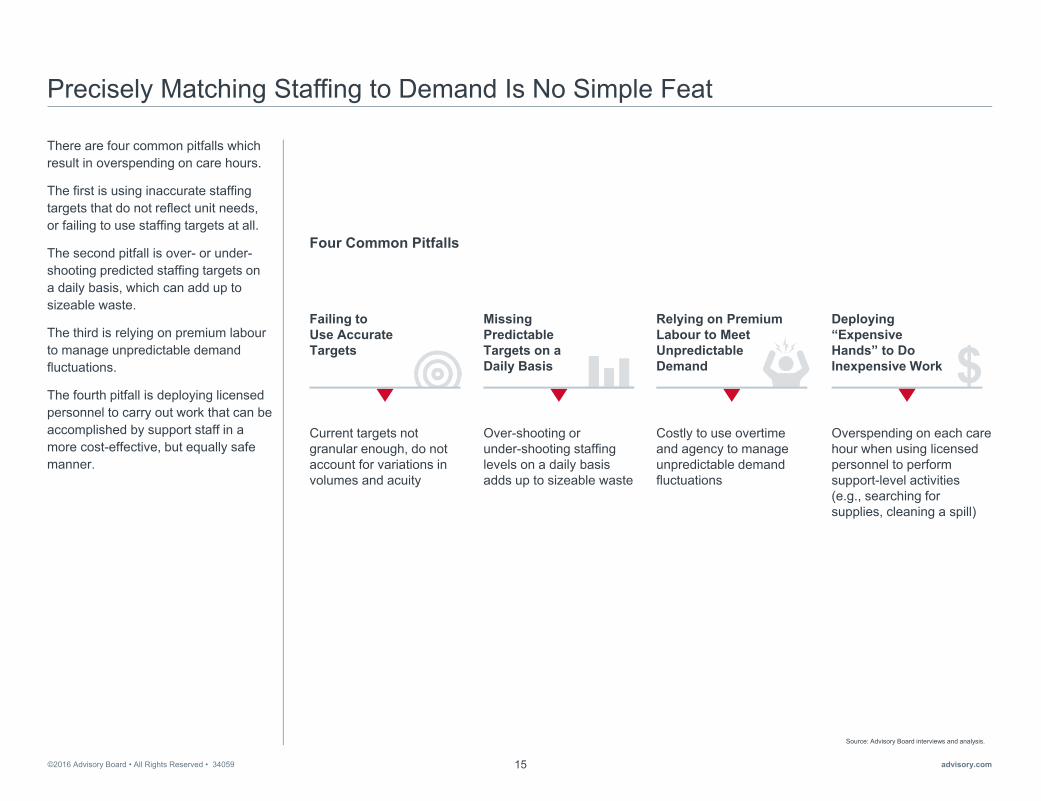
There are four common pitfalls which result in overspending on care hours.
The first is using inaccurate staffing targets that do not reflect unit needs, or failing to use staffing targets at all.
The second pitfall is over- or under-shooting predicted staffing targets on a daily basis, which can add up to sizeable waste.
The third is relying on premium labourto manage unpredictable demand fluctuations.
The fourth pitfall is deploying licensed personnel to carry out work that can be accomplished by support staff in a more cost-effective, but equally safe manner.
Source: Advisory Board interviews and analysis.
Four Common Pitfalls
Overspending on each care hour when using licensed personnel to perform support-level activities (e.g., searching for supplies, cleaning a spill)
Deploying “Expensive Hands” to Do Inexpensive Work
Costly to use overtime and agency to manage unpredictable demand fluctuations
Relying on Premium Labour to Meet Unpredictable Demand
Over-shooting or under-shooting staffing levels on a daily basis adds up to sizeable waste
Missing Predictable Targets on a Daily Basis
Current targets not granular enough, do not account for variations in volumes and acuity
Failing to Use Accurate Targets

©2016 Advisory Board • All Rights Reserved • 34059 advisory.com16
Rising Above the Bottom Line
To help nurse leaders avoid the four pitfalls shown on the previous page and take a more proactive role in budgetary decisions, the Global Centre for Nursing Executives has developed the strategic framework shown here.
First, nursing leaders must develop accurate, cost-effective staffing targets that reflect patient demand and unit needs.
Second, leaders must equip managers to more precisely match staffing to predicted demand by addressing both scheduling overlap and scheduling complexity.
Third, leaders must reduce reliance on premium labour by embedding flexibility into their organisation’sworkforce.
Fourth, leaders must ensure every caregiver is working at the highest level of his or her training or preparation.
The remainder of this report provides best practices for achieving these aims.
Source: Advisory Board interviews and analysis.
2More Precisely Match Staffing to Predicted Demand
Equip Managers to Schedule Appropriate Staff
Avoid Preventable Scheduling Overlap
3. Flexible Shift Patterns
4. Patient Placement Algorithm
1. Tiered Scheduling Responsibility
2. Skill Mix Tagging
3Embed Flexibility to Respond to Unexpected Mismatches
Calibrate Daily Staffing Levels
Improve In-House Alternatives to Premium Labour
5. Real-Time Staff Target Tracking
6. Cross-SubsidisedFloat Pool
7. “Floater” Support System
Optimise Skill Mix Based on Unit-Level Needs
4Fully Leverage the Skills and Training of Each Care Team Member
Better Utilise Support Staff to Fully Leverage RNs
Reinforce Top-of-License Prioritisation
11. Customised Care Teams
8. Unit-Level Modelling
9. Evidence-Based Sitter Algorithm
10. Specialised PCA Roles
Establish Safe, Cost-Effective Staffing Targets
1
Accurately Project Patient Demand
Set Goals Based on Unit-Level Needs
Best Practices for Achieving Sustainable Cost Savings

©2016 Advisory Board • All Rights Reserved • 34059 advisory.com17
1
►Establish Safe, Cost-Effective Staffing Targets
Section
• Accurately Project Patient Demand
• Set Goals Based on Unit-Level Needs

©2016 Advisory Board • All Rights Reserved • 34059 advisory.com18
Setting Safe Targets Requires Striking a Balance
Weighing the Benefits and Costs of Adding Additional NursesDeveloping staffing targets in health care’s current financial reality is essential, but it requires a careful balance to enable delivery of quality care at lower costs.
While richer nurse to patient ratios may support high-quality care, each additional nurse added to the roster has an associated cost.
By setting staffing targets that accurately reflect unit realities, managers can predict how much nursing care will be required to meet the needs of patients safely and effectively. The best targets effectively balance quality and cost by accurately matching staffing to demand.
Source: Sochalski J, “Is More Better: The Relationship Between Nurse Staffing and Quality Care in Hospitals,” Med Care, 42, no. 2 (2004): ii67- ii73; “Nurses in the United States Earn 8 Times More than in Russia,” Pay Wizard, http://www.paywizard.org/main/salary/global-wage-comparison; “Overview of Key Nursing Contract Provisions,” Canadian Federation of Nurses Union, 31 October 2015; "What Do Nurses Earn?" Health Times, http://healthtimes.com.au/hub/nursing-careers/6/guidance/nc1/what-do-nurses-earn/605/; Advisory Board interviews and analysis.
1) Quality of nursing care measured by the item “In general, how would you describe the quality of nursing care delivered to patients on your unit on your last shift?” with a 4-category response (poor, fair, good, excellent). Mean quality scores were derived from summing the responses of nurses with similar patient ratios and dividing by number of nurses with that patient ratio. Mean quality scores ranged form a low of 2.7 for 1:10 to a high of 3.9 for a 1:1 ratio.
2) Salaries listed in US dollars and adjusted by purchasing power parity. 3) In US dollars.
Mean Quality Scores1 Based on RN-to-Patient Ratios
2.7 2.8
2.9 3.0
3.1 3.2
1:10 1:9 1:8 1:7 1:6 1:5
Average RN Hourly Salaries in Select European Countries2
$22.08NETHERLANDS
$19.17GERMANY
$13.64FINLAND
$16.79BELGIUM
Increased Quality with Lower Ratios Increased Cost with More RNs
If money was no object, I could pick all RNs to provide care because their scope is all-encompassing…but unfortunately none of us live in an environment where we have an endless supply of resources. You do have to make some choices.”
Chief Nursing and Health Professions Officer, Canadian public hospital
RN-to-Patient Ratios $27.76BRITISH COLUMBIA
$24.60QUEBEC
$28.42ONTARIO
$30.40SASKATCHEWAN
Average RN Hourly Salaries in Select Canadian Provinces3
Average RN Hourly Salaries in Select Australian States3
$22.78VICTORIA
$26.01NEW SOUTH WALES
$26.13QUEENSLAND
$26.92WESTERN AUSTRALIA

©2016 Advisory Board • All Rights Reserved • 34059 advisory.com19
No Gold Standard for Targets
Variation in Target RN-to-Patient Ratios Signals Lack of Clear DirectionThere is no global consensus on optimal staffing targets. International research examining medical and surgical units shows wide variability in average staffing levels.
In an effort to create consistency across health care systems, some regions have legislated nurse-to-patient ratios. Ratios are helpful guidelines, but they are not sufficient for developing the most accurate workforce projections.
There is no one-size-fits-all solution for staffing projections. Targets must be specific to each organisation and represent the patient demand of the units.
Source: Aiken L, et al., “Nurse Staffing and Education and Hospital Mortality in Nine European Countries: A Retrospective Observational Study,” The Lancet, 383, (2014) http://www.ncbi.nlm.nih.gov/pmc/articles/PMC4035380/; Douglas K, “What Every Nurse Executive Should Know About Staffing And Scheduling Technology Initiatives,” Nursing Economics, 29, no. 5 (2011): 273-275; Advisory Board interviews and analysis.
1) According to surveys conducted in nine European countries as a part of the RN4CAST international study.
10.8
7.6 6.9 7.0 5.2
7.8
Belgium Finland Ireland Netherlands Norway Switzerland
Mean Number of Patients per Nurse in Med/Surg Units in Select European Countries1
Based on Opinion, Not Evidence“Staffing in hospitals has a history of being based in opinion and tradition, not evidence.”
Douglas K, What Every Nurse Executive Should Know About Staffing and Scheduling Technology Initiatives
1 to 5 Mandated daytime nurse to patient ratio in medical/surgical units in California, United States
:1 to 4 Mandated daytime nurse to patient ratio in medical/surgical units in Victoria and Queensland, Australia
:
Examples of Legislated Nurse-to-Patient Ratios

©2016 Advisory Board • All Rights Reserved • 34059 advisory.com20
Using Inaccurate Workforce Projections
The Global Centre identified two key challenges that result in managers using inaccurate workforce projections.
The first is using imprecise estimations of patient demand. Many organisationsuse vague metrics to predict their patient census.
The second is using blunt staffing metrics. These limit managers’ ability to proactively make adjustments to match staffing to demand.
The first step in creating more precise staffing targets is to accurately project unit-level patient demand. Then, leaders must set staffing goals based on unit-level needs.
This section presents guidelines to help nursing leaders act on these two opportunities.
Source: Advisory Board interviews and analysis.
Accurately Project Patient Demand
Opportunity
Challenges Imprecise Census EstimationsPatient demand forecasts do not adequately account for predictable fluctuations; foundational metrics for measuring demand fall short
Set Goals Based onUnit-Level Needs
Blunt Metrics and Staffing TargetsBroad staffing metrics prevent granular management of staffing goals; limit ability to precisely match staff to patient demand
Two Key Opportunities to Establish Safe, Cost-Effective Staffing Targets

©2016 Advisory Board • All Rights Reserved • 34059 advisory.com21
Blunt Averages Hide Census Peaks and Valleys
Common Metric for Budgeting and Staffing Misses the MarkTo determine how many staff they need, many organisations rely on an annual average daily census (ADC). But this blunt measure does not capture fluctuations in patient demand.
The graphic on the right represents a unit budget that remains static from month to month. The unit almost certainly will not see exactly 20 patients every day, but the budgeted daily or monthly workforce does not reflect census variation. As a result, units will have too many or too few staff as the census fluctuates.
Source: Advisory Board interviews and analysis.
Annual Average Daily Census (ADC)
2016 Nursing Salary BudgetMedical/Surgical Unit
Manager: Alice O’Reilly
Aug Sep Oct Nov Dec
ADC 20 20 20 20 20
Annual number of patients cared for in hospital
Number of days hospital was open
ADC =
Example Nurse Budget Using ADC

©2016 Advisory Board • All Rights Reserved • 34059 advisory.com22
Harnessing the Predictable Elements of Patient DemandOpportunity: Accurately Project Patient Demand
Despite variance in patient demand, leaders can identify predictable trends to create more accurate targets. These trends fall into three categories. The first is seasonal fluctuation—times of the year with heavier or lighter patient volumes. Second, there are variations associated with the day of the week. Finally, there are variations by time of day, with peaks and valleys occurring depending on the types of patients seen on the units.
By accounting for predictable variation, nurse leaders can more precisely understand the “demand” side of the supply/demand equation. As shown here, historical, trended data more accurately informs managers’ predicted patient volumes. The adjusted ADC more accurately reflects actual volumes on the unit.
Source: Advisory Board interviews and analysis.
Seasonal Fluctuations
Integrates historical trends of natural peaks and valleys
Day of Week
Incorporates predictable trends in patient volume on a weekly basis
Time of Day
Includes assessment of normal fluctuations throughout the day
Three Kinds of Predictable Variation in Patient Demand
Exemplar Portion of Nursing Unit Budget Using Adjusted Average Daily Census
2016 Nursing Salary BudgetMedical/Surgical Unit
Manager: Alice O’Reilly
Aug Sep Oct Nov Dec
Total Volume 180 200 210 195 250
Adjusted ADC 17 20 20 20 28
WintertimeFlu Season
SummertimeLow Volumes
Seasonal Fluctuations to Consider Day of Week Fluctuations to ConsiderSurgeries typically scheduled on Mondays
Higher number of dischargeson Thursdays
2016 Nursing Salary BudgetMedical/Surgical Unit
Manager: Alice O’Reilly
Mon Tue Wed Thu Fri
Total Volume 32 28 26 22 25
Adjusted ADC 30 28 24 20 20
Sample Monthly Budgetary Projections Sample Day of Week Budgetary Projections
©2016 Advisory Board • All Rights Reserved • 34059 advisory.com23
Completing the Equation to Develop Accurate Targets
Determining Staffing Number and Skill Level Necessary to Meet Demand
Opportunity: Set Goals Based on Unit-Level Needs
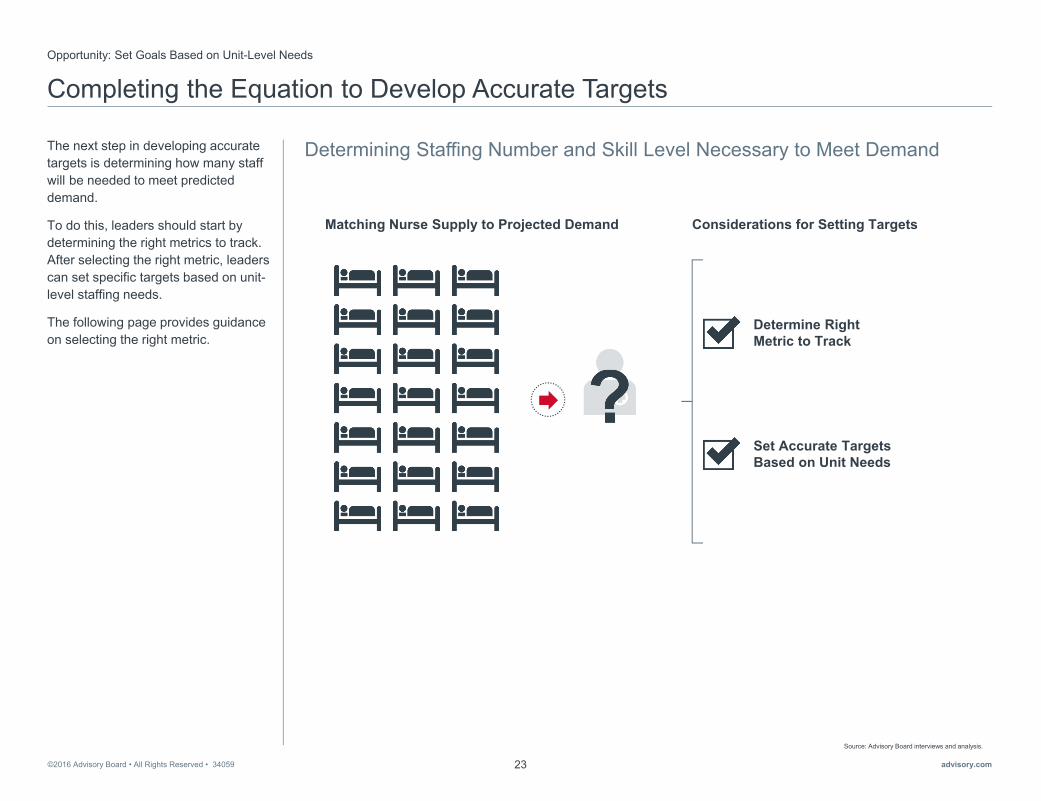
The next step in developing accurate targets is determining how many staff will be needed to meet predicted demand.
To do this, leaders should start by determining the right metrics to track. After selecting the right metric, leaders can set specific targets based on unit-level staffing needs.
The following page provides guidance on selecting the right metric.
Source: Advisory Board interviews and analysis.
Matching Nurse Supply to Projected Demand Considerations for Setting Targets
Determine Right Metric to Track
Set Accurate Targets Based on Unit Needs

©2016 Advisory Board • All Rights Reserved • 34059 advisory.com24
Manage to Smallest Unit of Measurement
There are a variety of metrics available for projecting staffing needs. As shown here, common nurse staffing metrics include nurse-to-bed ratios and nurse-to-patient ratios. The Global Centre recommends using the most precise staffing metric available. For most organisations, that metric is hours per patient day (HPPD), defined as the total number of direct care hours worked in a day divided by the total number of patients seen that day. HPPD provides the most granular level of data that can assist leaders in determining where to find costs savings.
Source: Advisory Board interviews and analysis.1) Hours per patient day.2) Inclusive of all caregivers, but able to cut by provider type (RN, HCA, etc.).
Common Nurse Staffing Metrics
HPPD1
Nurse-to-Patient Ratio
Hours per Patient Day Formula
HPPD =TOTAL DIRECT CARE HOURS WORKED2
TOTAL PATIENTS PER DAY
Nurse-to-Bed Ratio
More precise metric for measuringstaffing requirements based on demand
Enables leaders to easily assign a costto hours and monitor productivity
Easy to benchmark against like unitsand sites of care
Advantages of Using HPPD Metric
Incr
easi
ngly
Pre
cise

©2016 Advisory Board • All Rights Reserved • 34059 advisory.com25
Examine Limitations of HPPD
Although HPPD is the most precise staffing unit of measurement available to most organisations, it has limitations. In order to develop safe, cost-effective targets, leaders must understand these limitations.
Traditional HPPD measures treat all nursing hours equally. Yet, the care provided by an RN is not the same as the care provided by a health care assistant—and neither is the cost.
To address this, the Global Centre recommends examining the types of care providers, their experience, and their skills when using HPPD as a staffing target.
For example, some organisations track RN HPPD separately from HPPD of other nursing staff. The following pages provide further detail about why this additional consideration is important.
Source: Advisory Board interviews and analysis.1) Health care assistant.
RN RN
RN RN
RN RN
HCA1
HCA
Other
Exemplar Limitation of HPPD
Treats All Labour Hours Equally
Representative Differences in Caregiver Preparation
Education RN DiplomaRPN/AN/EN HCA
Experience 2 Years 10 Years 25 Years
Certification PaediatricNursing None None

©2016 Advisory Board • All Rights Reserved • 34059 advisory.com26
Understanding the Cost of Each Hour
By understanding the cost of each hour of care delivered, leaders can more accurately predict staffing targets to provide the most appropriate care at the lowest cost.
An example of two units with similar patient demographics is shown here. Both units deliver 7.8 hours of care per patient day, but one unit is delivering that care at a lower cost.
Source: Advisory Board interviews and analysis.
Total Labour Cost per Patient Day
40-Bed Unit A 40-Bed Unit B
Representative Discrepancies Between HPPDand Total Labour Cost per Patient Day
7.8 7.8
HPPD
€195
€214
LABOURCOST PERPATIENT DAY
=TOTAL COST PER HOUR
TOTAL PATIENTS PER DAY
xTOTAL HOURS
Assumptions
• RN pay = €34 per hour
• HCA pay = €13 per hour
• 40-bed unit fully filled
• Total number of staff per 24 hours on unit (13 for Scenario 1; 14 for Scenario 2)
To learn more about calculating labour costs per patient day access the Rising Above the Bottom Line Virtual Tool Suite at advisory.com/gcne/costsavingstoolkit

©2016 Advisory Board • All Rights Reserved • 34059 advisory.com27
Best Targets Combine Labour Costs and HPPD
Using Both HPPD and TLCPPD1 Allows Creativity in Care Team DesignWhen possible, the Global Centre recommends analysing labour cost per patient day in conjunction with setting staffing targets.
For illustrative purposes, two scenarios of a medical/surgical unit with a daily volume of 40 patients are shown here.
In scenario 1, the unit has nine RNs and four health care assistants. Collectively, they are delivering 7.8 hours of care per patient. Delivering that care costs €214 per patient day.
In scenario 2, the unit has changed the skill mix. Analysing historical demand, the manager sees the need for additional health care assistants (HCAs). When an RN retires, the manager hires two HCAs and the unit staff can now offer 8.4 hours of care—at a reduced cost of €210.
Although these savings may seem small, they can add up when multiplied over years and across units.
Source: Advisory Board interviews and analysis.
1) Total labour cost per patient day.2) Both scenarios represent a 40-bed Med/Surg unit.
Expected Shift in Total HPPD
7.8
8.4
€214
€210
Scenario 1 Scenario 2
RNs 9 8
HCAs 4 6
Representative Comparison of HPPD and Labour Cost per Patient Day Under Two Staffing Scenarios2
Unit Staffing Scenarios
In scenario 2, the unit added 2 HCAs when an RN retired
Scenario 1 Scenario 2Scenario 1 Scenario 2
Expected Shift in Labour Cost per Patient Day

©2016 Advisory Board • All Rights Reserved • 34059 advisory.com28
Questions to Consider
Unit-Specific Characteristics Must Be Considered for HPPD TargetsThe Global Centre recognises that more hours do not universally mean better hours and therefore recommends considering unit characteristics when developing HPPD targets.
Several considerations for customisingHPPD to unit characteristics are shown here. By developing targets that reflect unit-specific needs, leaders can more accurately match staffing to patient demand.
Source: Advisory Board interviews and analysis.
Considerations for Customising HPPD to Unique Unit Characteristics
Staff Skill Mix, Characteristics
• What percentage of RNs, HCAs, and other personnel does the unit have?
• What tasks do RNs perform?
• What is the average age and experience level of unit staff?
Ancillary/Support Services
• Which ancillary and support services are centralised to the unit?
• How many non-nursing clinical services do direct caregivers perform?
• How many non-clinical servicesdo direct caregivers perform?
Patient Population
• What is the average acuity of patients on the unit?
• What is the range of diagnoses on the unit?
• What is the intensity of the work required by the patient population?
Accounting and Operations
• Are managerial, clerical support staff included in HPPD?
• What percentage of time do managers and charge nursesspend in direct patient care?
• What percentage of hours are budgeted for non-productive time (e.g., sick time, vacation time)?
Unit Design
• What percentage of single rooms and semiprivate rooms are on the unit?
• What is the total amount of walking involved for a direct caregiver?
• Does the unit have a central nursing station, a station at one end of the unit, or at both ends?
Length of Stay and Activity
• What is the average length of stay on the unit?
• What is the average number of daily admissions/discharges/transfers?
For more resources on this topic, see our full Towards Evidence-Based Staffing Toolkit at advisory.com/gcne

©2016 Advisory Board • All Rights Reserved • 34059 advisory.com29
Combining Metrics for More Accurate Projections
Nursing units can further improve accuracy of staffing targets by examining multiple metrics together, rather than relying on a single metric.
A representative unit-level budget is shown here. The graphic shows adjustments for predictable variation in demand projections, reflected in the adjusted ADC1. These inform variations in unit-level staffing goals, using HPPD as the key metric. As a result, projected FTE requirements match projected patient demand more closely.
Because managers can allocate their FTE allotment more precisely throughout the year, they can avoid unnecessary overages or shortages.
Source: Advisory Board interviews and analysis.
1) Average daily census.2) Based on US calculations.
2016 Nursing Salary BudgetMedical/Surgical Unit
Volumes
Jul Aug Sep Oct Nov Dec Jan Feb Mar Apr May Jun
Total Volume 260 241 377 409 320 369 298 323 303 314 299 319
AdjustedADC1 8.4 8.7 12.2 13.2 11.4 11.9 9.9 10.4 10.1 9.6 10.6 10.6
Direct Care Hours
HPPD 7.8 7.8 7.8 7.8 7.8 7.8 7.8 7.8 7.8 7.8 7.8 7.8
Direct Hours Required
2028 2036 2941 3190 2496 2878 2326 2519 2363 2449 2332 2488
Direct FTEs Required
11.5 11.9 16.6 18.1 15.6 16.3 13.6 14.3 13.8 13.9 13.2 14.6
Direct hours and direct FTEs required varies depending on patient volume
Example Nursing Salary Budget Using HPPD Targets2
Different ADC used for each month based on volume; projections adjusted each month as needed

©2016 Advisory Board • All Rights Reserved • 34059 advisory.com30

©2016 Advisory Board • All Rights Reserved • 34059 advisory.com31
2
►More Precisely Match Staffing to Predicted Demand
Section
• Practice 1: Tiered Scheduling Responsibility
• Practice 2: Skill Mix Tagging
• Practice 3: Flexible Shift Patterns
• Practice 4: Patient Placement Algorithm

©2016 Advisory Board • All Rights Reserved • 34059 advisory.com32
Targets Necessary but Not Sufficient
Majority of Organisations Routinely Missing Specified Staffing TargetsWhile setting targets is an important first step, it is equally important to match targets with the right number of staffed hours. Yet, the majority of leaders report missing staffing targets on a daily basis.
The graphics here show how frequently leaders report missing staffing targets. As shown on the left, managers in the United States report missing daily targets by more than 5% nearly three quarters of the time, and by more than 10% almost half the time. On the right, nearly 80% of leaders in English hospitals report missing their staffing targets, during both day and night shifts.
These small discrepancies on each unit, each day, represent sizeable savings opportunities when tallied up over the entire organisation for a whole year.
Source: Lintern S, “Four Out of Five Hospitals Miss Own Nurse Staffing Targets”, Nursing Times, 21 April 2015, http://www.nursingtimes.net/roles/nurse-managers/four-out-of-five-hospitals-miss-own-nurse-staffing-targets/5084342.fullarticle; Advisory Board interviews and analysis.
Percentage of Days Within Specified Range of Worked HPPD Targetn=10,062
19%
7%
8%
5%
11%
14%
36%
Over Target > 10%
Over Target 5%-10%
Within 1% of Target
Under Target 5%-10%
Under Target > 10%
Over Target 1%-5%
Under Target 1%-5%
Percentage of English Hospitals Missing Safe Staffing Targets
85%For nurses working in the daytime
67%For nurses working at night
Percentage of English Hospitals Missing Day or Night Shift Targets
0%
100%
80%

©2016 Advisory Board • All Rights Reserved • 34059 advisory.com33
Missing Predictable Targets on a Daily Basis
The Global Centre identified two key challenges that result in managers missing predictable targets on a daily basis.
First, unit schedules and rosters are extremely complex. Managers must rely on their knowledge of the team to create unit rosters—often without much input from staff themselves.
Secondly, the rigidity of traditional scheduling methods hinders managers’ ability to anticipate and match typical variations in patient demand.
To address these challenges, leaders must first equip managers to schedule appropriate staff. Then, they must avoid preventable scheduling overlap.
The first two practices in this section help leaders advance on the first opportunity: equip managers to schedule appropriate staff.
The last two practices in this section help leaders improve on the second opportunity: avoid preventable scheduling overlap.
Source: Advisory Board interviews and analysis.
Two Key Opportunities to More Precisely Match Staffing to Predictable Demand
Rigid Scheduling StructuresTraditional shift length and start times misaligned with real-time fluctuations in patient volumes, resulting in costly excess staffing
Inherent Scheduling ComplexitySchedules created with limited staff input and without sufficient accommodation of tenure and skill mix lead to unnecessary spending
Avoid Preventable Scheduling Overlap
Equip Managers to Schedule Appropriate Staff
Opportunity
Challenges

©2016 Advisory Board • All Rights Reserved • 34059 advisory.com34
A Burden for Managers, a Frustration for Staff
Complex Schedules Fail to Account for Staff Preferences
Opportunity: Equip Managers to Schedule Appropriate Staff
Most commonly, unit managers shoulder the responsibility of developing their units’ schedules. Building these schedules is highly complex, accounting for factors such as patient flow, skill mix, leave schedules, and staffing targets. The managers must often rely heavily on their knowledge of the teams to accommodate their units’ needs.
Yet, these schedules often fail to account for staff preferences. The perception of unfair schedules can lead to nurse dissatisfaction and staff disengagement. In turn, lagging engagement can lead to unexpected vacancies. As shown here, scheduling is one of the top reasons for voluntary resignations of frontline nurses.
Source: “The Evidence is Clear: Analytics Key to Controlling Labor Costs,” Healthcare Insights, 2014, http://www.hcillc.com/files/HCI%20Labor%20Prod%20whitepaper_Ri.pdf; Advisory Board interviews and analysis.
Scheduling’s Costly Impact
The Evidence is Clear: Analytics Key to Controlling Labor Costs
“The cost of nurse turnover can have a profound impact on already diminishing hospital margins. Schedulingwas listed among the top five reasons most nursing employees voluntarily resign.”
Position Tour Type FTE Mon Tues Wed
RN (8 hours, 5 days/week) 1.0 7-15h 7-15h 7-15h
HCA (8, 5) 1.0 9-17h 9-17h O
RN (8, 3) 0.6 O O 9-17h
RN (8, 5) 1.0 8-18h 11-19h 11-19h
HCA (8, 3) 0.6 11-19h O 11-19h
Sample Schedule in a Postpartum Unit
Complicating Factors for Scheduling
Budget TargetsSkill Mix
Staff Needs
Patient Flow Absenteeism

©2016 Advisory Board • All Rights Reserved • 34059 advisory.com35
Rigid Scheduling Results in Excessive OvertimePractice 1:Tiered Scheduling Responsibility
At Johns Hopkins Aramco Healthcare (JHA) in Dhahran, Saudi Arabia, leaders recognised that nurses were working dangerous levels of overtime—an average of 40 hours of overtime per nurse per month.
Leaders at JHA revisited their rostering practices and identified pervasive unplanned absences as a key root cause of overtime use. Managers struggled to find cost effective coverage, using overtime to cover the high levels of absenteeism.
Source: Johns Hopkins Aramco Healthcare, Dhahran, Saudi Arabia; Advisory Board interviews and analysis.
April 2012
Su Mo Tu We Th Fr Sa
1 2
3 4 5 6 7 8 9
10 11 12 13 14 15 16
17 18 19 20 21 22 23
24 25 26 27 28 29 30
31
Nurses scheduled based on inflexible, recurring shift patterns
Average 40 hours overtime per nurse per month
Inflexible System Leads to Unsustainable Costs“We had the same shifts no matter what the census was. Staff were placed in groups and on a fixed pattern. Changes to the schedule could only be made in emergencies. You couldn’t even remove overtime you didn’t need.”
Zeina Khouri-Stevens, CNOJohns Hopkins Aramco Healthcare
Expected and unexpected leave covered by overtime
Elements of Previous Staffing System
Case in Brief: Johns Hopkins Aramco Healthcare • 263-bed hospital in Saudi Arabia, a joint venture between Saudi Aramco and Johns Hopkins Medicine
• Organisation realised old rigid scheduling model with its excessive use of overtime needed to change
• Piloted self-scheduling with limitations on two units
• After initial success of pilot, tiered self-scheduling strategy rolled out across organisation
• Organisation experienced savings in terms of significant decrease in overtime spend

©2016 Advisory Board • All Rights Reserved • 34059 advisory.com36
Tiered Approach to Unit Scheduling
Each Level in Scheduling Process Maximises Its ScopeTo address the challenge of excessive overtime, leaders at JHA introduced a tiered self-scheduling process that includes checks and balances.
There are four steps to this tiered approach, shown here. First, staff members enter their shifts into a master schedule using unit-based guidelines. Second, a unit-based committee reviews the schedule with organisational targets in mind. The committee makes adjustments as needed to ensure that the unit has the right complement of staff on each shift. Third, the manager reviews and approves the schedule and sends to the central staffing office. Finally, the central office tracks daily variations and fills any unforeseen gaps.
Source: Johns Hopkins Aramco Healthcare, Dhahran, Saudi Arabia; Advisory Board interviews and analysis.
Scheduling Committee ReviewsUnit-based scheduling committee, composed of two to three senior staff, adjusts schedules to meet organisational targets and leave coverage before sending schedule to manager for approval
Manager ApprovesManager reviews schedule to ensure scheduling committee did not make any errors; sends schedule to central staffing office
Central Office Fills Unforeseen Gaps Central office ensures staff show up to work, helps coordinate filling gaps that occur on day-to-day basis, such as sick leave
Top-
of-L
icen
se T
iers
Bui
ld E
ffici
ency
Staff Self-SchedulesStaff select shifts for the upcoming schedule eight weeks in advance, using guidelines
Schedule Creation at Johns Hopkins Aramco Healthcare

©2016 Advisory Board • All Rights Reserved • 34059 advisory.com37
Setting Parameters for Scheduling Success
To ensure staff members select appropriate shifts, leaders at JHA set clear guidelines for self-scheduling. Any necessary adjustments to the schedules are based on these parameters, which eliminates potential contention of the changes.
Source: Johns Hopkins Aramco Healthcare, Dhahran, Saudi Arabia; Advisory Board interviews and analysis.
Ensure you sign up for one or two weekend shifts
monthly, depending on unit needs
Make sure you assign yourself five to seven
night shifts every month
Double check leave requests with leave allotment for the unit
Confirm everyone has appropriate distribution of nights and weekends
Ensure good mixture of senior and junior nurses per shift
UNIT-SPECIFIC GUIDELINES
STAFF NURSE GUIDELINES
Scheduling Guidelines at Johns Hopkins Aramco Healthcare
Verify your proposed leave time with your
manager before inputting into schedule

©2016 Advisory Board • All Rights Reserved • 34059 advisory.com38
Addressing Common Fears About Self-Scheduling
Leaders at JHA recognised that the implementation of self-scheduling would generate questions and concerns from managers and staff. How JHA’s leaders proactively addressed the organisation-wide apprehensions are shown here.
Leaders adopted a two-pronged approach to create a groundswell of support. They first piloted self-scheduling on progressive units to demonstrate success. Next, leaders shared the pilot’s success with the rest of the organisation. Finally, they implemented the process across JHA.
Nursing leaders also addressed managers’ fears of losing control and added work. They developed a series of trainings and sessions to educate managers on the benefits of this practice. They emphasised how the tiered responsibility alleviates manager burden.
Source: Johns Hopkins Aramco Healthcare, Dhahran, Saudi Arabia; Advisory Board interviews and analysis.
Leaders fear free-for-all will ensue if staff are given power to self-schedule
Staff nurses given specific guidelines to follow; transition period eased staff and managers into self-scheduling
Leaders fear gaps in care will occur when staff avoid signing up for unwanted shifts
Unit level guidelines for staff nurses, combined with higher level review ensure appropriate coverage
Employees fear culture shift required to transition to self-scheduling is unachievable
Pilot on two units demonstrates benefits and ease of implementation for both staff and leaders
Nurse unit managers fear less control of schedule and added work filling gaps that staff leave
Manager training highlights proven benefits of self-scheduling for unit leaders
Organisation’s Response Apprehensions
Sample of Apprehensions and Responses to Self-Scheduling

©2016 Advisory Board • All Rights Reserved • 34059 advisory.com39
Overtime Decreases with Increased Staff Ownership
Through tiered self-scheduling, staff at JHA feel more ownership of the schedules that reflect staff needs and preferences. Staff report feeling more engaged and having improved work-life balance.
Leaders report saving 16 to 24 hours of overtime per full time employee per month. Additionally, this practice has improved retention and saved on costs associated with turnover.
Source: Johns Hopkins Aramco Healthcare, Dhahran, Saudi Arabia; Advisory Board interviews and analysis.
Saving Money with the New System“We can confirm that what we saved is directly a result of moving to flexible and self-scheduling, which is 16 to 24 hours per month per FTE.”
Zeina Khouri-Stevens, CNOJohns Hopkins Aramco Healthcare
Better Work-Life Balance for Staff“The flexible schedule allows us to adapt our staffing needs for the unit and the individual. We have a greater work-life balance and it has enabled us to get to know all the staff on the unit not just your scheduled group.”
Staff nurse, Johns Hopkins Aramco Healthcare
16-24overtime hours saved per FTE per month in the new tiered self-scheduling model

©2016 Advisory Board • All Rights Reserved • 34059 advisory.com40
Unclear Roster Composition Drives High CostsPractice 2: Skill Mix Tagging
Managers inadvertently overspend when scheduling an inappropriate staff mix. Many managers still struggle to find the most cost-effective, safe roster composition for their units
This was apparent to leaders at Ziekenhuisgroep Twente (ZGT) Almelo in the Netherlands. They employ a mix of staff on their units: RNs, health care assistants (HCAs), and hospitality workers. Yet they found that managers did not have a scientific way of determining the right care team composition during each shift.
When nursing leaders closely examined their existing model, they uncovered redundancies in work and confusion about staff responsibilities. Managers were creating flawed schedules with insufficient support for the RNs, using “expensive hands to do inexpensive work.”
Source: Ziekenhuisgroep Twente Almelo, Almelo, Netherlands; Advisory Board interviews and analysis.
Wasted time doing others’ tasks
Redundanciesin work
Confusion about responsibilities
RN
HCA
Hospitality
Unnecessarily highlabour costs
Observed Challenges at Ziekenhuisgroep Twente (ZGT) Almelo
Concern that patients were not getting best care possible
Disconnect Between Nursing Care Team
Observed Challengesin Daily Work
Impact on Patientsand Hospital
Case in Brief: Ziekenhuisgroep Twente (ZGT) Almelo
• Part of the two-hospital Ziekenhuisgroep Twente health system, with a total of 754 beds and 3,200+ employees; ZGT Almelo is located in Almelo, Netherlands
• Leaders at ZGT Almelo redesigned their nursing care team of RNs, HCAs, and hospitality staff to ensure everyone was doing the right work to care for patients
• Goal was to have highly qualified nurses coordinating the care of their patients rather than spending time on tasks that other care team members could safely accomplish
• Using Patricia Benner’s Novice to Expert Framework as inspiration, leaders assessed differentiated roles based on levels of expertise, tagging each person within e-rostering system based on their score

©2016 Advisory Board • All Rights Reserved • 34059 advisory.com41
Achieving Clear Role Delineation
Tagging System Ensures the Right People Do the Right WorkFollowing a workplace assessment to understand the current workforce and workload, leaders designed a system to optimise each individual’s contribution to the care team. They developed clear “levels” for staff, with specific criteria and transparent expectations for each level. Examples of specific responsibilities for each level are illustrated here.
Source: Ziekenhuisgroep Twente Almelo, Almelo, Netherlands; Advisory Board interviews and analysis.
RN HCA HospitalityLevel 4:
Level 5:
Level 2 or 31: Level 1:
Examples of Responsibilities Based on Expertise Level
Cleaning rooms and other facilities
Cleaningwounds
Curing/repairingwounds
Washing and dressing patients
Restocking supplies
Transferring patients from one room to another
Updating documentation
Toileting patients
Managingcomplex patients
Managing less complex patients
1) In the Netherlands, Level 3 Health Care Assistants typically work in home care rather than hospitals.

©2016 Advisory Board • All Rights Reserved • 34059 advisory.com42
Tagging Ensures Accurate Deployment of Staff
Expertise Level, Unit Needs Are Used to Create SchedulesTeam members receive a “tag” with their level, based on their discipline and expertise. These tags are part of the electronic rostering system. When managers create the unit schedules, they can easily match the unit’s targets with the appropriate “tagged” staff. Additionally, if staff members need to alter shift assignments for personal reasons, they can trade with someone at the same level.
By tagging staff, managers create schedules that more accurately deploy staff to meet patient demand.
Source: Ziekenhuisgroep Twente Almelo, Almelo, Netherlands; Advisory Board interviews and analysis.
Expertise Level Assigned to StaffUnit managers assign each RN, HCA, hospitality staff an expertise level (1-5) during annual performance evaluations
Staff “Tagged” inE-rostering SystemEach individual is tagged within the e-rostering system; information visible to all unit staff
Schedules Created Based on Unit NeedsUnit managers use tags to create schedules, taking unit needs and “scores” into account to ensure accurate skill mix for each shift
Tagging System Used to Fill Gaps as NeededStaff utilise tagging system to find replacement with same expertise level to cover shift as needed
Process for Utilising Tagging System at ZGT Almelo

©2016 Advisory Board • All Rights Reserved • 34059 advisory.com43
Positive Impact of Deploying the Right Staff
Leaders at ZGT Almelo report positive outcomes as a result of skill mix tagging. In the two pilot wards, leaders observed a 15% to 20% reduction in labour costs—while maintaining or improving quality metrics, shown here.
Source: Ziekenhuisgroep Twente Almelo, Almelo, Netherlands; Advisory Board interviews and analysis.
Right People Doing Right Work
“The cost savings were achieved through redesigning around patient care needs and letting people do what they are qualified for, not having overqualified people doing simple tasks.”
Olga Boutens, Clinical Programme Director, ZGT Almelo
Improving Staff Satisfaction
“Giving people the responsibilities they deserve makes them feel more satisfied.”
Agnes Maas,Clinical Programme Director, ZGT Almelo
Key Organisation-Wide Results Since 2013
15%-20%Reduction in labourcosts across pilot units
3%Decrease in sick leave among care team
Key quality metrics remained stable throughout pilot

©2016 Advisory Board • All Rights Reserved • 34059 advisory.com44
Traditional Scheduling Practices Limit PrecisionOpportunity: Avoid Preventable Scheduling Overlap
The second opportunity in this section is avoiding preventable scheduling overlap. As shown here, well-established staffing patterns in hospitals offer little room for adjustment. Shifts are often either eight or 12 hours in length, with uniform starting times.
Source: Advisory Board interviews and analysis.
Key Limitations of Traditional Scheduling Methods
Shift Length Shift Timing Nurse-to-Patient Adjustments
Day
700-1500
700 1500 2300 700
Evening
1500-2300
Night
2300-700
8-hours
700 1500 2300 700
8-hours 8-hours
12-hours 12-hours
1:5 ratio
1:5 ratio
Traditional shift lengths leave little room to make adjustments for shorter periods of time when more staff is needed
Traditional shift start and end times do not always align with actual times of patient fluctuation
Traditional approach to adjusting number of nurses to patient census results in wasted nursing hours

©2016 Advisory Board • All Rights Reserved • 34059 advisory.com45
Scheduling Rigidity Creates Waste Practice 3: Flexible Shift Patterns
Legacy staffing practices can yield incremental waste.
Leaders at Pearson Health1 in the United States found that managers staffed the entire day shift with the number of nurses needed to cover peak census, even though the census fluctuated during predictable times.
The graph here shows the difference between a unit’s actual and ideal staffing patterns.
Source: Sinreich D, Jabali O; “Staggered Work Shifts: a Way to Downsize and Restructure an Emergency Department Workforce Yet Maintain Current Operational Performance,” Health Care Management Science, 10, no.3 (2007): 293-308; Hegwer LR, “Using Predictive modelling to Trim Nurse Staffing Costs,” Healthcare Cost Containment, Healthcare Financial Management Association, (August 2013), https://www.hfma.org/uploadedFiles/Publications/Newsletters/Healthcare_Cost_Containment/ HCC_August.pdf; Advisory Board interviews and analysis.
1) Pseudonym.2) Calculation of nurses needed based upon a 1:6 goal
ratio during the day and a 1:19 goal ratio at night.
1
2
3
4
5
Actual Nurse Numbers Ideal Nurse Numbers
Ideal Versus Actual Nurse Staffing on Inpatient Unit2
Shaded areas represent time when there are more nurses than needed because of inflexible shifts
Time
Nur
sing
Sta
ff on
Uni
tNumber of staff needed to hit target nurse-to-patient ratio
Daily spike in admissions at 11:00
Overstaffed pre-admission
Case in Brief: Pearson Hospital1
• 300-bed hospital located in the United States
• Devised new hospital-wide staffing strategy with staggered shift start times
• In the ED, implemented shorter shifts and flexible staff in addition to staggered start times after forecasting day-of-week and time-of-day volumes
• Strategy saved $110,409 in the Emergency Department and $1.7 million hospital-wide

©2016 Advisory Board • All Rights Reserved • 34059 advisory.com46
Inpatient Admission Shift Maximises Staff Resources
Starting Shift at Prime Admission Time Eliminates Traditional WasteTo match admission swells and late afternoon discharges, nursing leaders implemented staggered shift start times on their inpatient units.
The graphic here shows an example of this change. Instead of four nurses scheduled per eight-hour shift, one nurse comes for an eight-hour shift midday to cover the typical surge of admissions. The boxes on the top bar illustrate the resulting time savings.
The midday nurse starts at 11 a.m. and finishes at 7 p.m. This nurse cares for patients admitted during this time, eliminating unnecessary handovers. By 7 p.m., the evening nurses have capacity from afternoon discharges, and the midday nurse hands over her patients to them.
Source: Advisory Board interviews and analysis.
600 700 800 900 1000 1100 1200 1300 1400 1500 1600 1700 1800 1900 2000 2100 2200 2300 0000
Day Nurse 1
Day Nurse 2
Day Nurse 3
Revised Schedule at Wilson 7 West Medical Surgical
Midday Nurse 4
Evening Nurse 1
Evening Nurse 2
Evening Nurse 3
Night Nurse 1
Night Nurse 2 Night Nurse 2
Night Nurse 1
Day shift handover Evening shift handoverAdmissions
Previously Filled (Wasted Time)
Mid-day shift handover
Previously Filled (Wasted Time)

©2016 Advisory Board • All Rights Reserved • 34059 advisory.com47
Staggered Start Times, Differing Shift Lengths Match ED Churn
Additional Flexibility Creates Efficiency in Areas of Patient FluctuationIn the Emergency Department, leaders adapted the model, applying both staggered start times and shorter shift lengths to match fluctuating patient demand.
Their analysis found a steady increase in patient census throughout the day—reaching a predictable peak in the evening, shown in the graphic here. They staggered shift start times for several nurses, with increasing overlap throughout the day. Leaders in the Emergency Department also added a short shift, timed to meet the highest peak in patient census.
Source: Advisory Board interviews and analysis.
RN 1
RN 2
RN 3
RN 4
RN 5
RN 6
RN 7
Time of DayE
D P
atie
nts
1100 1700 23000500 0900 1300 1500 1900 2100
Emergency Department Patient Census
Emergency Department Staff Nurses
Period of maximum patient levels matches period of maximum staff levels
For maximum flexibility, the hospital added shorter shifts; this can build additional savings if permitted by industrial agreement
Staggered shifts set to match frequent and ongoing admissions throughout the day
0700
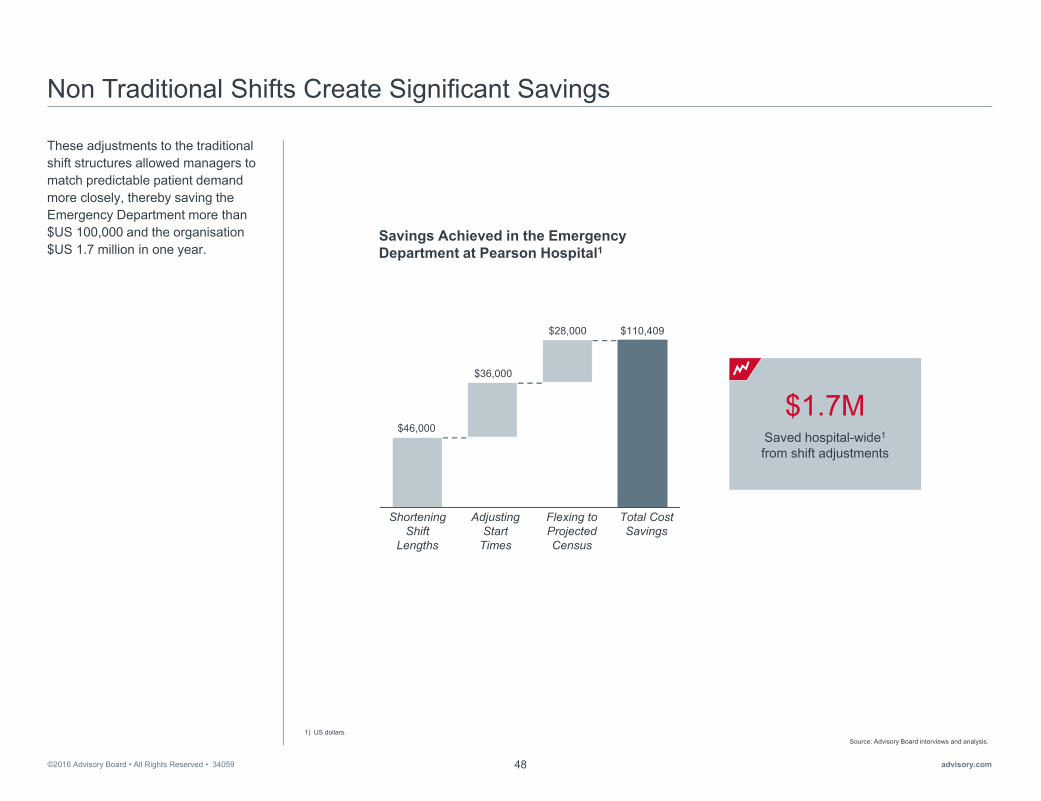
©2016 Advisory Board • All Rights Reserved • 34059 advisory.com48
Non Traditional Shifts Create Significant Savings
These adjustments to the traditional shift structures allowed managers to match predictable patient demand more closely, thereby saving the Emergency Department more than $US 100,000 and the organisation$US 1.7 million in one year.
Source: Advisory Board interviews and analysis.1) US dollars.
Savings Achieved in the Emergency Department at Pearson Hospital1
Saved hospital-wide1
from shift adjustments
$1.7M
Shortening Shift
Lengths
Adjusting Start
Times
Flexing to Projected Census
Total Cost Savings
$46,000
$36,000
$28,000 $110,409

©2016 Advisory Board • All Rights Reserved • 34059 advisory.com49
Creating Structural Flexibility Requires Careful Consideration
The Global Centre recognises that adjusting shift structures to build flexibility requires special considerations.
For staggered start times, nursing leaders must closely analyse trends in patient demand. Surges in admissions and discharges that trend over time will dictate the most appropriate approach.
For shortened shifts, union and government requirements and employee constraints may influence implementation. In addition, certain employees and roles may have more flexibility for shortened shifts.
Source: Advisory Board interviews and analysis.
Definition Considerations
Key Considerations for Staggered Start Times and Shorter Shifts
Shifts are staggered throughout the dayto match available staff to patient demand
Stag
gere
d St
art T
ime
For the Emergency Department, evaluate when admissions rates are particularly high
Consider when admissions occur on inpatient units to match staff and patient flow
Short shifts match periods of extreme fluctuation in patient need
Shor
ter S
hifts
Consider which staff roles have more flexibility for shortening shifts
Think through union and government requirements to evaluate if shorter shifts are appropriate for the environment
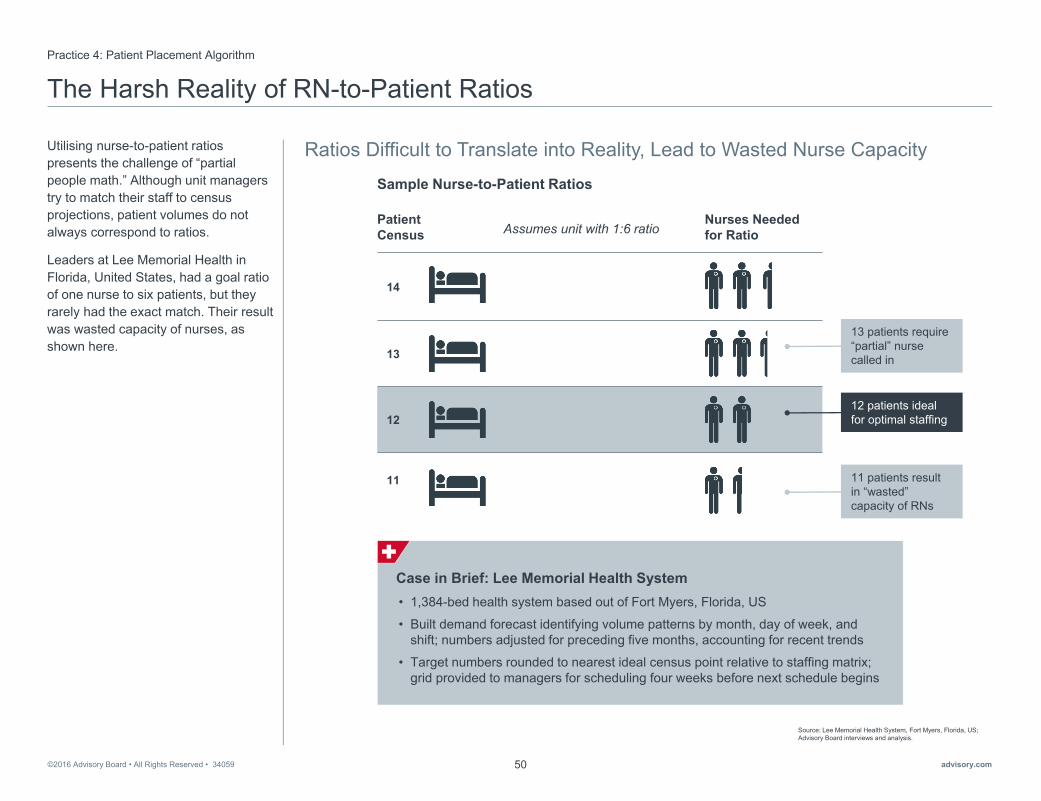
©2016 Advisory Board • All Rights Reserved • 34059 advisory.com50
The Harsh Reality of RN-to-Patient Ratios
Ratios Difficult to Translate into Reality, Lead to Wasted Nurse Capacity
Practice 4: Patient Placement Algorithm
Utilising nurse-to-patient ratios presents the challenge of “partial people math.” Although unit managers try to match their staff to census projections, patient volumes do not always correspond to ratios.
Leaders at Lee Memorial Health in Florida, United States, had a goal ratio of one nurse to six patients, but they rarely had the exact match. Their result was wasted capacity of nurses, as shown here.
Source: Lee Memorial Health System, Fort Myers, Florida, US; Advisory Board interviews and analysis.
14
13
12
11
Sample Nurse-to-Patient Ratios
Patient Census
Nurses Needed for RatioAssumes unit with 1:6 ratio
12 patients ideal for optimal staffing
Case in Brief: Lee Memorial Health System • 1,384-bed health system based out of Fort Myers, Florida, US
• Built demand forecast identifying volume patterns by month, day of week, and shift; numbers adjusted for preceding five months, accounting for recent trends
• Target numbers rounded to nearest ideal census point relative to staffing matrix; grid provided to managers for scheduling four weeks before next schedule begins
13 patients require “partial” nurse called in
11 patients result in “wasted” capacity of RNs
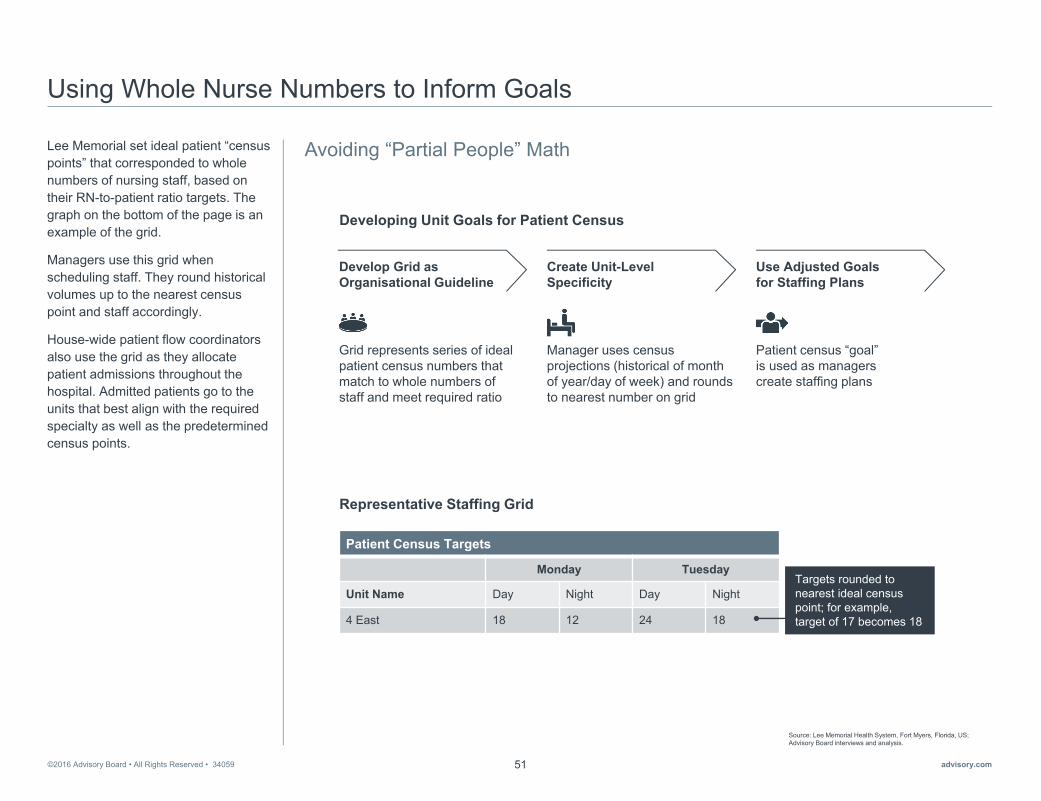
©2016 Advisory Board • All Rights Reserved • 34059 advisory.com51
Using Whole Nurse Numbers to Inform Goals
Avoiding “Partial People” MathLee Memorial set ideal patient “census points” that corresponded to whole numbers of nursing staff, based on their RN-to-patient ratio targets. The graph on the bottom of the page is an example of the grid.
Managers use this grid when scheduling staff. They round historical volumes up to the nearest census point and staff accordingly.
House-wide patient flow coordinators also use the grid as they allocate patient admissions throughout the hospital. Admitted patients go to the units that best align with the required specialty as well as the predetermined census points.
Source: Lee Memorial Health System, Fort Myers, Florida, US; Advisory Board interviews and analysis.
Developing Unit Goals for Patient Census
Grid represents series of ideal patient census numbers that match to whole numbers of staff and meet required ratio
Manager uses census projections (historical of month of year/day of week) and rounds to nearest number on grid
Patient census “goal” is used as managers create staffing plans
Develop Grid as Organisational Guideline
Create Unit-Level Specificity
Use Adjusted Goals for Staffing Plans
Patient Census Targets
Monday Tuesday
Unit Name Day Night Day Night
4 East 18 12 24 18
Targets rounded to nearest ideal census point; for example, target of 17 becomes 18
Representative Staffing Grid

©2016 Advisory Board • All Rights Reserved • 34059 advisory.com52
Rationalising More Precise Ratios
Precisely Matching Patients to Staff Eliminates Wasted Staff Time By using the census point strategy to assign patients, Lee Memorial reduced RN overtime by 33% and achieved $US 11 million. They also eliminated the need for temporary staff hired to cover seasonal surges.
Source: Lee Memorial Health System, Fort Myers, Florida, US; Advisory Board interviews and analysis.
1) In previous years, Lee Memorial contracted premium labour for short periods during high census months in the summer.
2) US dollars.
350
175
0
Year 1 Year 2 Year 3
Annual Seasonal Contracts1
0%
100%
33%Reduction in RN overtime labour
Overall labour savings in the first year2
$11M
Impact of Patient Census Grid on Select Indicators

©2016 Advisory Board • All Rights Reserved • 34059 advisory.com53
3
►Embed Flexibility to Respond to Unexpected Mismatches
Section
• Practice 5: Real-Time Staff Target Tracking
• Practice 6: Cross-Subsidised Float Pool
• Practice 7: “Floater” Support System

©2016 Advisory Board • All Rights Reserved • 34059 advisory.com54
Need to Prepare for the Unexpected
Regardless of how prepared leaders are to address predictable variation, health care is an unpredictable industry. For example, units may need to respond to unplanned absences or unexpected admissions. Managers’ responses to this unpredictable variation greatly influences the bottom line of labour costs.
Source: Advisory Board interviews and analysis.1) Average daily census.
Time
ADC1
Cen
sus
Core Staff Too Few Too Many
Census Fluctuations Across Time
We Never Know What’s Coming Through the Door
“[Predicting demand] is never a true science in places like ICU or ED. You just don’t know what’s going to come through the door, so you do it to the best of your ability.”
Director of nursing, Australian public hospital

©2016 Advisory Board • All Rights Reserved • 34059 advisory.com55
Costly, Risky to Use Premium Labour as Default
For last minute adjustments, unit managers often have no other choice than to use expensive staffing alternatives—such as agency and overtime.
These expensive alternatives put quality at risk, as shown here. Nurses working overtime are up to 67% more likely to have a patient safety event. Additionally, the likelihood for 30-day mortality in a unit with a higher proportion of agency nurses is 26% higher than in a similar unit with no agency use.
Source: Estabrooks CA, et al., “The Impact of Hospital Nursing Characteristics on 30-Day Mortality,” Nursing Research, 54, no. 2 (2005): 74-84; Griffiths P, et al., “Nurses’ Shift Length and Overtime Working in 12 European Countries,” Med Care, 52, no. 11 (2014), http://www.ncbi.nlm.nih.gov/pmc/articles/PMC419 6798/#R16; Advisory Board interviews and analysis.
1) Based on Advisory Board interviews.2) Percentage of total hours effective April 2017 (currently 2%). Penalty specific to hospitals in Ontario.3) Data from a cross sectional study of 31,627 nurses in med/surg units within 488 hospitals across 12 European countries.4) Data from a cross sectional analysis of 18,142 patients discharged from 42 acute care facilities in Alberta, Canada.
Cost Limitations Care Impact
67%More likely to have a failure of patient safety when working overtime3
26%Higher likelihood for 30-day mortality with a higher proportion of [agency] positions4
Increased staff burnout
Decreased staff engagement
No accountability for performance
Limited personal connection to organisation
Wide variability of skills
1.5x Overtime costs 1.5 timesthe rate of standard staff payment on average1
1.5-2.0xAgency costs 1.5-2.0 times the rate of standard staff pay on average1
$0.62/hrAdditional financial penalty if agency hours exceed 1.5% total RN hours2
Age
ncy
Ove
rtim
e
Implications of Overtime and Agency Use

©2016 Advisory Board • All Rights Reserved • 34059 advisory.com56
Using Premium Labour to Meet Unpredictable Demand
The Global Centre identified two key challenges that typically result in the use of premium labour to meet unpredictable demand.
The first is the dearth of real-time staffing data. Many managers lack the ability to assess and address staffing variances in the moment.
The second is that many organisationslack the flexibility needed to fill staffing gaps internally.
There are two key opportunities for overcoming these challenges. First, nursing leaders must provide managers the tools to identify variances in the moment and calibrate daily staffing levels. Second, they must improve in-house alternatives to premium labour.
The practices in this section help leaders act on each of these opportunities in turn.
Source: Advisory Board interviews and analysis.
Limited Daily Staffing Data Managers struggle to recogniseand address incremental variances in the moment without daily access to data
Insufficient Flexible Labour Options Organisations fill gaps with agency and overtime rather than building internal flexible labour options
Calibrate Daily Staffing Levels
Improve In-House Alternatives to Premium Labour
Opportunity
Challenge
Two Key Opportunities to Embed Flexibility to Respond to Unexpected Mismatches

©2016 Advisory Board • All Rights Reserved • 34059 advisory.com57
Operating in the Dark on a Daily BasisOpportunity: Calibrate Daily Staffing Levels
Unit managers need real-time, actionable data, but according to a Global Centre survey of CNOs, only 14% reported tracking staffing data on a daily basis. Most managers only have access to retrospective weekly, biweekly, or monthly staffing reports.
These reports do not always include essential information managers need. They rarely include budgetary data to track when variances occur. This means that managers are unable to make informed, in-the-moment adjustments to meet staffing targets.
Source: Global Centre’s 2016 CNO Survey on Cost Savings and Workforce Optimisation; Advisory Board interviews and analysis.
1) Responses to the question: “Does your organisation carefully track use of supplemental staffing data, including overtime hours, sitter use, and agency staff hours?” Potential responses included: Yes, I can see a daily report; Yes, I can see a weekly report; Yes, I can see a monthly report; Yes, I can see a quarterly report; No. N=14.
14%
Percentage of CNOs Reporting Organisation Tracking Data on Use of Supplemental Staff1 Lacking Access and Support
“[Our data is] retrospective and [we] are not looking at planned activity or what patient groups [we] have, what is changing...We also have a lot of information that is not used enough.
For one head nurse to get access to all the data she has to go into different systems. She has to be quite good in knowing: ‘what data do I need, how can I use it, where can I find it?’ There’s too little support. We need a better technical system, but we also need better support to know how to use the data.”
Nurse executive, Norwegian public hospital
Yes, a Daily Report
No Report
Yes, a Weekly Report
Yes, a Monthly Report
n=14

©2016 Advisory Board • All Rights Reserved • 34059 advisory.com58
Missed Targets Result in Costly Incremental VariancePractice 5: Real-Time Staff Target Tracking
The CNE of Children’s Hospital of Eastern Ontario (CHEO) recognisedthe costs of regularly missing targets. She saw that the unit-based care facilitators at CHEO, who are in charge of the unit budgets, were consistently missing their HPPD targets. An example of this is shown here.
Care facilitators and managers were not held accountable for incremental expenses, since the organisation could not track daily performance and identify where and when variances occurred.
Source: Children's Hospital of Eastern Ontario, Ottawa, Ontario, Canada; Advisory Board interviews and analysis.
1) Costs shown are in Canadian dollars.
Representative Monthly Staffing Challenges at Unit 4 East1
Day 1HPPD target for Unit 4 East is 7.32 hours per patient
Day 5Unexpected uptick in patient census requires manager to call in extra staff; manager misses daily target by 11.97 hours
Day 15Nurses absent, manager calls in overtime; in reality, drop in census accommodates for absence, unit over target by 14.32 hours
Day 20Patient census low; manager does not adjust targets for the day, results in excess of 13.53 hours
Day 25Patient on unit requires more intense nursing care, ratio changes in excess of 10.22 hours
$15,000Total avoidable labourcosts shown by monthly manager report
Cost: $599 Cost: $716
Cost: $677
Case in Brief: Children’s Hospital of Eastern Ontario (CHEO)• 167-bed public children’s hospital in Ottawa, Ontario, Canada
• Chief Nurse Executive worked with Information Technology (IT) Department to develop a daily dashboard in Microsoft Excel
• Dashboard allows managers, care facilitators, and off-hours charge nurses to make real-time adjustments to their schedules and helps the unit avoid going over budget
• Daily bed flow meeting across units allows for reassignment of nurses as needed
Cost: $511

©2016 Advisory Board • All Rights Reserved • 34059 advisory.com59
Automated Tool Enables Real-Time Assessments and Tracking
A task force composed of the CNE and representatives from quality improvement, organisationaldevelopment, and IT determined which data points needed tracking. They developed an Excel tool to facilitate in-the-moment analysis of the various inputs.
The now-automated dashboard, shown here, first calculates targets for the 24-hour day based on census data. Then, at the start of each shift, care facilitators enter their units’ actual numbers. The tool populates to show if the unit met its HPPD targets.
Managers can provide a rationale for missed targets in a section for “contextual factors.” Leaders also use this feature to identify systemic issues that need higher-level attention.
Source: Children's Hospital of Eastern Ontario, Ottawa, Ontario, Canada; Advisory Board interviews and analysis.
Excerpt of CHEO’s HPPD Dashboard
Metrics
17 August
Monday
Expected Census 5
Nursing Hours 112.50
Nursing Hours per Expected Census 22.50
Patient Days 13
Scheduled Nursing Hours 198.75
Nursing Hours per Patient Day 15.29
Budgeted Nursing Hours per Patient Day 14.79
Maximum Census Target 13
Budget to Planning (6.31)
Budget to Actual (0.54)
PLA
NN
EDA
CTU
AL
VAR
IAN
CE
Tool automatically populates planned data
Manager inputs actual data for the day
Tool automatically calculates overages, underages and colour-codes the day
Daily Process for Calculating Real-Time HPPD Performance
1
2
3

©2016 Advisory Board • All Rights Reserved • 34059 advisory.com60
Managers Able to Quickly Address Mismatches
Care facilitators and managers can now intervene immediately when mismatches occur—with data to support their actions.
If the dashboard turns red, the unit is over budget. The care facilitator can ask nurses to take time off, float them to other units, or the unit can admit more patients.
If the dashboard turns green, the unit may be hitting its target exactly. While nothing needs to be done, managers reassess staffing throughout the day. The dashboard will also be green if there are too few staff. Managers must assess whether more support is needed and in which roles.
Care facilitators and managers are expected to ask staff to work overtime only if they have exhausted every other alternative.
Source: Children's Hospital of Eastern Ontario, Ottawa, Ontario, Canada; Advisory Board interviews and analysis.
1) Registered practical nurses.2) Health care assistants.
Enter actual information at start of shift
Current Staffing Algorithm at CHEO
IF IN THE GREENIF IN THE RED
Update tool after rounds; act on any changes
Too many nurses
Too few nurses
Offer nurses leave of absence
Admit more patients on unit
Float staff out of unit
Float external staff
onto unit
Bring in additional staff as needed (RNs, RPN1s, HCA2s)
Ask staff to work overtime or call staff at home
Look for internal
resources
If still missing target, care facilitator or charge nurse can explain mismatch in “contextual factors” section of tool; discuss with manager or director if systemic issue
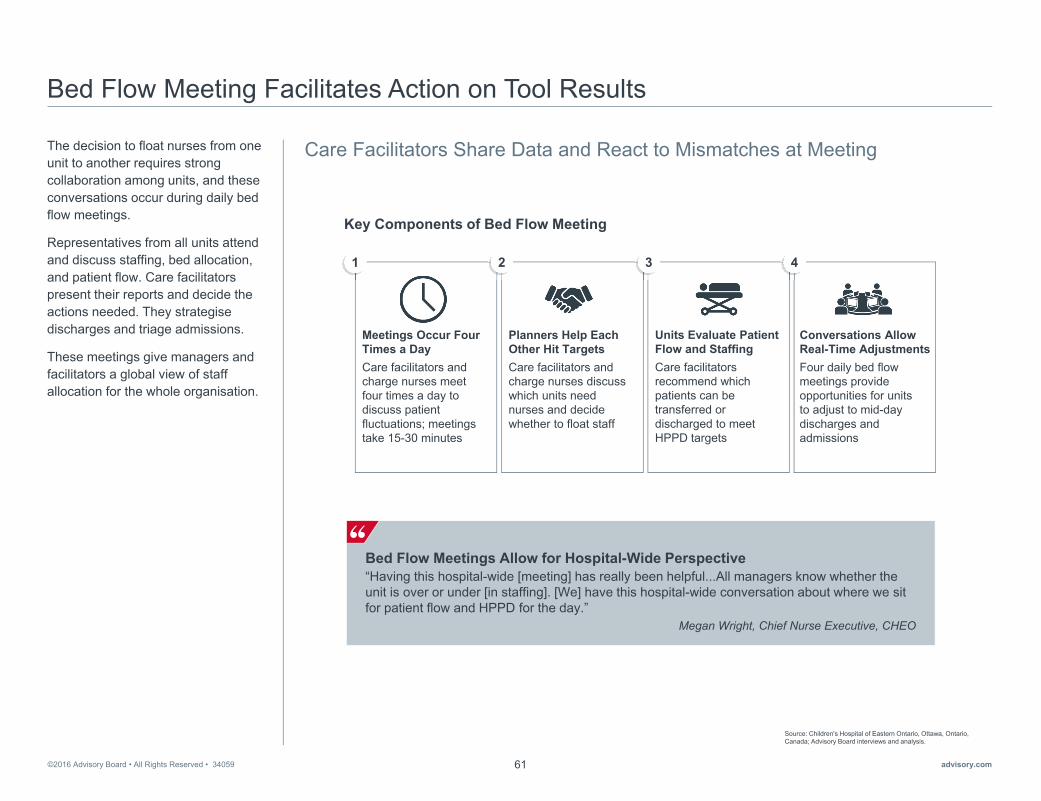
©2016 Advisory Board • All Rights Reserved • 34059 advisory.com61
Bed Flow Meeting Facilitates Action on Tool Results
Care Facilitators Share Data and React to Mismatches at MeetingThe decision to float nurses from one unit to another requires strong collaboration among units, and these conversations occur during daily bed flow meetings.
Representatives from all units attend and discuss staffing, bed allocation, and patient flow. Care facilitators present their reports and decide the actions needed. They strategisedischarges and triage admissions.
These meetings give managers and facilitators a global view of staff allocation for the whole organisation.
Source: Children's Hospital of Eastern Ontario, Ottawa, Ontario, Canada; Advisory Board interviews and analysis.
Meetings Occur Four Times a DayCare facilitators and charge nurses meet four times a day to discuss patient fluctuations; meetings take 15-30 minutes
Planners Help Each Other Hit TargetsCare facilitators and charge nurses discuss which units need nurses and decide whether to float staff
Units Evaluate Patient Flow and StaffingCare facilitators recommend which patients can be transferred or discharged to meet HPPD targets
Conversations Allow Real-Time AdjustmentsFour daily bed flow meetings provide opportunities for units to adjust to mid-day discharges and admissions
1 2 3 4
Key Components of Bed Flow Meeting
Bed Flow Meetings Allow for Hospital-Wide Perspective“Having this hospital-wide [meeting] has really been helpful...All managers know whether the unit is over or under [in staffing]. [We] have this hospital-wide conversation about where we sit for patient flow and HPPD for the day.”
Megan Wright, Chief Nurse Executive, CHEO

©2016 Advisory Board • All Rights Reserved • 34059 advisory.com62
Managing to the Hour Results in Efficiency, Savings
Across the organisation, wasted hours at CHEO have decreased while quality measures remain high. Since the implementation of the tool, the nursing department has avoided $CAN 2.1 million in costs.
Additionally, frontline nurses feel more accountable for financial indicators and understand how their work impacts the budget.
Source: Children's Hospital of Eastern Ontario, Ottawa, Ontario, Canada; Advisory Board interviews and analysis.
1) In Canadian dollars.
Nursing Hours Worked on All UnitsSince August 2014
Gaining Financial Savvy on the Frontline
Pai
d H
PP
D
9.00
10.00
11.00
12.00
13.00
Aug '14 Dec '14 Apr '15 Aug '15 Dec '15 Apr '16 Aug '16
Actual Hours Worked Average Hours Worked
Implementation of HPPD Tool
“[Someone in my staff said that] as a frontline nurse, [she] never knew what the budget was and never questioned what the budget was. Now, [she] thinks it’s something that needs to be at the forefront for frontline staff.” Helen Yoxon, Manager of Palliative Care, CHEO
$2.1MCost avoided since the implementation of the tool in August 20151
Low patient census

©2016 Advisory Board • All Rights Reserved • 34059 advisory.com63
Understanding the Amount of Flexibility Needed
Census Analysis Reveals Opportunities to Avoid Premium Labour
Opportunity: Improve In-House Alternatives to Premium Labour
To build sufficient internal responses to unpredictable variation, leaders must examine the amount of flexibility needed.
In the graph shown here, the solid line is the average daily census (ADC). The shaded area above the line represents one standard deviation above the mean. It encompasses nearly all of the unpredictable variation that a unit experiences that would require a flexible staffing response to meet increased demand. Although managers cannot predict when variation in the census will occur, they can anticipate the amount of fluctuation based on this calculation.
Leaders must also consider two critical factors calculating flexibility needs, shown here. Both target staff ratios and daily volume fluctuations will influence a unit’s flexibility needs.
Source: Advisory Board interviews and analysis.1) Average daily census, adjusted to reflect fluctuations as outlined in section 1 of this book.
Two Critical Factors to Determine Number of Flexible Hours Needed
Target Staff Ratios• Units with greater HPPD or lower RN-to-patient
ratios require more flexibility; even small volume changes require staffing adjustment
• Units with lower HPPD or higher RN-to-patient ratios do not need as much flexibility; only significant volume changes require staffing adjustments
Daily Volume Fluctuations• Units with highly variable volumes
require more flexibility to adjust to unexpected census changes
• Units with more stable daily volumes require less flexibility and can often rely on core staff
Cen
sus
Determining Size of Flexible Workforce Needs
Time
ADC1
One standard deviation above mean

©2016 Advisory Board • All Rights Reserved • 34059 advisory.com64
The Challenges in Building an Internal Answer
To respond to unpredictable census fluctuations and avoid the use of costly premium labour, the Global Centre recommends building or expanding an internal float pool or nursing resource team
Many leaders struggle to grow and sustain their float pools. Nurses and managers often view flexible pools as unstable and unpredictable, with limited professional development opportunities. Float nurses often feel unsupported on their designated units. As a consequence, most nurses do not like to float and retaining float staff is a challenge.
Source: Bates KJ, "Floating as a Reality: Helping Nursing Staff Keep Their Heads Above Water," MEDSURG Nursing, 22, no. 3, (2013): 197-199; Dziuba-Ellis J, “Float Pools and Resource Teams: a Review of the Literature,” Journal of Nursing Care Quality, 21, no.4 (2005): 352-359; Advisory Board interviews and analysis.
0%
100%
73%Of nurses report disliking, resenting, or even “hating” floating
Like a Fish Out of Water“Experienced nurses...express feeling alone, anxious, and even incompetent when floated to other units. This in turn can affect their patients, as the anxiety they feel may be translated through verbal and nonverbal communication.”
Bates K, Floating as a Reality: Helping Nursing Staff Keep Their Heads Above Water
Frequent Obstacles to Building Internal Flexible Staffing Options
• Float pools seen as unstable and unpredictable• Float pool nurses viewed as generalists;
most nurses prefer to specialise• Float pools perceived as having limited
professional development opportunities
Recruitment Difficulties
• Float pool nurses feel alone, disengaged, and unsupported
• Float nurses receive limited orientation to unit; spend excess time finding supplies
• Float nurses frequently assigned most difficult patients
On-the-Job Challenges

©2016 Advisory Board • All Rights Reserved • 34059 advisory.com65
Float Pool Enhances Graduate Nurse Programme
Approach Addresses Graduate Recruitment and Transition to RNs
Practice 6: Cross-Subsidised Float Pool
The first challenge in building a robust flexible staffing team is recruitment.
Structures to support the development and growth of a float pool are essential to strengthen the appeal of float pool participation. For instance, when nursing leaders at Princess Alexandra Hospital (PAH), in Australia, created their first permanent pool in 2008, new graduates were enthusiastic to join the pool.
Leaders developed a programmewithin the pool specifically for new graduates. They trained the nurses using a portion of government incentive monies earmarked for hiring newly graduated nurses. They also used the money to train experienced nurses as Graduate Clinical Facilitators—positions designed to provide 24/7 support for nurses in the float pool.
Agency costs at PAH decreased by almost 110,000 hours, resulting in nearly $AUD 4 million in savings. Engagement and retention of new grads increased, and the flexible workforce response stabilised.
Source: Princess Alexandra Hospital, Woolloongabba, Queensland, Australia; Advisory Board interviews and analysis. 1) In Australian dollars.
Benefits of Involving New Grads in Princess Alexandra’s Float Pool
For New Grads For Experienced Nurses• Opportunity to be employed at a
major health centre
• Exposure to different clinical areas
• Part-time hours assist in assimilating to role and work environment
• Funding received from hiring new graduates used towards graduate clinical facilitators
• Once educated, the facilitators have wider knowledge of hospital and specialist competencies
For Princess Alexandra Hospital
107,120 Hours of reduced agency use
$3,986,178 Savings achieved1
by avoiding agency useIncreased retention of new graduates
Increased frontline staff engagement
Case in Brief: Princess Alexandra Hospital • 1,059-bed, Magnet® accredited hospital located in Woolloongabba, Queensland, Australia • Purpose to utilise government graduate funding to hire new graduates and support upskilling
of graduate nurse facilitators towards specialised training for tenured and permanent staff• Programme designed to increase the number of graduate positions and assist in decreasing
agency shifts used • Provide a broad range graduate programme supporting the consolidation of skills before
progressing to specialised areas
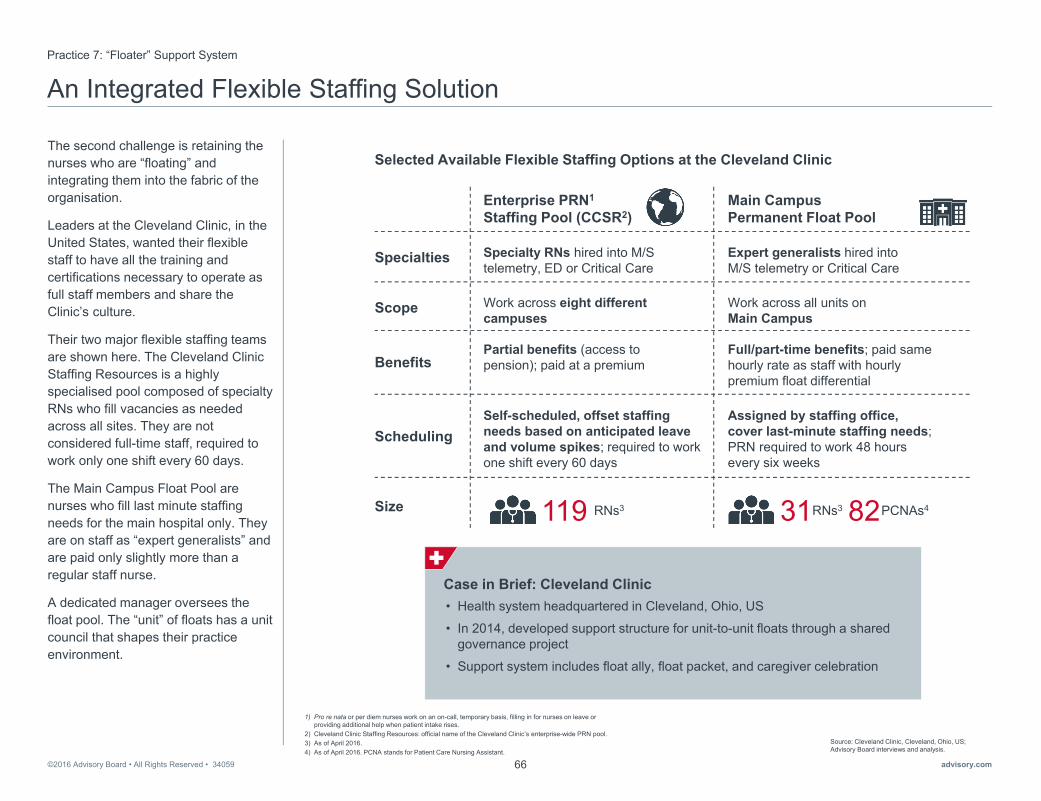
©2016 Advisory Board • All Rights Reserved • 34059 advisory.com66
An Integrated Flexible Staffing Solution Practice 7: “Floater” Support System
The second challenge is retaining the nurses who are “floating” and integrating them into the fabric of the organisation.
Leaders at the Cleveland Clinic, in the United States, wanted their flexible staff to have all the training and certifications necessary to operate as full staff members and share the Clinic’s culture.
Their two major flexible staffing teams are shown here. The Cleveland Clinic Staffing Resources is a highly specialised pool composed of specialty RNs who fill vacancies as needed across all sites. They are not considered full-time staff, required to work only one shift every 60 days.
The Main Campus Float Pool are nurses who fill last minute staffing needs for the main hospital only. They are on staff as “expert generalists” and are paid only slightly more than a regular staff nurse.
A dedicated manager oversees the float pool. The “unit” of floats has a unit council that shapes their practice environment.
Source: Cleveland Clinic, Cleveland, Ohio, US; Advisory Board interviews and analysis.
1) Pro re nata or per diem nurses work on an on-call, temporary basis, filling in for nurses on leave or providing additional help when patient intake rises.
2) Cleveland Clinic Staffing Resources: official name of the Cleveland Clinic’s enterprise-wide PRN pool. 3) As of April 2016. 4) As of April 2016. PCNA stands for Patient Care Nursing Assistant.
Enterprise PRN1
Staffing Pool (CCSR2)Main Campus Permanent Float Pool
Work across all units on Main Campus
Work across eight different campuses
31 PCNAs482119 RNs3
Scope
Specialties
Benefits
Scheduling
Specialty RNs hired into M/S telemetry, ED or Critical Care
Expert generalists hired into M/S telemetry or Critical Care
Partial benefits (access to pension); paid at a premium
Full/part-time benefits; paid same hourly rate as staff with hourly premium float differential
Selected Available Flexible Staffing Options at the Cleveland Clinic
Self-scheduled, offset staffing needs based on anticipated leave and volume spikes; required to work one shift every 60 days
Assigned by staffing office, cover last-minute staffing needs; PRN required to work 48 hours every six weeks
RNs3Size
Case in Brief: Cleveland Clinic• Health system headquartered in Cleveland, Ohio, US
• In 2014, developed support structure for unit-to-unit floats through a shared governance project
• Support system includes float ally, float packet, and caregiver celebration
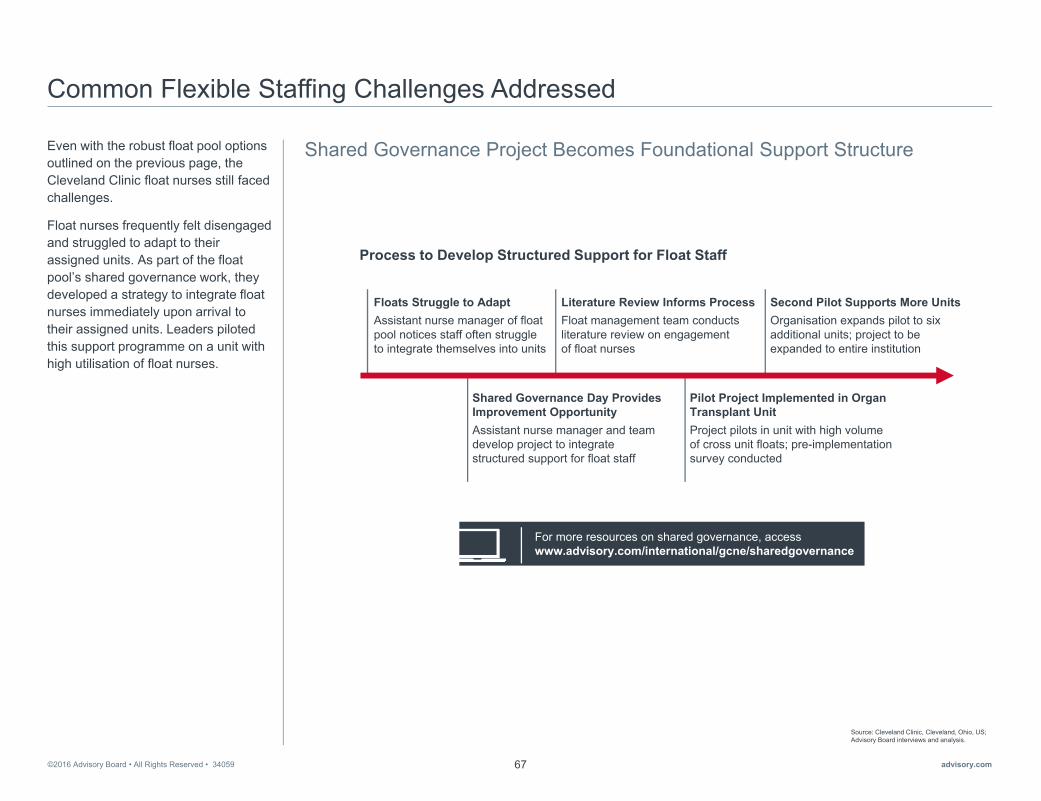
©2016 Advisory Board • All Rights Reserved • 34059 advisory.com67
Common Flexible Staffing Challenges Addressed
Shared Governance Project Becomes Foundational Support StructureEven with the robust float pool options outlined on the previous page, the Cleveland Clinic float nurses still faced challenges.
Float nurses frequently felt disengaged and struggled to adapt to their assigned units. As part of the float pool’s shared governance work, they developed a strategy to integrate float nurses immediately upon arrival to their assigned units. Leaders piloted this support programme on a unit with high utilisation of float nurses.
Source: Cleveland Clinic, Cleveland, Ohio, US; Advisory Board interviews and analysis.
Process to Develop Structured Support for Float Staff
Floats Struggle to AdaptAssistant nurse manager of float pool notices staff often struggleto integrate themselves into units
Shared Governance Day Provides Improvement OpportunityAssistant nurse manager and team develop project to integrate structured support for float staff
Literature Review Informs ProcessFloat management team conducts literature review on engagementof float nurses
Pilot Project Implemented in Organ Transplant UnitProject pilots in unit with high volumeof cross unit floats; pre-implementation survey conducted
For more resources on shared governance, access www.advisory.com/international/gcne/sharedgovernance
Second Pilot Supports More UnitsOrganisation expands pilot to six additional units; project to be expanded to entire institution

©2016 Advisory Board • All Rights Reserved • 34059 advisory.com68
Embedding Unit Support for Floats
Three key elements make up the support model. First, each unit has a Float Ally on a shift—a nurse designated by the unit’s manager. The Ally serves as the point person for the float nurse. The Float Ally greets the float nurse upon arrival, provides a tour of the unit, and stays connected throughout the shift.
The second element is the float packet. At the beginning of the shift, the ally gives the float nurse a packet with all the information needed to function on the unit.
The third element is a float nurse celebration. At the end of the shift, the float nurse receives a note of appreciation from the unit manager or Float Ally. The float pool manager also receives notice of the recognition.
Source: "Nurses Create a Model to Enhance the Float Experience," Cleveland Clinic, https://consultqd.clevelandclinic.org/2015/02/nurses-create-a-model-to-enhance-the-float-experience/; Cleveland Clinic, Cleveland, Ohio, US; Advisory Board interviews and analysis.
Caregiver Celebration
Float Packet
• Floats receive a guide to the unit at the start of their shift
• Guide contains name and number of Float Ally and unit-specific checklist
Float Ally
• Units assign a Float Ally for both RNs and PCNAs on each shift
• Ally serves as the point person for float nurses
• Ally greets floats and stays in touch with them throughout shift
• At the end of shift, float receives a note of appreciation from unit manager or Float Ally
• Note thanks float for helping the unit during a time of need
Available Support Structures for Unit Floats at the Cleveland Clinic
A Model to Impact Engagement and Safety “The model is designed to provide unit-to-unit floats the support they need... Ultimately, not only will it enhance caregiver engagement, but it will benefit patients as well.”
Angie Walden, Assistant Nurse Manager, Nursing Floats, Cleveland Clinic

©2016 Advisory Board • All Rights Reserved • 34059 advisory.com69
Integrated Approach Optimises Engagement and Savings
Leaders at Cleveland Clinic have grown and stabilised their float pools.
As a result of embedding unit support for float staff, average staff satisfaction increased 50%.
The pools have covered thousands of temporary relief hours in one year, shown here. These hours would have otherwise been covered by agency or overtime.
Source: "Nurses Create a Model to Enhance the Float Experience," Cleveland Clinic, https://consultqd.clevelandclinic.org/2015/02/nurses-create-a-model-to-enhance-the-float-experience/; Cleveland Clinic, Cleveland, Ohio, US; Advisory Board interviews and analysis.
1) Cleveland Clinic Staffing Resources: official nameof the Cleveland Clinic’s enterprise-wide PRN pool.
Productive Hours Filled by Flexible Staff in 2015
87,321Hours filled by CCSR1 RNs
172,478Hours filled by Main Campus float pool
Average Percentage of Staff Satisfied with Float Experience on Pilot Units
The Float as an Expert Generalist“Our units are specialised and our floats become expert generalists. When a specialty unit has an identified need they say, ‘where’s the float?’ because of the float’s familiarity and vast experience with a wide variety of patient care settings and needs.”
Angie Walden, Assistant Nurse Manager, Nursing Floats, Cleveland Clinic
35%
85%
Before After

©2016 Advisory Board • All Rights Reserved • 34059 advisory.com70

©2016 Advisory Board • All Rights Reserved • 34059 advisory.com71
4
►Fully Leverage the Skills and Training of Each Care Team Member
Section
• Practice 8: Unit-Level Modelling
• Practice 9: Evidence-Based Sitter Algorithm
• Practice 10: Specialised PCA Roles
• Practice 11: Customised Care Teams

©2016 Advisory Board • All Rights Reserved • 34059 advisory.com72
Quantifying the Financial Impact of Not Working at “Top of License”
The final opportunity for achieving sustainable cost savings is to fully leverage the skills and training of every member of the care team. If leaders do not deploy their nurses at “top of license,” they overspend on care hours unnecessarily.
An analysis of nursing activities on several general medical/surgical units published in the Journal of Nursing Administration quantified this overspending. The researchers divided work into “value-added” work, which required a nurse’s training and skills to accomplish, and “non-value-added” work, which could be effectively accomplished by someone with less training. On average, each unit spent more than $750,000 in nurse wages on “non-value-added” work, which included searching for equipment and locating support staff.
Source: Storfjell J, Omoike O, and Ohlson S, “The Balancing Act: Patient Care Time Versus Cost,” JONA, 38 (2008): 244-249; Storfjell J, et al., “Non-Value-Added Time: The Million Dollar Nursing Opportunity,” JONA, 39 (2009): 38-45; Advisory Board interviews and analysis.
1) Assessing, teaching, providing hands-on care, providing psychosocial support, coordinating care, and documenting care.
2) In US dollars.
Nurses’ Time Not Spent on “Value-Added” Work1
0%
100%
36%
Percentage of nurse time spent doing “non-value added” work
$756,724RN wages2 spent on “non-value-added”
time per med/surg unit
Nurse executive, Australian public hospital
“Nurses should be doing the critical thinking about the clinical condition of the patient. They should be doing the assessment and the treatment plan.”
The Right Type of Work for Nurses
Nurse executive, Australian public hospital
“We need a different mix. But I’m not sure what that is. I want to look at the work first, not the staffing. We have built up what we have over time and have never looked at [whether it is] valuable.”
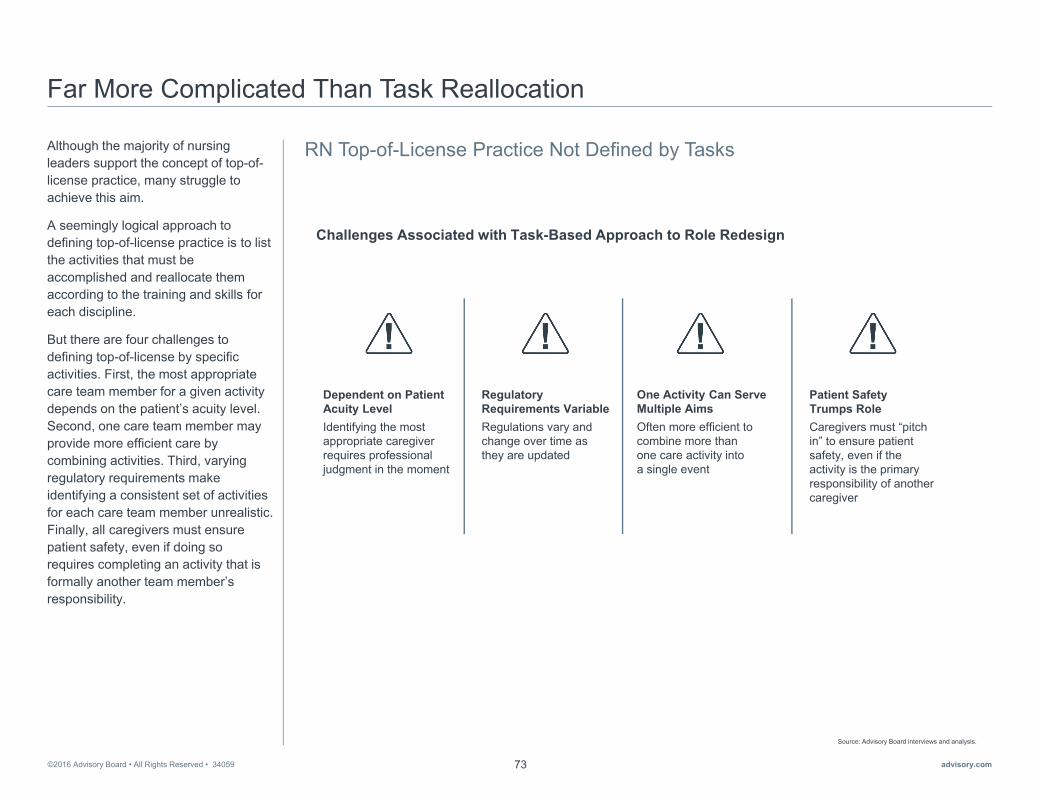
©2016 Advisory Board • All Rights Reserved • 34059 advisory.com73
Far More Complicated Than Task Reallocation
RN Top-of-License Practice Not Defined by TasksAlthough the majority of nursing leaders support the concept of top-of-license practice, many struggle to achieve this aim.
A seemingly logical approach to defining top-of-license practice is to list the activities that must be accomplished and reallocate them according to the training and skills for each discipline.
But there are four challenges to defining top-of-license by specific activities. First, the most appropriate care team member for a given activity depends on the patient’s acuity level. Second, one care team member may provide more efficient care by combining activities. Third, varying regulatory requirements make identifying a consistent set of activities for each care team member unrealistic. Finally, all caregivers must ensure patient safety, even if doing so requires completing an activity that is formally another team member’s responsibility.
Source: Advisory Board interviews and analysis.
Challenges Associated with Task-Based Approach to Role Redesign
Dependent on Patient Acuity Level Identifying the most appropriate caregiver requires professional judgment in the moment
Regulatory Requirements VariableRegulations vary and change over time as they are updated
One Activity Can Serve Multiple AimsOften more efficient to combine more than one care activity into a single event
Patient SafetyTrumps RoleCaregivers must “pitch in” to ensure patient safety, even if the activity is the primary responsibility of another caregiver

©2016 Advisory Board • All Rights Reserved • 34059 advisory.com74
Defining Top-of-License Practice by Patient Needs
Establishing Consensus on Core ResponsibilitiesInstead of assigning specific activities to each care team member, nurse leaders should identify the key functions nurses must fill to meet the needs of increasingly complex patients across settings.
Based on input from a cross-section of nursing leaders in a variety of care settings, the Global Centre for Nursing Executives proposes defining top-of-license nursing practice as the eight core nursing responsibilities shown here.
The Global Centre encourages nurse leaders to use this list as the starting point for clarifying their organisation’sdefinition of top-of-license nursing practice. By establishing consensus on core nursing responsibilities, nurse leaders can transform top-of-license practice from an abstract concept to concrete guidance on how nurses should spend their time.
Source: Advisory Board interviews and analysis.
Assess Clinical and Psychosocial Patient Needs
1
Establish Patient Goals and Track Progress
2
Provide Patient-Centred, Outcomes-Focused Care
3
Educate and Engage Patients and Their Families
4
Manage Key Components of the Clinical Record
5
Coordinate Care with Interprofessional Caregivers
6
Facilitate Safe Patient Transitions
to the Next Care Setting
7
Assess and Incorporate New Technologies and
Evidence-Based Practice
8
Core Nursing Responsibilities Across Settings

©2016 Advisory Board • All Rights Reserved • 34059 advisory.com75
Common Barriers to Implementing Top-of-License Nursing Practice
In addition to defining top-of-license nursing practice, nurse leaders must address three common barriers that prevent nurses from focusing on the core responsibilities, shown here.
The first barrier is that leaders have trouble identifying the optimal skill mix. Organisations often use outdated skill mix proportions that do not match unit realities.
The second barrier is underutilisation of supplementary help.
The final barrier is that staff can easily slip back into old habits, reverting to their previous roles and activities.
To overcome these barriers, leaders must first optimise skill mix based on unit-level needs. Second, they must better utilise support staff to fully leverage RNs. Third, they must continuously reinforce top-of-license nursing practice.
This section contains four practices to help nursing leaders address these challenges.
Source: Advisory Board interviews and analysis.
Opp
ortu
nity
Bar
rier
Three Barriers to Better Leverage the Skills of Each Care Team Member
Slipping Back into Old HabitsPoor structures lead to slippage away from top-of-license team nursing
Reinforce Top-of-License Prioritisation
Optimise Skill Mix Based on Unit-Level Needs
Ideal Skill Mix Unknown
Organisations struggle to determine ideal skill mix proportions
Inefficient Use of Supplementary HelpUnderutilising or overutilisingsupport staff leads to excessive spending
Better Utilise Support Staff to Fully Leverage RNs
Implementing top-of-license practice will also require a considerable shift in culture. To access practices, lessons, and case studies on culture change, visit advisory.com/gcne

©2016 Advisory Board • All Rights Reserved • 34059 advisory.com76
RN-Heavy Skill Mix Inhibiting Top-of-License Practice
Time and Motion Analysis of RN Activities Reveals Inefficiencies
Opportunity: Optimise Skill Mix Based on Unit-Level Needs
Some leaders find their RN-heavy workforce does not have enough support staff to enable nurses to delegate activities that could be accomplished by someone with less training.
As a first step to leverage all members of the care team fully, the Global Centre recommends right-sizing the proportion of RNs in the skill mix.
Nurse leaders at Inova Health System in the United States examined unit work and skill mix. Their RNs were spending 18% of their time on care activities that unlicensed personnel could safely provide, including assessment of vital signs, blood sugar checks, and simple dressing changes. These data were foundational to making improvements.
Source: Swick M and Doulaveris P, “Application of Simulation Technology to Enhance the Role of the Professional Nurse,” JONA 42 (2012): 95-102; Advisory Board interviews and analysis.
1) Other services include: care coordination, shift assessments, walking, rounds/huddles/handoffs, breaks, outliers, admission assessments, information review and planning, discharge, blood draws, IV starts, and wound care.
2) Unlicensed assistive personnel.3) Licensed practical nurse. 4) In US dollars.
18%
18%
64%
Sample Observed Activities Performed by RNs That UAP Can Provide
• Vital signs
• Blood sugar checks
• Simple dressing changes
Other1 Activities UAP1
Can Provide
Medication Administration
Distribution of Observed RN Time by Activity at Inova
Data CollectedObservers collected data on time, service, location, and other notes on care activities
Staff Observed18 RNs and 7 UAPs were observed during 25 individual 4-hour sessions in time and motion study
Time and Motion Study Inputs
Case in Brief: Inova Health System• Five-hospital system based in Falls Church, Virginia, US
• In 2010, began planning to change nursing care model across system
• Leaders used Lean techniques and simulation technology to determine optimum nursing skill mix; team members include RNs, clinical tech 1s, and clinical tech 2s; clinical tech 1s are unlicensed while clinical tech 2s are LPNs3
• In 2011, individual nursing units implemented new nursing care model; proportion of RNs in skill mix decreased from system-wide average of 82% in 2010 to 73% in 2011
• Labour savings of approximately $10 million4 per year across the system with new nursing model

©2016 Advisory Board • All Rights Reserved • 34059 advisory.com77
Using Simulation to Find the Right MixPractice 8: Unit-Level Modelling
The nursing leaders at Inova used the unit observation data in simulation modelling to test the effects of altering skill mix, patient volume, and other inputs on the unit’s outputs, such as nursing labour cost and value-added time.
After testing 129 scenarios, leaders at Inova determined unit-specific skill mixes that yielded the most favourable outcomes.
Source: Inova Health System, Falls Church, Virginia, US; Swick M and Doulaveris P, “Application of Simulation Technology to Enhance the Role of the Professional Nurse,” JONA 42 (2012): 95-102; Swick M, Doulaveris P, and Christensen P, “Model of Care Transformation: A System CNE’s Journey,” Nursing Administration Quarterly 36 (2012): 314-319; Advisory Board interviews and analysis.
1) Whether RNs focused only on RN-specific activities or also focused on nursing activities that do not require an RN license.
2) Proportion of services provided by RNs that require an RN-specific skill set.3) RN time spent performing services that require an RN-specific skill set.4) RN time spent performing unnecessary activities or services that could be performed by others.
Average patient time on unit
Required care for patient
Staffing mix and level
Professional practice technique1
Number of patients presenting to unit
Inova’s Simulation Model
OutputsInputs
Patient time waiting for care
RN professional service proportion2
Nursing labour cost
Value-added time3
Waste time4
Study in Brief: Application of Simulation Technology to Enhance the Role of the Professional Nurse• Computer simulation study of nursing care delivery models with varying staffing levels, skill mixes, and
professional practice techniques
• Goal to test impact of different models on patient wait times, RN service proportion2, percentage of RN time spent on value-added and wasteful care activities, and cost
• 52-bed adult medical unit at Inova Alexandria Hospital used as basis for simulation design; baseline staffing mix of 77% RN and 23% unlicensed assistive personnel (UAP)
• 18 nurses on unit in baseline care delivery model spent 18% of their time on services that could have been provided by UAP and an additional 18% of their time administering medications
• Authors tested 129 two-week simulated nursing care delivery models with varied levels of RNs, LPNs, and UAP; simulations run through Micro Saint software; scenarios based on mean patient census of 45
• Authors report most favourable impact on combination of mean patient wait times, RN service proportion, percentage of RN time spent on value-added activities, and cost when skill mix included RNs, LPNs, and UAP

©2016 Advisory Board • All Rights Reserved • 34059 advisory.com78
Optimising Skill Mix While Improving Care Quality
Informed by the results of their simulation modelling, leaders reduced the system-wide average nursing skill mix from 82% RNs to 70% RNs. Inova’s new skill mix adjustment yielded system-wide improvements in quality and safety—as well as in patient and staff satisfaction.
Source: Swick M and Doulaveris P, “Application of Simulation Technology to Enhance the Role of the Professional Nurse,” JONA 42 (2012): 95-102; Advisory Board interviews and analysis.
1) Unlicensed assistive personnel.
UAP1 82%18% RNs 70%27%
3%
Clinical Tech 1s
Clinical Tech 2s
RNs
2030
62
6
19
37
4 16
36
Pressure Ulcers Falls and Trauma Central Line Infections
2010 2011 2012
Number of Occurrences of Nurse-Sensitive Patient Safety Events Across System
2010 System-Wide Nursing Skill Mix at Inova
2013 System-Wide Nursing Skill Mix at Inova

©2016 Advisory Board • All Rights Reserved • 34059 advisory.com79
Excess Use of One-to-One Observation Raises Cost, but Not QualityOpportunity: Better Utilise Support Staff to Fully Leverage RNs
To ensure top-of-license work for RNs, leaders must effectively leverage support staff.
One support role often misused is the one-to-one observer, frequently referred to as a “sitter” or “special.”
A typical 300-bed hospital spends between $US 1.5 and 2 million on this resource annually. Some patients require one-to-one observation, but sitters are often overused and costly with no significant impact on quality. As shown on the right, one study from the Journal of Nursing Administration (JONA) found no evidence that constant observation reduces the risk of patient harm.
Source: Storfjell J, et al., “The Balancing Act: Patient Care Time Versus Cost,” JONA 38 (2008): 244-249; Advisory Board interviews and analysis.
1) Sitters are also referred to as specials, patient minders or watchers, and constant care aides. 2) Enrolled nurse.s3) Assistants in nursing.
Estimated amount a 300-bed hospital spends
on sitters per year1
$1.5M-$2MIneffective and Expensive“Direct observation remains an ineffective and expensive means of providing for patients’ safety requiring rapid human intervention...currently, there is no research to suggest the use of constant observation reduces the risk of patient harm related to their risk for falling or harming themselves.”
Harding A, Observation Assistants: Sitter
Effectiveness and Industry Measures
Staff Regularly Used as Sitters
RNs or ENs2
AINs3 and Orderlies
Security Guards

©2016 Advisory Board • All Rights Reserved • 34059 advisory.com80
Inappropriate Sitter Use Results in Exponential Expense at CHU Quebec
Acute Increase in Sitter Use, Unit Costs Following Ban of Physical Restraints
Practice 9: Evidence-Based Sitter Algorithm
Leaders at Centre HospitalierUniversitaire (CHU) de Québec, in Canada, saw that their attempts to curtail use of physical restraints had resulted in inappropriate sitter use. In three years, their sitter costs had increased to $CAN 4 million annually across the five-hospital system.
The root causes for overuse are shown here, including poor guidance and no accountability for sitter use.
Source: Centre Hospitalier Universitaire de Québec, Québec City, Québec, Canada; Advisory Board interviews and analysis.1) In Canadian dollars.
2008
Excessive use of physical restraints led to new regulation on restraint use
2009–2010
Increase in sitter use due to doctors, nurses using them as substitute for restraints
2011
Regulation modified to include sitters asa form of restraint; usage remained high
$4M1ANNUAL SITTER COSTS AT CHU QUEBEC
Guidelines did not indicate when sitter use was appropriate
No accountability for sitter use among frontline staff and unit managers
Insufficient number of orderlies for sitter need led to using expensive security guards to fill the role
Nurses requested and doctors prescribed sitters without full evaluation or exhausting other options
Case in Brief: Centre Hospitalier Universitaire (CHU) de Québec• Five-hospital system with total of 1,767 beds located Québec City, Québec, Canada
• Mandate restricting physical restraint use put in place in 2008 after leaders noticed excessive use
• Experienced increase in sitter, as caregivers used sitters in place of physical restraints; resulted in annual sitter costs of over $4 million1
• Sitter Improvement Team created to identify underlying problems leading to overuse of sitters
• Clear protocols and easy-to-use algorithm have taught staff how and when to use alternative surveillance methods; training and additional resources encourage sitters to have meaningful interactions with patients
• Achieved close to $3 million1 in savings after 12 financial periods
Events Leading to Increased Sitter Use
Key Factors Leading to Excessive Sitter Costs

©2016 Advisory Board • All Rights Reserved • 34059 advisory.com81
Task Force Develops Guidelines to Address Common Problems
Leaders at CHU de Québec developed tighter guidelines and evidence-based alternatives to sitters after a task force found no proven benefit to patient safety or quality for most patients with sitters.
They first authorised a set of safe alternatives to sitters, including intermitted surveillance.
Second, leaders developed clear guidelines for appropriate sitter use. They developed manuals, standardised protocols, and surveillance forms for staff and sitters.
Finally, they developed an in-the-moment decision-making tool, designed to help staff assess the need for one-to-one observation.
Source: Centre Hospitalier Universitaire de Québec, Québec City, Québec, Canada; Advisory Board interviews and analysis.
Checklist of alternative measures based on patient needs
Introduction of enhanced, tight surveillance (15-minute and 30-minute check-in)
Standardised routine established for staff and sitters to follow
Instruction manual and enhanced surveillance forms for managers
Safe Alternativesto 1:1 Sitters
Clear Instructions, Protocols for Sitter Use
In-the-Moment Decision-Making Tool
Colour-coded algorithm for frontline staff to use for patient evaluation
Guidelines and Resources Developed by Sitter Improvement Team

©2016 Advisory Board • All Rights Reserved • 34059 advisory.com82
Easy-to-Use Algorithm Guides Staff Through Evaluation of Sitter Need
Unit staff use a decision-making algorithm, illustrated here, to determine if a patient requires constant observation.
If the staff determine that a sitter is required, the request must have unit manager approval as well as documentation of protocol adherence. Additionally, if a sitter is medically prescribed, the order is checked after 24 hours to assess the level of care needed.
Source: Centre Hospitalier Universitaire de Québec, Québec City, Québec, Canada; Advisory Board interviews and analysis.
Representative Evaluation of Patient at Risk of Aggressive, Violent Behaviour
Constant 1:1 Surveillance Needed
Good response to occupational activities (YES or NO)?
If utilise these activitiesto calm patient.
Is family presentor available (YES or NO)?If then ask family to be present, request possible solutions to calm patient.
Is it possible to use specialised equipment (YES or NO)?If then introduce necessary equipment(i.e., bed alarm, hand mitts, soft splint, chest vest).
Positive response to temporary, somewhat restrictive controls put in place for less than 24 hours (YES or NO)?If continue temporary controls with patient consent.
Assigning 1:1 Sitter Requires:• Approval from unit manager• Application of new sitter protocol• Validity check after 24 hours if
medically prescribed
NO
NO
NO
NO
YES YES
YESYES

©2016 Advisory Board • All Rights Reserved • 34059 advisory.com83
Advancing Care Quality by Enhancing Therapeutic Alternatives
Leaders Arm Sitters with Resources to Improve Patient Experience, CareCHU de Québec’s leaders revised their sitter protocols intending to improve care quality and patient experience. In addition to protocols, leaders knew their staff needed training in and access to alternative therapeutic approaches. They invested in three areas.
First, they provided enhanced staff and sitter training on proactive, therapeutic measures to mitigate patient agitation.
Second, staff and sitters have access to the IMCEP1 cart, which contains therapeutic activities that sitters and staff can use to refocus and calm patients.
Third, sitters complete surveillance logs conveying their observations to the nurses.
Source: Centre Hospitalier Universitaire de Québec, Québec City, Québec, Canada; Advisory Board interviews and analysis.
1) l'intervention multisensorielle de confort émotionnel et physique (multisensory intervention for emotional and physical comfort).
IMCEP Sitter Cart
Sitters have access to an IMCEP cart; cart filled with supplies that appeal to five senses, helping calm patients and enabling meaningful interactions between sitters and patients
Sitter Training for Orderlies, Nurses
Orderlies and frontline nurses received training focused on appropriate sitter use and interactions with patients
Sitter Surveillance Log
Sitters required to fill out surveillance log; information provides nurse with important patient details that sitter has observed, therefore improving understanding of patient needs
Sitter Resources, Training, and Documentation at CHU Québec

©2016 Advisory Board • All Rights Reserved • 34059 advisory.com84
Less Use of Sitters, Restraints Improves Quality, Lowers Costs
Sitter Costs, Restraint Use Cut While Decreasing Patient FallsCHU de Québec’s revised approach to sitter use has resulted in widespread improvements. Both sitter and restraint use have decreased. Care quality and safety have increased, shown here.
The work also yielded significant financial savings. CHU de Québec reduced its sitter costs by almost $CAN 3 million across the system in two years.
Moreover, leaders at CHU de Québec have seen a significant cultural shift in ownership and accountability among staff, managers, and doctors.
Source: Centre Hospitalier Universitaire de Québec, Québec City, Québec, Canada; Advisory Board interviews and analysis.
1) Based on CHU Québec internal analysis; Canadian dollars. 2) Based on CHU Québec internal analysis. 3) Soins aux aînés et vieillissement (Care for Ageing and Elderly Patients).
2013 2015
Annual Sitter Costs at CHU de Québec1
$4M
$1.2M
2013 2015
Restraint Use at CHU de Québec2
6.1%
4%
Department-Specific Total Patient Falls2013/14 – 2014/15
SAVIE3
61%Medicine
59%Surgery
76%
Ownership Among Staff“[Staff] are more aware of the sitter use and are asking more questions of their team…Now they quickly identify that there is a problem if they see the numbers rising.”
Nurse Unit Manager, CHU Québec

©2016 Advisory Board • All Rights Reserved • 34059 advisory.com85
Advisory Board Resources on Sitter Use
Many organisations across the world struggle to manage sitter costs. The Global Centre has a suite of practices and resources shown here to support leaders to make improvements in this area.
Source: Advisory Board interviews and analysis.
Sitter Use Unit Accountability
Rewriting sitter policy to hold staff accountable for sitter use; building partnerships with volunteers and families
Observation Cross-Training
Offering cross-training on patient observationto support service employees
Partnering with nursing schoolsto deploy students as sitters
Developing concentrated monitoring area for patients requiring close supervision on geriatric psych unit
Investing in video system on units with high fall rate, combined with dedicated observer who alerts staff of imminent falls
Student Pipeline
Multiple Room Monitors
Video Surveillance
Strategies for Safely Reducing Sitter Usage
For more information on these practices visit advisory.com/gcne
On-Demand Webconferences• Reducing Falls and Sitter Costs
with Targeted Video Surveillance
• Tips to Reduce Patient Falls, from Expert Patricia Quigley

©2016 Advisory Board • All Rights Reserved • 34059 advisory.com86
Creating Two PCA1 Roles to Cover “Reliable” and “Variable” WorkPractice 10: Specialised PCA1 Roles
To fully support RNs, managers must also ensure support staff can complete all activities delegated to them.
Leaders at University of Pittsburgh Medical Center (UPMC), located in the United States, found gaps in basic care were occurring. Patient care assistants (PCAs) were routinely interrupted to address time-sensitive, unpredictable patient needs which interrupted their workflow.
To address this, nursing leaders added two “specialised” PCAs per unit to ensure both predictable and unpredictable patient care activities were consistently completed. One PCA on each unit is dedicated to reliable work—performing routine patient care activities, including turning, rounding, and bathing. The other PCA is dedicated to variable work, focusing exclusively on unpredictable patient needs, such as call lights and lab draws.
Source: University of Pittsburgh Medical Center, Pittsburgh, Pennsylvania, US; Advisory Board interviews and analysis.1) Patient care assistant.
Reliable Work
• Rounding• Taking vital signs• Feeding patients• Turning patients• Bathing patients• Ambulating patients
Variable Work
Answers call light
Packs patient items for discharge
Answers call light
PCA tasked with responding to variable work
Representative Excerpt of “Variable Rounder” PCA Shift
Patient requests and care activities addressed quickly
Bathes Mrs. Smith
Bathes Mr. Jones
Bathes Ms. Scott
PCA tasked with bathing Mrs. Smith,Mr. Jones, Ms. Scott
Representative Excerpt of “Reliable Rounder” PCA Shift
Work completed with minimal interruptions
Case in Brief: University of Pittsburgh Medical Center (UPMC)• 20-hospital, 4,500+ bed system based in Pittsburgh, Pennsylvania, US
• In January 2011, piloted “Reliable and Variable Rounder,” now spreading system-wide
• PCAs formerly responsible for both predictable and unpredictable work, which competed for their attention
• Goal of “Reliable and Variable Rounder” model is to ensure routine care for patients (e.g., rounding, turning, ambulating, feeding, etc.) is delivered reliably and that time-sensitive work is handled quickly
• On pilot unit, increased patient satisfaction scores from the 82nd to 89th percentile for patient satisfaction with response to call light; percentage of patients responding “Always” to “Helped toileting as soon as wanted” increased by nine percentage points
• Call lights• Assisting RNs with
unexpected needs• New admissions• Lab draws• Preparing patients for
testing or discharge

©2016 Advisory Board • All Rights Reserved • 34059 advisory.com87
Improving PCA Reliability and Care Quality at UPMC
After introducing specialised PCA roles on units, the pilot UPMC facility reported an improvement in patients’ satisfaction with response to time-sensitive requests, as shown here. UPMC leaders spread the cost-neutral initiative across the system, distributing the work between existing PCAs.
Source: University of Pittsburgh Medical Center, Pittsburgh, Pennsylvania, US; Advisory Board interviews and analysis.
1) Based on organisation’s results on Press Ganey survey.2) From the Hospital Consumer Assessment of Healthcare Providers and Systems
(HCAHPS) survey.
82nd89th
2010 2011 2010 2011
61%70%
Percentage of Patients Answering “Always” to “Helped Toileting as Soon as Wanted”2
Patient Satisfaction with Response to Call Light by Percentile1
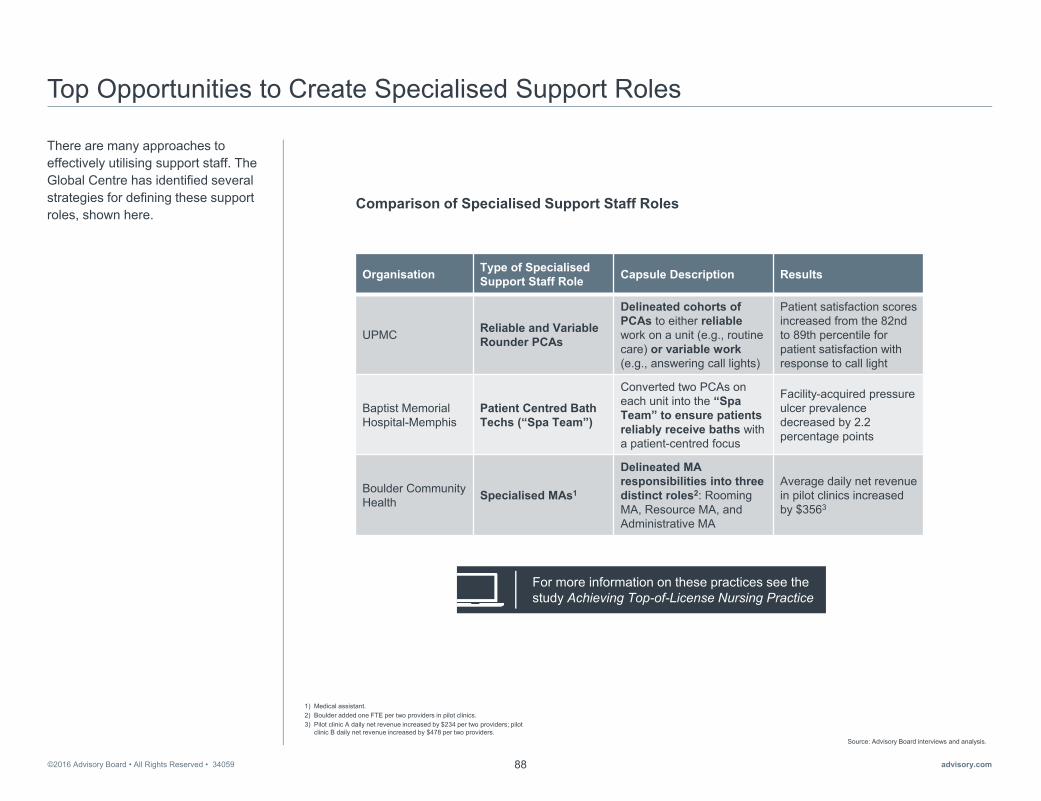
©2016 Advisory Board • All Rights Reserved • 34059 advisory.com88
Top Opportunities to Create Specialised Support Roles
There are many approaches to effectively utilising support staff. The Global Centre has identified several strategies for defining these support roles, shown here.
Source: Advisory Board interviews and analysis.
1) Medical assistant. 2) Boulder added one FTE per two providers in pilot clinics. 3) Pilot clinic A daily net revenue increased by $234 per two providers; pilot
clinic B daily net revenue increased by $478 per two providers.
Organisation Type of SpecialisedSupport Staff Role Capsule Description Results
UPMC Reliable and Variable Rounder PCAs
Delineated cohorts of PCAs to either reliablework on a unit (e.g., routine care) or variable work(e.g., answering call lights)
Patient satisfaction scores increased from the 82nd to 89th percentile for patient satisfaction with response to call light
Baptist Memorial Hospital-Memphis
Patient Centred Bath Techs (“Spa Team”)
Converted two PCAs on each unit into the “SpaTeam” to ensure patients reliably receive baths with a patient-centred focus
Facility-acquired pressure ulcer prevalence decreased by 2.2 percentage points
Boulder Community Health Specialised MAs1
Delineated MA responsibilities into three distinct roles2: Rooming MA, Resource MA, and Administrative MA
Average daily net revenue in pilot clinics increased by $3563
Comparison of Specialised Support Staff Roles
For more information on these practices see the study Achieving Top-of-License Nursing Practice
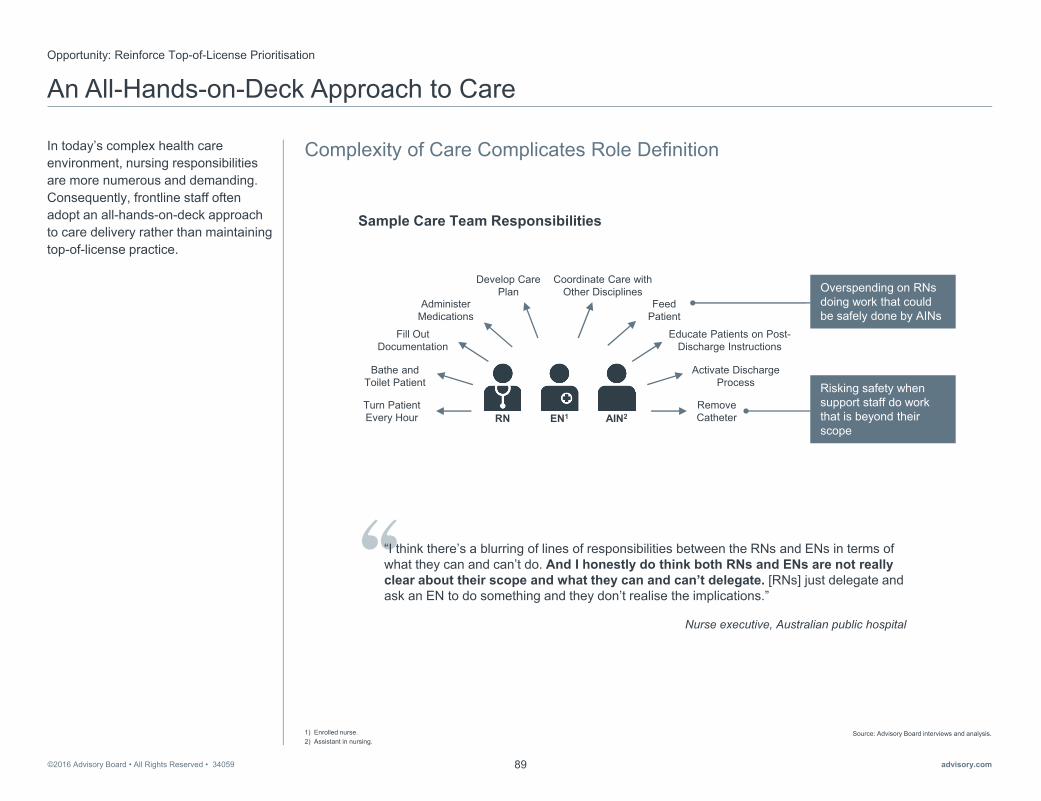
©2016 Advisory Board • All Rights Reserved • 34059 advisory.com89
An All-Hands-on-Deck Approach to Care
Complexity of Care Complicates Role Definition
Opportunity: Reinforce Top-of-License Prioritisation
In today’s complex health care environment, nursing responsibilities are more numerous and demanding. Consequently, frontline staff often adopt an all-hands-on-deck approach to care delivery rather than maintaining top-of-license practice.
Source: Advisory Board interviews and analysis.1) Enrolled nurse.2) Assistant in nursing.
Nurse executive, Australian public hospital
“I think there’s a blurring of lines of responsibilities between the RNs and ENs in terms of what they can and can’t do. And I honestly do think both RNs and ENs are not really clear about their scope and what they can and can’t delegate. [RNs] just delegate and ask an EN to do something and they don’t realise the implications.”
Sample Care Team Responsibilities
Bathe and Toilet Patient
Activate Discharge Process
Turn Patient Every Hour
Develop Care Plan
Educate Patients on Post-Discharge Instructions
Feed Patient
Fill Out Documentation
Remove Catheter
Coordinate Care with Other Disciplines
Administer Medications
RN EN1 AIN2
Risking safety when support staff do work that is beyond their scope
Overspending on RNs doing work that could be safely done by AINs

©2016 Advisory Board • All Rights Reserved • 34059 advisory.com90
A Structured Approach to Care Team Redesign
Leaders and Unit Teams Work Together to Define Revised Model
Practice 11: Customised Care Teams
Nursing leaders at Michael GarronHospital in Toronto, Canada, addressed inefficiencies on their units through a team-based staffing model.
The steps are shown here. First, leaders set clear goals. Next, they delineated each role, providing a template for general guidance for unit managers to use when delineating roles. Third, unit managers customisedthe roles to fit their practice environments. Finally, two pilot units implemented the model before leaders introduced it across the organisation.
Source: Michael Garron Hospital, Toronto, Ontario, Canada; Advisory Board interviews and analysis.
1) Registered practical nurse.2) Unregulated care providers.
Set Goals
• Hospital leaders defined their organisation-wide aims with redesigning the staffing model
• Goal was to create a collaborative, interprofessional team-based model
Define Roles
• Examined RN, RPN1
and UCP2 roles, creating task lists for each care provider based on different patient needs
• Resulting template provided general guidance for unitsto work with
Customise Model
• Leaders worked with unit staff, using patient simulations and template to determine appropriate roles and responsibilities
• Each unit was armed with plan for implementing team-based model based on unit-specific needs
Implement Model
• Starting with two pilot units, staff shifted to new team-based staffing model using unit-specific plan
• General model across all units includes an RN team leader, RPNs providing care, and UCPs providing coordinated support
“The polarity within this transformation is implementing necessary standards of care while honouring the ability for teams to create a care environment that reflects the unique needs ofthe individuals they serve.” Irene Andress, Chief Nursing Executive,
Michael Garron Hospital, Canada
Structured Customisation
Michael Garron’s Process for Changing the Staffing Model
Case in Brief: Michael Garron Hospital• Community teaching hospital located in Toronto, Ontario, Canada
• The challenges and inefficiencies in their traditional care model prompted a transition to a collaborative, interprofessional team-based model
• Patients on each unit are divided between two teams; each team includes an RN team lead, RPNs, and unregulated care providers; the number of each role within teams differs across units based on patient needs
• An intentional co-creation strategy involving staff informed the design, education, implementation and evaluation for sustainability of revised staffing model
• Hospital has achieved quality improvements, cost stability, and increased nurse satisfaction since implementation of this dynamic staffing model

©2016 Advisory Board • All Rights Reserved • 34059 advisory.com91
New Staffing Model Leverages All Skills
In this team-based staffing model, all team members work at the top of their training.
The model is structured, yet flexible. Unit managers can adjust it based on their unit and patient needs.
The composition and roles of the core teams are shown here. An RN is the team leader, overseeing the care provided to patients on that team’s roster, maintaining a global perspective on all the patients. The RN will provide direct care when a patient’s acuity is particularly high. Under normal circumstances, the RPNs provide the majority of direct patient care, with the RN available for consultation. The unlicensed care providers (UCPs) provide basic support work.
Source: Michael Garron Hospital, Toronto, Ontario, Canada; Advisory Board interviews and analysis.
1) Canadian Triage and Acuity Scale. Scale for patients entering the Emergency Department to help define patients needs for more timely and appropriate care.
• Responsible for daily living activities such as toileting, bathing, feeding, and ambulation
UCPs
• Responsible for providing global perspective and coordination of care for all patients under team purview
• Serves as team liaison with interdisciplinary groups
• Acts as consultant for RPNs and UCPs
• Provides direct care for high acuity patients, if needed
RN Team Leader
• Responsible for providing direct patient care for most of team’s patients
• Partner with RN team leader to provide necessary patient education, care planning, and to develop patient discharge plans
• May consult RN if patient acuity exceeds RPN scope of practice
RPNs
Role Responsibilities Within Team-Based Staffing Model
Example Unit Variations to the New Model
Surgery: Additional RN that doesnot play team lead role provides direct care for high acuity patients
Emergency Department: Heavy RN/RPN mix with UCPs matched to patient CTAS1 level to provide support within designated zones
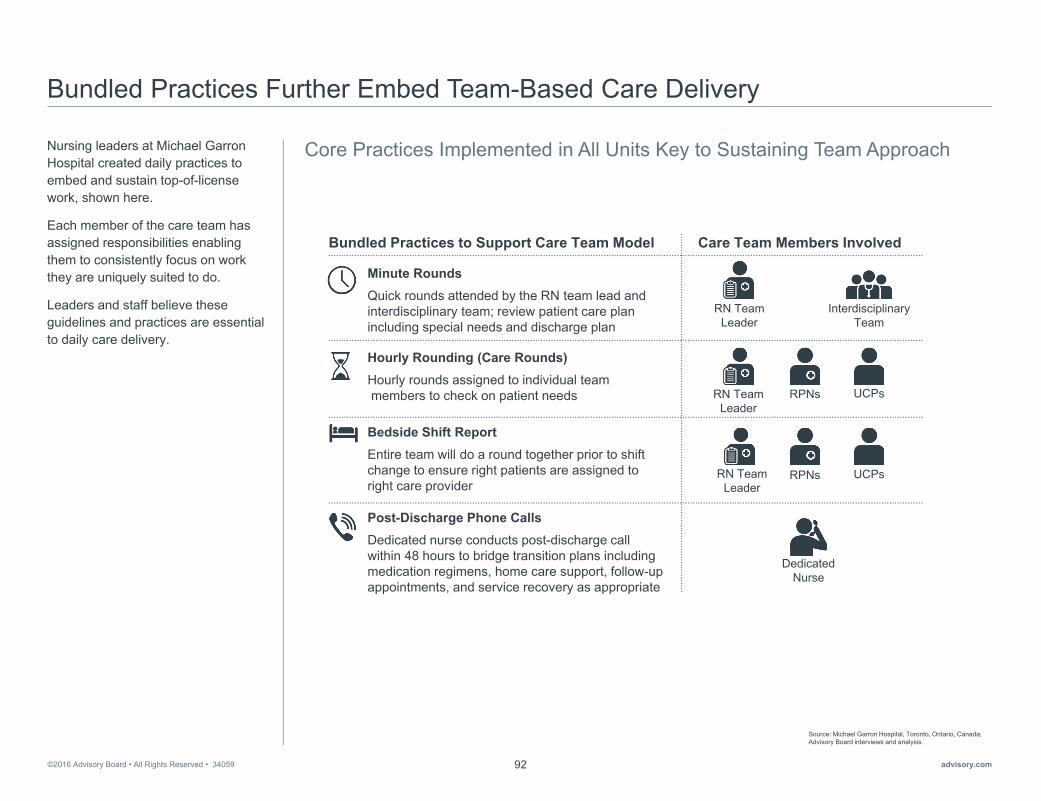
©2016 Advisory Board • All Rights Reserved • 34059 advisory.com92
Bundled Practices Further Embed Team-Based Care Delivery
Core Practices Implemented in All Units Key to Sustaining Team ApproachNursing leaders at Michael GarronHospital created daily practices to embed and sustain top-of-license work, shown here.
Each member of the care team has assigned responsibilities enabling them to consistently focus on work they are uniquely suited to do.
Leaders and staff believe these guidelines and practices are essential to daily care delivery.
Source: Michael Garron Hospital, Toronto, Ontario, Canada; Advisory Board interviews and analysis.
Bundled Practices to Support Care Team Model Care Team Members Involved
RN Team Leader
RN Team Leader
RPNs UCPs
RN Team Leader
RPNs UCPs
DedicatedNurse
Interdisciplinary Team
Minute RoundsQuick rounds attended by the RN team lead and interdisciplinary team; review patient care plan including special needs and discharge plan
Post-Discharge Phone CallsDedicated nurse conducts post-discharge call within 48 hours to bridge transition plans including medication regimens, home care support, follow-up appointments, and service recovery as appropriate
Hourly Rounding (Care Rounds)Hourly rounds assigned to individual teammembers to check on patient needs
Bedside Shift ReportEntire team will do a round together prior to shift change to ensure right patients are assigned toright care provider
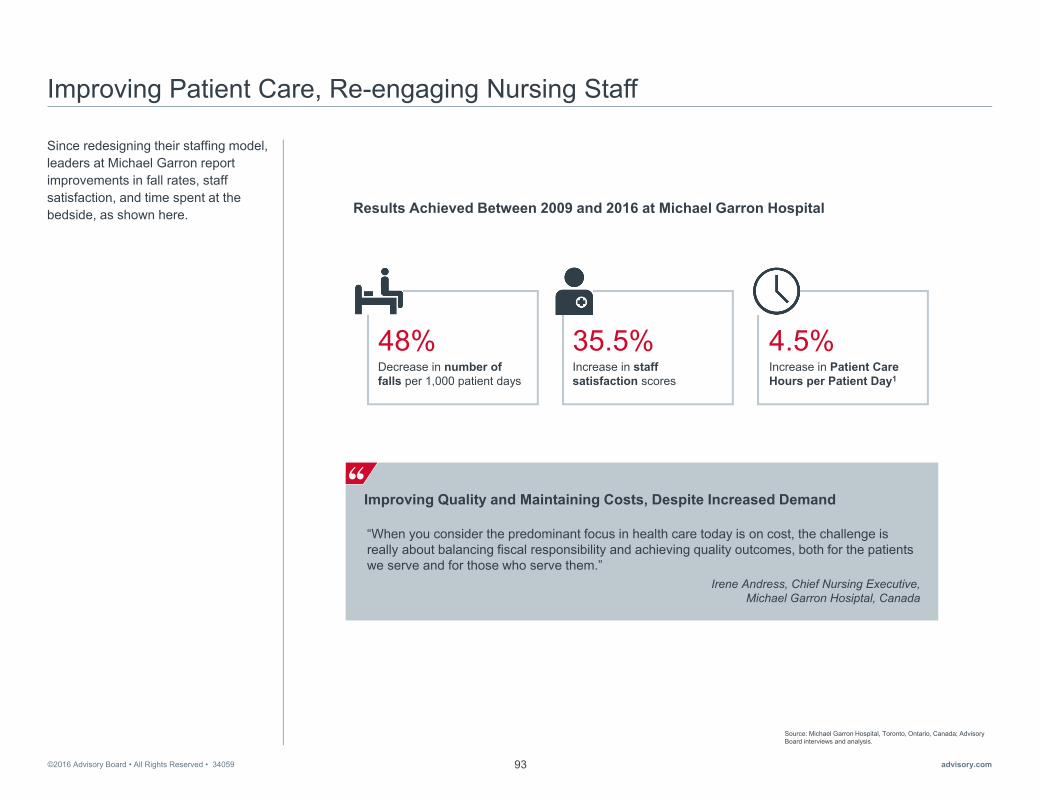
©2016 Advisory Board • All Rights Reserved • 34059 advisory.com93
Improving Patient Care, Re-engaging Nursing Staff
Since redesigning their staffing model, leaders at Michael Garron report improvements in fall rates, staff satisfaction, and time spent at the bedside, as shown here.
Source: Michael Garron Hospital, Toronto, Ontario, Canada; Advisory Board interviews and analysis.
Improving Quality and Maintaining Costs, Despite Increased Demand
Irene Andress, Chief Nursing Executive, Michael Garron Hosiptal, Canada
“When you consider the predominant focus in health care today is on cost, the challenge is really about balancing fiscal responsibility and achieving quality outcomes, both for the patients we serve and for those who serve them.”
Results Achieved Between 2009 and 2016 at Michael Garron Hospital
Increase in staff satisfaction scores
35.5%Increase in Patient Care Hours per Patient Day1
4.5%Decrease in number of falls per 1,000 patient days
48%

©2016 Advisory Board • All Rights Reserved • 34059 advisory.com94

©2016 Advisory Board • All Rights Reserved • 34059 advisory.com95

©2016 Advisory Board • All Rights Reserved • 34059 advisory.com96

This study is a publication of the Global Centre for Nursing Executives, a division of Advisory Board. As a member of the Global Centre for Nursing Executives, you have access to a wide variety of resources, including webconferences, studies, toolkits, our blog, and more. Check out some of our other studies on cost savings.
Untapped Opportunities for Saving Millions
Learn how to take the philanthropy allies you’ve recruited and activate them in fundraising through donor prospecting, driving funding priorities, and engaging their peers.
Building the High Value Care Team
Address three inefficiencies that plague care teams with strategies to achieve the right balance between dollars spent on staffing and quality.
Achieving Top-of-License Nursing Practice
Ensure frontline nurses have the time and support they need to practice to the full extent of their training and skills.
Want more on cost savings?
Visit us at: advisory.com/gcne
Email us at: [email protected]

34059
Third Floor, Melbourne House, 46 Aldwych, London WC2B 4LL, UKP +44 (0) 203 100 6800 | advisory.com