Ripening influences banana and plantain peels composition ... accepted.pdf · 1 Ripening influences...
24
1 Ripening influences banana and plantain peels composition and energy content T. Happi Emaga · J. Bindelle · R. Agneesens · A. Buldgen · B. Wathelet · M. Paquot This article is in press in Trop. Anim Health Prod.: DOI 10.1007/s11250-010-9671-6 T. Happi Emaga · B. Wathelet · M. Paquot University of Liège, Gembloux Agro-Bio Tech, Department of Industrial Biological Chemistry, 2 Passage des Déportés, 5030 Gembloux, Belgium T. Happi Emaga African Research Centre on Bananas and Plantains (CARBAP), PO. Box 832 Douala, Cameroon J. Bindelle () · A. Buldgen † University of Liège, Gembloux Agro-Bio Tech, Animal Science Unit, 2 Passage des Déportés, 5030 Gembloux, Belgium Email : [email protected] † Deceased R. Agneesens
Transcript of Ripening influences banana and plantain peels composition ... accepted.pdf · 1 Ripening influences...
1
Ripening influences banana and plantain peels composition
and energy content
T. Happi Emaga · J. Bindelle · R. Agneesens · A. Buldgen · B. Wathelet · M.
Paquot
This article is in press in Trop. Anim Health Prod.:
DOI 10.1007/s11250-010-9671-6
T. Happi Emaga · B. Wathelet · M. Paquot
University of Liège, Gembloux Agro-Bio Tech, Department of Industrial Biological
Chemistry, 2 Passage des Déportés, 5030 Gembloux, Belgium
T. Happi Emaga
African Research Centre on Bananas and Plantains (CARBAP), PO. Box 832 Douala,
Cameroon
J. Bindelle () · A. Buldgen
†
University of Liège, Gembloux Agro-Bio Tech, Animal Science Unit, 2 Passage des
Déportés, 5030 Gembloux, Belgium
Email : [email protected]
† Deceased
R. Agneesens
2
Centre wallon de Recherches agronomiques, Section Systèmes agricoles, rue du Serpont, 100,
6800, Libramont, Belgium
Abstract Musa sp. peels are widely used by smallholders as complementary feeds for
cattle in the tropics. A study of the influence of the variety and the maturation stage of the
fruit on fermentability and metabolisable energy (ME) content of the peels was performed
using banana (Yangambi Km5) and plantain (Big Ebanga) peels at three stages of maturation
in an in vitro model of the rumen. Peels samples were analysed for starch, free sugars and
fibre composition. Samples were incubated in the presence of rumen fluid. Kinetics of gas
production were modelled, ME content calculated using prediction equation and short-chain
fatty acids production and molar ratio measured after 72 h of fermentation. Final gas
production was higher in plantain (269-339 ml.g-1
) compared to banana (237-328 ml.g-1
) and
plantain exhibited higher ME contents (8.9-9.7 MJ/kg of DM) compared to banana (7.7-8.8
MJ/kg of DM). Butyrate molar ratio decreased with maturity of the peels. The main influence
of the variety and the stage of maturation on all fermentation parameters as well as ME
contents of the peels was correlated to changes in the carbohydrate fraction of the peels,
including starch and fibre.
Keywords Banana · plantain · peels · in vitro fermentation · nutritive value
Abbreviations
ADF acid detergent fibre
ADL acid detergent lignin
BE Plantain variety « Big Ebanga »
CP crude protein
3
DM dry matter
IDF insoluble dietary fibre
IVDMD in vitro dry matter digestibility
ME metabolisable energy
NDF neutral detergent fibre
OMD organic matter digetsibility
SCFA short-chain fatty acids
SDF soluble dietary fibre
TDF total dietary fibre
Ykm5 Banana variety “Yangambi km5”
4
Introduction
In Cameroon, 860,000 tonnes of banana (Musa AAA) and plantain (Musa AAB) were
produced in 2008. At the world level, approx. 90 million tonnes of this fruit are produced,
mainly in tropical areas such as Africa (13 %), South and Central America (28 %) , including
the Caribbean, and South and South Eastern Asia (47%) (FAOSTAT 2010). About 40 % of
this production are wastes, mainly peels which can be used for feeding cattle or pigs. Banana
and plantain peels are rich in fibre, polyphenols and low in protein but their composition
varies according to the species and the variety as well as the maturation (Happi Emaga et al.,
2007). During ripening, the chemical composition of the peels undergoes several major
modifications. The starch is hydrolysed into simple sugars, but conversely to the edible
fraction of the fruit, in peels at later stages of maturation, the simple sugars content often
overpasses that of mere starch found in green peels (Happi Emaga et al. 2007). The protein
profile of banana is very deficient in lysine, methionine and tryptophane, but the ripeness does
not influence the essential AA contents or the profile. The peels contain large quantities of
antioxidants like dopamine (80-560 mg per 100 g in peel) containing 9.14 % of N (Happi
Emaga et al. 2008b, González-Montelongo et al. 2010) which are released as maturation goes
on. The tannins content of the peel which act against the availability of proteins in the rumen
decreases with ripening as a consequence of a migration of the polyphenols from the peel
towards the pulp and the phenolic oxidative degradation by polyphenol oxidases and
peroxidases (Bugaud 2009).
According to the desired use, banana and plantain are consumed or locally processed at
various stages of maturation which have been classified from stage 1, green skin, to stage 7,
yellow skin with black spots (Happi Emaga et al. 2008b). The stage maturation is likely to
influence the nutritive value of the peels and requires investigation in order to allow farmers
5
to adapt the diets fed to the animals to the actual nutritive value of the peels. Previous
research has been conducted to determine the nutritive value of these peels for livestock (e.g.
Negesse et al. 2009), but except Tarkrakoon et al. (1999) who studied the influence of
ripening on the nutritive value of banana peels in pigs, the influence of maturation stage on
nutritive value has been neglected until now. The present study aimed to quantify the
differences in fermentation characteristics and energy content of banana and plantain peels
during ripening and relate them to changes in CHO composition using an in vitro model of the
rumen.
Material and Methods
Sample preparation
Fruit peels from banana (Musa, genotype AAA, Yangambi Km5 “Ykm5”) and plantain
(Musa, genotype AAB, Big Ebanga “BE”), were obtained from the African Research Centre
on Bananas and Plantain (CARBAP, Douala, Cameroon). These fruit peels were obtained at
three different stages of ripeness: stage 1 (green), stage 5 (more yellow than green) and stage
7 (yellow with few black spots). These stages correspond to various uses in transformation
industries and traditional culinary preparations, e.g. flour produced from plantain is done at
stages 1 and 5, while the drying of bananas pulps for dessert is done at stage 7.
The first two hands of each bunch were collected in the field for experimentation. Fruit
stages of maturation were controlled in laboratory at room temperature (20-25 °C). The fruits
were washed and separated into pulps and peels. The peels were dried at 60 °C for 24 h and
ground with a Cyclotec 1093 Sample Mill (FOSS Electric A/S, Hilleroed, Denmark) to pass a
1 mm sieve.
6
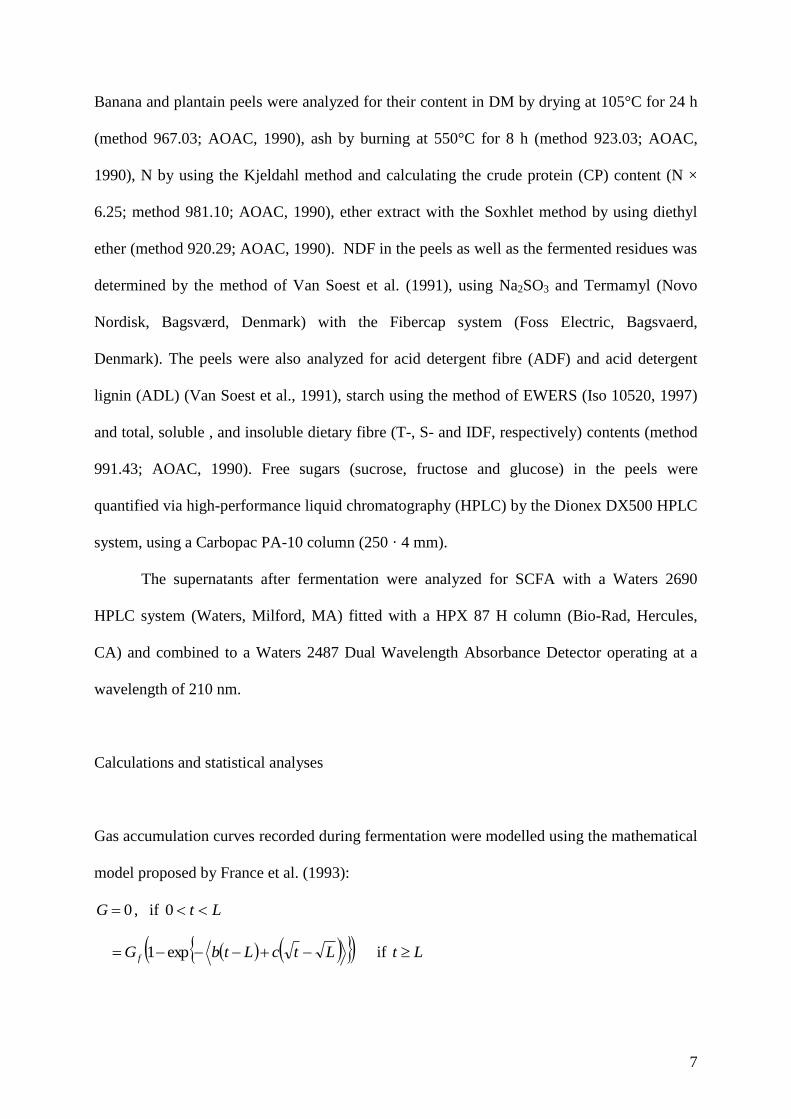
In vitro fermentation
In vitro fermentation was performed using the gas test method described by Menke and
Steingass (1988). Briefly, 200 mg of banana or plantain peels were placed into a 100 ml
Kolbenprober glass syringe. Thereafter, 30 ml of the inoculum prepared mixing the rumen
fluid of 2 Red Holstein cows from the herd of the Centre wallon de Recherches agronomiques
(Libramont, Belgium) to a buffer solution (Menke and Steingass 1988) was added to the
syringes. The syringes were placed in a water-bath at 39 ± 0.5°C for 72 h. During
fermentation, gases (CO2, H2 and CH4) and short-chain fatty acids (SCFA; mainly acetate,
propionate and butyrate) are produced by rumen microbes. SCFA are buffered by the
carbonate ions to release CO2. The released gas volumes (fermentation and buffered gas)
were recorded after 2, 5, 8, 12, 16, 20, 24, 30, 36, 48, and 72 h of incubation by displacement
of the plunger of the syringes in order to measure how fast the different peels were fermented
by the microbes. The incubation was repeated a second run. Three syringes containing only
inoculum (blanks) were systematically included in each run. The experimental scheme was as
the following: (2 ingredients × 3 stages of maturation × 3 replicates + 3 blanks) × 2 runs.
After 72h, fermentation broth were centrifuged (12,000 g, 20 min), the supernatant
sampled for further short-chain fatty acids (SCFA) analysis and the unfermented residual
pellet was analysed for neutral detergent fibre (NDF) content in order to determine in vitro
dry matter digestibility (IVDMD) as recommended by Makkar (2004).
Chemical analyses
7
Banana and plantain peels were analyzed for their content in DM by drying at 105°C for 24 h
(method 967.03; AOAC, 1990), ash by burning at 550°C for 8 h (method 923.03; AOAC,
1990), N by using the Kjeldahl method and calculating the crude protein (CP) content (N ×
6.25; method 981.10; AOAC, 1990), ether extract with the Soxhlet method by using diethyl
ether (method 920.29; AOAC, 1990). NDF in the peels as well as the fermented residues was
determined by the method of Van Soest et al. (1991), using Na2SO3 and Termamyl (Novo
Nordisk, Bagsværd, Denmark) with the Fibercap system (Foss Electric, Bagsvaerd,
Denmark). The peels were also analyzed for acid detergent fibre (ADF) and acid detergent
lignin (ADL) (Van Soest et al., 1991), starch using the method of EWERS (Iso 10520, 1997)
and total, soluble , and insoluble dietary fibre (T-, S- and IDF, respectively) contents (method
991.43; AOAC, 1990). Free sugars (sucrose, fructose and glucose) in the peels were
quantified via high-performance liquid chromatography (HPLC) by the Dionex DX500 HPLC
system, using a Carbopac PA-10 column (250 · 4 mm).
The supernatants after fermentation were analyzed for SCFA with a Waters 2690
HPLC system (Waters, Milford, MA) fitted with a HPX 87 H column (Bio-Rad, Hercules,
CA) and combined to a Waters 2487 Dual Wavelength Absorbance Detector operating at a
wavelength of 210 nm.
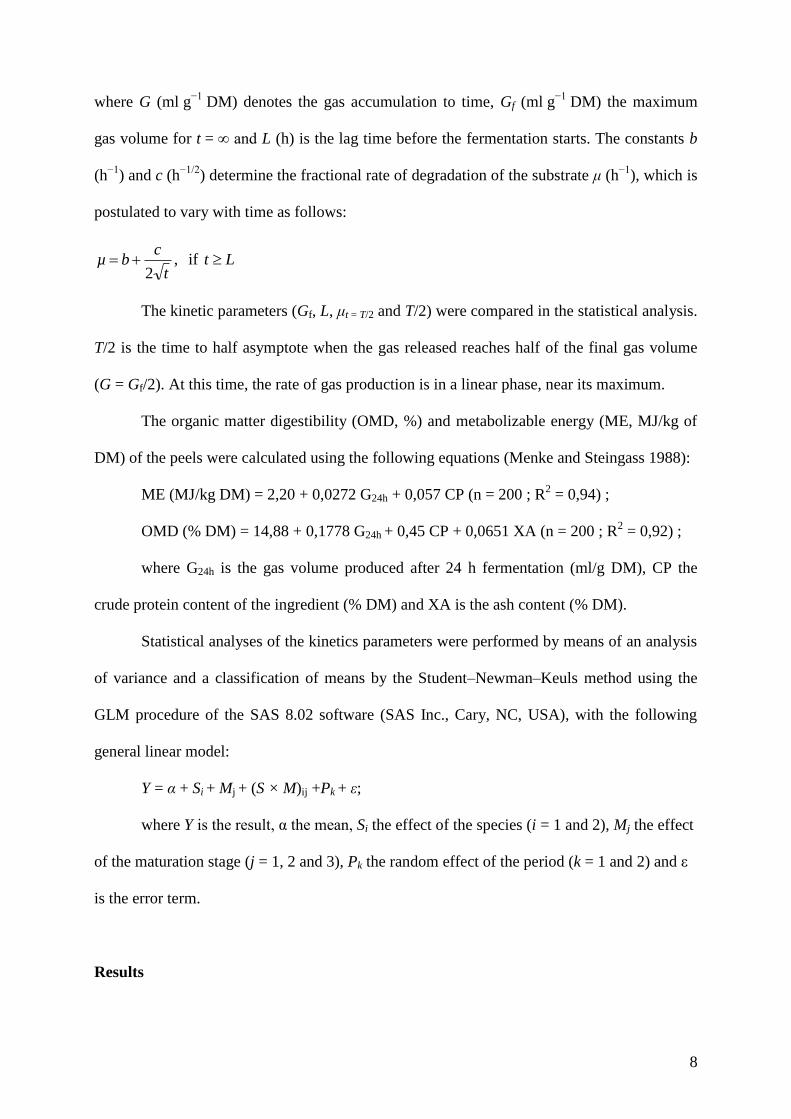
Calculations and statistical analyses
Gas accumulation curves recorded during fermentation were modelled using the mathematical
model proposed by France et al. (1993):
0G , if Lt 0
LtcLtbG f exp1 if Lt
8
where G (ml g−1
DM) denotes the gas accumulation to time, Gf (ml g−1
DM) the maximum
gas volume for t = ∞ and L (h) is the lag time before the fermentation starts. The constants b
(h−1
) and c (h−1/2
) determine the fractional rate of degradation of the substrate μ (h−1
), which is
postulated to vary with time as follows:
t
cbµ
2 , if Lt
The kinetic parameters (Gf, L, μt = T/2 and T/2) were compared in the statistical analysis.
T/2 is the time to half asymptote when the gas released reaches half of the final gas volume
(G = Gf/2). At this time, the rate of gas production is in a linear phase, near its maximum.
The organic matter digestibility (OMD, %) and metabolizable energy (ME, MJ/kg of
DM) of the peels were calculated using the following equations (Menke and Steingass 1988):
ME (MJ/kg DM) = 2,20 + 0,0272 G24h + 0,057 CP (n = 200 ; R2 = 0,94) ;
OMD (% DM) = 14,88 + 0,1778 G24h + 0,45 CP + 0,0651 XA (n = 200 ; R2 = 0,92) ;
where G24h is the gas volume produced after 24 h fermentation (ml/g DM), CP the
crude protein content of the ingredient (% DM) and XA is the ash content (% DM).
Statistical analyses of the kinetics parameters were performed by means of an analysis
of variance and a classification of means by the Student–Newman–Keuls method using the
GLM procedure of the SAS 8.02 software (SAS Inc., Cary, NC, USA), with the following
general linear model:
Y = α + Si + Mj + (S × M)ij +Pk + ε;
where Y is the result, α the mean, Si the effect of the species (i = 1 and 2), Mj the effect
of the maturation stage (j = 1, 2 and 3), Pk the random effect of the period (k = 1 and 2) and ε
is the error term.
Results
9
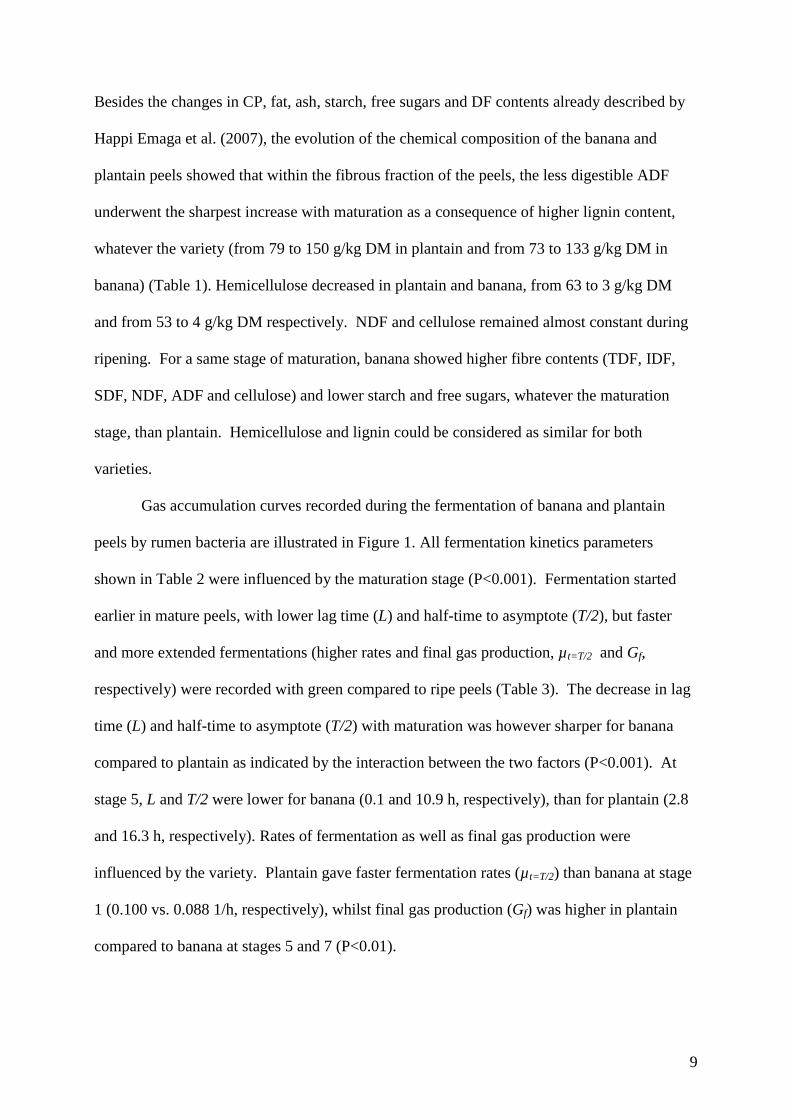
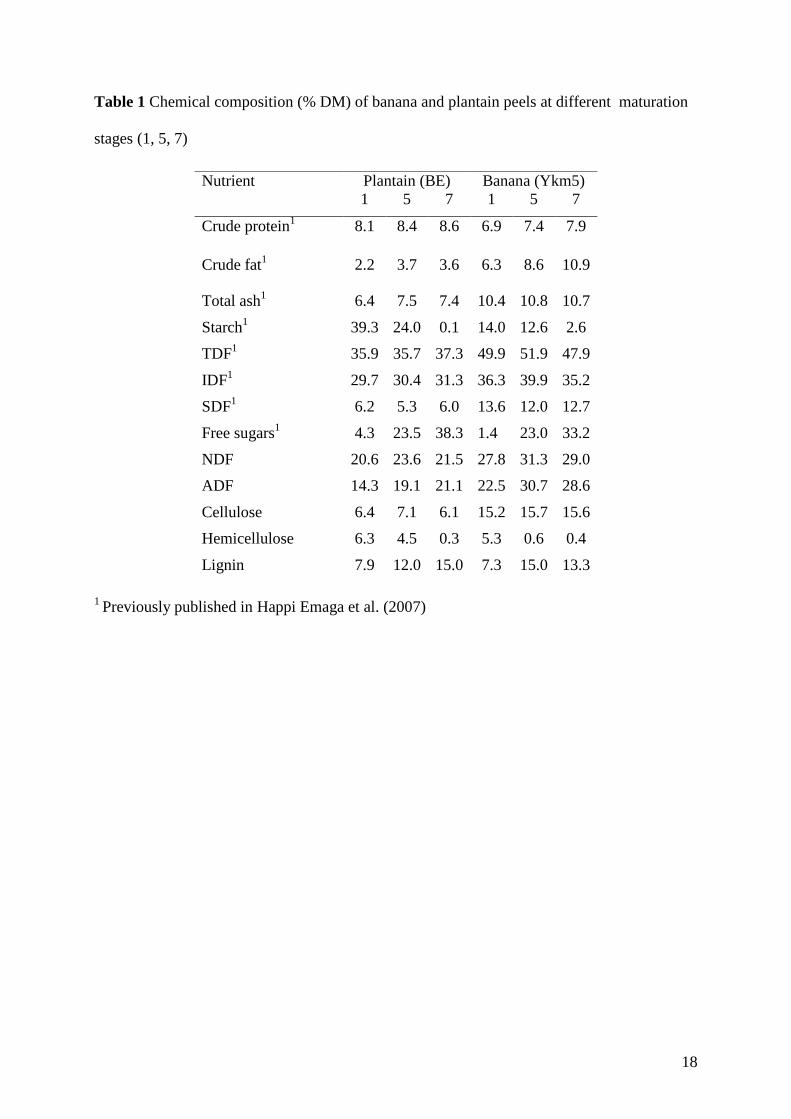
Besides the changes in CP, fat, ash, starch, free sugars and DF contents already described by
Happi Emaga et al. (2007), the evolution of the chemical composition of the banana and
plantain peels showed that within the fibrous fraction of the peels, the less digestible ADF
underwent the sharpest increase with maturation as a consequence of higher lignin content,
whatever the variety (from 79 to 150 g/kg DM in plantain and from 73 to 133 g/kg DM in
banana) (Table 1). Hemicellulose decreased in plantain and banana, from 63 to 3 g/kg DM
and from 53 to 4 g/kg DM respectively. NDF and cellulose remained almost constant during
ripening. For a same stage of maturation, banana showed higher fibre contents (TDF, IDF,
SDF, NDF, ADF and cellulose) and lower starch and free sugars, whatever the maturation
stage, than plantain. Hemicellulose and lignin could be considered as similar for both
varieties.
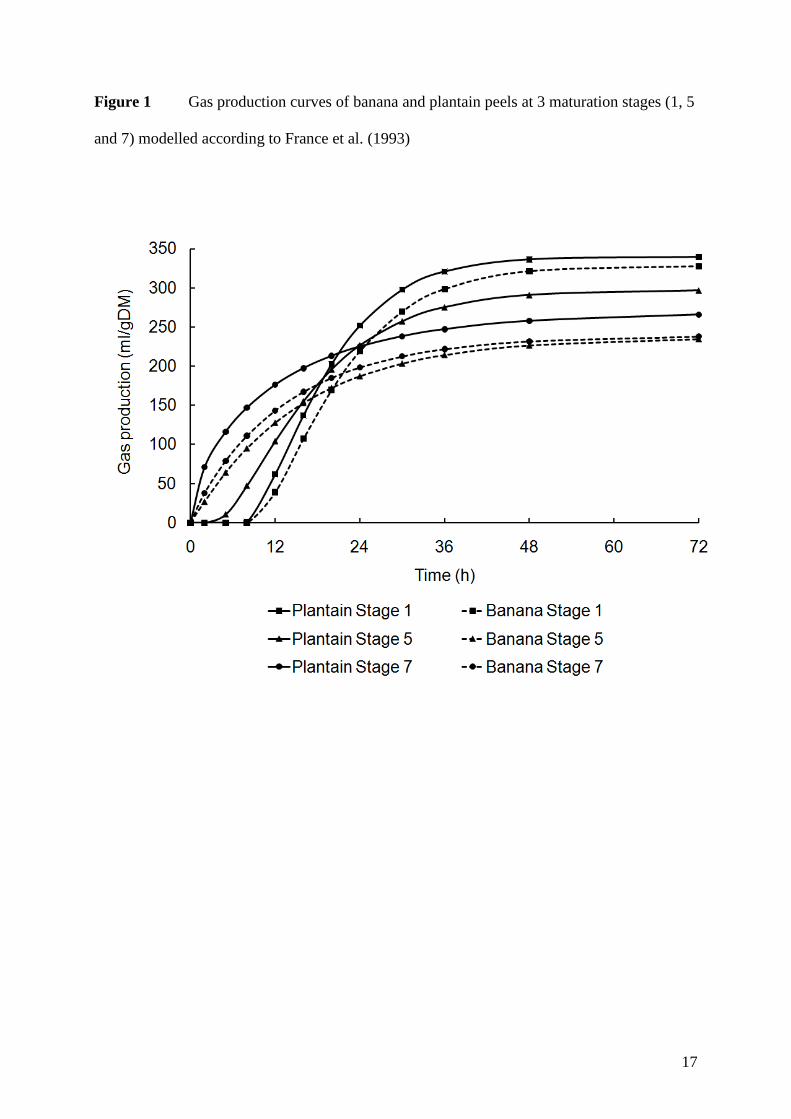
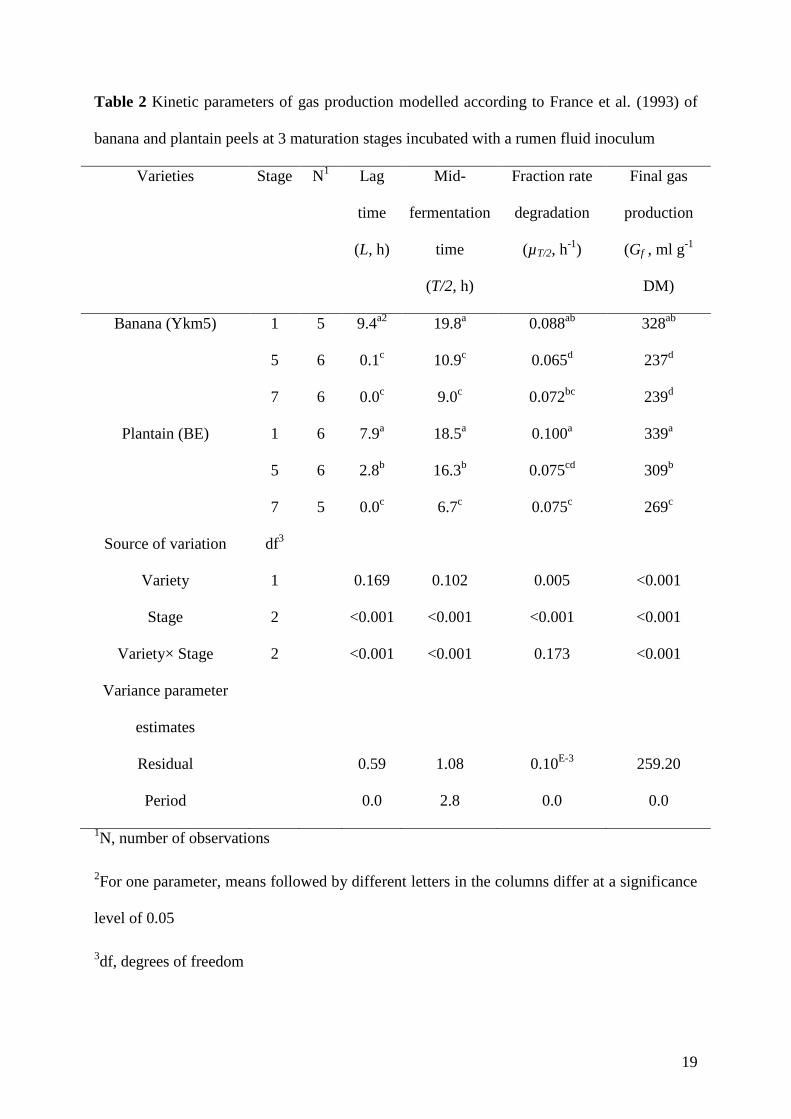
Gas accumulation curves recorded during the fermentation of banana and plantain
peels by rumen bacteria are illustrated in Figure 1. All fermentation kinetics parameters
shown in Table 2 were influenced by the maturation stage (P<0.001). Fermentation started
earlier in mature peels, with lower lag time (L) and half-time to asymptote (T/2), but faster
and more extended fermentations (higher rates and final gas production, µt=T/2 and Gf,
respectively) were recorded with green compared to ripe peels (Table 3). The decrease in lag
time (L) and half-time to asymptote (T/2) with maturation was however sharper for banana
compared to plantain as indicated by the interaction between the two factors (P<0.001). At
stage 5, L and T/2 were lower for banana (0.1 and 10.9 h, respectively), than for plantain (2.8
and 16.3 h, respectively). Rates of fermentation as well as final gas production were
influenced by the variety. Plantain gave faster fermentation rates (µt=T/2) than banana at stage
1 (0.100 vs. 0.088 1/h, respectively), whilst final gas production (Gf) was higher in plantain
compared to banana at stages 5 and 7 (P<0.01).
10
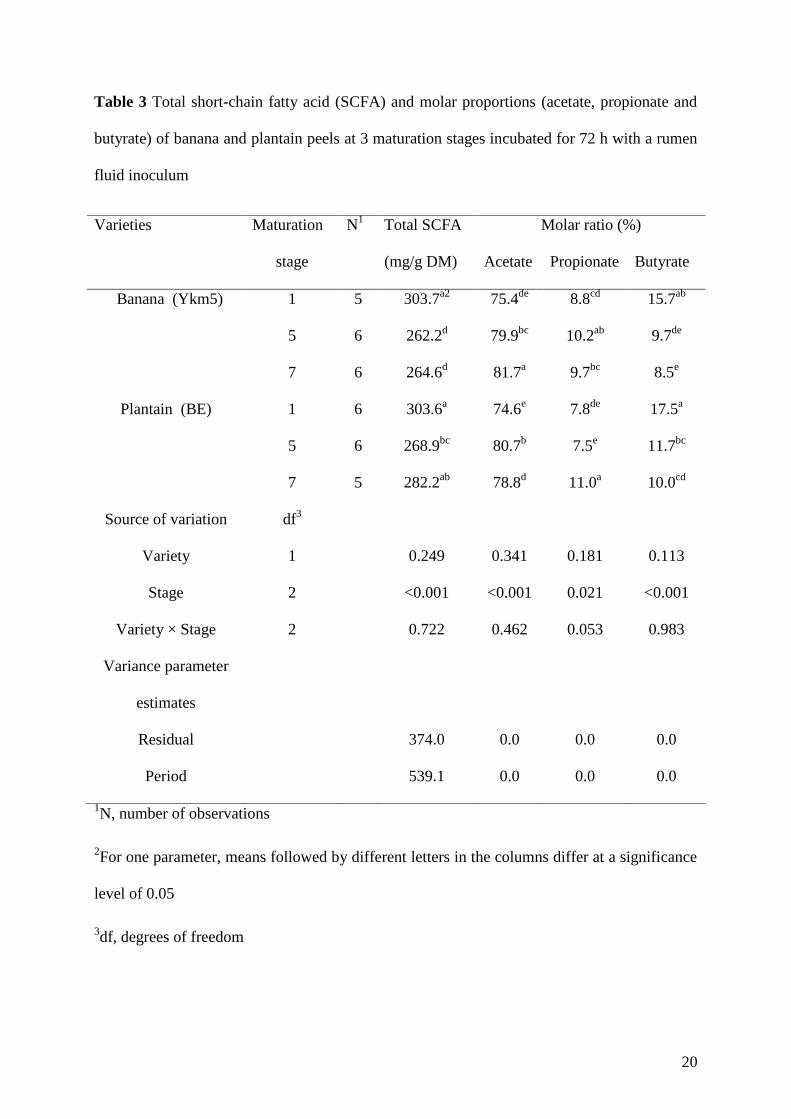
A variation in the total SCFA production by rumen microbes during fermentation as
well as in the molar ratios of acetate, propionate and butyrate was observed according to the
stage of maturation (Table 3). On the other hand, these parameters were not influenced by the
variety (P > 0.05). SCFA production ranged from 262 to 304 mg/g DM and from 269 to 304
mg DM for banana and plantain, respectively. Whatever the variety, these contents were
higher at stage 1 and remained more or less similar between stages 5 and 7. For both varieties,
the molar proportion of acetate increased from 0.75 to approx 0.80 with maturation to the
expense of butyrate which decreased from 0.16 to 0.09 for banana and from 0.18 to 0.10 for
plantain (P<0.001).
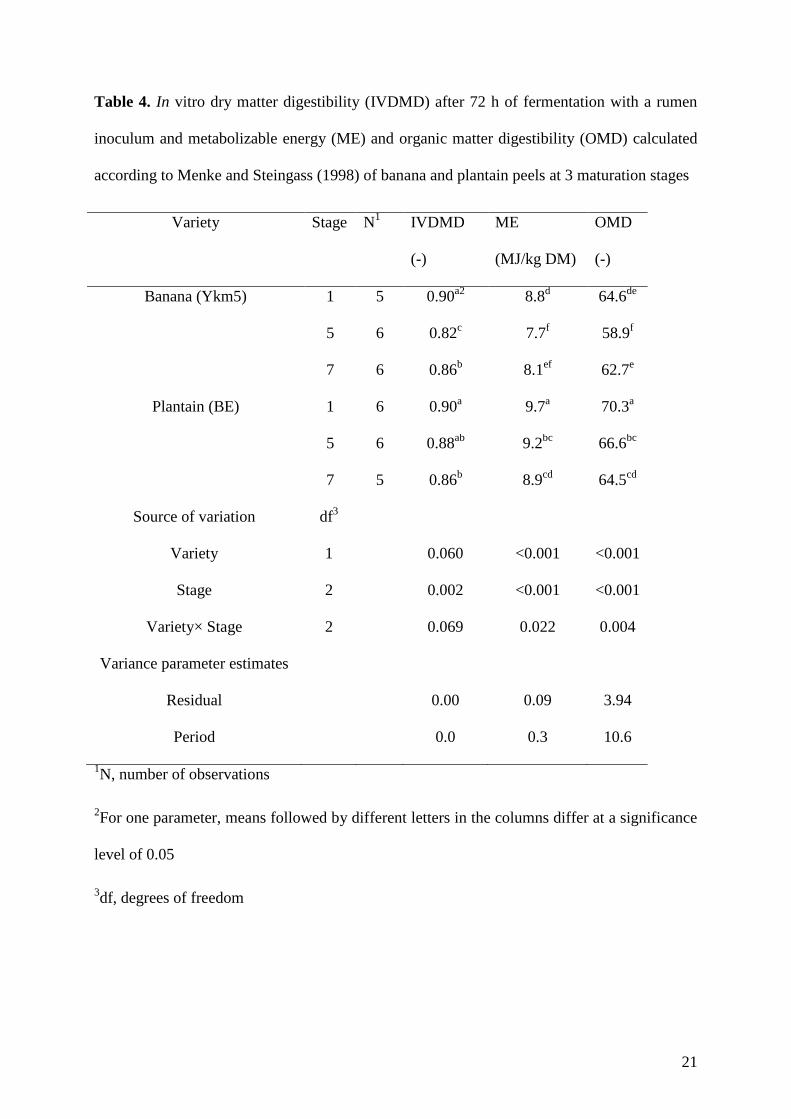
Finally, IVDMD was only influenced by the maturation stage (P = 0.002) from 0.82 to
0.90 and from 0.86 to 0.90 for banana and plantain, respectively. ME and OMD ranged from
7.7 to 9.7 MJ/kg DM and from 0.589 to 0.703 respectively. Both parameters were highly
influenced by variety and stage of maturation (Table 4). Moreover, for ME and OMD,
interactions between the stage and the variety were observed (P<0.05), as a consequence of
the constant decrease with increasing maturation of banana peels values vs. the decrease in
ME and OMD values between stage 1 and stage 5 followed by an increase between stage 5
and stage 7 for plantain peels.
Discussion
The ME values calculated in this study indicate that banana and plantain peels have energy
values that are in the range of other fruit by-products such as oranges peels (Mekasha et al.,
2002), citrus peels (Aregheore, 2000; Bampidis and Robinson, 2006) and cassava peels
(Aregheore, 2000) and for pods of Enterolobium cyclocarpum (Babayemi, 2006). As
hypothesised, both maturation stages and variety influenced the fermentation patterns of the
11
peels. Plantain peels appeared of higher energy value as ruminant feed than banana, at least
for the varieties considered in this study. Green peels (stage 1) were more energetic than ripe
fruits peel (stage 5 and 7).
The main influence of both variety and maturation on fermentability and energy value
of the peels seems to be linked to the numerous alterations undergone by the carbohydrate
(CHO) fraction, including starch and fibre. The reduction in fermentation rate, measured
through the fractional rate of degradation (µt=T/2) and the reduction in final gas production
during maturation is a consequence of the fact that at greener stages (stage 1), to total content
of readily fermentable carbohydrates (i.e. sum starch and free sugars) is higher compared with
the two later stages (5 and 7). The latter stages yield peels which are richer in slower
fermentable carbohydrates such as NDF and ADF (Noziere et al., 2010). With high
lignification, the carbohydrates of the ADF fraction for instance are less accessible to bacteria
and their fermentation requires more time-consuming enzymatic process which lead to lower
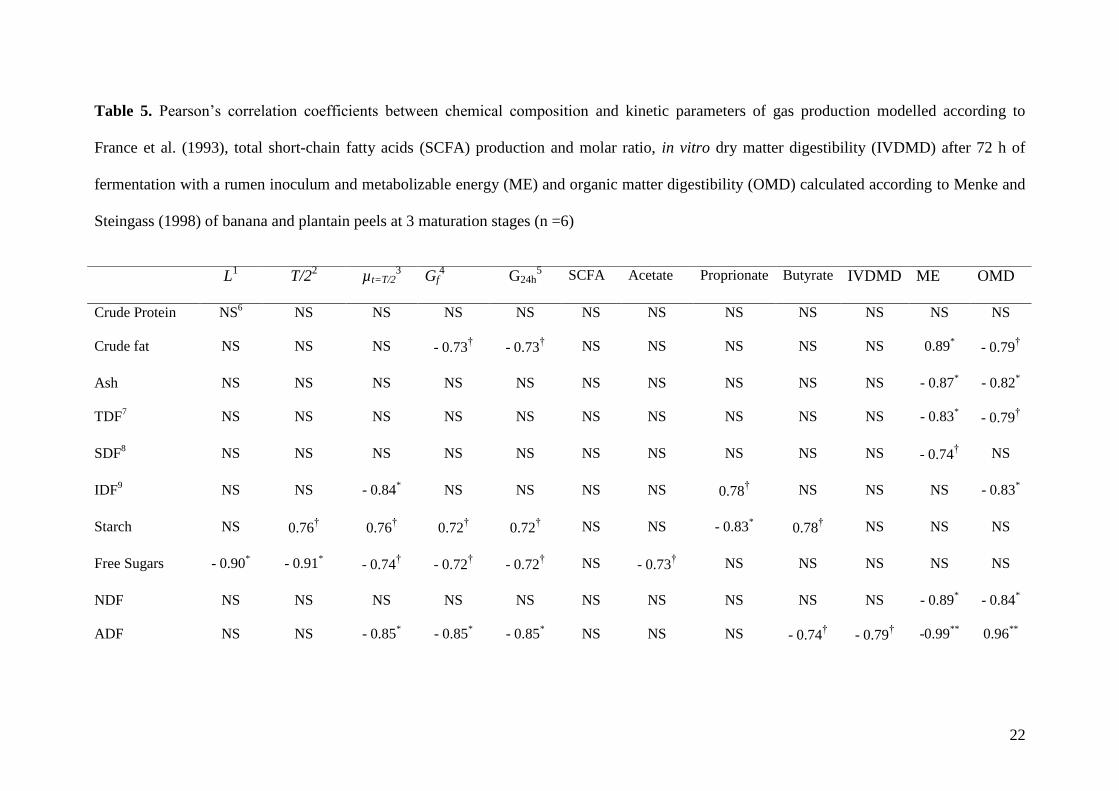
energy recovery for the bacteria (Bindelle et al., 2007). To support this assumption, the
correlations displayed in Table 5 show that the starch content induced fermentation that
started after a longer incubation time (higher L and T/2), but once the fermentation was going
on, it was faster and more extended (higher µt=T/2 and Gf). This is consistent with
observations made by Bindelle et al. (2007) who showed that resistant starch from potatoes
induced longer lag times (L) than the other readily fermentable carbohydrates, i.e. simple
sugars and oligosaccharides, due to slow hydration process required before the bacteria can
actually hydrolyze the starch chains to ferment the constitutive glucose units. It could also be
a consequence of delayed fermentation induced by transitorily storage of starch granules by
ruminal protozoa (Noziere et al. 2010). Conversely, the higher free sugars contents in ripe
peels reduced fermentation lag time. In mature peels, the proportion of these highly
fermentable CHO is similar for plantain and lower for banana. In both cases starch and free
12
sugar contents are counterbalanced by the increased lignifications of the fibrous fraction of
mature peels (increased ADF contents) observed in this study as well as by Happi Emaga et
al. (2008a) with other varieties, yielding lower final gas production than green peels. This
was highlighted in this study by the absence of significant correlation between ME, OMD and
IVDMD, on one side, and starch or free sugars contents, on the other side. It was also
illustrated by the negative correlation between ME, OMD and IVDMD and the ADF content
(r ranging from -0.79 to -0.99) and the positive correlation to the hemicellulose content (r
ranging from 0.76 to 0.85). Hemicellulose is calculated as the difference between NDF and
ADF content. It represents the fibre fraction that is not resistant to acid detergent treatment
and is therefore readily fermented by rumen bacteria, compared to the cellulose content of the
ADF fraction, yielding faster fermentation, thus releasing energy faster for the animal through
SCFA production.
The changes in the CHO composition of the peels are also reflected in the SCFA
profiles after fermentation. SCFA are important to consider as they contribute extensively to
the energy supply of the animal. Propionate proportion increased slightly with maturation,
whereas that of the butyrate decreased significantly from stage 1 to stage 5. This reduction is
likely related to starch hydrolysis during maturation, as starch is known to favour butyrate-
producing microbes.
With higher ME content and butyrate-production, green peels show thus a greater
interest as ingredient for ruminants especially in dairy production, as butyrate is the main
precursor in the synthesis of milk fat. This is an opposite results to those obtained in single-
stomach animals. Tartrakoon et al. (1999) observed that in pigs ME of green banana peels
was lower than that of ripe peels (2775 vs. 3377 kcal/kg respectively). As these authors
ascribed this reduction in digestibility to the influence of tannins in the green peels, further
research should be conducted on the influence of the variety and the maturity of peels of
13
Musa sp. on rumen fermentation with a special focus on the changes in tannins composition.
Tannins have indeed the property to make pH dependent complexes with proteins and might
thus decrease dietary protein fermentation in the rumen, increasing the contribution of the diet
to protein supply in the intestine. This is particularly useful for dairy cows during the peak of
milk production. The influence of maturity and variety on nutritive value in other species
such as pigs should also deserve attention. Nevertheless, it can already be concluded from
this study that due to variation higher than 15 % in terms of ME contents as measured using
an in vitro method, different energy values should be considered when using Musa sp. peels in
ruminant diets, depending on the maturation stage and the variety of the fruit.
Acknowledgments T. Happi Emaga was funded by the Commission universitaire pour le
Développement (CUD, CIUF, Brussels, Belgium). The authors are also grateful to the
technical staff of the laboratory of postharvest technology (CARBAP, Cameroon).

14
References
AOAC. 1990. Official Methods of Analysis. 15th ed. (Association of Official Analytical
Chemists, Arlington, VA)
Aregheore, E.M., 2000. Chemical composition and nutritive value of some tropical by-
product feedstuffs for small ruminant-in vivo and in vitro digestibility. Animal Feed
Science and Technology, 85, 99--109
Babayemi, O., 2006. Antinutritional factors, nutritive value and in vitro gas production of
foliage and fruit of Enterolobium cyclocarpum. World Journal of Zoology, 1, 113--117
Bampidis, V.A. and Robinson, P.H., 2006. Citrus by-products as ruminant feeds: A review.
Animal Feed Science and Technology, 128, 175--217
Bindelle, J., Buldgen, A., Wavreille, J., Agneesens, R., Destain, J.P., Wathelet, B. and
Leterme, P., 2007. The source of fermentable carbohydrates influences the in vitro protein
synthesis by colonic bacteria isolated from pigs. Animal, 1, 1126--1133
Bugaud, C., Alter, P., Daribo, M.O. and Brioullet, J.M., 2009. Comparison of the physico-
chemical characteristics of a new triploid banana hybrid, FLHORBAN 920, and the
Cavendish variety. Journal of the Science of Food and Agriculture, 89, 407--413
FAOSTAT, 2010. FAOSTAT Available from http://faostat.fao.org (accessed July 14th 2010 )
France, J., Dhanoa, M.S., Theodorou, M.K., Lister, S.J., Davies, D.R., Isac. D., 1993. A
model to interpret gas accumulation profiles associated with in vitro degradation of
ruminant feeds, Journal of Theoretical Biology, 163, 99--111
González-Montelongo, R., Lobo, M.G. and González, M., 2010. Antioxidant activity in
banana peel extracts: Testing extraction conditions and related bioactive compounds.Food
Chemistry. 119, 1030--1039
15
Happi Emaga, T., Andrianaivo, R.H., Wathelet, B., Tchango Tchango, J. and Paquot, M.,
2007. Effects of the stage of maturation and varieties on the chemical composition of
banana and plantain peels. Food Chemistry, 103, 590--600
Happi Emaga, T.; Robert, C., Ronkart, S.N., Wathelet, B. and Paquot, M., 2008a. Dietary
fibre components and pectin chemical features of peels during ripening in banana and
plantain varieties. Bioresource Technology, 99, 4346--4354
Happi Emaga, T., Wathelet, B. and Paquot, M., 2008b. Changements texturaux et
biochimiques des fruits du bananier au cours de la maturation. Leur influence sur la
préservation de la qualité du fruit et la maîtrise de la maturation. Biotechnology,
Agronomy, Society, and Environment 12, 89--98
ISO 10520, 1997. Native starch-determination of starch content-Ewers polarimetric method
(International Organization for Standardization,Geneva)
Makkar, H.P.S., 2004. Recent advances in the in vitro gas method for evaluation of nutritional
quality of feed resources. In: FAO (ed), Assessing quality and safety of animal feeds
(FAO, Rome), 55--88
Mekasha, Y., Tegegne, A., Yami, A. and Umunna, N.N., 2002. Evaluation of non-
conventional agro-industrial by-products as supplementary feeds for ruminants: in vitro
and metabolism study with sheep. Small Ruminant Research, 44, 25--35
Menke, K.H. and Steingass, H., 1988. Estimation of the energetic feed value obtained from
chemical analysis and in vitro gas production using rumen fluid. Animal Research
Development 28, 7--55
Negesse, T., Makkar, H.P.S. and Becker, K., 2009. Nutritive value of some non-conventional
feed resources of Ethiopia determined by chemical analyses and an in vitro gas method.
Animal Feed Science and Technology, 154, 204--217
16
Nozière, P., Ortigues-Martya, I., Lonckea, C. and Sauvant, D., 2010. Carbohydrate
quantitative digestion and absorption in ruminants: from feed starch and fibre to nutrients
available for tissues. Animal, 4, 1057--1074
Tartrakoon, T., Chalearmsan, N., Vearasilp, T. and ter Meulen, U., 1999. The nutritive value
of banana peel (Musa sapieutum L.) in growing pigs. In: Proceedings of the Deutscher
Tropentag 1999, Berlin, 1999 (Humboldt University of Berlin and ATSAF, Berlin), CD-
ROM
17
Figure 1 Gas production curves of banana and plantain peels at 3 maturation stages (1, 5
and 7) modelled according to France et al. (1993)
18
Table 1 Chemical composition (% DM) of banana and plantain peels at different maturation
stages (1, 5, 7)
1 Previously published in Happi Emaga et al. (2007)
Nutrient Plantain (BE)
Banana (Ykm5)
1 5 7 1 5 7
Crude protein1
8.1 8.4 8.6 6.9 7.4 7.9
Crude fat1 2.2 3.7 3.6 6.3 8.6 10.9
Total ash1 6.4
7.5
7.4
10.4
10.8
10.7
Starch
1 39.3
24.0
0.1 14.0 12.6 2.6
TDF1 35.9 35.7 37.3 49.9 51.9 47.9
IDF1 29.7 30.4 31.3 36.3 39.9 35.2
SDF1 6.2 5.3 6.0 13.6 12.0 12.7
Free sugars1 4.3 23.5 38.3 1.4 23.0 33.2
NDF 20.6 23.6 21.5 27.8 31.3 29.0
ADF 14.3 19.1 21.1 22.5 30.7 28.6
Cellulose 6.4 7.1 6.1 15.2 15.7 15.6
Hemicellulose 6.3 4.5 0.3 5.3 0.6 0.4
Lignin 7.9 12.0 15.0 7.3 15.0 13.3
19
Table 2 Kinetic parameters of gas production modelled according to France et al. (1993) of
banana and plantain peels at 3 maturation stages incubated with a rumen fluid inoculum
Varieties Stage N1
Lag
time
(L, h)
Mid-
fermentation
time
(T/2, h)
Fraction rate
degradation
(µT/2, h-1
)
Final gas
production
(Gf , ml g-1
DM)
Banana (Ykm5) 1 5 9.4a2
19.8a
0.088ab
328ab
5 6 0.1c
10.9c
0.065d
237d
7 6 0.0c
9.0c
0.072bc
239d
Plantain (BE) 1 6 7.9a
18.5a
0.100a
339a
5 6 2.8b
16.3b
0.075cd
309b
7 5 0.0c
6.7c
0.075c
269c
Source of variation df3
Variety 1 0.169 0.102 0.005 <0.001
Stage 2 <0.001 <0.001 <0.001 <0.001
Variety× Stage 2 <0.001 <0.001 0.173 <0.001
Variance parameter
estimates
Residual 0.59 1.08 0.10E-3
259.20
Period 0.0 2.8 0.0 0.0
1N, number of observations
2For one parameter, means followed by different letters in the columns differ at a significance
level of 0.05
3df, degrees of freedom
20
Table 3 Total short-chain fatty acid (SCFA) and molar proportions (acetate, propionate and
butyrate) of banana and plantain peels at 3 maturation stages incubated for 72 h with a rumen
fluid inoculum
1N, number of observations
2For one parameter, means followed by different letters in the columns differ at a significance
level of 0.05
3df, degrees of freedom
Varieties Maturation N1
Total SCFA Molar ratio (%)
stage (mg/g DM) Acetate Propionate Butyrate
Banana (Ykm5) 1 5 303.7a2
75.4de
8.8cd
15.7ab
5 6 262.2d
79.9bc
10.2ab
9.7de
7 6 264.6d
81.7a
9.7bc
8.5e
Plantain (BE) 1 6 303.6a
74.6e
7.8de
17.5a
5 6 268.9bc
80.7b
7.5e
11.7bc
7 5 282.2ab
78.8d
11.0a
10.0cd
Source of variation df3
Variety 1 0.249 0.341 0.181 0.113
Stage 2 <0.001 <0.001 0.021 <0.001
Variety × Stage 2 0.722 0.462 0.053 0.983
Variance parameter
estimates
Residual 374.0 0.0 0.0
0.0
Period 539.1 0.0 0.0 0.0
21
Table 4. In vitro dry matter digestibility (IVDMD) after 72 h of fermentation with a rumen
inoculum and metabolizable energy (ME) and organic matter digestibility (OMD) calculated
according to Menke and Steingass (1998) of banana and plantain peels at 3 maturation stages
1N, number of observations
2For one parameter, means followed by different letters in the columns differ at a significance
level of 0.05
3df, degrees of freedom
Variety Stage N1
IVDMD
(-)
ME
(MJ/kg DM)
OMD
(-)
Banana (Ykm5) 1 5 0.90a2
8.8d
64.6de
5 6 0.82c
7.7f
58.9f
7 6 0.86b
8.1ef
62.7e
Plantain (BE) 1 6 0.90a
9.7a
70.3a
5 6 0.88ab
9.2bc
66.6bc
7 5 0.86b
8.9cd
64.5cd
Source of variation df3
Variety 1 0.060 <0.001 <0.001
Stage 2 0.002 <0.001 <0.001
Variety× Stage 2 0.069 0.022 0.004
Variance parameter estimates
Residual 0.00 0.09 3.94
Period 0.0 0.3 10.6
22
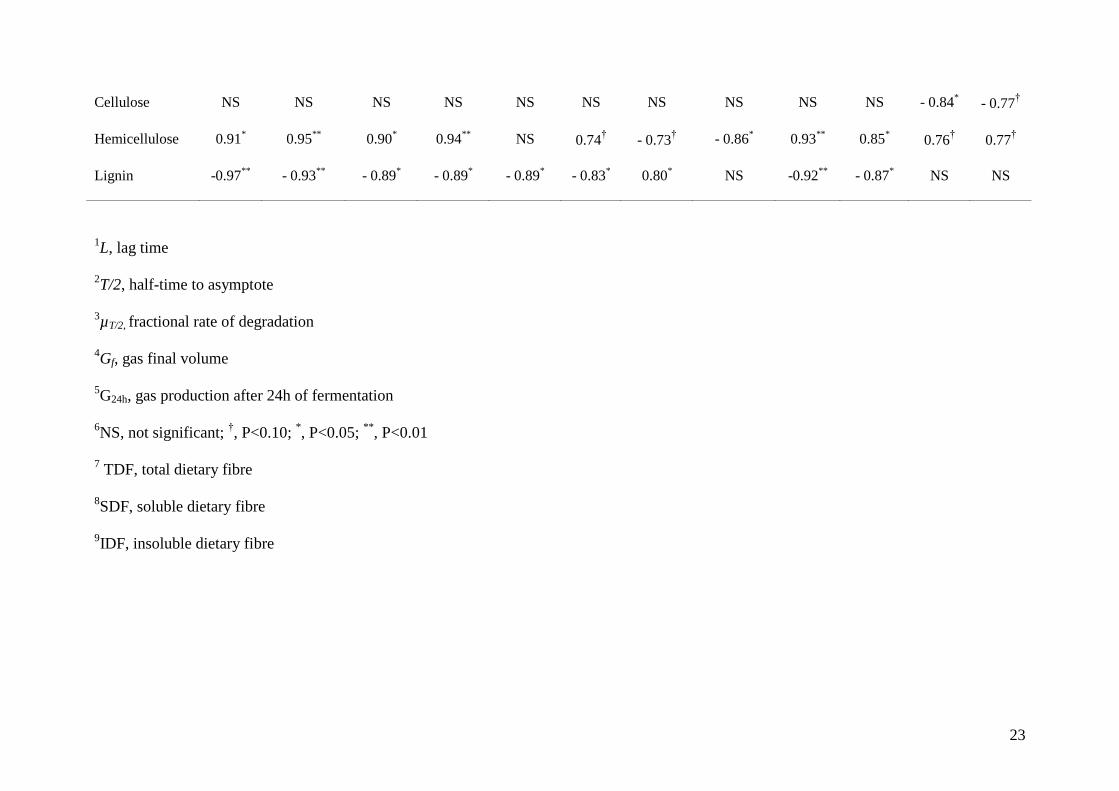
Table 5. Pearson’s correlation coefficients between chemical composition and kinetic parameters of gas production modelled according to
France et al. (1993), total short-chain fatty acids (SCFA) production and molar ratio, in vitro dry matter digestibility (IVDMD) after 72 h of
fermentation with a rumen inoculum and metabolizable energy (ME) and organic matter digestibility (OMD) calculated according to Menke and
Steingass (1998) of banana and plantain peels at 3 maturation stages (n =6)
L1
T/22
µt=T/23
Gf4
G24h5 SCFA Acetate Proprionate Butyrate IVDMD ME OMD
Crude Protein NS6
NS
NS
NS NS NS
NS
NS
NS
NS
NS NS
Crude fat NS
NS
NS
- 0.73†
- 0.73† NS
NS
NS
NS
NS
0.89
* - 0.79
†
Ash NS NS NS NS NS NS NS NS NS NS - 0.87* - 0.82
*
TDF7 NS
NS
NS
NS
NS
NS
NS
NS
NS
NS
- 0.83
* - 0.79
†
SDF8
NS NS
NS
NS
NS
NS NS
NS
NS
NS
- 0.74† NS
IDF9
NS
NS - 0.84*
NS NS NS
NS
0.78† NS
NS NS
- 0.83
*
Starch NS 0.76† 0.76
† 0.72
† 0.72
† NS
NS
- 0.83
* 0.78
† NS
NS NS
Free Sugars - 0.90* - 0.91
* - 0.74
† - 0.72
† - 0.72
† NS - 0.73
† NS
NS
NS
NS
NS
NDF NS NS
NS NS
NS
NS
NS
NS
NS NS
- 0.89* - 0.84
*
ADF NS NS
- 0.85* - 0.85
* - 0.85
* NS
NS NS
- 0.74
† - 0.79
† -0.99**
0.96**
23
1L, lag time
2T/2, half-time to asymptote
3µT/2, fractional rate of degradation
4Gf, gas final volume
5G24h, gas production after 24h of fermentation
6NS, not significant;
†, P<0.10;
*, P<0.05;
**, P<0.01
7 TDF, total dietary fibre
8SDF, soluble dietary fibre
9IDF, insoluble dietary fibre
Cellulose NS NS NS NS NS
NS NS
NS NS
NS - 0.84* - 0.77
†
Hemicellulose 0.91* 0.95
** 0.90
* 0.94
** NS
0.74
† - 0.73
† - 0.86
* 0.93
** 0.85
* 0.76
† 0.77
†
Lignin -0.97**
- 0.93**
- 0.89* - 0.89
* - 0.89
* - 0.83
* 0.80
* NS
-0.92
** - 0.87
* NS
NS

24