RIHLAND ELEMENTARY SHOOL School Accountability … · responsibility to teach a rigorous and...
12
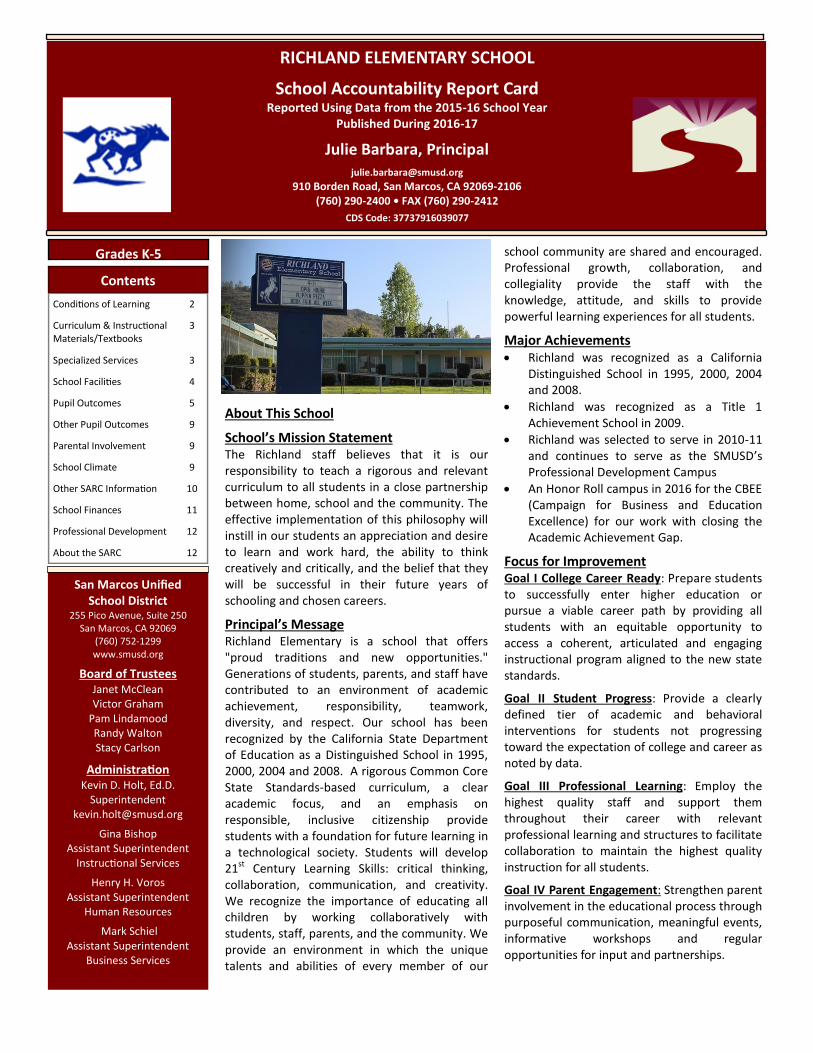
About This School School’s Mission Statement The Richland staff believes that it is our responsibility to teach a rigorous and relevant curriculum to all students in a close partnership between home, school and the community. The effective implementation of this philosophy will instill in our students an appreciation and desire to learn and work hard, the ability to think creatively and critically, and the belief that they will be successful in their future years of schooling and chosen careers. Principal’s Message Richland Elementary is a school that offers "proud traditions and new opportunities." Generations of students, parents, and staff have contributed to an environment of academic achievement, responsibility, teamwork, diversity, and respect. Our school has been recognized by the California State Department of Education as a Distinguished School in 1995, 2000, 2004 and 2008. A rigorous Common Core State Standards-based curriculum, a clear academic focus, and an emphasis on responsible, inclusive citizenship provide students with a foundation for future learning in a technological society. Students will develop 21 st Century Learning Skills: critical thinking, collaboration, communication, and creativity. We recognize the importance of educating all children by working collaboratively with students, staff, parents, and the community. We provide an environment in which the unique talents and abilities of every member of our school community are shared and encouraged. Professional growth, collaboration, and collegiality provide the staff with the knowledge, attitude, and skills to provide powerful learning experiences for all students. Major Achievements Richland was recognized as a California Distinguished School in 1995, 2000, 2004 and 2008. Richland was recognized as a Title 1 Achievement School in 2009. Richland was selected to serve in 2010-11 and continues to serve as the SMUSD’s Professional Development Campus An Honor Roll campus in 2016 for the CBEE (Campaign for Business and Education Excellence) for our work with closing the Academic Achievement Gap. Focus for Improvement Goal I College Career Ready: Prepare students to successfully enter higher education or pursue a viable career path by providing all students with an equitable opportunity to access a coherent, articulated and engaging instructional program aligned to the new state standards. Goal II Student Progress: Provide a clearly defined tier of academic and behavioral interventions for students not progressing toward the expectation of college and career as noted by data. Goal III Professional Learning: Employ the highest quality staff and support them throughout their career with relevant professional learning and structures to facilitate collaboration to maintain the highest quality instruction for all students. Goal IV Parent Engagement: Strengthen parent involvement in the educational process through purposeful communication, meaningful events, informative workshops and regular opportunities for input and partnerships. RICHLAND ELEMENTARY SCHOOL School Accountability Report Card Reported Using Data from the 2015-16 School Year Published During 2016-17 Julie Barbara, Principal [email protected] 910 Borden Road, San Marcos, CA 92069-2106 (760) 290-2400 • FAX (760) 290-2412 CDS Code: 37737916039077 Grades K-5 Contents Condions of Learning 2 Curriculum & Instruconal Materials/Textbooks 3 Specialized Services 3 School Facilies 4 Pupil Outcomes 5 Other Pupil Outcomes 9 Parental Involvement 9 School Climate 9 Other SARC Informaon 10 School Finances 11 Professional Development 12 About the SARC 12 San Marcos Unified School District 255 Pico Avenue, Suite 250 San Marcos, CA 92069 (760) 752-1299 www.smusd.org Board of Trustees Janet McClean Victor Graham Pam Lindamood Randy Walton Stacy Carlson Administraon Kevin D. Holt, Ed.D. Superintendent [email protected] Gina Bishop Assistant Superintendent Instruconal Services Henry H. Voros Assistant Superintendent Human Resources Mark Schiel Assistant Superintendent Business Services
Transcript of RIHLAND ELEMENTARY SHOOL School Accountability … · responsibility to teach a rigorous and...
About This School
School’s Mission Statement The Richland staff believes that it is our responsibility to teach a rigorous and relevant curriculum to all students in a close partnership between home, school and the community. The effective implementation of this philosophy will instill in our students an appreciation and desire to learn and work hard, the ability to think creatively and critically, and the belief that they will be successful in their future years of schooling and chosen careers.
Principal’s Message Richland Elementary is a school that offers "proud traditions and new opportunities." Generations of students, parents, and staff have contributed to an environment of academic achievement, responsibility, teamwork, diversity, and respect. Our school has been recognized by the California State Department of Education as a Distinguished School in 1995, 2000, 2004 and 2008. A rigorous Common Core State Standards-based curriculum, a clear academic focus, and an emphasis on responsible, inclusive citizenship provide students with a foundation for future learning in a technological society. Students will develop 21st Century Learning Skills: critical thinking, collaboration, communication, and creativity. We recognize the importance of educating all children by working collaboratively with students, staff, parents, and the community. We provide an environment in which the unique talents and abilities of every member of our
school community are shared and encouraged. Professional growth, collaboration, and collegiality provide the staff with the knowledge, attitude, and skills to provide powerful learning experiences for all students.
Major Achievements Richland was recognized as a California
Distinguished School in 1995, 2000, 2004 and 2008.
Richland was recognized as a Title 1 Achievement School in 2009.
Richland was selected to serve in 2010-11 and continues to serve as the SMUSD’s Professional Development Campus
An Honor Roll campus in 2016 for the CBEE (Campaign for Business and Education Excellence) for our work with closing the Academic Achievement Gap.
Focus for Improvement Goal I College Career Ready: Prepare students to successfully enter higher education or pursue a viable career path by providing all students with an equitable opportunity to access a coherent, articulated and engaging instructional program aligned to the new state standards.
Goal II Student Progress: Provide a clearly defined tier of academic and behavioral interventions for students not progressing toward the expectation of college and career as noted by data.
Goal III Professional Learning: Employ the highest quality staff and support them throughout their career with relevant professional learning and structures to facilitate collaboration to maintain the highest quality instruction for all students.
Goal IV Parent Engagement: Strengthen parent involvement in the educational process through purposeful communication, meaningful events, informative workshops and regular opportunities for input and partnerships.
RICHLAND ELEMENTARY SCHOOL
School Accountability Report Card Reported Using Data from the 2015-16 School Year
Published During 2016-17
Julie Barbara, Principal
910 Borden Road, San Marcos, CA 92069-2106 (760) 290-2400 • FAX (760) 290-2412
CDS Code: 37737916039077
Grades K-5
Contents
Conditions of Learning 2
Curriculum & Instructional Materials/Textbooks
3
Specialized Services 3
School Facilities 4
Pupil Outcomes 5
Other Pupil Outcomes 9
Parental Involvement 9
School Climate 9
Other SARC Information 10
School Finances 11
Professional Development 12
About the SARC 12
San Marcos Unified School District
255 Pico Avenue, Suite 250 San Marcos, CA 92069
(760) 752-1299 www.smusd.org
Board of Trustees Janet McClean Victor Graham
Pam Lindamood Randy Walton Stacy Carlson
Administration Kevin D. Holt, Ed.D.
Superintendent [email protected]
Gina Bishop Assistant Superintendent
Instructional Services
Henry H. Voros Assistant Superintendent
Human Resources
Mark Schiel Assistant Superintendent
Business Services

2
Student Enrollment by Grade Level (2015-16) This table displays the number of students by grade level that were enrolled at the school on the previous year Fall Census Day (first Wednesday in October). The data source is the certified California Longitudinal Pupil Achievement Data System (CALPADS) Fall 1 data.
Student Enrollment by Subgroup (2015-16) This table includes the percentage of students enrolled at the school on the previous year Fall Census Day (first Wednesday in October) by racial/ethnic student group, and the percentage of students at the school who are identified as socioeconomically disadvantaged (SED), English Learners (ELs), students with disabilities, and foster youth. The data source is the certified California Longitudinal Pupil Achievement Data System (CALPADS) Fall 1 data.
Conditions of Learning:
Teacher Credentials Here we report the number of teachers assigned to the school and the district with a full credential, without a full credential, and those teaching outside their subject area of competence.
Teacher Misassignments and Vacant Teacher Positions This table displays the number of teacher misassignments and the number of vacant teacher positions (not filled by a single designated teacher assigned to teach the entire course during the first 20 days of the school year or semester).
Note: “Misassignments” refers to the number of positions filled by teachers who lack legal authorization to teach that grade level, subject area, student group, etc. *Total Teacher Misassignments includes the number of Misassignments of Teachers of English Learners (EL).
Core Academic Courses Taught by Highly Qualified Teachers The Elementary and Secondary Education Act (ESEA) requires that core academic subjects be taught by Highly Qualified Teachers (HQT), defined as having at least a bachelor’s degree, an appropriate California teaching credential, and demonstrated core academic subject area competence. For more information, see the CDE Improving Teacher and Principal Quality Web page at: http://www.cde.ca.gov/nclb/sr/tq/.
*High-poverty schools are defined as those schools with student eligibility of approximately 40 percent or more in the free and reduced price meals program. **Low-poverty schools are those with student eligibility of approximately 39 percent or less in the free and reduced price meals program.
Teacher Assignment All Richland Elementary School teachers are highly qualified as part of No Child Left Behind. Our Instructional Leadership Team has teacher representatives from every grade level working to improve aspects of the instructional program at Richland. Teacher representatives participate on the School Site Council, ELAC Committee, and PTO Board. Two of our experienced teachers serve as our school’s Intervention teachers and all grade levels have teachers teaching before or after-school remediation classes. This year we have added two part- time math intervention teachers and two part-time aides to support math intervention.
Group Percent of Total Enrollment
Black or African American 1.7%
American Indian or Alaska Native 0.0%
Asian 2.7%
Filipino 2.2%
Hispanic or Latino 44.2%
Native Hawaiian or Pacific Islander 0.2%
White 46.7%
Two or More Races 1.7%
Other 0.6%
Socioeconomically Disadvantaged 36.9%
English Learners 17.3%
Students with Disabilities 11.9%
Foster Youth 0.1%
School District Teachers
2014-15 2015-16 2016-17 2016-17
With Full Credential 41 38 37 916.27
Without Full Credential 0 0 0 0
Teaching Outside Subject Area of Competence
0 0 0
Location of Classes
Percent of Classes in Core Academic Subjects
Taught by Highly Qualified Teachers
Not Taught by Highly Qualified Teachers
School 100% 0.0%
Districtwide
All Schools 100% 0.0%
High-Poverty Schools* 100% 0.0%
Low-Poverty Schools ** 100% 0.0%
Grade Level Enrollment
Kindergarten 135
Grade 1 118
Grade 2 129
Grade 3 137
Grade 4 154
Grade 5 132
Total Enrollment 805
2014-15 2015-16 2016-17
Misassignments of Teachers of EL 0 0 0
*Total Teacher Misassignments 0 0 0
Vacant Teacher Positions 0 0 0
SCHOOL ACCOUNTABILITY REPORT CARD

3
Curriculum and Instructional Materials
Reading and Writing: Students receive a standards-based curriculum designed to “help build creativity and innovation, critical thinking and problem solving, collaboration, and communication fulfilling California’s vision that all students graduate from our public-school system as lifelong learners and have the skills and knowledge necessary to be ready to assume their position in our global economy.” ELA CCSS
Students use a variety of instructional materials in ELA to meet these instructional goals.
ELA Supplemental Instructional Materials
K-5 Nancy Fetzer Writing manual, Fetzer publisher
K-5 Benchmark Universe, digital library, Benchmark
Enterprise STAR Assessment – Lexile assessment, Renaissance Learning
Lexia personalized digital program
Math: Students receive standards-based curriculum designed to provide instruction that focuses on “concepts that are emphasized in the standards so that students can gain strong foundational conceptual understanding, a high degree of procedural skill and fluency, and the ability to apply the mathematics they know to solve problems inside and outside the mathematics classroom.” Math CCSS
Students use a variety of instructional materials in math to meet these instructional goals.
Mathematics Supplemental Instructional Materials
K-5 Math Investigations Kit, 2012 Pearson
K-5 Math Manipulatives, Nasco, Lakeshore, Good Stuff suppliers
K-5 Teaching Student Centered Math Teacher resource, Barnes and Noble
K-5 Math Journals, K-5 Math publisher
Ten Marks digital program
Dream Box personalized digital program
Science: The district has adopted the Scott Foresman California Science program for Kindergarten through fifth grade. This program is used as a resource for teaching the California science content standards. Emphasis is on physical, life, and earth science, with investigation and experimentation a central focus of instruction.
Social Studies: The district has adopted California Reflections published by Harcourt as a resource for teaching the California content standards in history-social science. The curriculum content at each grade level focuses on chronology, research evidence, point of view, and historical interpretation.
Specialized Services
Gifted and Talented Education: Richland offers a Gifted and Talented Instructional (GATE) Program for students in the fourth and fifth grade. Third-grade students, based on teacher and/or parent recommendations are administered the Naglieri Non-Verbal Ability Test. Fourth and fifth-grade students based on teacher and/or parent recommendations are given the Otis-Lennon Test. The test results as well as academic achievement, teacher input, and California Standardized Tests results determine placement.
English Learner Program: Most students not yet fluent in English are clustered in each of our classrooms at Richland. Students receive daily instruction to develop and learn English. Approximately 102 English-language Learners are enrolled at Richland.
Special Education Program: Students with moderate to severe learning difficulties can qualify for individual education plans (IEPs). Appropriate programs and services are provided to all students with disabilities, between the ages of 3 and 21. Referrals for special education identification and special education services are initiated by the on-site Student Study Team.
Quality, Currency, and Availability of Textbooks and Instructional Materials (School Year 2016-17) This table displays information about the quality, currency, and availability of the standards-aligned textbooks and other instructional materials used at the school; whether the textbooks and instructional materials are from the most recent adoption (yes/no); and information about the school’s use of any supplemental curriculum or non-adopted textbooks or instructional materials. The adoption of the resolution regarding sufficiency of instructional and supplemental instructional materials for fiscal year 2016-17 pursuant to Education Code Sections 60119, 60422(b) and 60451 was done on October 18, 2016.
Core Curriculum Area
Textbooks and Instructional Materials
Year of
Adoption
From the Most Recent Adoption (Yes or No)
Percent of Students Lacking Their Own
Assigned Copy
Reading/Language Arts K-5 Benchmark Advance Step Up to Literacy
2016 Yes 0%
Mathematics K-2 Houghton Mifflin Math Expressions 3-5 Curriculum Associates
Ready Mathematics
2008
2015
Yes
Yes
0%
0%
Science Scott Foresman Science 2009 Yes 0%
History-Social Science Harcourt California Reflections
2007 Yes 0%
SCHOOL ACCOUNTABILITY REPORT CARD

4
Richland Elementary students with special needs receive the support services they require from our four co-teaching Specialized Academic Instructors, two speech-language pathologists, one speech-language pathologist aide, one school psychologist, one part-time school counselor, and classroom instructional aides. We have a student study team, made up of teachers, a special education teacher, and a psychologist. The team makes appointments to meet with families as the need arises. They may meet because a child needs speech therapy, has a suspected learning disability, or engages in behavior that disrupts learning. We have two part-time health aides who coordinate services for all students with the district nurse assigned to our site.
Library Our library contains over 16,000 volumes. Our librarian works 7.5 hours per day and supports special classroom projects. The librarian and Parent Club host a school-wide book fair to support the library program. We acquire new books through grants, the Birthday Books Program, and Scholastic incentives, and Parent Club donations. We are excited to have been offered a generous private donation this year to expand our library program.
Homework First through fifth-grade teachers assign homework Monday through Thursday. Teachers identify specific time allotments for homework for each grade level that are aligned with Governing Board recommendations. Reading at home is an integral part of every classroom’s nightly homework program.
Technology In addition to classroom computers, Richland has a computer lab with 34 networked computers with Internet capabilities for student use as well as 11 Chrome Book carts of 36 laptops and a cart of 36 iPads. We currently have 4 third and fourth grade classroom in their second year of the District’s inquiry based learning vision with 1:1 technology and 5 more teachers in their inaugural year of the program. Our students utilize the internet to support their classroom instruction. We are proud to say we have enough technology to support the entire school at a 2:1 ration and we are continuing to acquire more software and hardware for students at all grade levels.
School Facilities
School Facility Conditions and Planned Improvements The physical quality of our school building influences learning and teaching. Our school includes 41 classrooms, library, computer lab, and staff room. Richland opened in 1960 and provides a quality education for approximately 845 students. All permanent classrooms, the library, computer lab, office, and cafeteria have recently received modernization of the technology infrastructure. Now all classes have up to date state-of-the-art phone and internet connectivity and are currently undergoing an AV refresh scheduled to be completed by December 2016. Regularly scheduled maintenance is done to keep our school building and grounds in excellent working condition.
Cleaning Process and Schedule The district governing board has adopted cleaning standards for all schools in the district. A summary of these standards is available at the school office and at the district office. The principal works daily with the custodial staff to develop cleaning schedules to ensure a clean and safe school.
School Facility Good Repair Status (School Year 2016-17) To determine the condition of our facilities, our district sends experts from our facilities team to inspect them. They use a survey, called the Facilities Inspection Tool, issued by the Office of Public School Construction. Based on that survey, we’ve answered the questions you see on this report. Please note that the information reflects the condition of our buildings as of the date of the report. Since that time, those conditions may have changed. The inspection took place on June 20, 2016.
System Inspected
Repair Status Repair Needed and Action Taken or Planned
Good Fair Poor
Systems: Gas Leaks, Mechanical/HVAC, Sewer X No repairs needed at the time of inspection.
Interior: Interior Surfaces X One classroom-Stained ceiling tile.
Cleanliness: Overall Cleanliness, Pest/ Vermin Infestation X No repairs needed at the time of inspection.
Electrical: Electrical X One classroom-Lights out..
Restrooms/Fountains: Restrooms, Sinks/ Fountains X No repairs needed at the time of inspection..
Safety: Fire Safety, Hazardous Materials X No repairs needed at the time of inspection.
Structural: Structural Damage, Roofs X No repairs needed at the time of inspection.
External: Playground/School Grounds, Windows/ Doors/Gates/Fences
X No repairs needed at the time of inspection.
Exemplary Good Fair Poor Overall Rating
99%
SCHOOL ACCOUNTABILITY REPORT CARD

5
Maintenance and Repair District maintenance staff ensures that the repairs necessary to keep the school in good repair and working order are completed in a timely manner. A work order process is used to ensure efficient service and that emergency repairs are given the highest priority.
Pupil Outcomes:
State Priority: Pupil Achievement The SARC provides the following information relevant to the State priority: Pupil Achievement (Priority 4):
Statewide assessments (i.e., California Assessment of Student Performance and Progress [CAASPP], Science California Standards Tests); and
The percentage of pupils who have successfully completed courses that satisfy the requirements for entrance to the University of California and the California State University, or career technical education sequences or programs of study.
California Assessment of Student Performance & Progress Results for all Students For the two-year period (2014-15 and 2015-16), this section includes the school, LEA, and state information on the percent of students meeting or exceeding the State standards on the California Assessment of Student Performance and Progress (CAASPP) Smarter Balanced Summative Assessments for English Language Arts (ELA)/literacy and mathematics for grades three through eight and grade eleven.
The source of the data is the CAASPP test results, including results from the Smarter Balanced Summative Assessments for ELA/literacy in grades three through eight and grade eleven.
Detailed information regarding the CAASPP ELA and mathematics results for each grade and achievement level can be found on the CDE CAASPP Results Web page at http://caaspp.cde.ca.gov/.
Note: Percentages are not calculated when the number of students tested is ten or less, either because the number of students in this category is too small for statistical accuracy or to protect student privacy.
CAASPP Assessment Results by Student Group For the SARC reporting year (2015-16) testing period, the percent of students by student group, total enrollment, number tested, percent tested, and achievement levels in CAASPP ELA, grades three through eight, and eleven.
Socioeconomically Disadvantaged students are defined as students: (1) who are eligible for the FRPM program (also known as the National School Lunch Program or NSLP), or have a direct certification for FRPMs, or (2) who are migrant, homeless, or foster youth, or (3) where neither of the parents were a high school graduate.
SCHOOL ACCOUNTABILITY REPORT CARD
Subject
Percent of Students Scoring at Proficient or Advanced (meeting or exceeding the state standards)
2014-15 2015-16
School District State School District State
ELA/Literacy 48% 60% 44% 61% 65% 48%
Mathematics 43% 46% 33% 59% 50% 36%
CAASPP Assessment Results-English Language Arts (ELA) Disaggregated by Student Groups, Grades 3-5—(2015-16)
ELA—Grade 3
Note: The number of students tested includes all students who participated in the test whether they received a score or not; however, the number of students tested is not the number that was used to calculate the achievement level percentages. The achievement level percentages are calculated using only students who received scores. Double dashes (--) appear in the table when the number of students is ten or less, either because the number of students in this category is too small for statistical accu-racy or to protect student privacy.
Student Groups Total Enrollment Number Tested Percent Tested
Percent Met or Exceeded
All Students 136 131 96.30% 59.50%
Male 70 67 95.70% 59.70%
Female 66 64 97.00% 59.40%
Black or African American -- -- -- --
American Indian or Alaska Native -- -- -- --
Asian -- -- -- --
Filipino -- -- -- --
Hispanic or Latino 70 66 94.30% 47.00%
Native Hawaiian or Pacific Islander -- -- -- --
White 58 57 98.30% 73.70%
Two or More Races -- -- -- --
Socioeconomically Disadvantaged 61 59 96.70% 42.40%
English Learners 30 30 100.00% 30.00%
Students with Disabilities 19 17 89.50% 23.50%
Students Receiving Migrant Education Services -- -- -- --
Foster Youth -- -- -- --

6
CAASPP Assessment Results-English Language Arts (ELA) Disaggregated by Student Groups, Grades 3-5 (School Year 2015-16)
ELA—Grade 4
ELA—Grade 5
SCHOOL ACCOUNTABILITY REPORT CARD
Student Groups Total Enrollment Number Tested Percent Tested
Percent Met or Exceeded
All Students 155 152 98.10% 64.50%
Male 90 89 98.90% 62.90%
Female 65 63 96.90% 66.70%
Black or African American -- -- -- --
American Indian or Alaska Native -- -- -- --
Asian -- -- -- --
Filipino -- -- -- --
Hispanic or Latino 57 56 98.30% 53.60%
Native Hawaiian or Pacific Islander -- -- -- --
White 74 73 98.70% 67.10%
Two or More Races -- -- -- --
Socioeconomically Disadvantaged 54 54 100.00% 44.40%
English Learners 16 15 93.80% --
Students with Disabilities 18 18 100.00% 22.20%
Students Receiving Migrant Education Services -- -- -- --
Foster Youth -- -- -- --
Student Groups Total Enrollment Number Tested Percent Tested
Percent Met or Exceeded
All Students 134 128 95.50% 57.80%
Male 71 67 94.40% 53.70%
Female 63 61 96.80% 62.30%
Black or African American -- -- -- --
American Indian or Alaska Native -- -- -- --
Asian -- -- -- --
Filipino -- -- -- --
Hispanic or Latino 57 55 96.50% 49.10%
Native Hawaiian or Pacific Islander -- -- -- --
White 62 60 96.80% 65.00%
Two or More Races -- -- -- --
Socioeconomically Disadvantaged 55 54 98.20% 38.90%
English Learners 21 20 95.20% 25.00%
Students with Disabilities 18 18 100.00% 22.20%
Students Receiving Migrant Education Services -- -- -- --
Foster Youth -- -- -- --
Note: ELA test results include the Smarter Balanced Summative Assessment and the CAA. The “Percent Met or Exceeded” is calculated by taking the total number of students who met or exceeded the standard on the Smarter Balanced Summative Assessment plus the total number of students who met the standard on the CAAs divided by the total number of students who participated in both assessments.
Double dashes (--) appear in the table when the number of students is ten or less, either because the number of students in this category is too small for statistical accuracy or to protect student privacy.
Note: The number of students tested includes all students who participated in the test whether they received a score or not; however, the number of students tested is not the number that was used to calculate the achievement level percentages. The achievement level percentages are calculated using only students who received scores.

7
CAASPP Assessment Results-ELA and Mathematics Disaggregated by Student Groups, Grades 3-5 (School Year 2015-16)
Mathematics—Grade 3
Mathematics—Grade 4
SCHOOL ACCOUNTABILITY REPORT CARD
Student Groups Total Enrollment Number Tested Percent Tested
Percent Met or Exceeded
All Students 136 132 97.10% 62.10%
Male 70 68 97.10% 61.80%
Female 66 64 97.00% 62.50%
Black or African American -- -- -- --
American Indian or Alaska Native -- -- -- --
Asian -- -- -- --
Filipino -- -- -- --
Hispanic or Latino 70 67 95.70% 55.20%
Native Hawaiian or Pacific Islander -- -- -- --
White 58 57 98.30% 71.90%
Two or More Races -- -- -- --
Socioeconomically Disadvantaged 61 60 98.40% 41.70%
English Learners 30 30 100.00% 40.00%
Students with Disabilities 19 18 94.70% 16.70%
Students Receiving Migrant Education Services -- -- -- --
Foster Youth -- -- -- --
Student Groups Total Enrollment Number Tested Percent Tested
Percent Met or Exceeded
All Students 155 152 98.10% 63.80%
Male 90 89 98.90% 66.30%
Female 65 63 96.90% 60.30%
Black or African American -- -- -- --
American Indian or Alaska Native -- -- -- --
Asian -- -- -- --
Filipino -- -- -- --
Hispanic or Latino 57 56 98.30% 51.80%
Native Hawaiian or Pacific Islander -- -- -- --
White 74 73 98.70% 67.10%
Two or More Races -- -- -- --
Socioeconomically Disadvantaged 54 54 100.00% 44.40%
English Learners 16 15 93.80% 13.30%
Students with Disabilities 18 18 100.00% 22.20%
Students Receiving Migrant Education Services -- -- -- --
Foster Youth -- -- -- --
Note: ELA & Mathematics test results include the Smarter Balanced Summative Assessment and the CAA. The “Percent Met or Exceeded” is calculated by taking the total number of students who met or exceeded the standard on the Smarter Balanced Summative Assessment plus the total number of students who met the standard on the CAAs divided by the total number of students who participated in both assessments.
Double dashes (--) appear in the table when the number of students is ten or less, either because the number of students in this category is too small for statistical accuracy or to protect student privacy.
Note: The number of students tested includes all students who participated in the test whether they received a score or not; however, the number of students tested is not the number that was used to calculate the achievement level percentages. The achievement level percentages are calculated using only students who received scores.

8
CAASPP Assessment Results-Mathematics Disaggregated by Student Groups, Grades 3-5 (School Year 2015-16)
Mathematics—Grade 5
Note: Mathematics test results include the Smarter Balanced Summative Assessment and the CAA. The “Percent Met or Exceeded” is calculated by taking the total number of students who met or exceeded the standard on the Smarter Balanced Summative Assessment plus the total number of students who met the standard on the CAAs divided by the total number of students who participated in both assessments.
Double dashes (--) appear in the table when the number of students is ten or less, either because the number of students in this category is too small for statistical accuracy or to protect student privacy.
Note: The number of students tested includes all students who participated in the test whether they received a score or not; however, the number of students tested is not the number that was used to calculate the achievement level percentages. The achievement level percentages are calculated using only students who received scores.
SCHOOL ACCOUNTABILITY REPORT CARD
Student Groups Total Enrollment Number Tested Percent Tested
Percent Met or Exceeded
All Students 134 128 95.50% 49.20%
Male 71 67 94.40% 55.20%
Female 63 61 96.80% 42.60%
Black or African American -- -- -- --
American Indian or Alaska Native -- -- -- --
Asian -- -- -- --
Filipino -- -- -- --
Hispanic or Latino 57 55 96.50% 36.40%
Native Hawaiian or Pacific Islander -- -- -- --
White 62 60 96.80% 61.70%
Two or More Races -- -- -- --
Socioeconomically Disadvantaged 55 54 98.20% 35.20%
English Learners 21 20 95.20% 10.00%
Students with Disabilities 18 18 100.00% 22.20%
Students Receiving Migrant Education Services -- -- -- --
Foster Youth -- -- -- --
CAASPP Test Results in Science by Student Group Grade Five (School Year 2015–16)
Note: Science test results include CSTs, CMA, and CAPA in grades five, eight, and ten. The “Proficient or Advanced” is calculated by taking the total number of students who scored at Proficient or Advanced on the science assessment divided by the total number of students with valid scores.
Note: Scores are not shown when the number of students tested is ten or less, either because the number of students in this category is too small for statistical accuracy or to protect student privacy.
Student Groups Total Enrollment Number Tested Percent Tested
Percent Met or Exceeded
All Students 134 128 95.50% 68.00%
Male 71 67 94.40% 73.10%
Female 63 61 96.80% 62.30%
Black or African American -- -- -- --
American Indian or Alaska Native 0 0 0.00% 0.00%
Asian -- -- -- --
Filipino -- -- -- --
Hispanic or Latino 57 55 96.50% 52.70%
Native Hawaiian or Pacific Islander -- -- -- --
White 62 60 96.80% 81.70%
Two or More Races -- -- -- --
Socioeconomically Disadvantaged 55 54 98.20% 48.20%
English Learners 21 20 95.20% 35.00%
Students with Disabilities 18 18 100.00% 66.70%
Students Receiving Migrant Education Services -- -- -- --
Foster Youth -- -- -- --

9
State Priority: School Climate:
Suspensions and Expulsions This table displays the rate of suspensions and expulsions (the total number of incidents divided by the total enrollment) at the school and district levels for the most recent three-year period.
Discipline Richland has a school-wide discipline program that we communicate to all parents the first month of school. This year our staff taught specific positive behaviors through PBIS and a proactive behavior program called “What a Leader Does.” The program focuses on teaching positive behaviors to promote a safe and productive learning environment. We hold bimonthly awards assemblies to recognize students for displaying positive behaviors by living “The Mustang Way.” At the end of the month, students are selected in each classroom as “Students of the Month” based on one “The 7 Habits of Happy Kids”, written by the Sean Covey based on the late Stephen Covey’s 7 Habits of Highly Effective People.
We believe that students are responsible for their behavior and that disruptive students impact the learning environment. However, it is often not productive to bar students from attending school. We have an in-school suspension policy under which students still come to school, speak to an administrator, and keep up with their studies in the office. The SMUSD suspension policy governs when students must be suspended from school and parents must conference with an administrator.
California Standards Tests for All Students in Science—Three-Year Comparison The most recent three years (2013–14, 2014–15, and 2015-16) of school, LEA, and state information on the percent of students scoring at proficient or advanced on the California Standards
Test (CST) for Science for grades five, eight, and ten.
The assessments under the CAASPP show how well students are doing in relation to the state-adopted content standards. On each of these assessments, student aggregate scores are reported as achievement levels.
More information about the CAASPP system can be found on the CDE CAASPP System Web page at http://www.cde.ca.gov/ta/tg/ca/.
Note: Scores are not shown when the number of students tested is ten or less, either because the number of students in this category is too small for statistical accuracy or to protect student privacy.
Other Pupil Outcomes:
California Physical Fitness Test Results (2015-16) The California Physical Fitness Test (PFT) is administered to students in grades five, seven, and nine only. This table displays by grade level the percent of students meeting the fitness standards for the most recent testing period. For detailed information regarding this test, and comparisons of a school’s test results to the district and state, see the CDE PFT web page.
Engagement:
State Priority: Parental Involvement Contacts: Nicole Trottier, FOR Club President Phone Number: (760) 290-2400 ext. 2405 Richland is well known in San Diego County for its outstanding parent participation and leadership. Parents are members of our School Site Council, which oversees Richland’s School Safety Plan and Single Plan for Student Achievement. Parents also may serve on the English Language Learner Advisory Committee, which oversees the instructional program for English Language Learners. Our Parent Organization, FOR Club (Friends of Richland), includes all parents in our school and is governed by an elected board and is financial support for our STEAM, Music, and Art docent program. Additionally, a Richland Alumni organization provides financial support for Richland. New members are always welcome to all organizations. Classroom volunteers are an integral and valued part of the school program.
Percent of Students Meeting Fitness Standards (on all six fitness standards) Grade
Level Four of Six Five of Six Six of Six
5 18.5% 20.8% 37.7%
School
2013-14 2014-15 2015-16
Suspensions 0.2% 0.3% 0.4%
Expulsions 0.0% 0.0% 0.0%
District
Suspensions 1.5% 1.3% 1.5%
Expulsions 0.1% 0.1% 0.1%
State
Suspensions 4.4% 3.8% 3.7%
Expulsions 0.1% 0.1% 0.1%
SCHOOL ACCOUNTABILITY REPORT CARD
Subject School District State
2014 2015 2016 2014 2015 2016 2014 2015 2016
Science 71% 70% 68% 73% 68% 65% 60% 56% 54%

10
School Safety
SB187 Safety Plan Date the plan was last updated: September 2016 Date the plan was last reviewed with staff: September 2016 The Comprehensive Safe School Plan includes data regarding crime, safe school procedures and compliance with laws including: (1) child abuse reporting, (2) disaster response, (3) suspension and expulsion policies, (4) notification of teachers of dangerous pupils, (5) sexual harassment, (6) schoolwide dress codes prohibiting gang-related apparel, (7) procedures for safe ingress and egress from school, (8) procedures to ensure a safe and orderly environment conducive to learning, (9) rules and procedures on school discipline adopted pursuant to Ed Code Sections 35291 and 35291.5, and (10) lock down procedures. A copy of the plan is available for inspection by the public at each school.
The staff monitors school grounds 30 minutes before the start of school and immediately after dismissal. We have crossing guards to help children cross the streets near our school every morning and afternoon. We also hold monthly fire and disaster drills for all students. We ask parents to have children return home immediately after school. Additionally, Richland Elementary, along with all elementary schools in San Marcos, have implemented a closed campus before, during and after school. We have implemented a visitor tracking system (Ident-i-kid) to check visitors name with State Database to ensure all adults on campus are legally permitted.
Teachers work with individual students and may hold classroom meetings to discuss conflicts between students as needed. A part-time district counselor works with at-risk students with social skills and conflict resolution. With Richland’s full-time PE program, we have implemented a Playground Partners program to enhance school safety and participation in organized games further.
Student Progress Teachers in each grade level evaluate what students learn through common district assessments, curriculum unit summative, project-based evaluations, and teacher observation.
Last year, SMUSD moved to a semester system; there are two report card periods each school year parents are encouraged to attend a parent-teacher conference midway through the first reporting period.
Other SARC Information:
Federal Intervention Program (2016-17)
*The percent of schools currently in PI is calculated by taking the number of schools currently in PI in the District and divide that by the total number of Title I schools in the District.
Average Class Size and Class Size Distribution (Elementary) The average class size is calculated by dividing the number of students enrolled in classes, excluding special education and a few other minor categories, divided by the number of classes. The following table provides three years of data.
*Number of classes indicates how many classes fall into each size category (a range of total students per class).
Grade Level
2013-14 2014-15 2015-16
Avg. Class Size
Number of Classes* Avg. Class Size
Number of Classes* Avg. Class Size
Number of Classes*
1-22 23-32 33+ 1-22 23-32 33+ 1-22 23-32 33+
Kindergarten 23.0 2 2 2 25.0 1 4 1 26.0 5
Grade 1 28.0 4 25.0 5 23.0 5
Grade 2 23.0 1 4 27.0 4 25.0 5
Grade 3 32.0 3 1 26.0 1 5 26.0 5
Grade 4 35.0 4 29.0 4 30.0 5
Grade 5 24.0 2 4 26.0 2 1 4 32.0 1 3
Other 28.0 1 26.0 1 0.0
School District
Program Improvement (PI) Status In PI In PI
First Year of PI Implementation 2012-2013 2013-14
Year in PI Year 2 Year 1
Number of Schools Currently in PI 7
77.8% Percent of Schools Currently in PI*
SCHOOL ACCOUNTABILITY REPORT CARD

11
Academic Counselors and Other Support Staff The following table provides the number of full-time equivalent qualified support personnel who provide counseling and other pupil support services in our school. These specialists often work part-time at our school and some may work at more than one school.
* One Full-Time Equivalent (FTE) equals one staff member working full-time; one FTE could also represent two staff members who each work 50 percent of full-time.
School Finances
Expenditures Per Pupil and School Site Teacher Salaries (Fiscal Year 2014-15)
Restricted source means money whose use is restricted by legal requirement or by the donor. Examples include, but are not limited to, instructional materials, economic impact aid, and teacher and principal training funds.
Unrestricted source means money that can be used for any lawful purpose, whose use is not restricted by legal requirement or by the donor. Examples include, but are not limited to, class size reduction, state lottery (not the instructional materials portion), and undesignated local parcel tax funds.
The CDE’s calculation is based on EC Section 41372 definitions (see the CDE Current Expense of Education & Per-pupil Spending Web page at http://www.cde.ca.gov/ds/fd/ec/, modified to include only unrestricted sources in the calculation.
For more information, see the CDE Certificated Salaries & Benefits Web page at http://www.cde.ca.gov/ds/fd/cs/. To look up expenditures and salaries for a specific school district, see the Ed-Data Web site at http://www.ed-data.org.
Other Funding (Fiscal Year 2015-16) Funding is provided for the following special programs to supplement the core instructional program provided by the school district.
GATE
Teacher Credential Block Grant
Professional Development Block Grant
English Language Acquisition Program
Lottery Instructional Materials
Title I
Title III Immigrant
Title III LEP
Barona Education Grant
Teacher & Administrative Salaries (Fiscal Year 2014-15) This table displays district-level salary information for teachers, principals, and the superintendent, and compares these figures to the state averages for districts of the same type and size. The table also displays teacher and administrative salaries as a percent of a district's budget, and compares these figures to the state averages for districts of the same type and size. Detailed information regarding salaries may be found at http://www.cde.ca.gov/ds/fd/cs/.
Professional Development San Marcos Unified School District is committed to the belief that the strongest predictor of student achievement is the quality of the teacher inside the classroom. In support of this belief, SMUSD is deeply committed to teacher learning and professional development as evidenced by our district mission statement.
San Marcos Unified School District’s Mission Statement includes these commitments:
“hiring and retaining only the best educators and investing in their success.”
“providing quality education based on high standards, effective practices, continuous improvement, and innovation.”
Category
District Amount
State Average for Districts in Same
Category
Beginning Teacher Salary $35,607 $44,958
Mid-Range Teacher Salary $71,212 $70,581
Highest Teacher Salary $90,019 $91,469
Average Principal Salary (ES) $114,229 $113,994
Average Principal Salary (MS) $121,336 $120,075
Average Principal Salary (HS) $134,104 $130,249
Superintendent Salary $302,922 $218,315
Percent of District Budget
Teacher Salaries 38% 38%
Administrative Salaries 5% 5%
Title Number of FTEs* Assigned to the School
TOSA Intervention Support Teacher 2.88
Psychologist 1.00
Social Worker 0.50
Nurse 0.30
Speech/Language/Hearing Specialist 2.00
Expenditures Per Pupil Average Teacher Salary Level Total Restricted Unrestricted
School $7,025 $2,011 $5,014 $71,181
District $5,596 $66,338
State $5,348 $71,529
Percent Difference: School/District (24.6%) 3.2%
Percent Difference: School/State (13.2%) (4.3%)
SCHOOL ACCOUNTABILITY REPORT CARD

12
Every new teacher and administrator in our district engage in a rigorous two-year training program where they receive a minimum of 30 hours of professional development on our research-based instructional framework, the Essential Elements of Instruction (EEI). These instructional strategies are applicable to any curricular area and any grade level.
The district has focused on three priorities over the past several years: standards-based instruction, effective instructional strategies, and professional collaboration. During the 2016-17 school year, San Marcos Unified School District Professional Development continued to focus on instructional practices that support students in meeting the expectations of the state standards for literacy and mathematics. The increase in the use of devices and digital curriculum to support the implementation of the new standards has required increased professional development for teachers to confidently and effectively use these tools.
A wide variety of opportunities for professional learning were offered during the regular work day, during school breaks and after school. Principals provided staff development during regularly scheduled staff meetings throughout the year. In addition, professional development continued in the use of effective strategies for making content understandable, particularly for English language learners. Teachers who work with students with special needs engaged in ongoing collaboration to implement more inclusive delivery models.
Teachers continued to engage in professional development each week as they worked collaboratively during their structured teacher collaboration time (early release Wednesdays). This provided teachers the opportunity to share best practices to meet students’ needs. Teachers on Special Assignment (TOSAs) provide professional development and work with teachers in their classrooms modeling strategies, planning collaboratively, and providing support.
SCHOOL ACCOUNTABILITY REPORT CARD
About the SARC By February 1 of each year, every school in California is required by state law to publish a School Accountability Report Card (SARC). The SARC contains information about the condition and performance of each California public school. Under the Local Control Funding Formula (LCFF) all local educational agencies (LEAs) are required to prepare a Local Control Accountability Plan (LCAP), which describes how they intend to meet annual school-specific goals for all pupils, with specific activities to address state and local priorities. Additionally, data reported in an LCAP is to be consistent with data reported in the SARC.
For more information about SARC requirements, see the California Department of Education (CDE) SARC Web page at http://www.cde.ca.gov/ta/ac/sa/.
For more information about the LCFF or LCAP, see the CDE LCFF Web page at http://www.cde.ca.gov/fg/aa/lc/.
For additional information about the school, parents/guardians and community members should contact the school or the district office.
DataQuest DataQuest is an online data tool located on the CDE DataQuest Web page at http://dq.cde.ca.gov/dataquest/ that contains additional information about this school and comparisons of the school to the district and the county. Specifically, DataQuest is a dynamic system that provides reports for accountability (e.g., test data, enrollment, high school graduates, dropouts, course enrollments, staffing, and data regarding English learners).
Internet Access Internet access is available at public libraries and other locations that are publicly accessible (e.g., the California State Library). Access to the Internet at libraries and public locations is generally provided on a first-come, first-served basis. Other use restrictions may include the hours of operation, the length of time that a workstation may be used (depending on availability), the types of software programs available on a workstation, and the ability to print documents.